


Waterfall Column Chart PowerPoint Template


- Version
- Download 18
- File Size 0.00 KB
- File Count 1
- Create Date June 29, 2023
- Last Updated April 22, 2024
Waterfall Column Chart PowerPoint Template
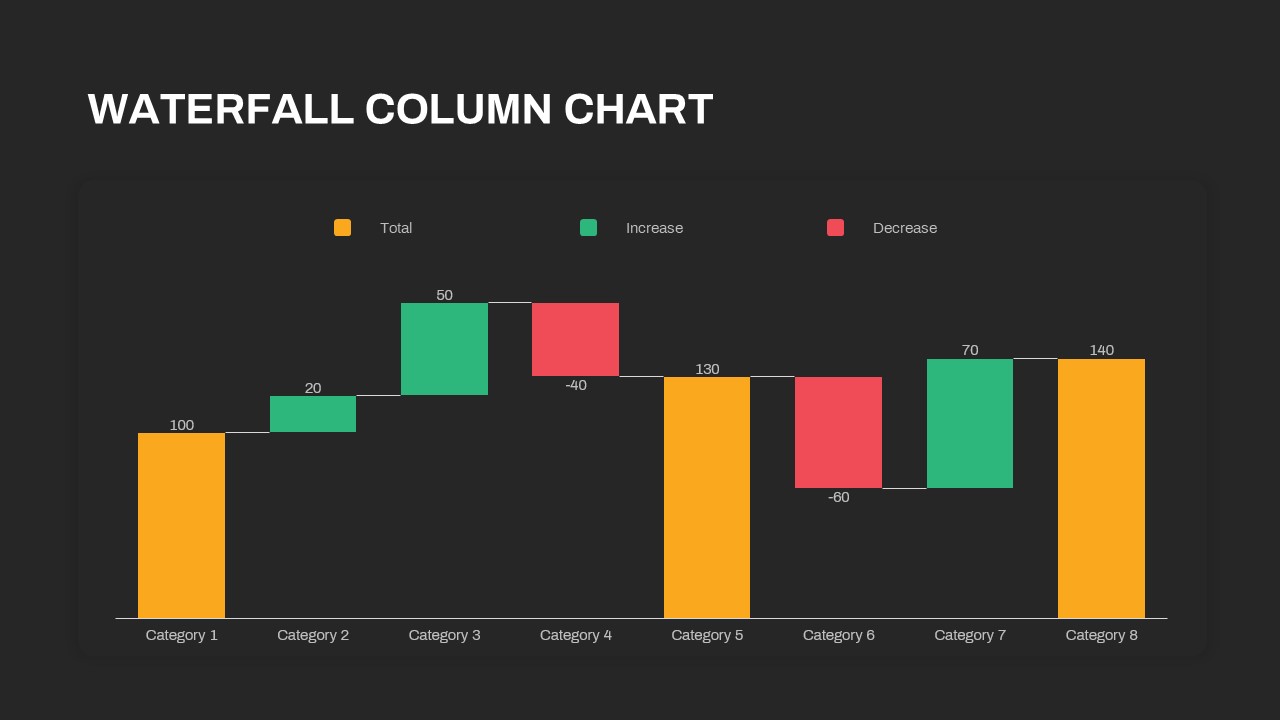
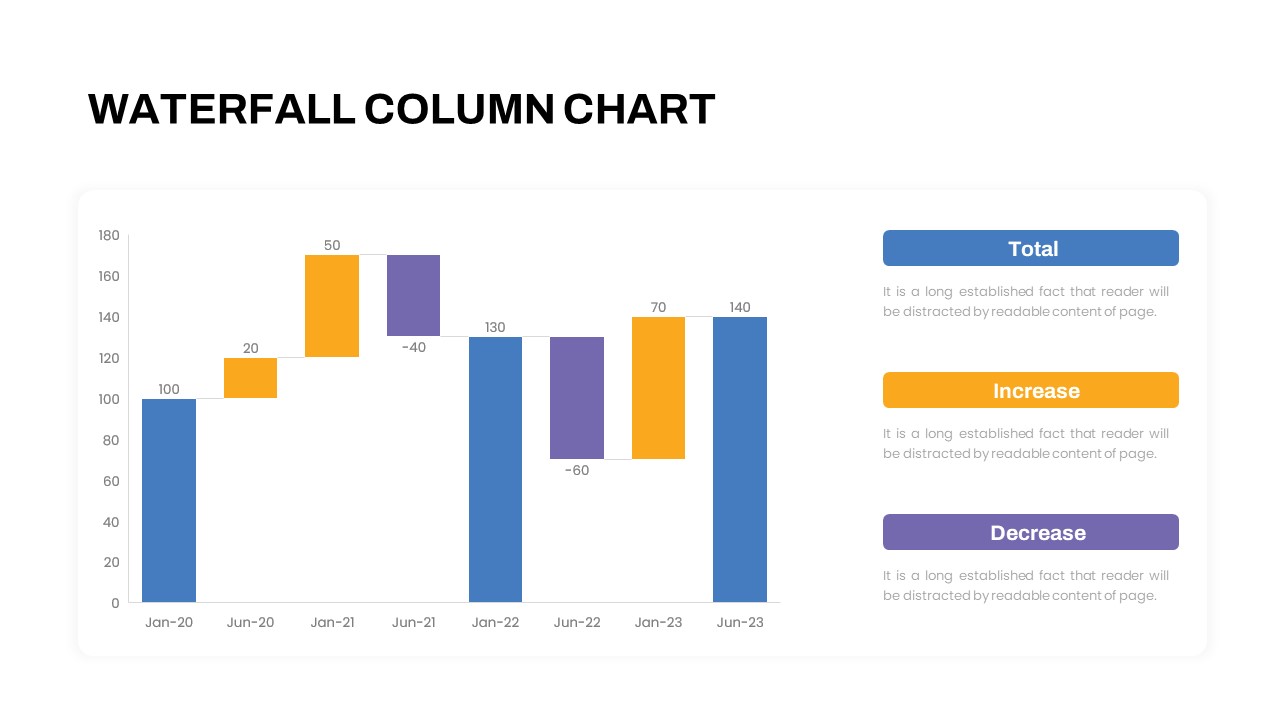
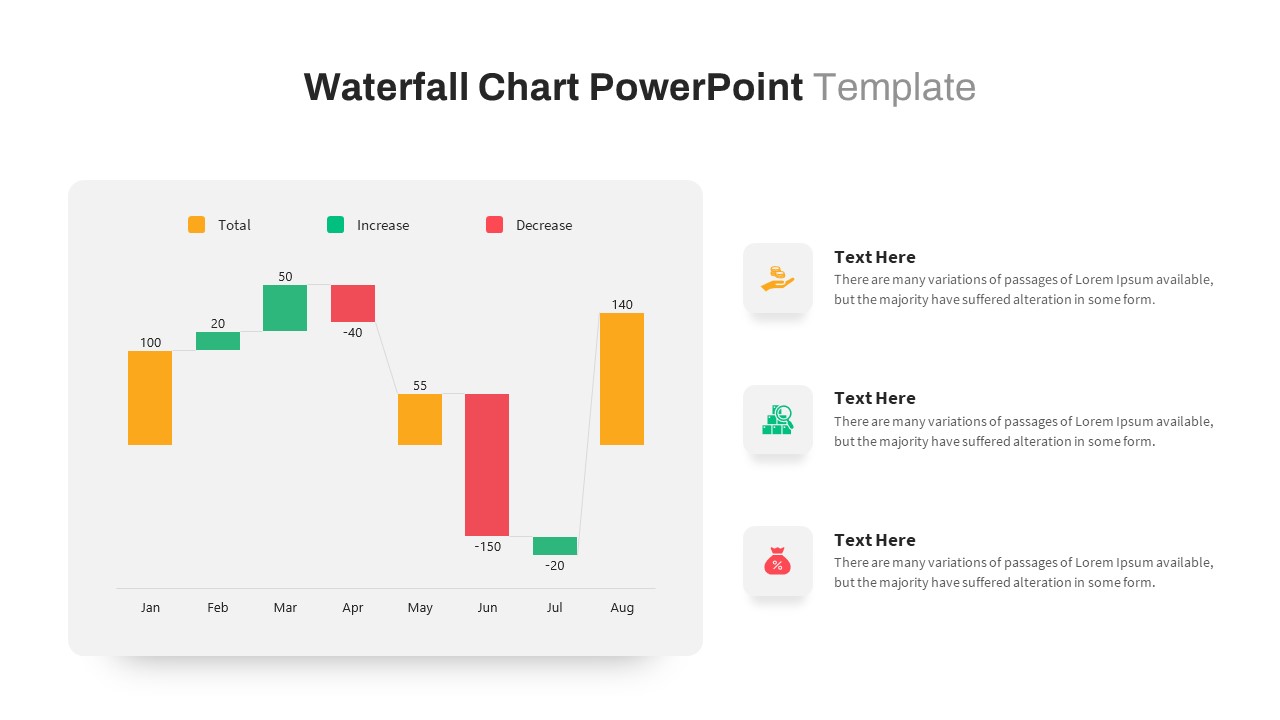
The Waterfall Column Chart PowerPoint Template is a valuable resource for creating statistical presentations using the waterfall chart format. This type of PowerPoint chart effectively illustrates the cumulative effect of adding or subtracting values over a period of time. The ppt chart provides a clear understanding of the overall impact by displaying an initial value, such as net income, and demonstrating its transformation through a series of positive and negative values. The columns in the chart are colour-coded, allowing for easy differentiation between positive and negative numbers. For example, in this bar chart, the yellow column represents the total, the green column represents the increase, and the red column represents the decrease in value.
The Waterfall Column Chart PPT Template is versatile for various presentations. Its unique design and pattern resemble candlestick charts used in stock market analysis. This makes it an ideal tool for stock market professionals and technical analysts who can utilize the waterfall chart as a candlestick PowerPoint chart. By making changes to the yellow colour and moving elements to desired positions, the template can be customized to create a perfect candlestick representation. This flexibility allows users to effectively communicate stock market trends and movements in their presentations, making it a valuable tool for financial presentations.
The waterfall column chart PowerPoint template contains eight categories with a simple bar chart PowerPoint. It shows many values according to the height of the diagram. The columns are created with a traditional stacked columns chart, enabling every user to edit this chart through Excel values. This chart is also known as the Mario chart or flying bricks chart. The users can opt white or black PowerPoint background for their data-driven presentation. Besides, the presenters can add their own data on the column chart, change the colours of the bars, resize the entire template, including the height of the bar, and use another font for their PowerPoint presentation. Download editable graphs, charts, and diagrams according to your data set.
Attached Files
| File |
|---|
| https://premiumdownloads.s3.amazonaws.com/SB03605-Waterfall Column Chart PowerPoint Template.ZIP |
Login to download this file
Add to favorites
Add to collection
-

Item ID
SB03605 -

Related Templates
-
Waterfall Chart PowerPoint Template
PowerPoint Charts
Premium
-

Sales Deck Free PowerPoint Template
PowerPoint Templates
Free
-

Nature PowerPoint Presentation Template
PowerPoint Business Templates
Premium
-

Free Vertical PowerPoint Template
PowerPoint Business Templates
Free
-

Free Stock Market PowerPoint Template
PowerPoint Templates
Free
-
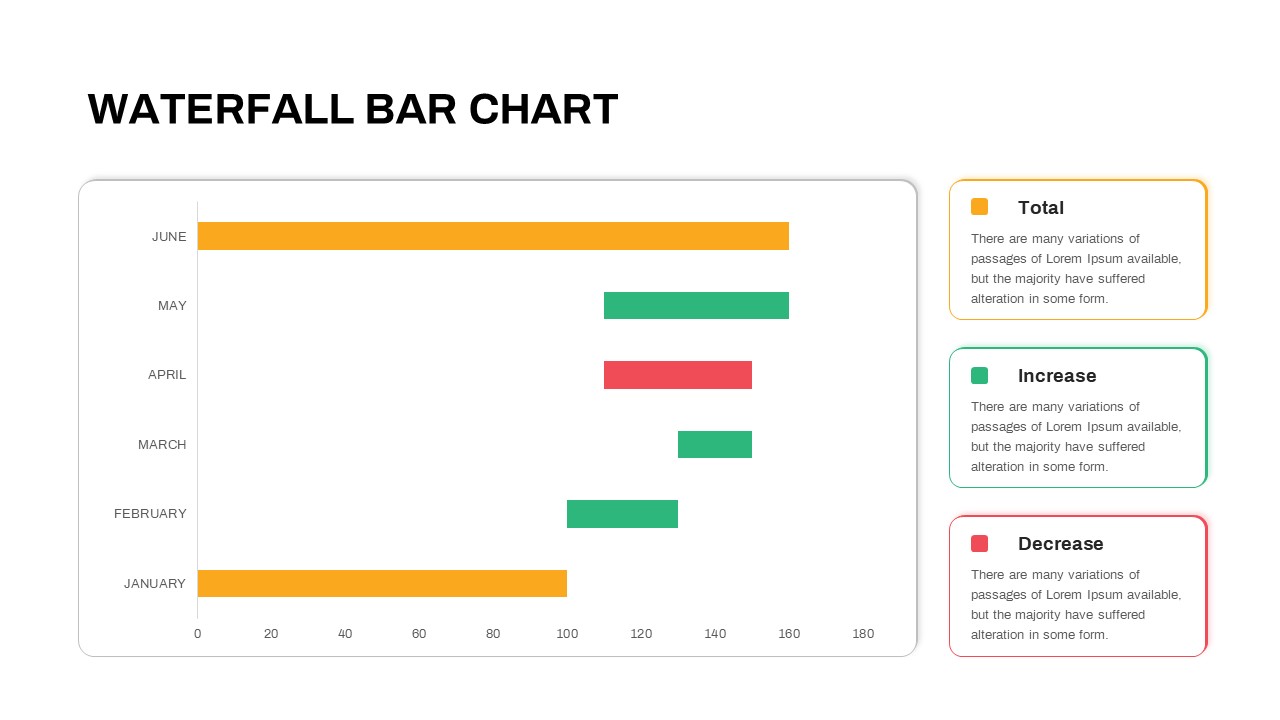
Waterfall Bar Chart PowerPoint Template
PowerPoint Charts
Premium
-

Cab Service PowerPoint Template
PowerPoint Templates
Premium
-

Research Proposal PowerPoint Template
PowerPoint Templates
Premium
-

Free Nursing Capstone PowerPoint Deck
PowerPoint Templates
Free
-

Gym PowerPoint Template
PowerPoint Templates
Premium
-

Free Space Minimal Deck Template
PowerPoint Templates
Free
-

VET Clinic PowerPoint Template
PowerPoint Templates
Premium
-

Travel Agency PowerPoint Template
PowerPoint Templates
Premium
-

Free Physical Education PowerPoint Template Deck
Free PowerPoint Templates
Free
-

IoT Presentation Template
PowerPoint Templates
Premium
-

Effective Communication PowerPoint Template
PowerPoint Templates
Premium
-
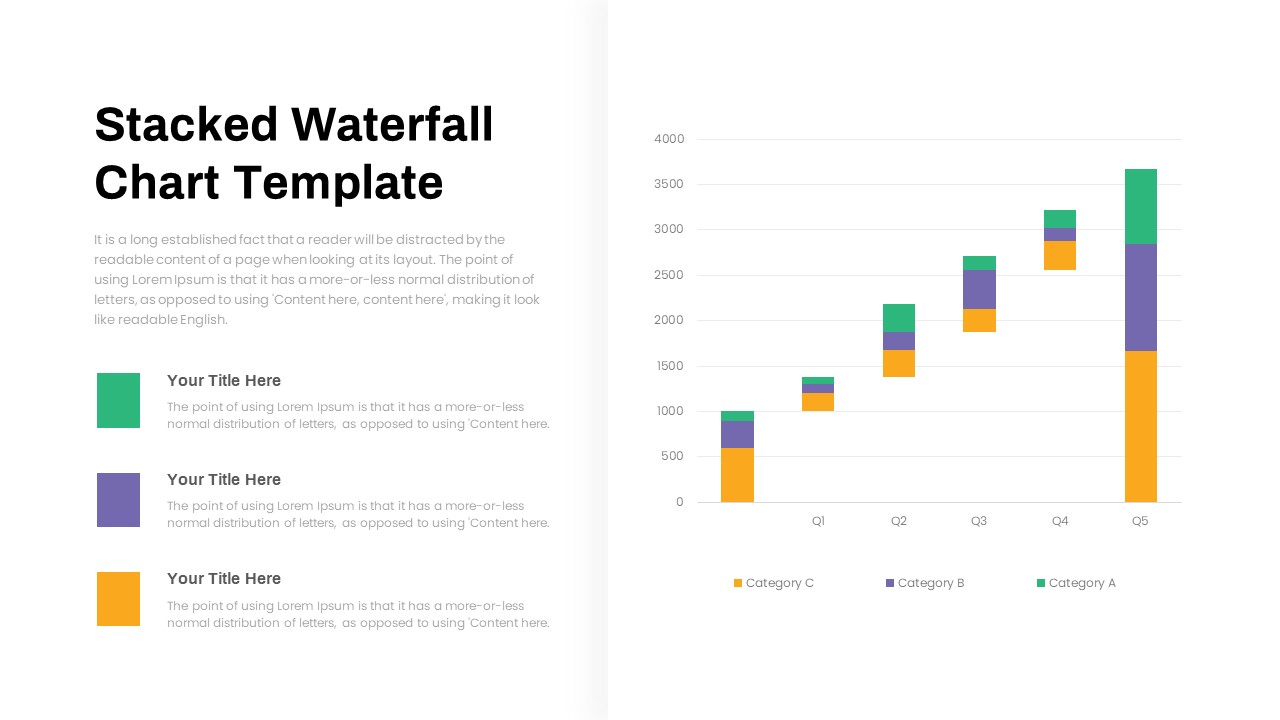
Stacked Waterfall Chart PowerPoint Template
PowerPoint Templates
Premium
-

PowerPoint Quiz With Timer
PowerPoint Templates
Premium
-
Stock Market Template
Infographic
Premium
-

Free Economics PowerPoint Template
Free PowerPoint Templates
Free
-

Macroeconomics PowerPoint Template
PowerPoint Templates
Premium
-

Free Aviation PowerPoint Template
Free PowerPoint Templates
Free
-

Graph Paper PowerPoint Template Deck
PowerPoint Templates
Premium
-

Free Charity PowerPoint Template Deck
PowerPoint Templates
Free
-

Customer Experience Loyalty PowerPoint Deck Template
PowerPoint Templates
Premium
-
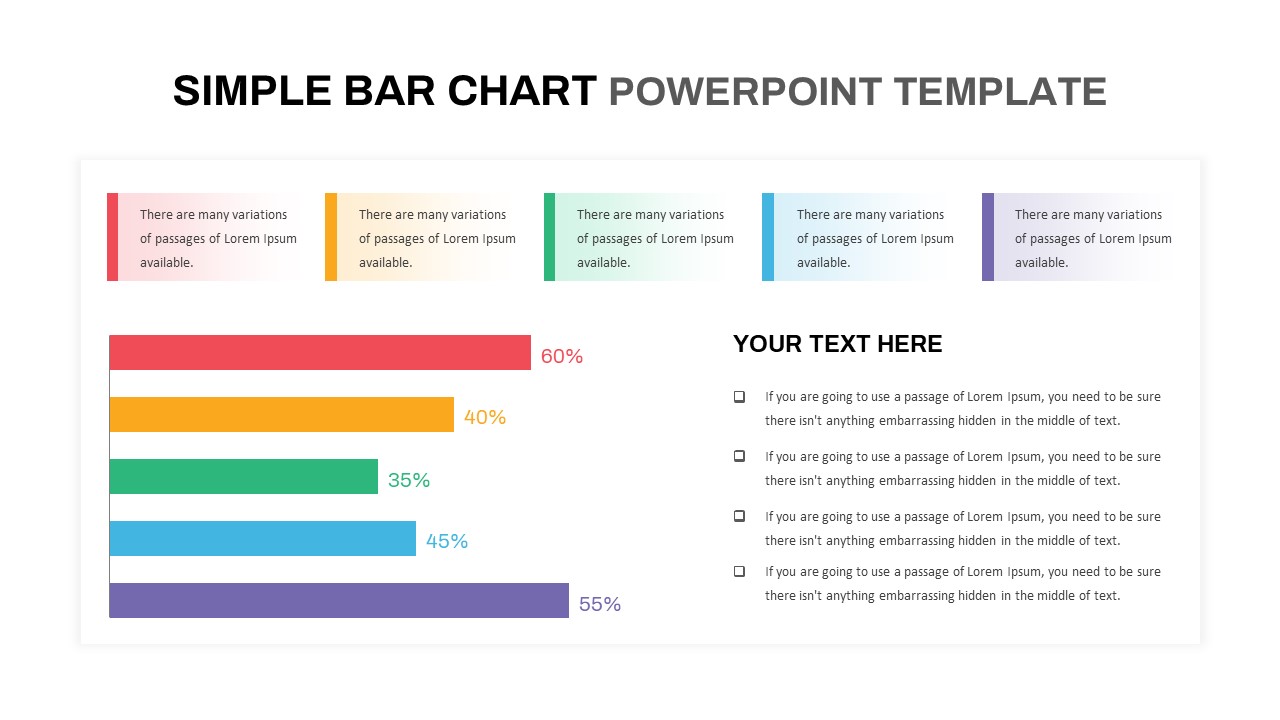
Simple Bar Chart PowerPoint Template
Column and Bar chart
Premium
-

Free Army PowerPoint Template
PowerPoint Templates
Free
-

Free Cartoon PowerPoint Template
Free PowerPoint Templates
Free
-

Free Real Estate Listing PowerPoint Template
Free PowerPoint Templates
Free
-

Animated Clustered Bar Chart PowerPoint Template
PowerPoint Charts
Premium
-

Animated Agriculture PowerPoint Deck Template
PowerPoint Templates
Premium
-

Free University Presentation PowerPoint Template
PowerPoint Templates
Free
-

Free Book Review PowerPoint Template
Free PowerPoint Templates
Free
-

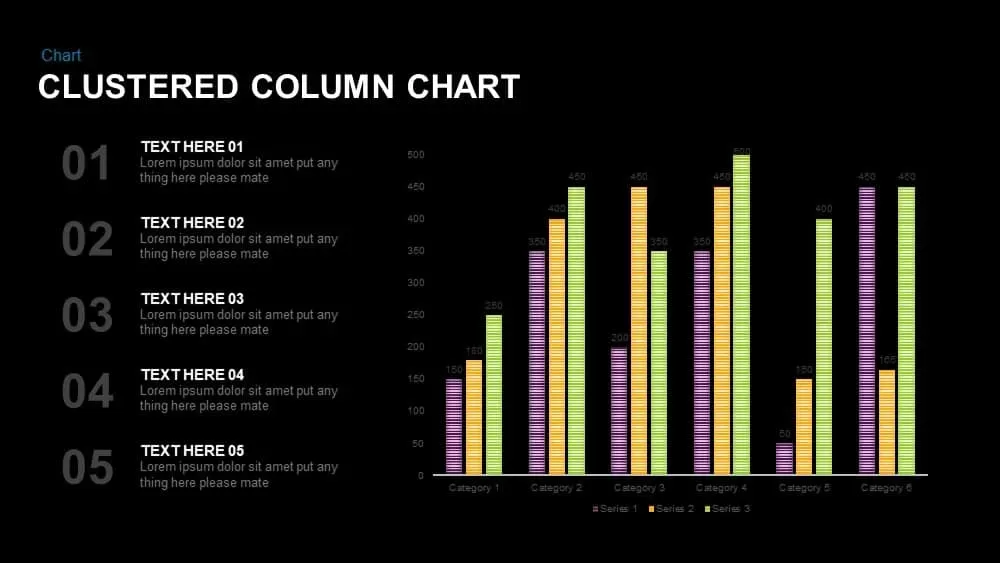
Clustered Column Chart PowerPoint Template
PowerPoint Charts
Premium
-

Pencil Bar Chart PowerPoint Template and Keynote Slide
Column and Bar chart
Premium
-

Annual Report PowerPoint Template and Keynote
PowerPoint Templates
Premium
-

Global Warming Infographic PowerPoint Template Deck
PowerPoint Templates
Premium
-

Free Event Planning PowerPoint Template
Free PowerPoint Templates
Free
-

Radial Bar Chart PowerPoint Templates and Keynote Slides
PowerPoint Charts
Premium
-
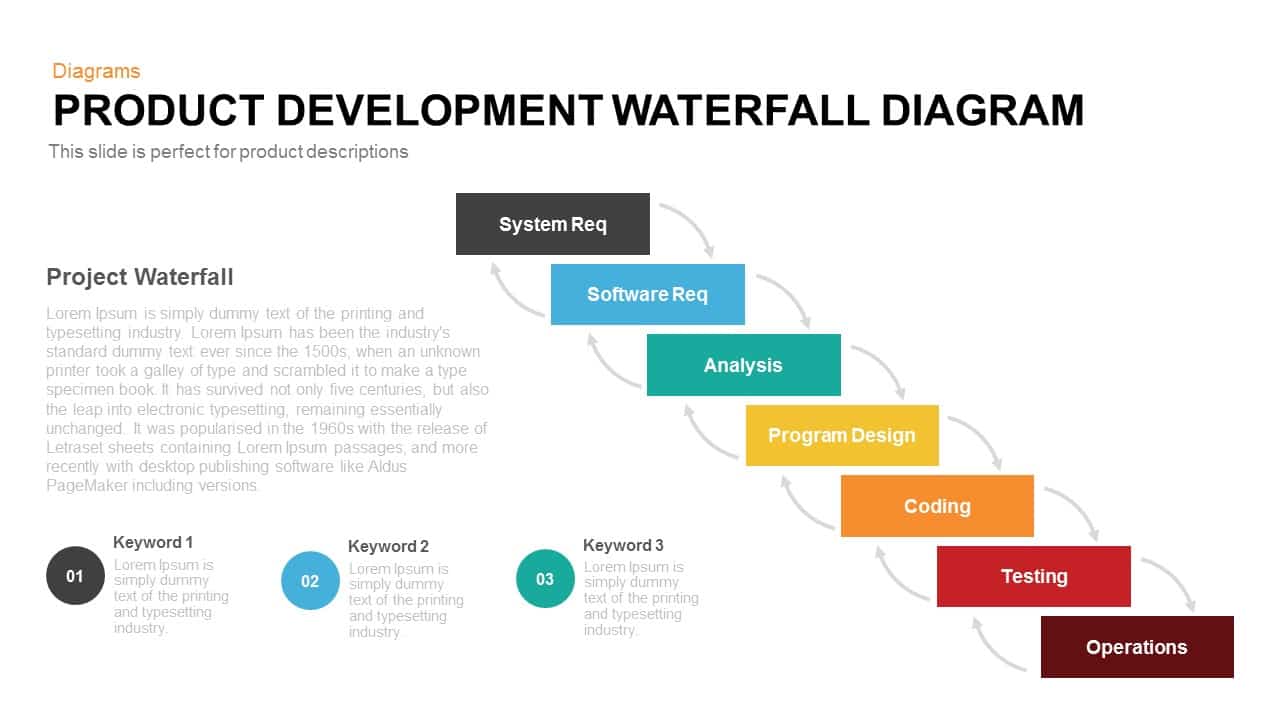
Product Development Waterfall Model Diagram for PowerPoint and Keynote
Diagrams
Premium
-
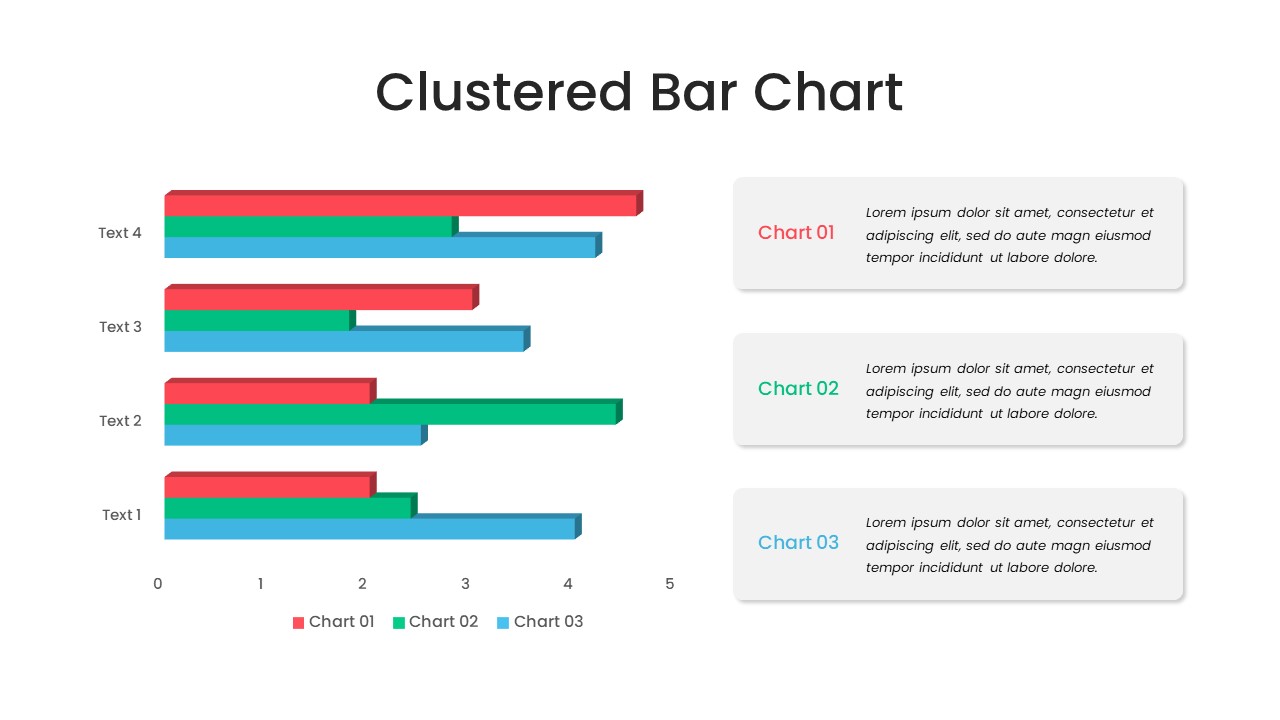
Clustered Bar Chart PowerPoint Template
Column and Bar chart
Premium
-

Data Science PowerPoint Template
PowerPoint Templates
Premium
-
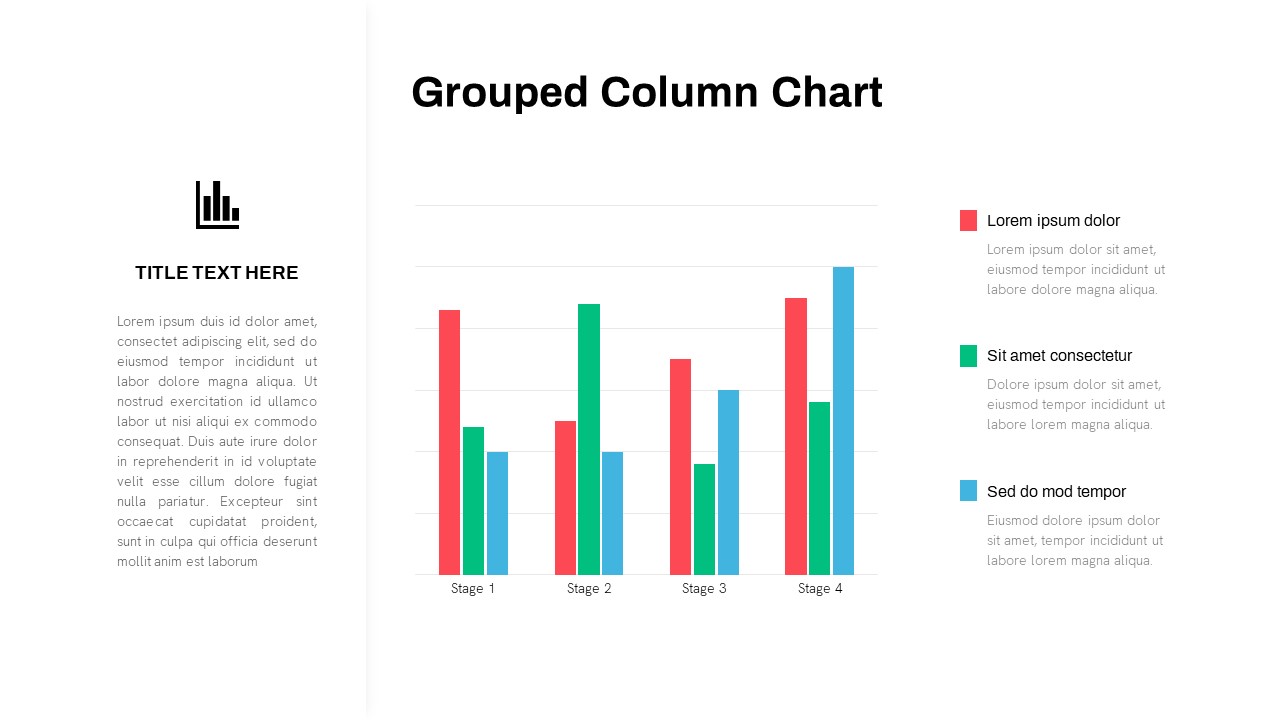
Grouped Column Chart PowerPoint Template
Column and Bar chart
Premium
-
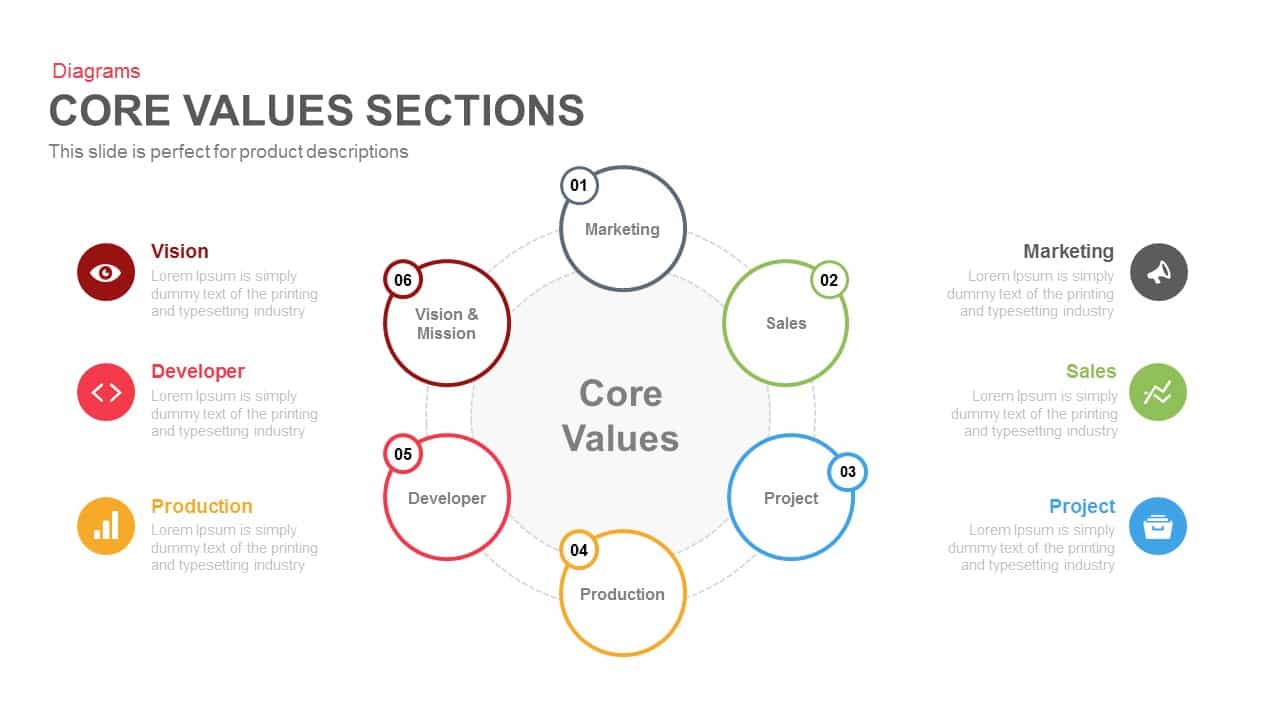
Core Values Sections PowerPoint Template and Keynote
Business Models
Premium
-

Free Dunder Mifflin Paper Company Pitch Deck
Free PowerPoint Templates
Free
-

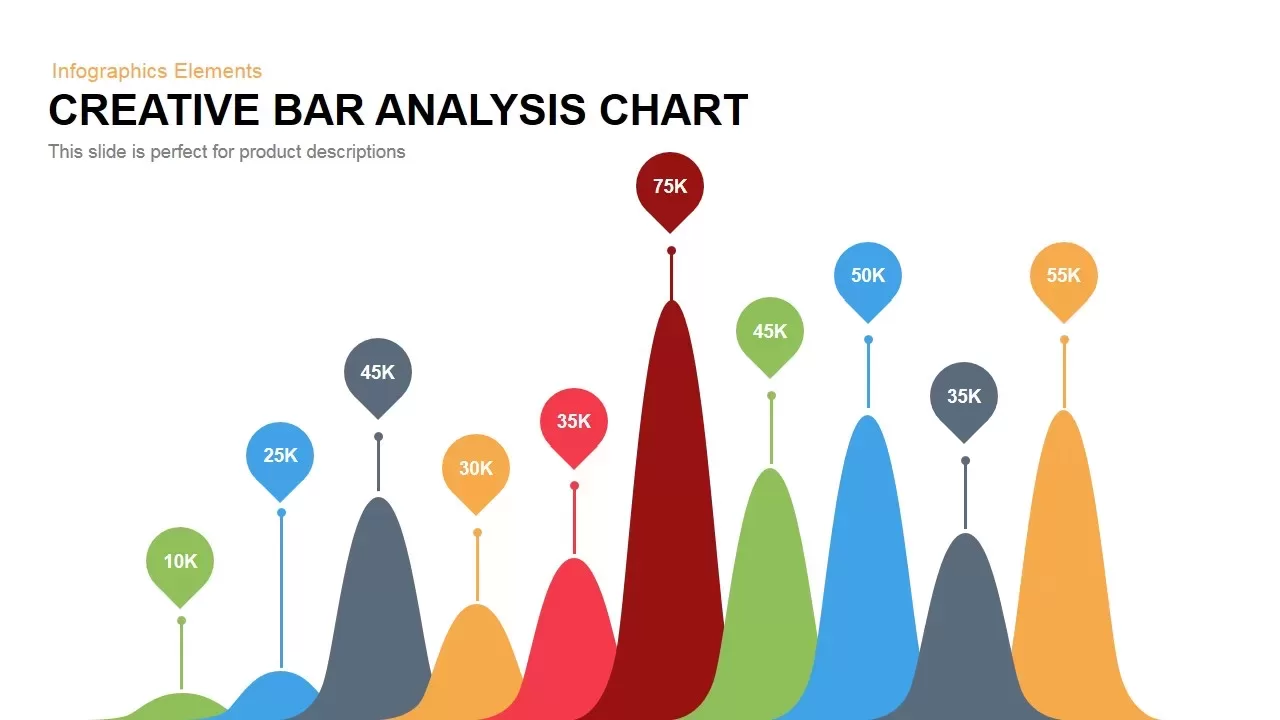
Creative Bar Chart Data Analysis PowerPoint Template and Keynote
Infographic
Premium
-
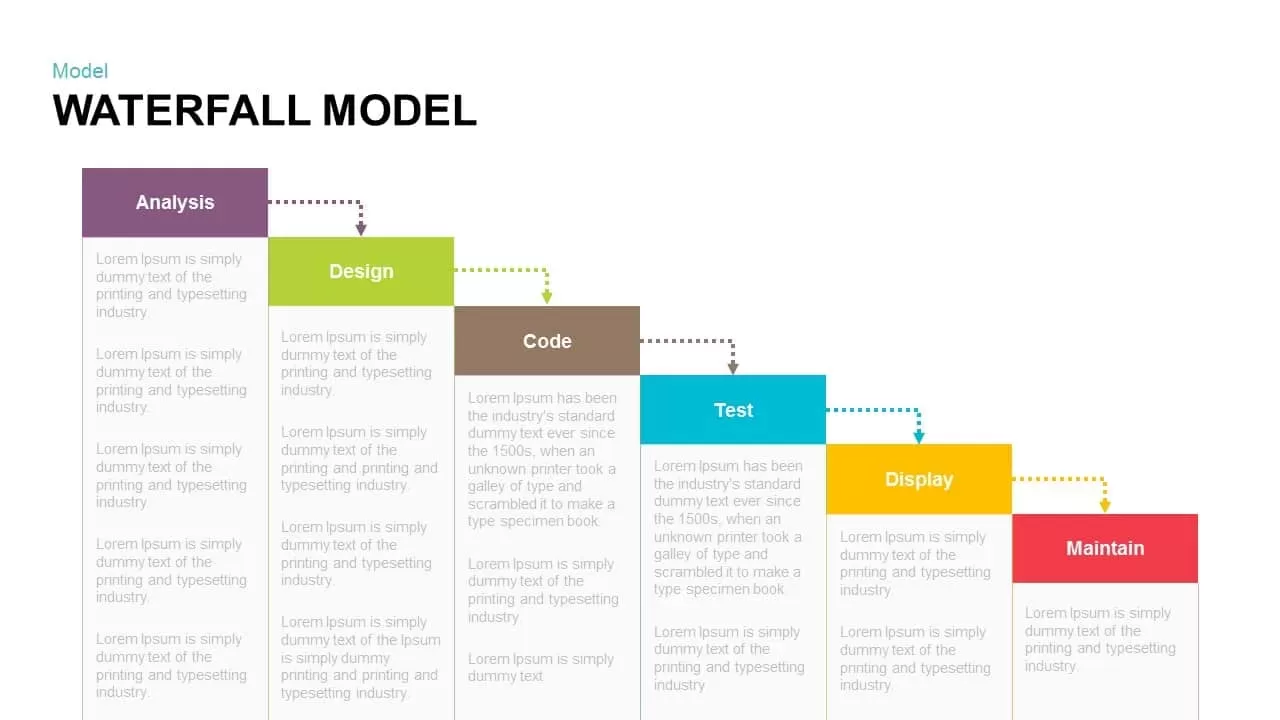
Waterfall Model PowerPoint Template and Keynote Slide
Business Models
Premium
-

EFQM Model PowerPoint Template
PowerPoint Templates
Premium
-

Go To Market PowerPoint Template
PowerPoint Templates
Premium
-

Real Estate PowerPoint Theme
PowerPoint Themes
Premium
-
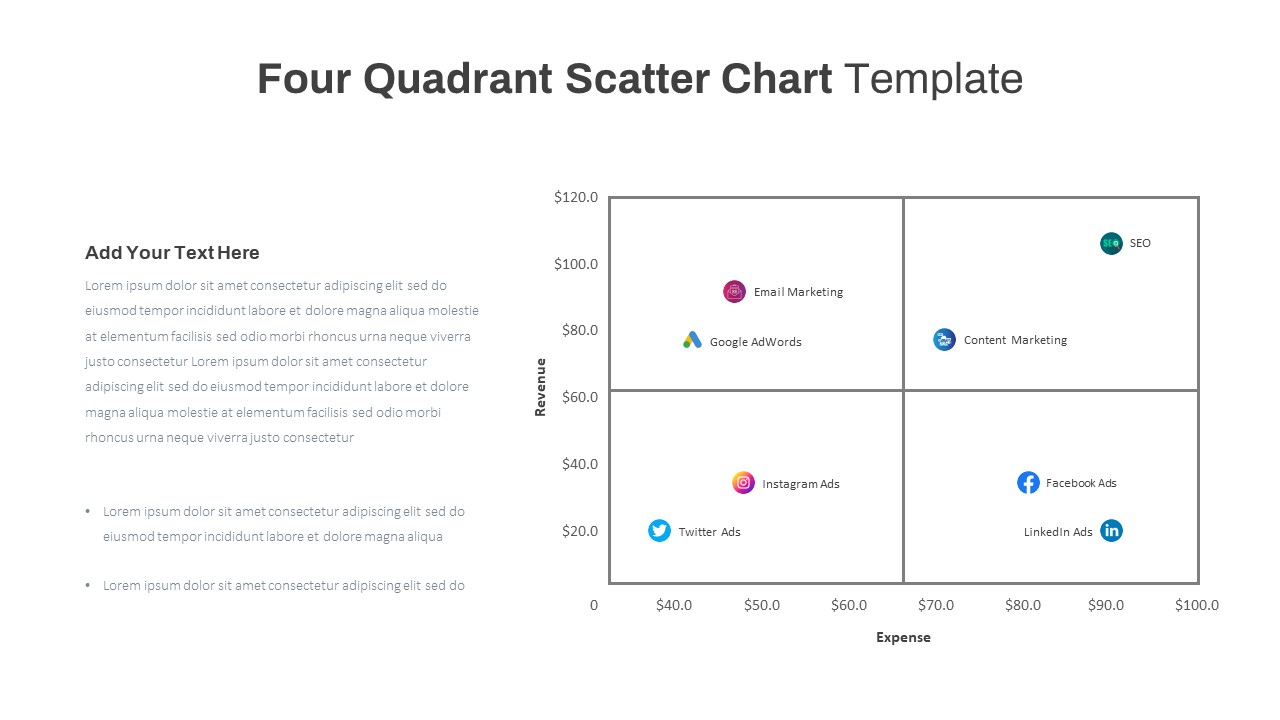
Four Quadrant Scatter Chart PowerPoint Template
PowerPoint Charts
Premium
-
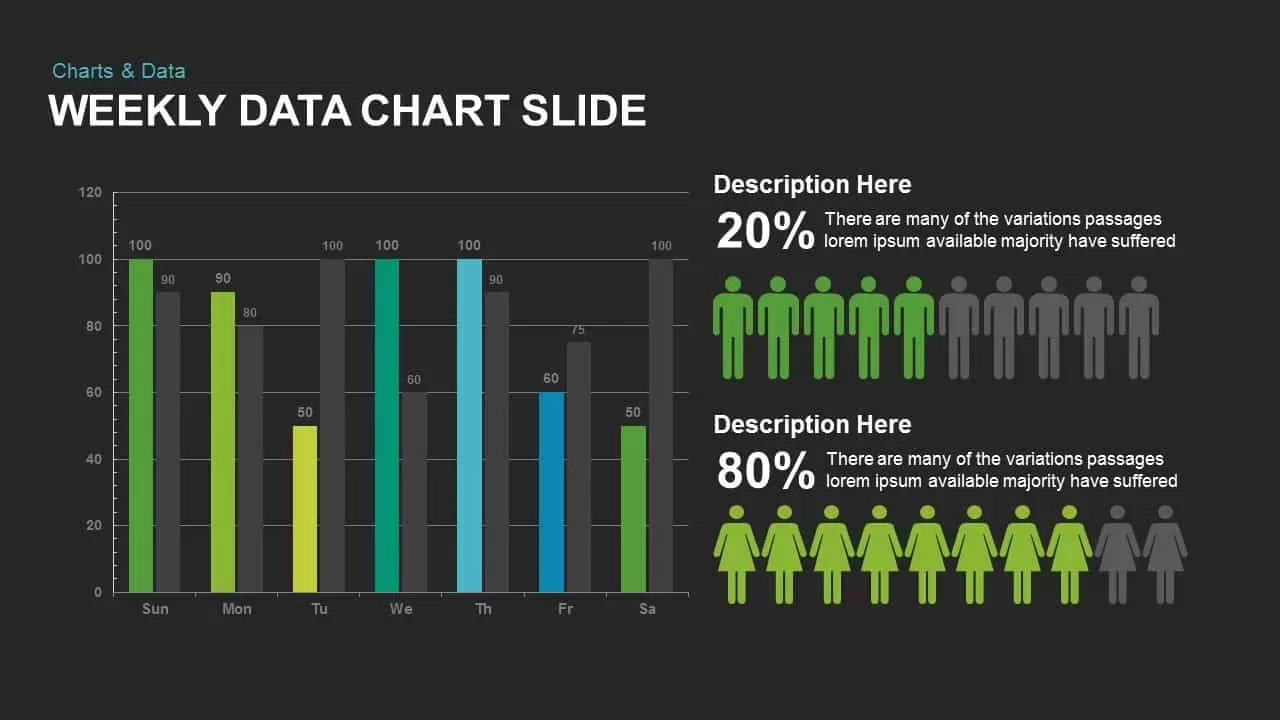
Weekly Data Charts PowerPoint Presentation Template and Keynote Slide
Infographic
Premium
-
Creative Bar Chart Analysis PowerPoint Template and Keynote
Column and Bar chart
Premium
-

Mekko Chart Template
PowerPoint Templates
Premium
-

Stakeholder Register PowerPoint Template
PowerPoint Templates
Premium
-
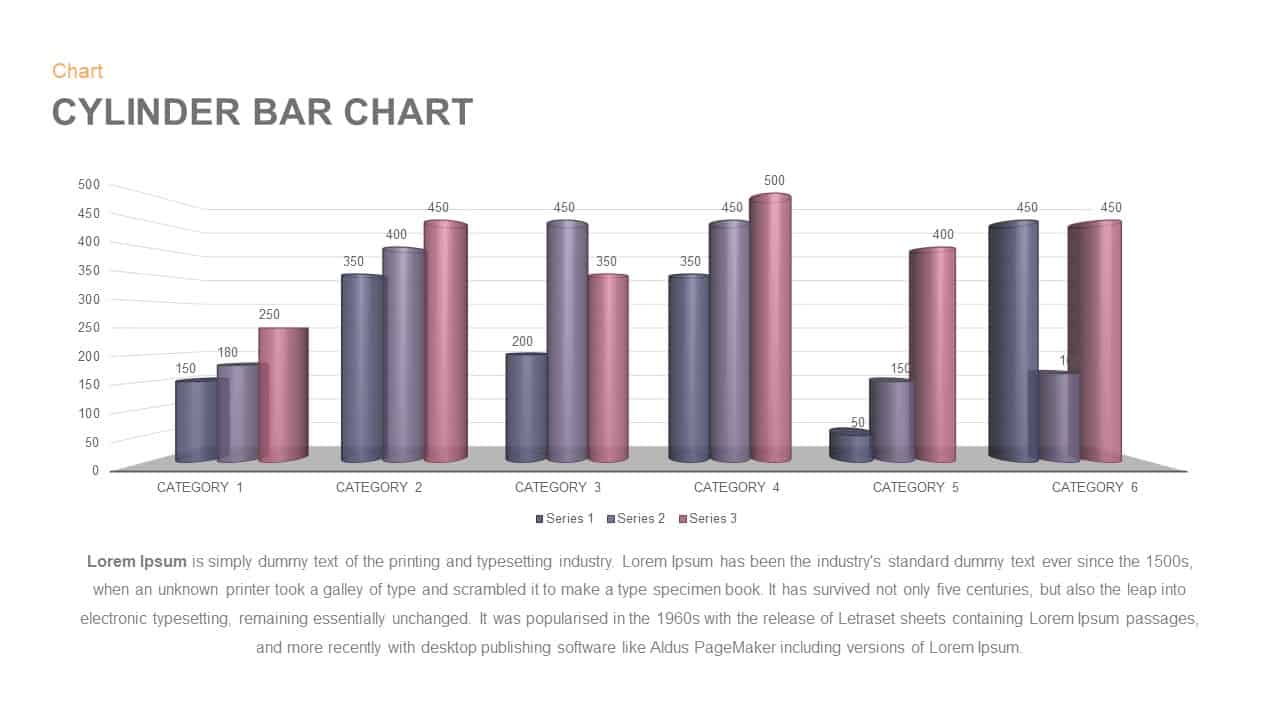
Cylinder Bar Chart PowerPoint Template and Keynote Slide
Column and Bar chart
Premium
-
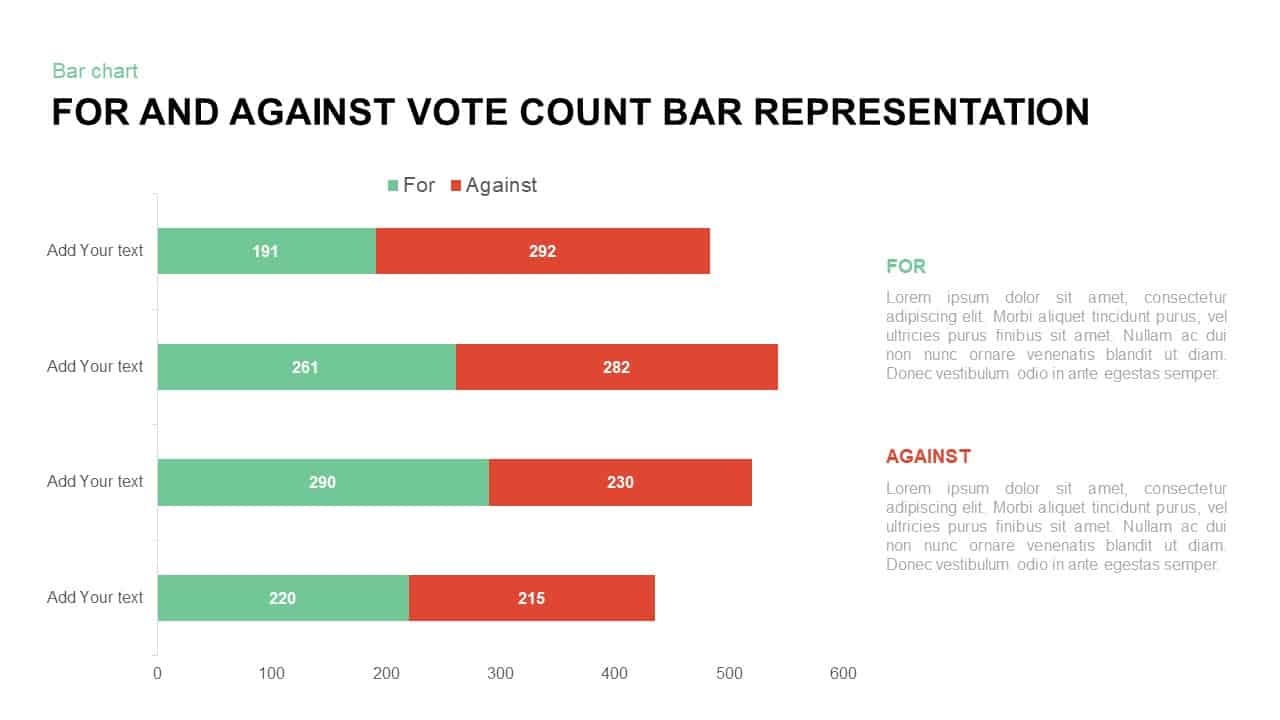
For and Against Vote Count Bar Chart for PowerPoint Presentation
Column and Bar chart
Premium
-

Free AI Artificial Intelligence PowerPoint Template
PowerPoint Templates
Free
-
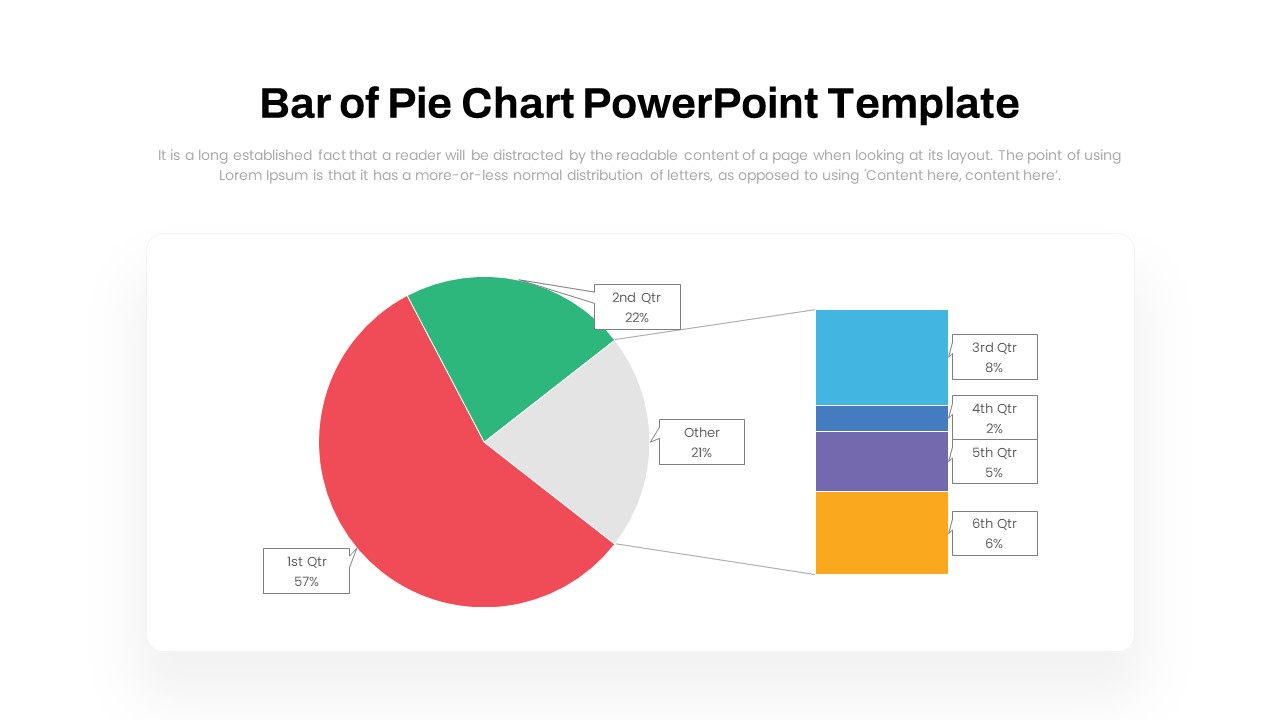
Bar of Pie Chart PowerPoint Template
PowerPoint Templates
Premium
-
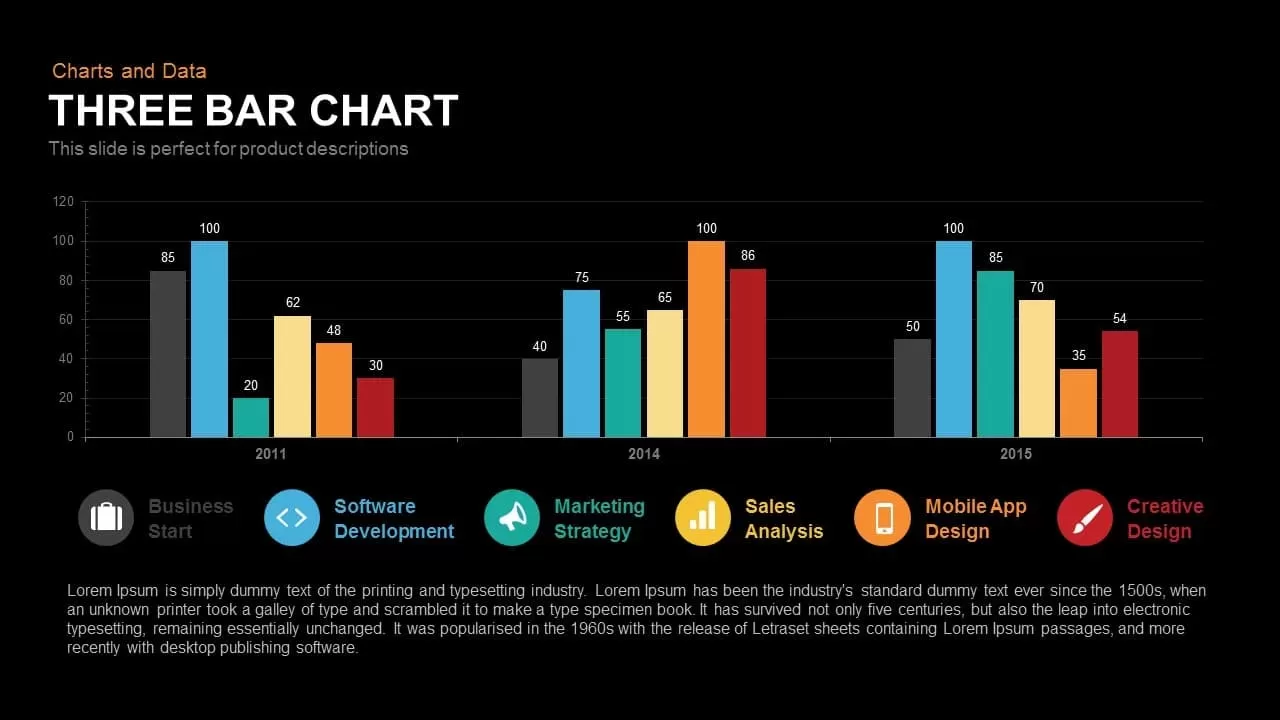
3 Bar Chart PowerPoint Template and Keynote Slide
Column and Bar chart
Premium
-
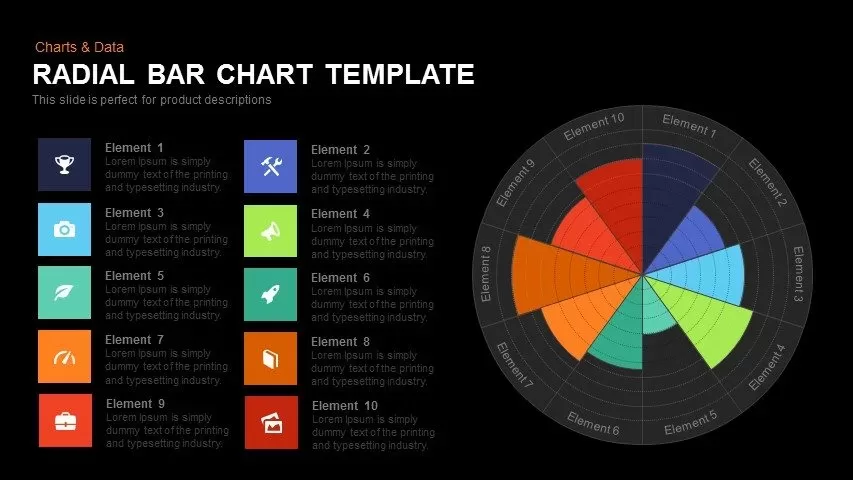
Radial Bar Chart Template for PowerPoint and Keynote
Circular Diagrams
Premium
-

Proportional Area Chart PowerPoint Template
PowerPoint Templates
Premium
-

Business Process Reengineering Template
PowerPoint Templates
Premium
-

Open Door Policy PowerPoint Template
PowerPoint Templates
Premium
-
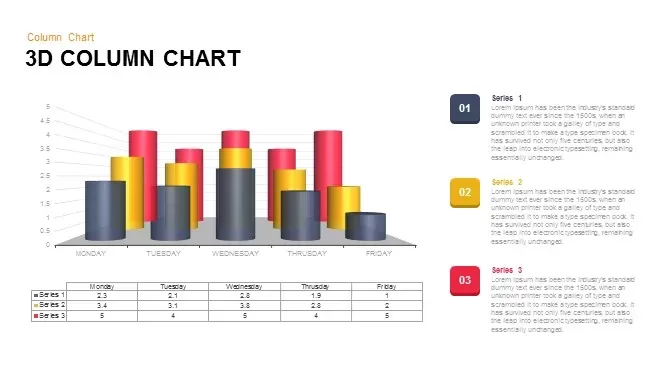
3D Column Chart for PowerPoint and Keynote Presentation
PowerPoint Charts
Premium
-

Area Chart PowerPoint Template
PowerPoint Charts
Premium
-
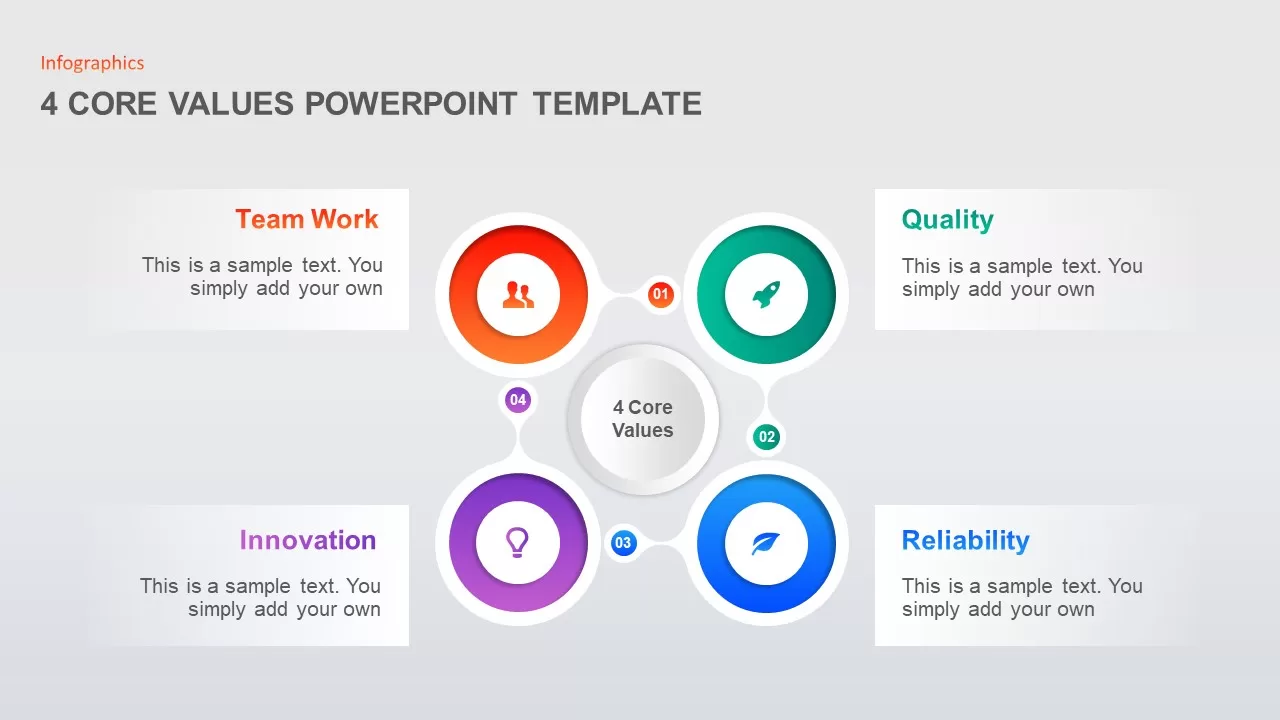
4 Step Core Values PowerPoint Template
Business Models
Premium
-
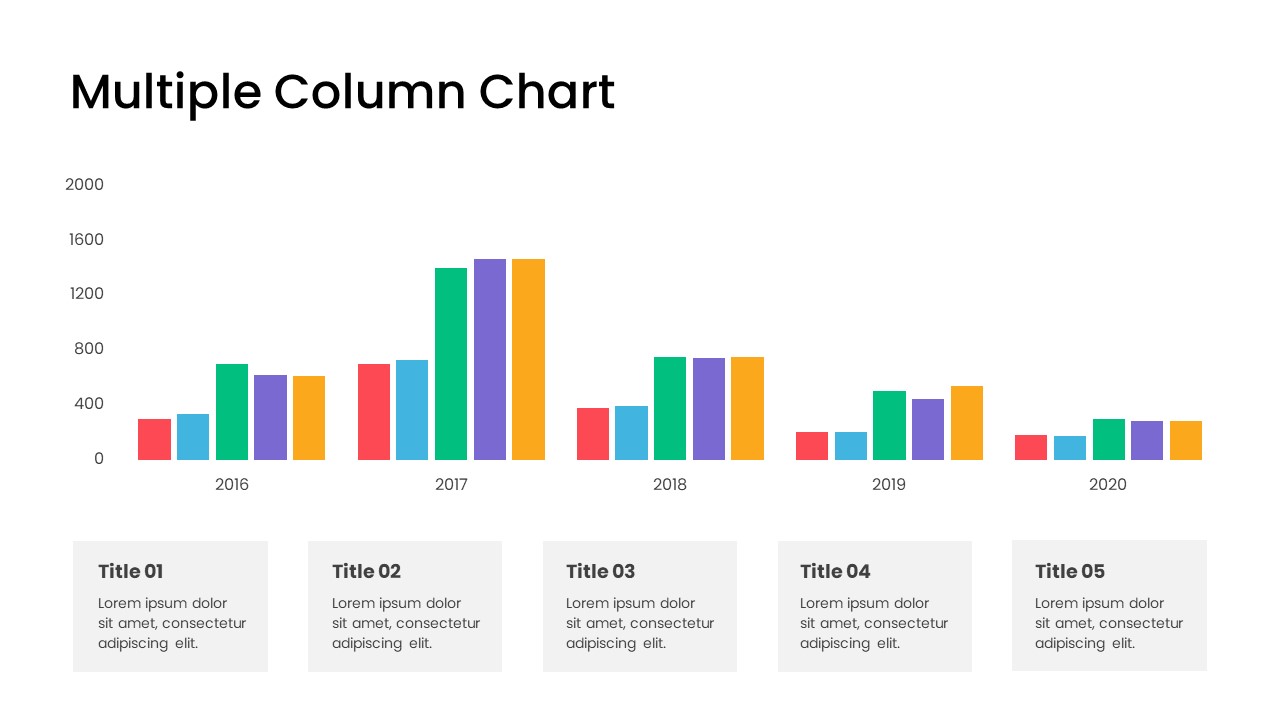
Multiple Column Chart PowerPoint Template
Column and Bar chart
Premium
-
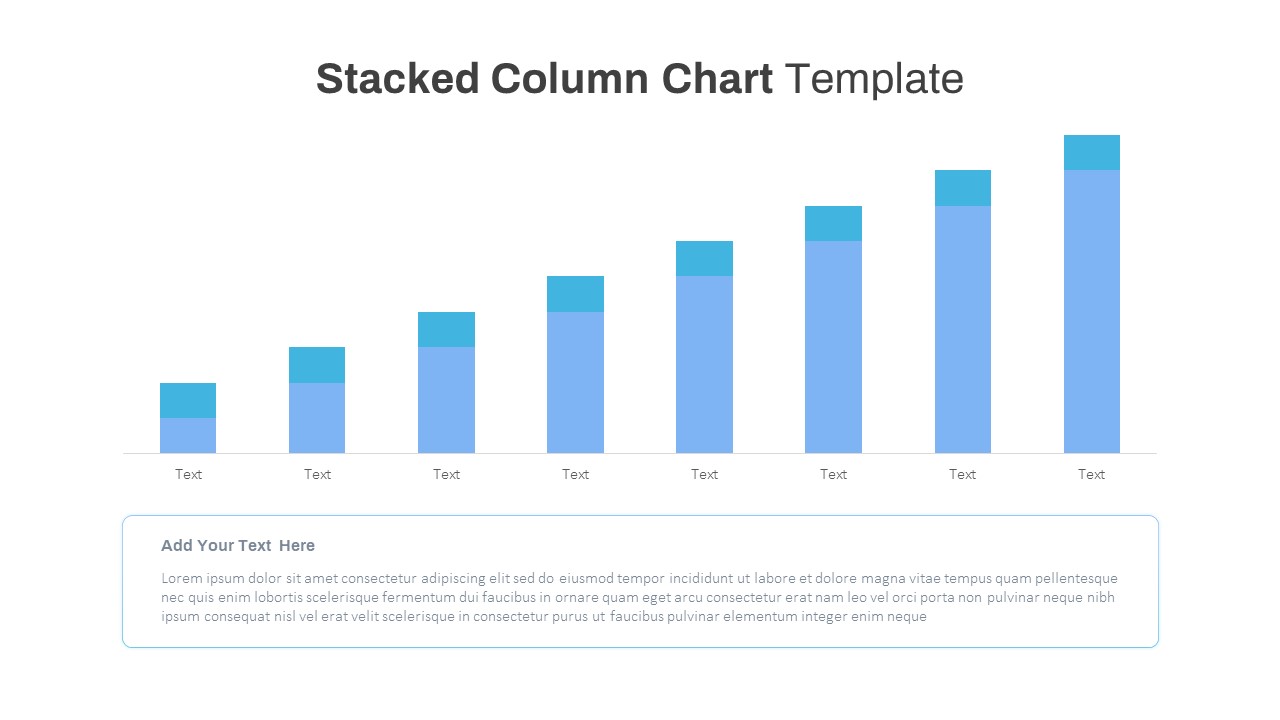
Free Stacked Column Chart Template
Column and Bar chart
Free
-
Clustered Column Chart PowerPoint and Keynote Slide
PowerPoint Charts
Premium
-

Animated Upcoming Event Poster PowerPoint Template
PowerPoint Templates
Premium
-
Data Bar Chart Template for PowerPoint and Keynote
Column and Bar chart
Premium
-
Timeline Bar Chart PowerPoint
Column and Bar chart
Premium
-
Six Column Table Template for PowerPoint and Keynote
Keynote Templates
Premium
-
Sample Bar Chart Template for PowerPoint and Keynote Presentation
Column and Bar chart
Premium
-
100% Stacked Column Chart PowerPoint Template
Column and Bar chart
Premium
-
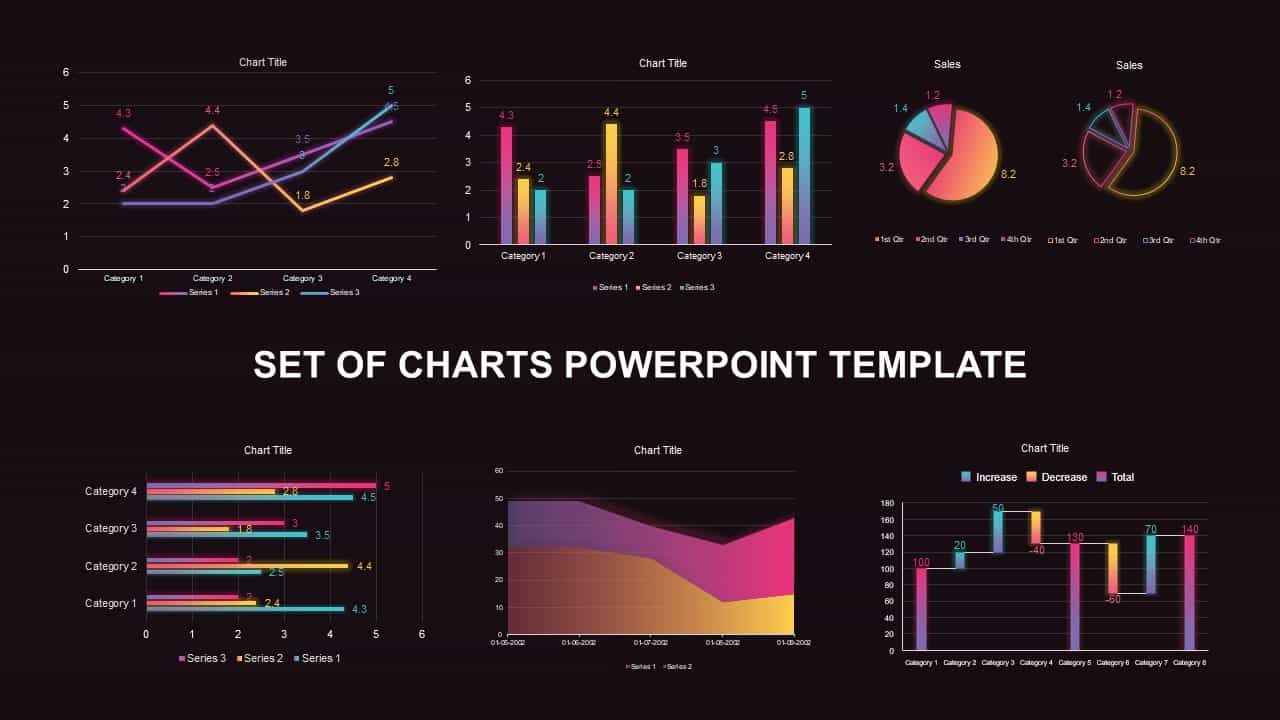
Set of Chart PowerPoint Template and Keynote Diagram
PowerPoint Charts
Premium
-
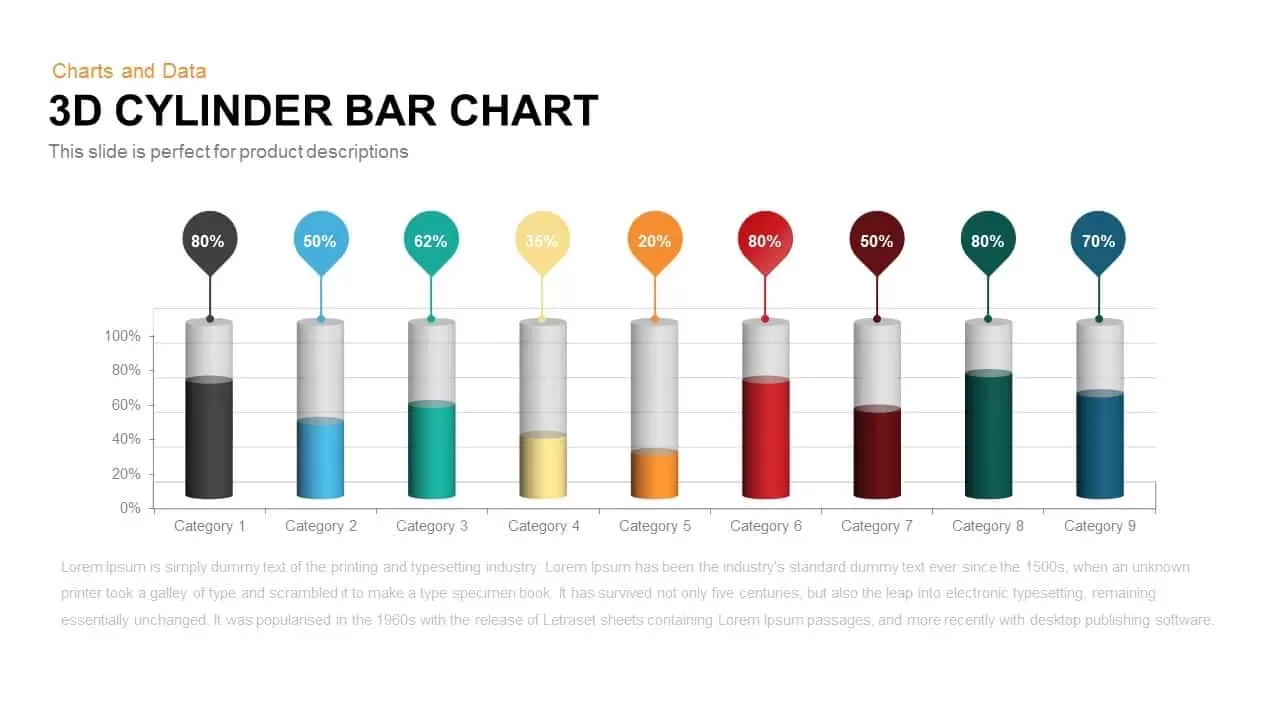
3D Cylinder Bar Chart PowerPoint Template and Keynote Slide
Column and Bar chart
Premium
-

Biotechnology PowerPoint Presentation Template
PowerPoint Templates
Premium
-
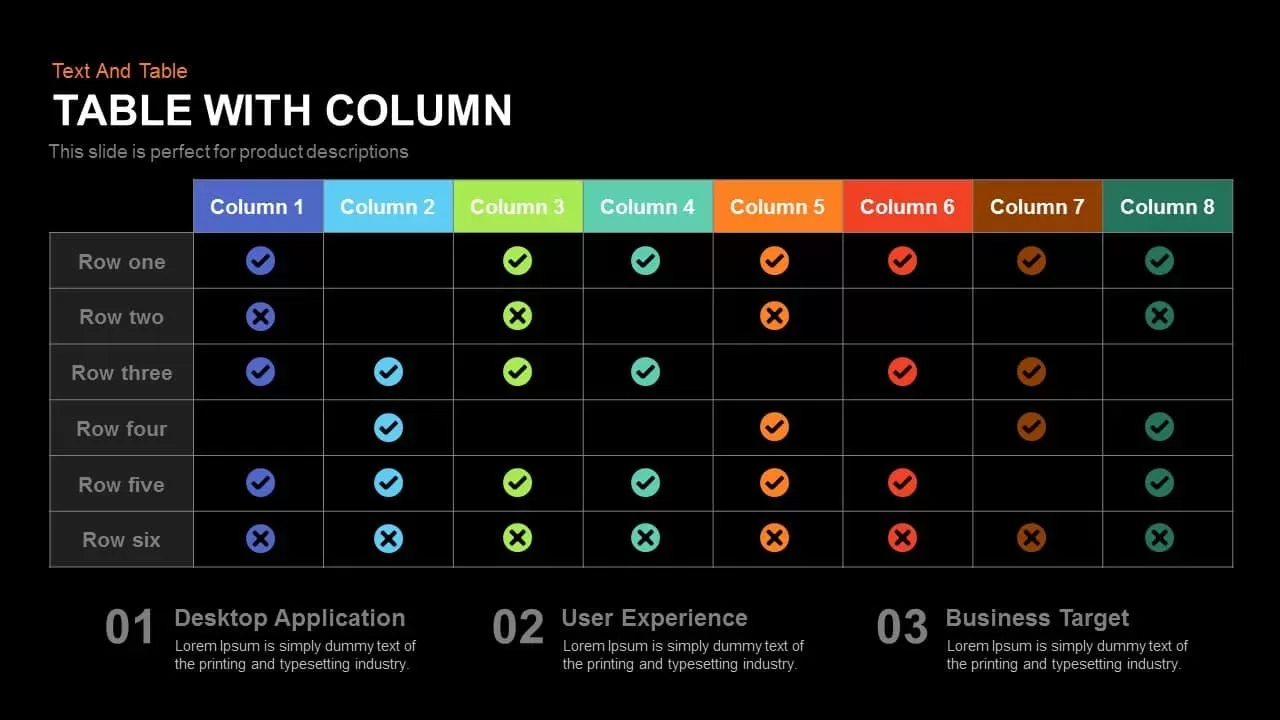
Table with Column PowerPoint Template and Keynote Slide
Keynote Templates
Premium
-

Combination Chart PowerPoint Template
PowerPoint Charts
Premium
-
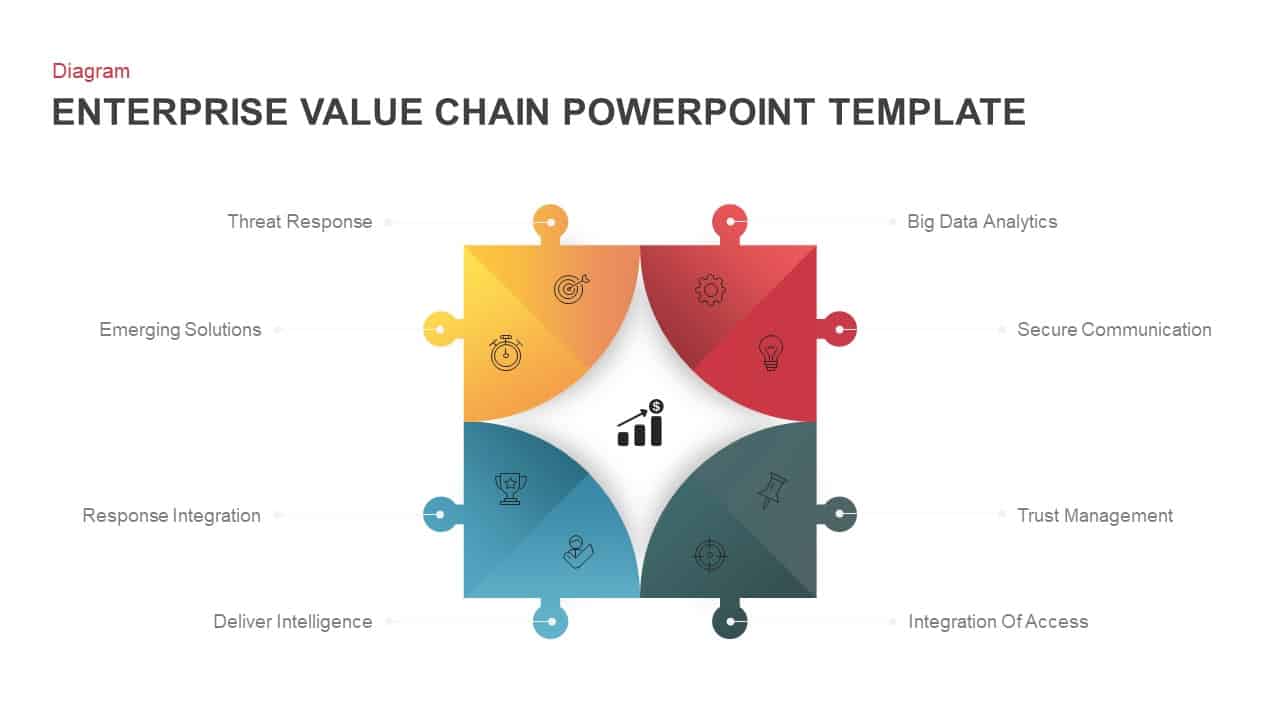
Enterprise Value Chain PowerPoint Template & Keynote
Business Models
Premium
-
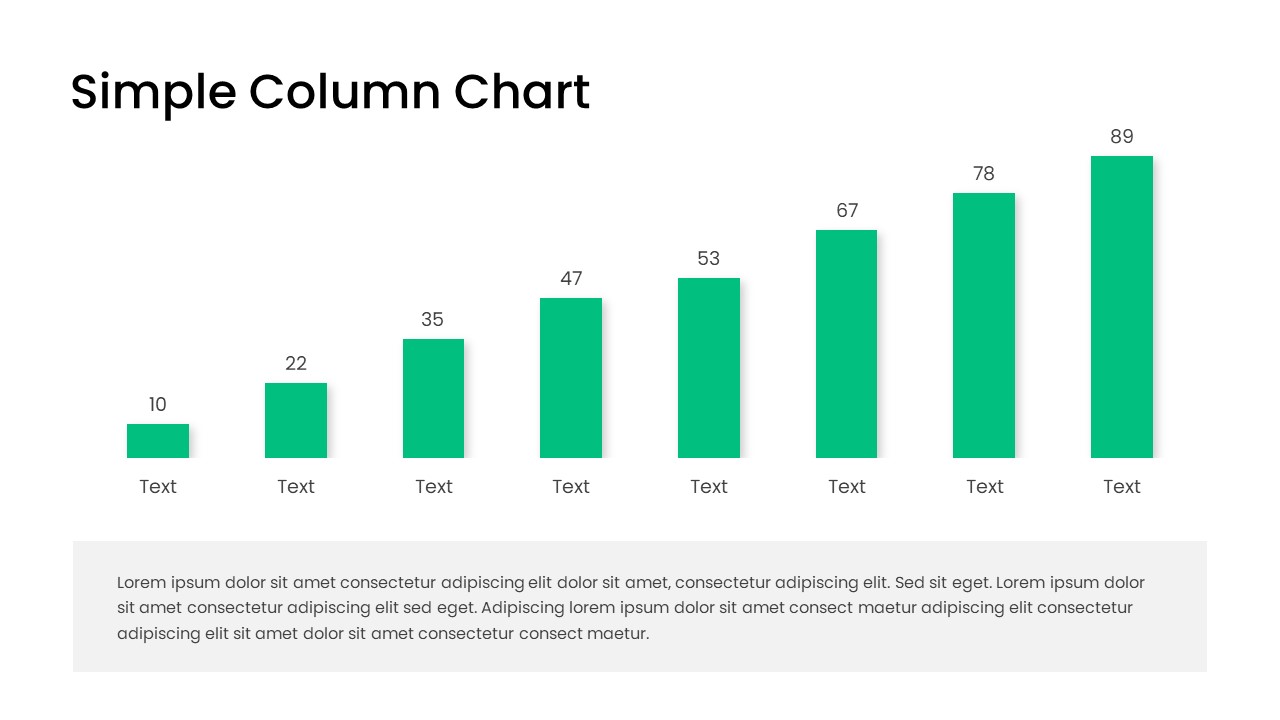
Free Simple Column Chart PowerPoint Template
Column and Bar chart
Free
-
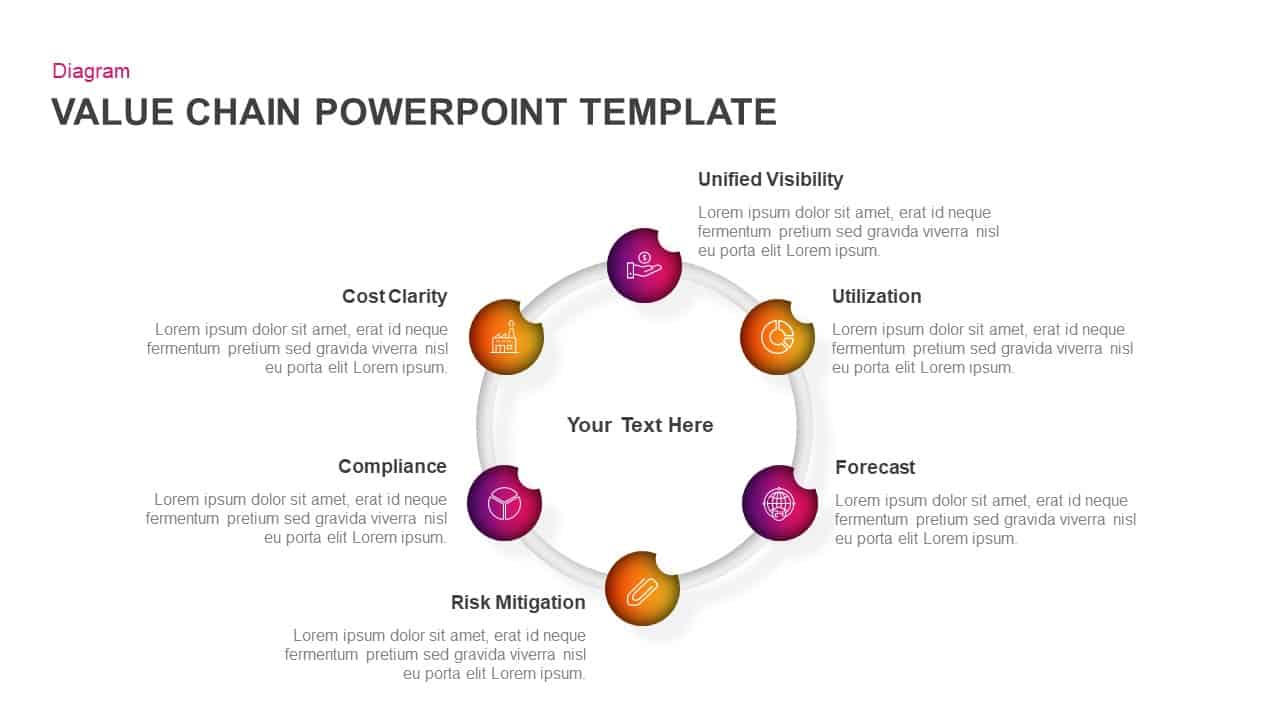
Value Chain Ppt Template for PowerPoint & Keynote
Circular Diagrams
Premium
-
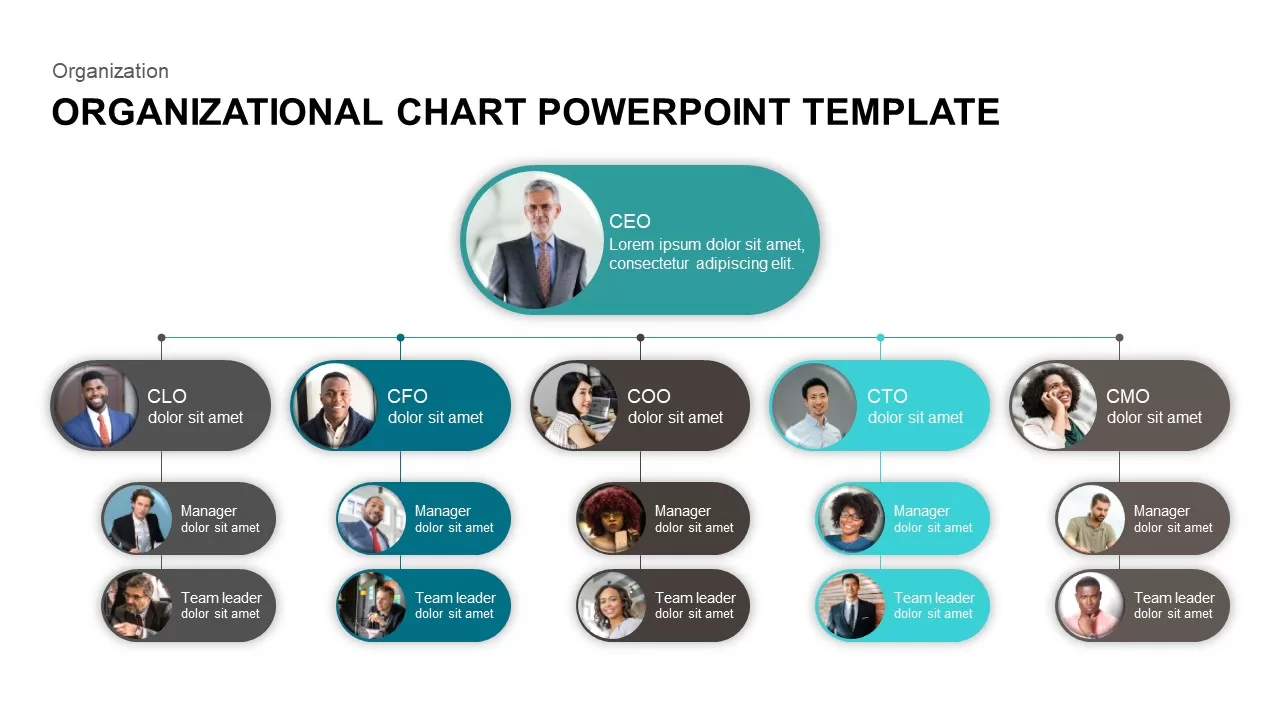
Org Chart PowerPoint Presentation Template
PowerPoint Charts
Premium
-
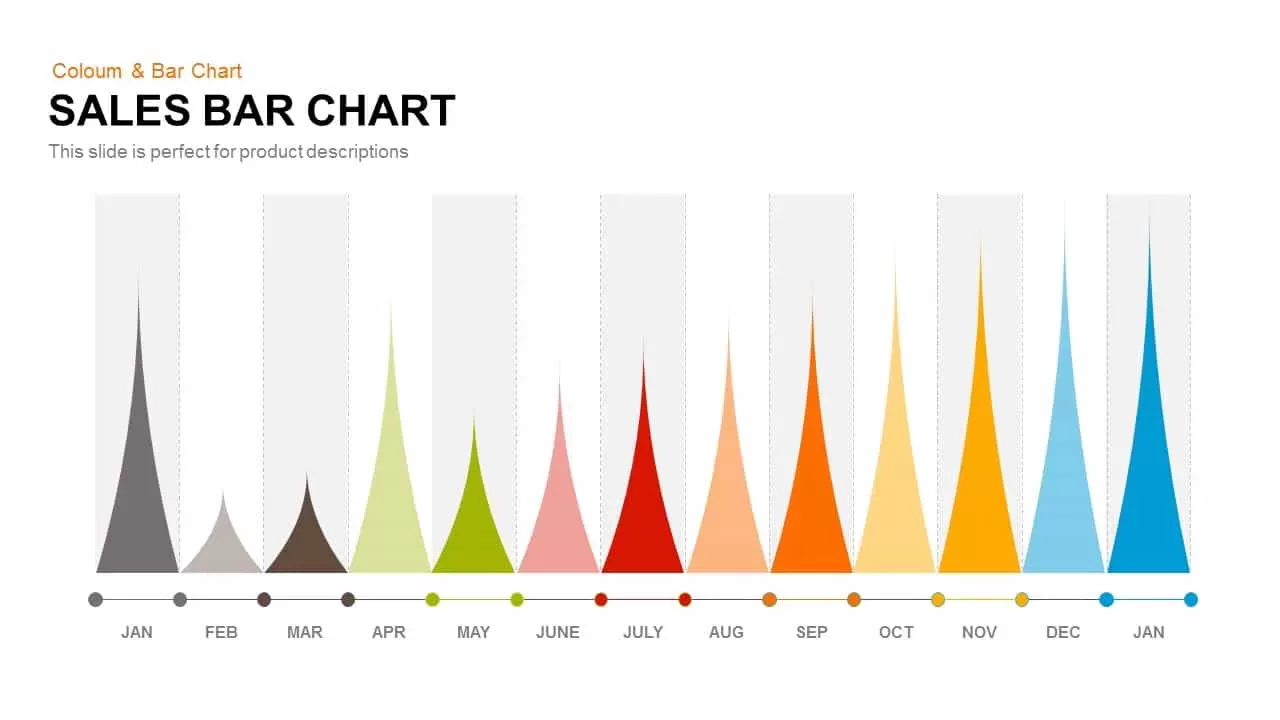
Sales Bar Chart Template for PowerPoint and Keynote
Column and Bar chart
Premium
-
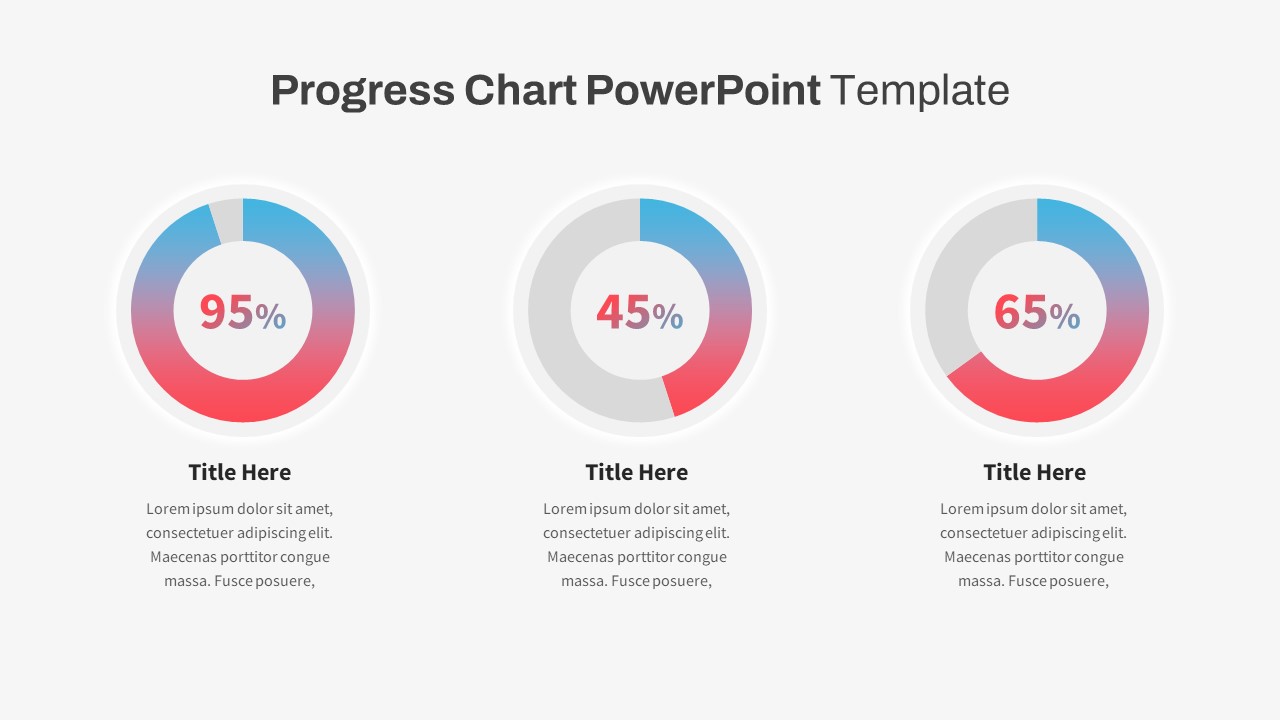
Progress Chart PowerPoint Template
PowerPoint Templates
Premium
-
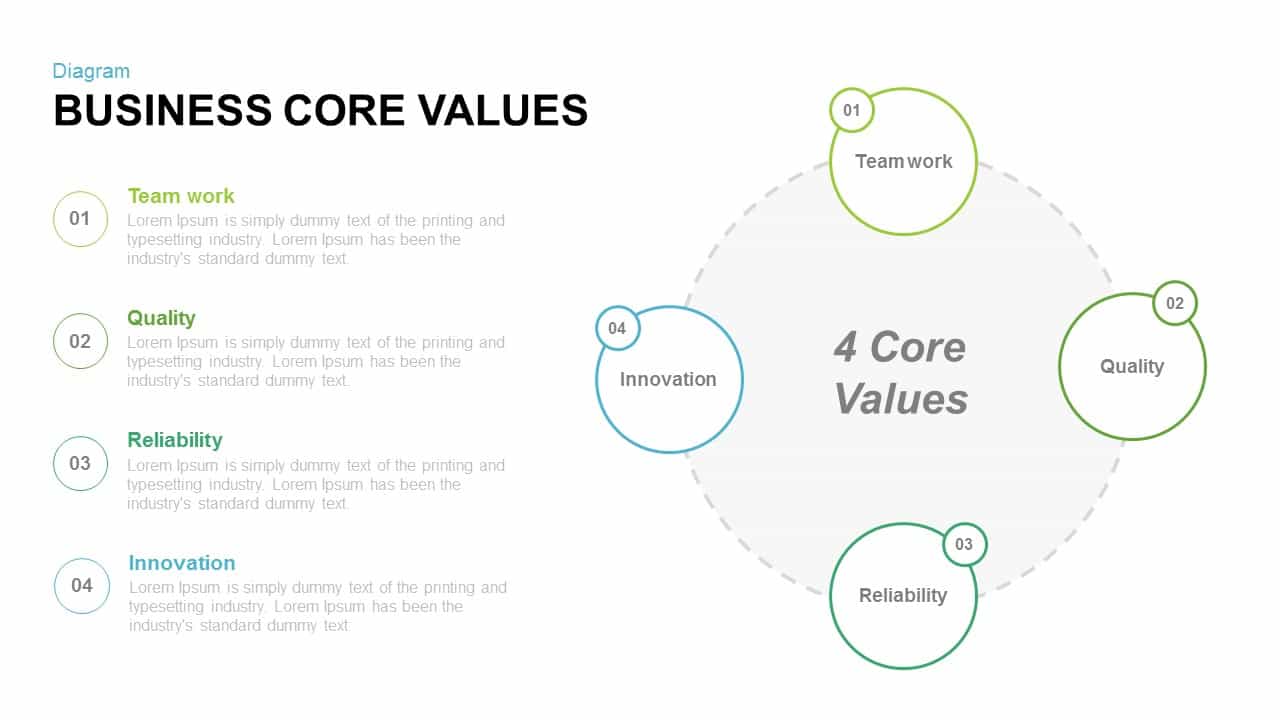
Business Core Values PowerPoint and Keynote template
Business Models
Premium
-
Free PowerPoint Book Template
Free slides
Free
-

Finance Consulting PowerPoint Template
PowerPoint Templates
Premium
-
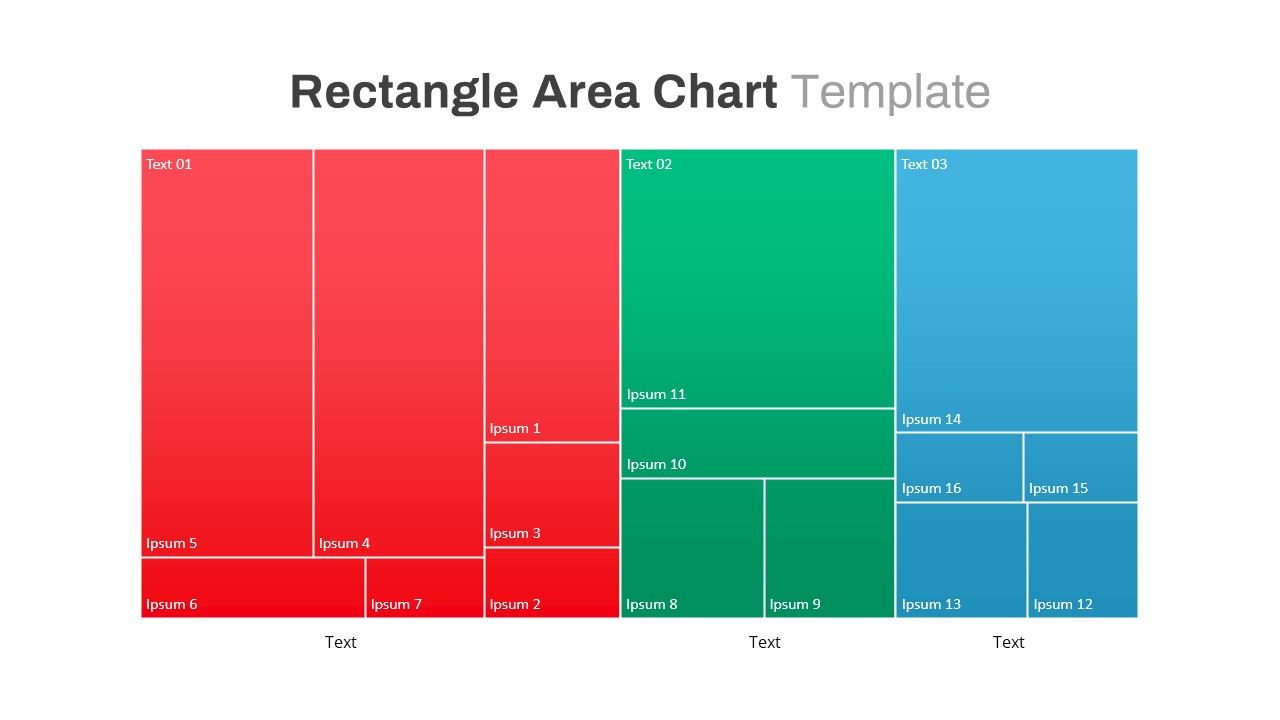
Rectangle Area Chart Template
PowerPoint Charts
Premium
-
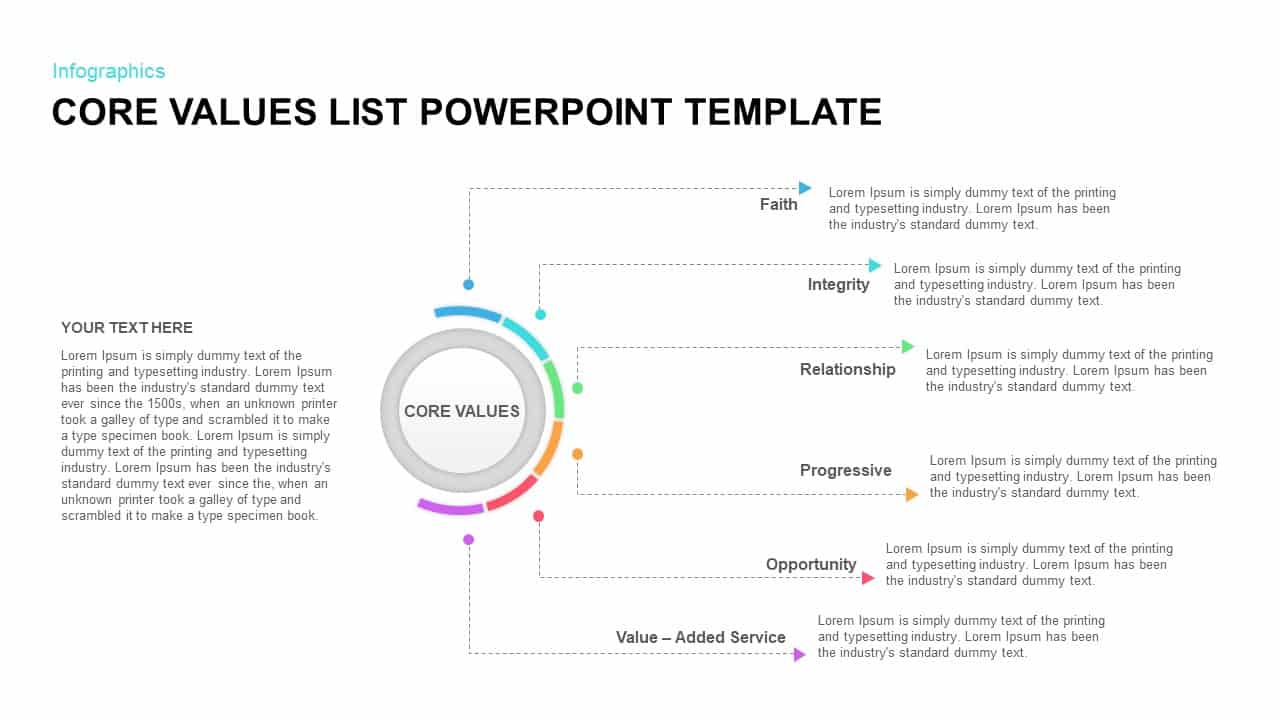
Core Values List PowerPoint Template
Business Models
Premium
-
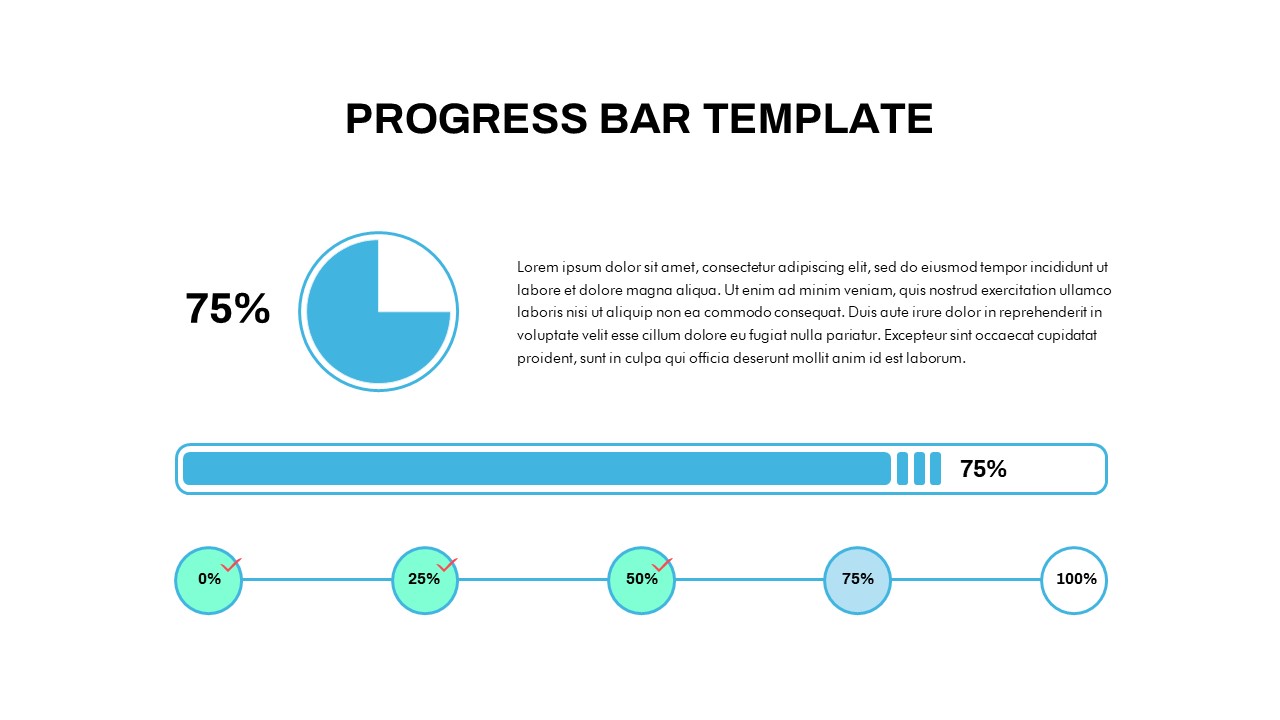
Progress Bar Chart PowerPoint Template
PowerPoint Templates
Premium
-

Power Analogy Metaphor PowerPoint Template
Metaphor, Simile & Analogy
Premium
-
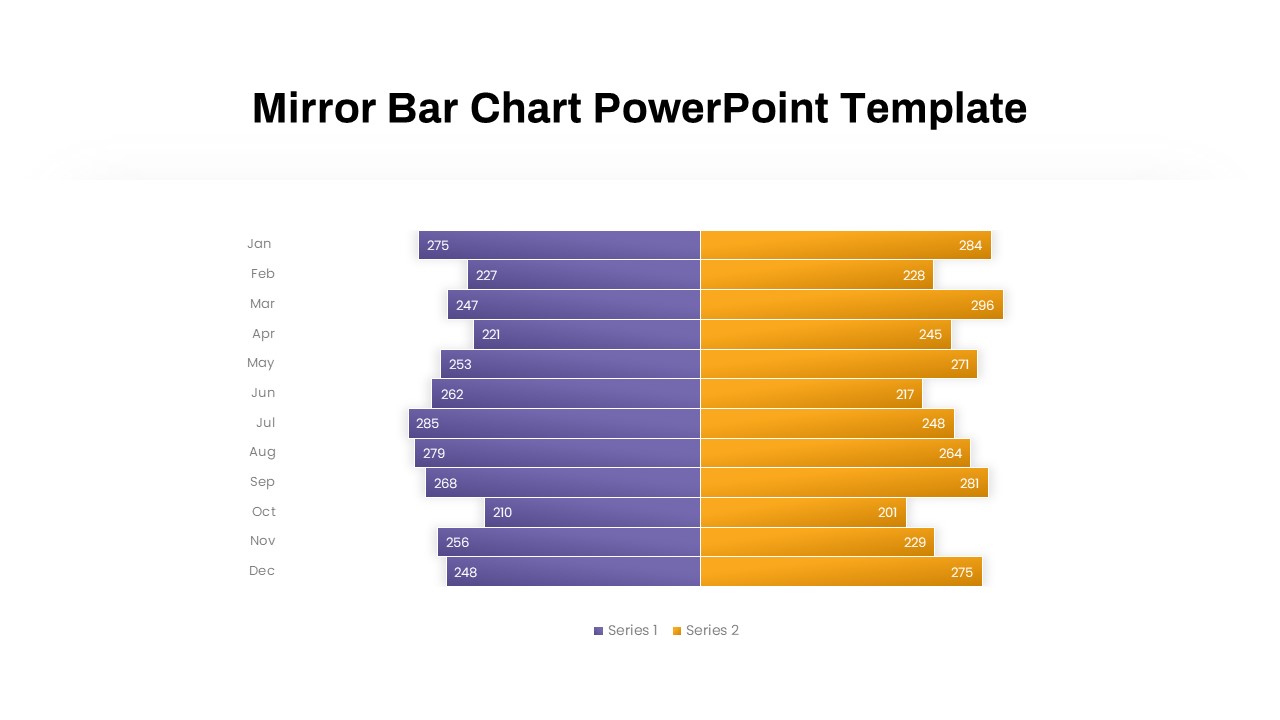
Mirror Bar Chart PowerPoint Template
PowerPoint Templates
Premium
-
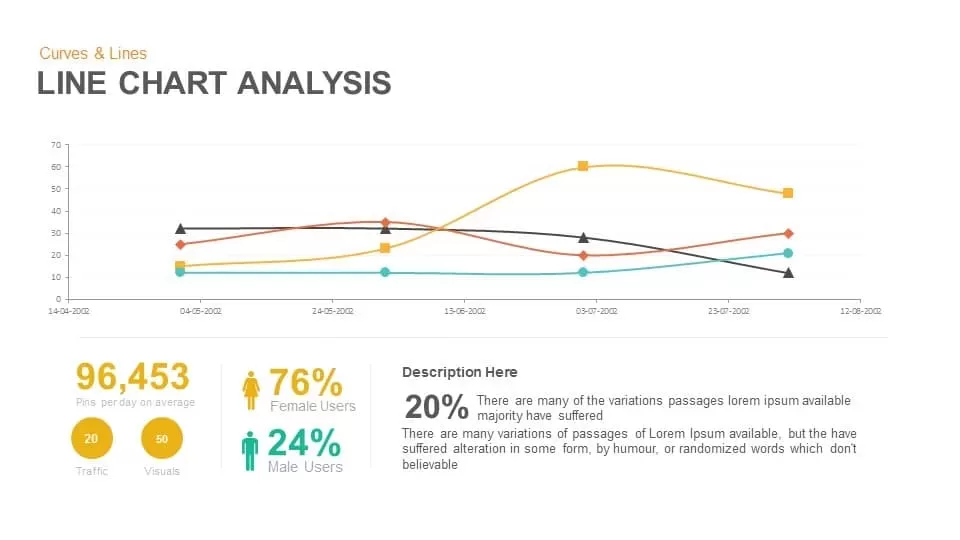
Line Chart Analysis PowerPoint Template and Keynote Slide
Curves and Lines
Premium
-
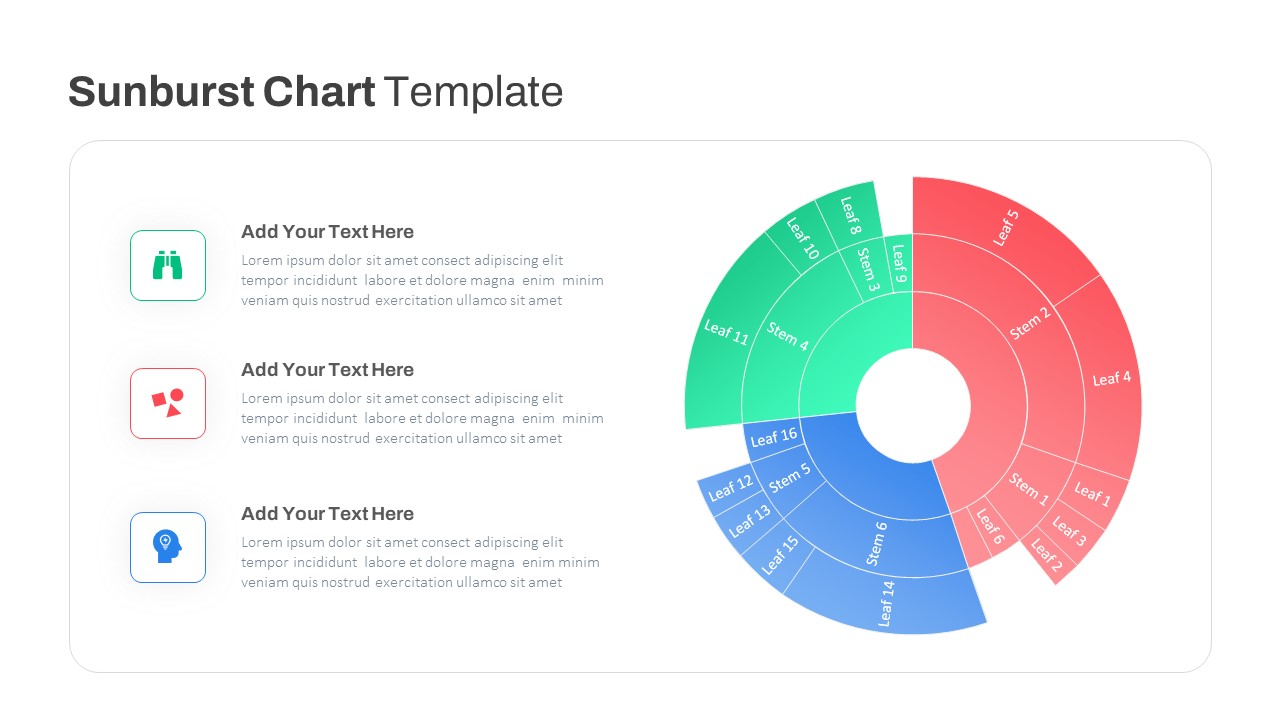
Sun Burst Chart PowerPoint Template
Circular Diagrams
Premium
-
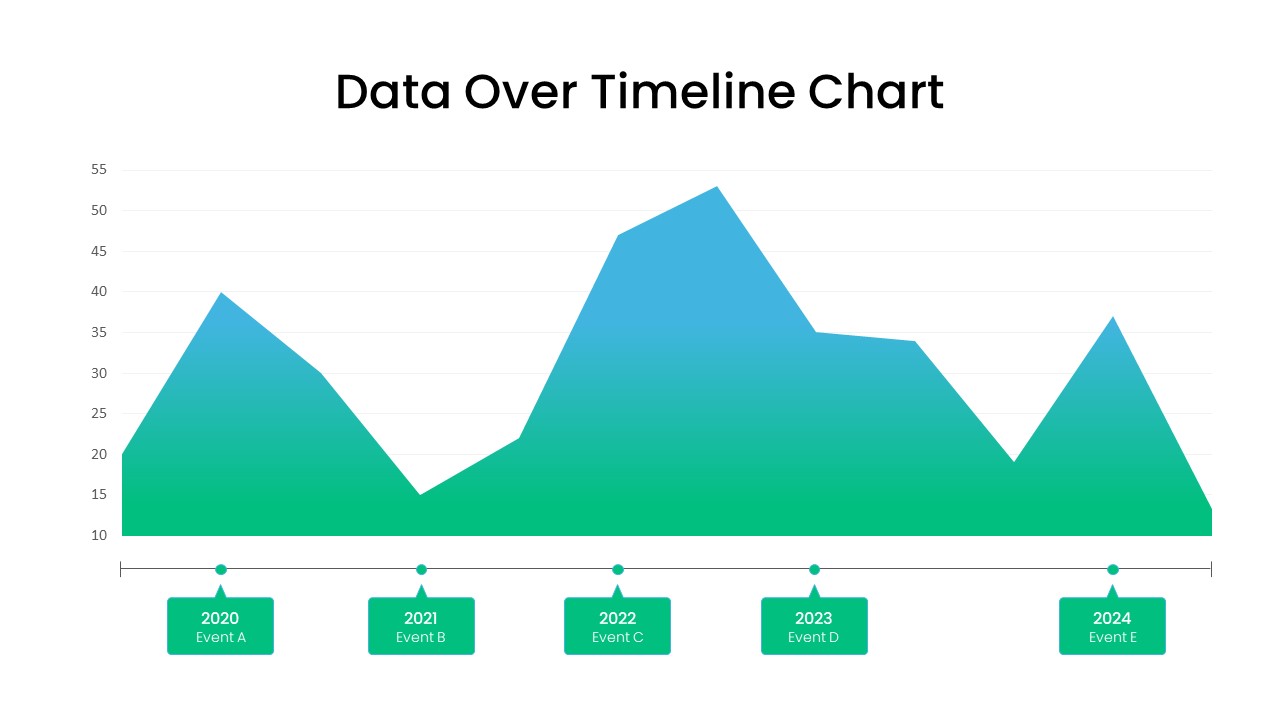
Data Over Time Line Chart PowerPoint Template
PowerPoint Charts
Premium
-
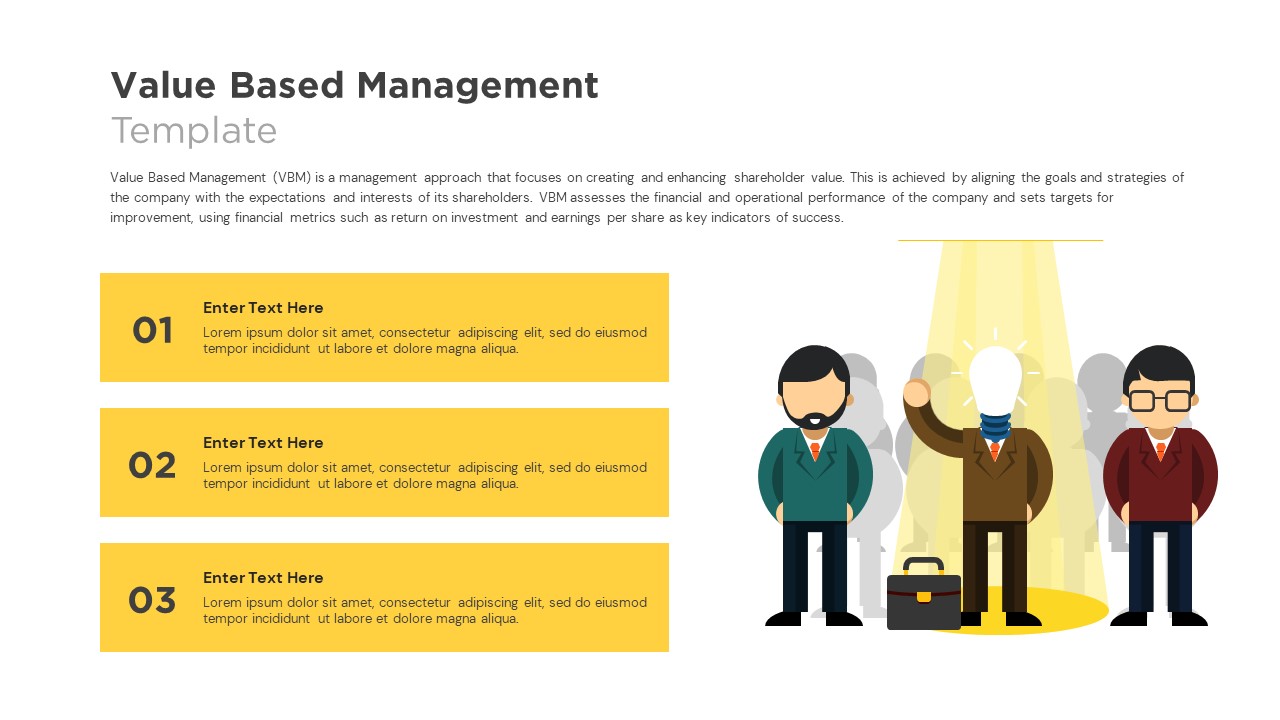
Value Based Management Template
PowerPoint Templates
Premium
-
3D Printing Deck PowerPoint Template
PowerPoint Templates
Premium