Staging Environment
search

Essentials

Must-have decks for quick wins

By Industry

Professionally tailored slides for every sector

By Style

Minimal, modern and creative designs

By Topic

Explore slides curated by purpose and theme

TimelineTimelineRoadmapRoadmapStrategyStrategyCompany ProfileCompany ProfileTableTableComparisonComparisonSWOTSWOTAgendaAgendaListListArrowArrowMapsMapsProcessProcessStagesStagesCircularCircularFunnelFunnelTeamTeamOrg ChartOrg Chart

FinanceFinanceAccountingAccountingKPIKPIRevenueRevenueTechnologyTechnologySoftware DevelopmentSoftware DevelopmentAdvertisingAdvertisingBrand StrategyBrand StrategyCustomer journeyCustomer journeyHealthHealthMedicalMedicalNursingNursing

Business PlanBusiness PlanBusiness StrategyBusiness StrategyBusiness ProcessBusiness ProcessBusiness ProposalBusiness ProposalDigital MarketingDigital MarketingMarketing FunnelMarketing FunnelCustomer ExperienceCustomer ExperienceGantt chartGantt chartRisk ManagementRisk ManagementScrumScrumProject StatusProject StatusRecruitmentRecruitmentEmployee performanceEmployee performanceLeadershipLeadershipAI PowerPoint TemplateAI PowerPoint TemplateInformation TechnologyInformation TechnologyCloud ComputingCloud ComputingMachine LearningMachine Learning

AI Presentation Maker

Install the Windows plugin for quick access to templates and design tools.

AI Infographics Maker

Use our Office 365 add - in to access templates directly from the cloud.

Exe Version

Install the Windows plugin for quick access to templates and design tools.

Office 365

Use our Office 365 add - in to access templates directly from the cloud.

Mac Version

Get the Mac plugin to easily browse, insert, and customize templates and visuals within PowerPoint.

Waffle Chart infographic

This template is part of a deck featuring multiple slides. To check out all slides, click on See All. See All round right arrow
Waffle Chart PowerPoint Template

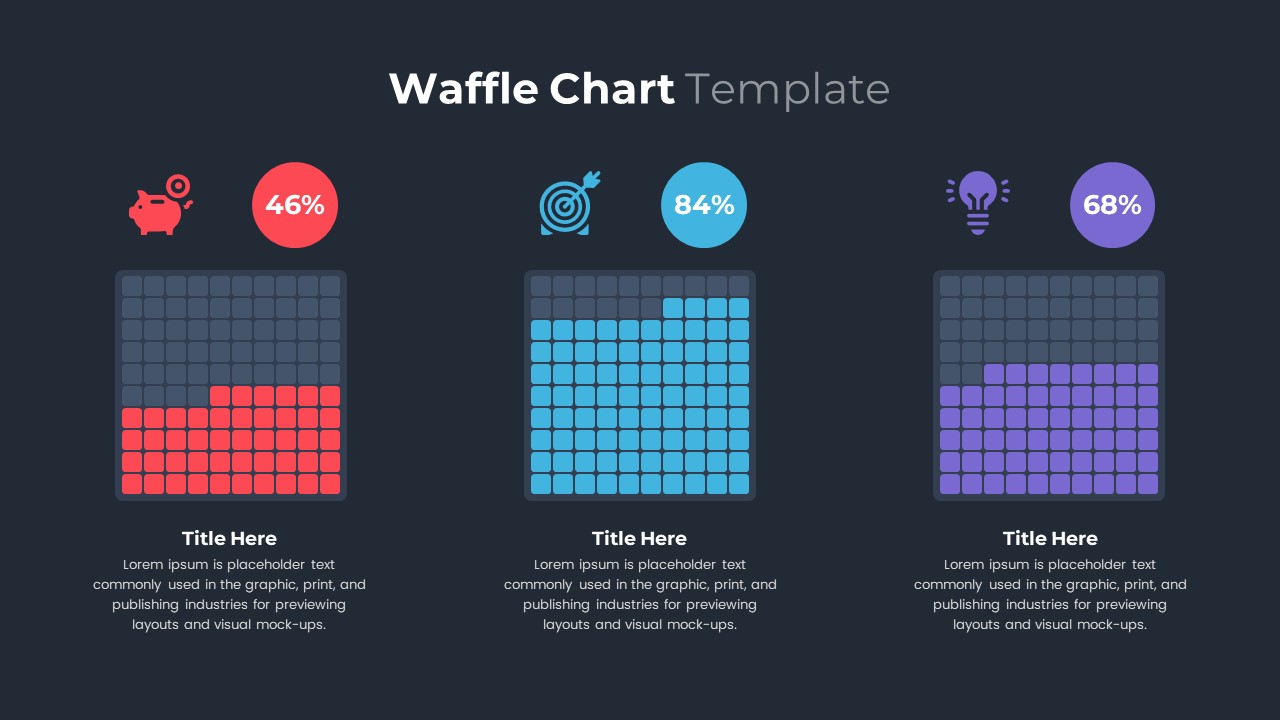
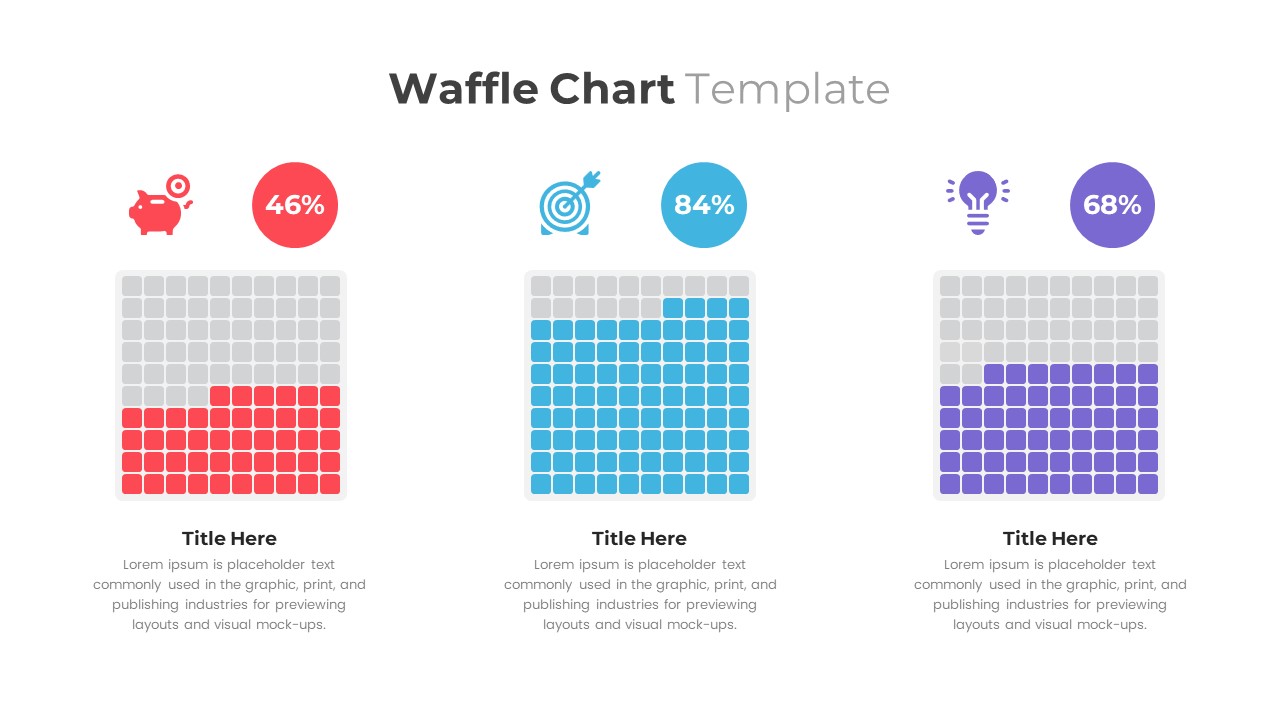
Waffle Chart PowerPoint Template is a statistical diagram for PowerPoint data presentation. This alternative option to the pie chart displays percentage distribution with the smaller color code units. The waffle chart is square with smaller color grids. It is a ten-by-ten grid of different squares where every square accounts for 1%. Thus, the total of the squares is 100%. In a waffle chart PowerPoint, the grid of colored cells represents a percentage. You can display more than one category or combine more than one waffle chart for multiple comparisons. This PowerPoint waffle chart has three designs that show different valuations. The PPT waffle chart with red cells shows 46%, the blue cell waffle chart represents 84 %, and the violet color waffle chart represents 68%. It is similar to a Pie chart template, visualizing the percentage distribution of the different variables. You can easily make edits to the chart and present your data.  Waffle Chart Template for PowerPoint has two variant designs. First, the presenters can demonstrate different data points using a chart with three sections. This chart will show three sets of data by coloring the grid cells. The master diagram is in a three-set with three waffle charts and has three infographic icons s on the top of the waffle chart. This infographic clipart is a piggy bank, dartboard, and bulb. The wafer chart template PowerPoint has enough text placeholders. You can insert your own data by changing the colors of the cells. Try out a Waffle chart PowerPoint to engage your audience with new ways of data presentations.