


Vertical Dot Chart PowerPoint Template
- Version
- Download 4
- File Size 0.00 KB
- File Count 1
- Create Date September 3, 2023
- Last Updated August 21, 2023
Vertical Dot Chart PowerPoint Template
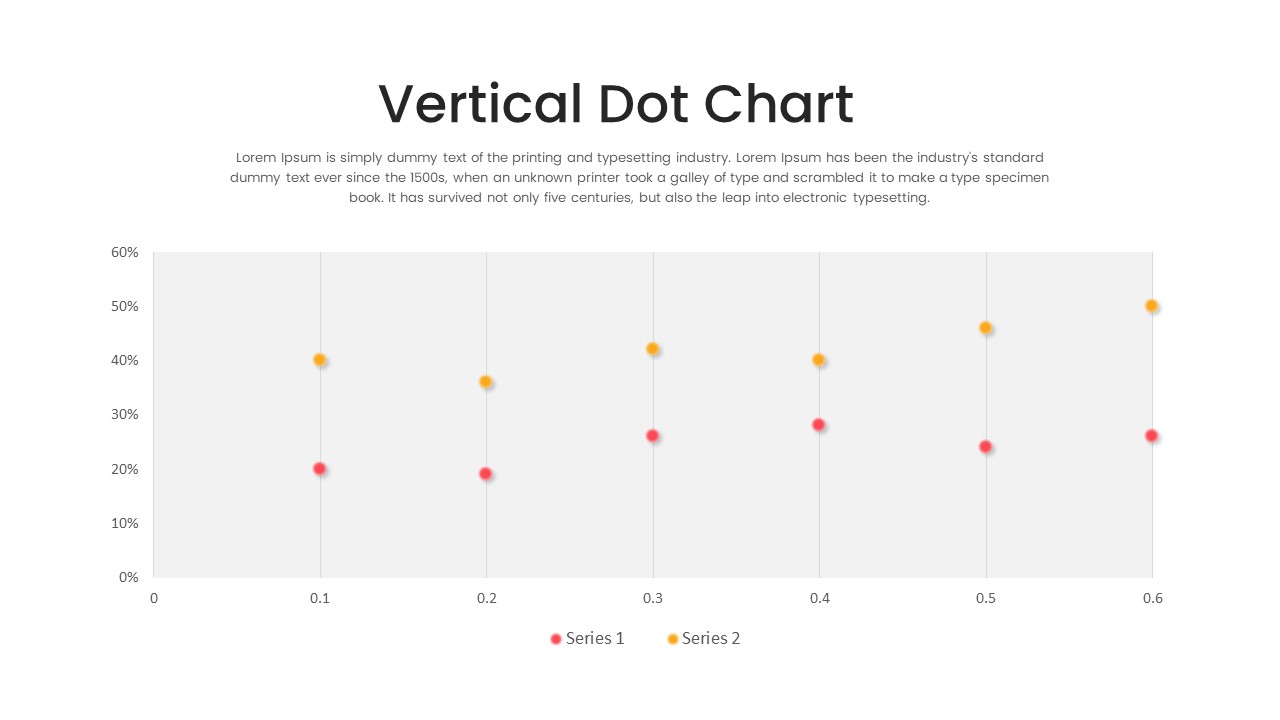
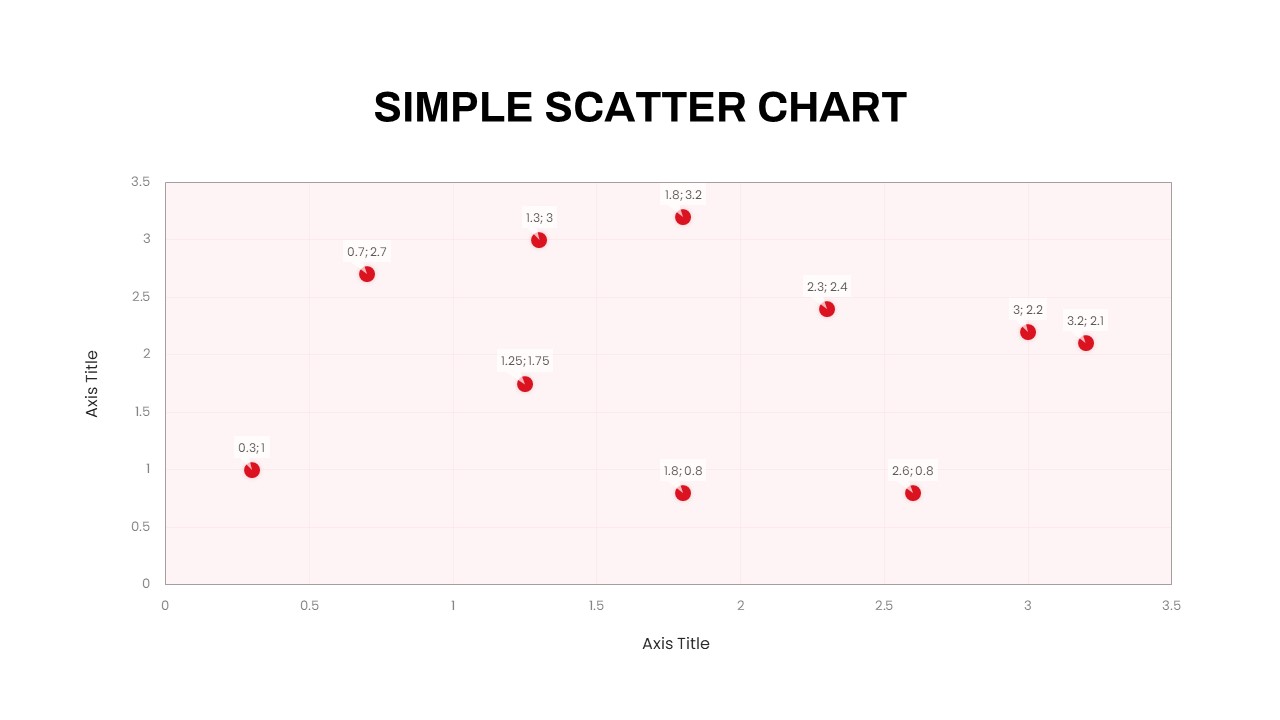
Vertical dot chart PowerPoint template shows the simple method of presenting data points in data set based on the value of each node. Remember that the simplicity and clarity of a dot chart are its key strengths. It is most effective when dealing with relatively small datasets or when the distribution of values is essential to share with the audience. If the dataset is large or contains complex relationships, other chart types like bar charts, line charts, or scatter plots might be more appropriate.
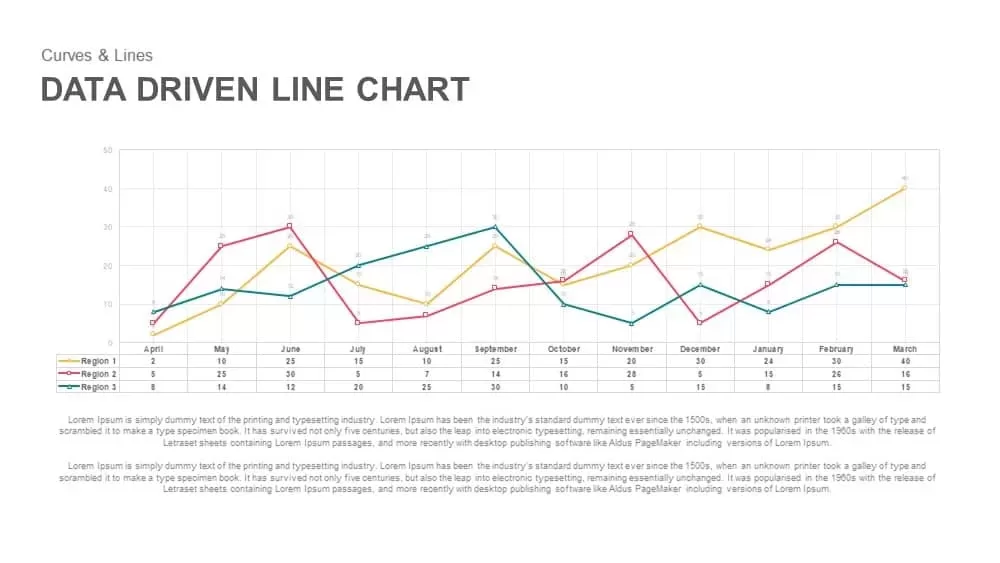
The vertical dot chart template offers an effective way to showcase and compare two data sets. For example, it is an ideal statistical chart for visualizing the rate of interest changes over time, particularly in response to central bank decisions. By employing a dot chart to plot the data series, you can precisely display the fluctuations in interest rates for two distinct periods or entities, such as before and after a central bank policy decision or comparing rates between different financial institutions.
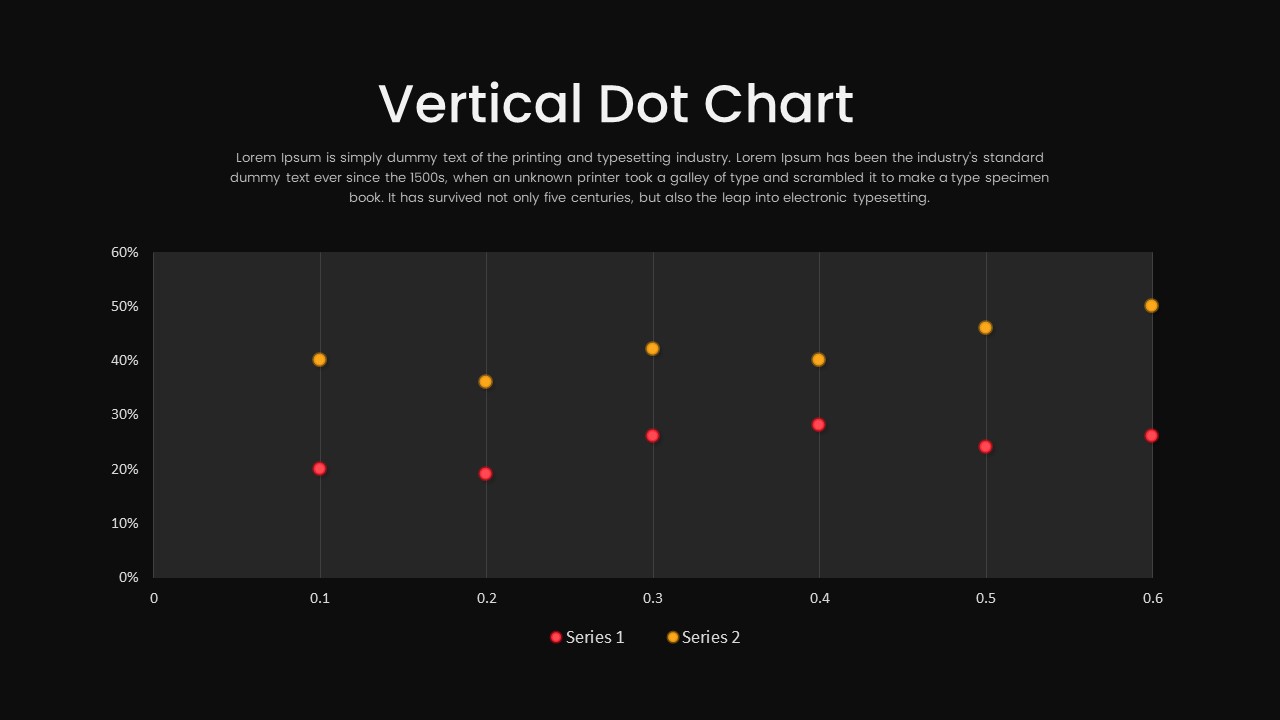
The vertical dot chart PowerPoint template’s layout involves two vertical lines, each assigned a specific color, such as orange and red, to differentiate the two data sets. On these lines, the individual data points are represented by dots, with their vertical positions accurately corresponding to the respective interest rates. The horizontal axis can represent time intervals or specific dates, creating a chronological flow of interest rate changes, and the vertical axis denotes the interest rates in percentage or other suitable units.
This is a One Pager template in light and dark background modes. Whether used for financial analysis, economic research, or policy evaluation, this vertical dot chart template for PowerPoint provides an accessible and informative means of communicating simple data to a broad audience. It can be edited using all major versions of PowerPoint, Keynote, and Google Slides. Feel free to travel across our extensive collections of PowerPoint charts and graphs!
Attached Files
| File | Action |
|---|---|
| https://premiumdownloads.s3.amazonaws.com/SB03714-Vertical Dot Chart PowerPoint Template.ZIP | Download |
Login to download this file
Add to favorites
Add to collection
-

Item ID
SB03714 -

Related Templates
-

Free Vertical PowerPoint Template
PowerPoint Business Templates
Free
-

Nature PowerPoint Presentation Template
PowerPoint Business Templates
Premium
-

Sales Deck Free PowerPoint Template
PowerPoint Templates
Free
-

Research Proposal PowerPoint Template
PowerPoint Templates
Premium
-

Cab Service PowerPoint Template
PowerPoint Templates
Premium
-

Macroeconomics PowerPoint Template
PowerPoint Templates
Premium
-

Free Nursing Capstone PowerPoint Deck
PowerPoint Templates
Free
-

Gym PowerPoint Template
PowerPoint Templates
Premium
-

Free Physical Education PowerPoint Template Deck
Free PowerPoint Templates
Free
-

VET Clinic PowerPoint Template
PowerPoint Templates
Premium
-

Effective Communication PowerPoint Template
PowerPoint Templates
Premium
-

Free Space Minimal Deck Template
PowerPoint Templates
Free
-

Travel Agency PowerPoint Template
PowerPoint Templates
Premium
-

IoT Presentation Template
PowerPoint Templates
Premium
-

Free Economics PowerPoint Template
Free PowerPoint Templates
Free
-

Open Door Policy PowerPoint Template
PowerPoint Templates
Premium
-

PowerPoint Quiz With Timer
PowerPoint Templates
Premium
-

Graph Paper PowerPoint Template Deck
PowerPoint Templates
Premium
-

Free Aviation PowerPoint Template
Free PowerPoint Templates
Free
-

Free Army PowerPoint Template
PowerPoint Templates
Free
-

Free Cartoon PowerPoint Template
Free PowerPoint Templates
Free
-

Customer Experience Loyalty PowerPoint Deck Template
PowerPoint Templates
Premium
-

Free Charity PowerPoint Template Deck
PowerPoint Templates
Free
-

Animated Agriculture PowerPoint Deck Template
PowerPoint Templates
Premium
-

Free Real Estate Listing PowerPoint Template
Free PowerPoint Templates
Free
-

Demographic Transition PowerPoint Template
PowerPoint Templates
Premium
-

Free Event Planning PowerPoint Template
Free PowerPoint Templates
Free
-

Free University Presentation PowerPoint Template
PowerPoint Templates
Free
-

Global Warming Infographic PowerPoint Template Deck
PowerPoint Templates
Premium
-

Free Book Review PowerPoint Template
Free PowerPoint Templates
Free
-

Polka Dot Theme Background PowerPoint Template
PowerPoint Templates
Premium
-

Annual Report PowerPoint Template and Keynote
PowerPoint Templates
Premium
-

Data Science PowerPoint Template
PowerPoint Templates
Premium
-

EFQM Model PowerPoint Template
PowerPoint Templates
Premium
-

Free Dunder Mifflin Paper Company Pitch Deck
Free PowerPoint Templates
Free
-

Real Estate PowerPoint Theme
PowerPoint Themes
Premium
-

Finance Consulting PowerPoint Template
PowerPoint Templates
Premium
-
Financial Review Template for PowerPoint and Keynote
Infographic
Premium
-

Business Process Reengineering Template
PowerPoint Templates
Premium
-

Employee Handbook Templates for PowerPoint & Keynote
Business Models
Premium
-

Free AI Artificial Intelligence PowerPoint Template
PowerPoint Templates
Free
-

Stakeholder Register PowerPoint Template
PowerPoint Templates
Premium
-
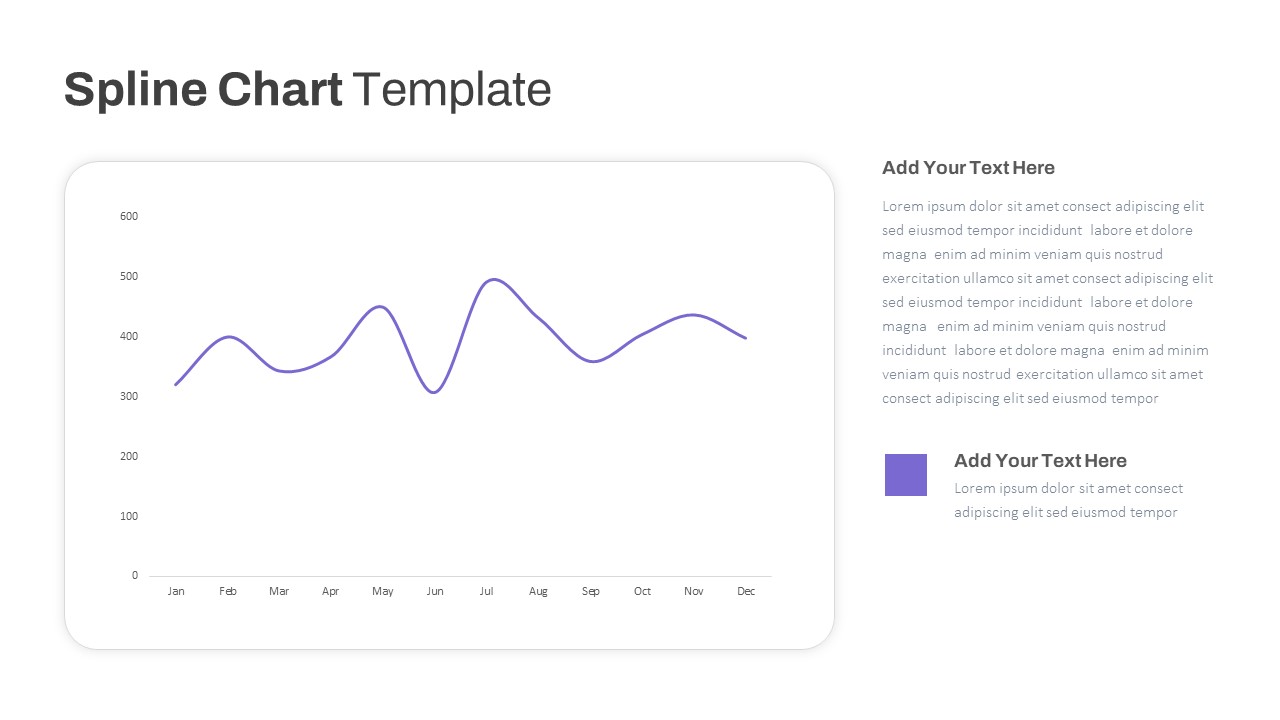
Spline Chart PowerPoint Template
PowerPoint Charts
Premium
-

Animated Upcoming Event Poster PowerPoint Template
PowerPoint Templates
Premium
-

Combination Chart PowerPoint Template
PowerPoint Charts
Premium
-
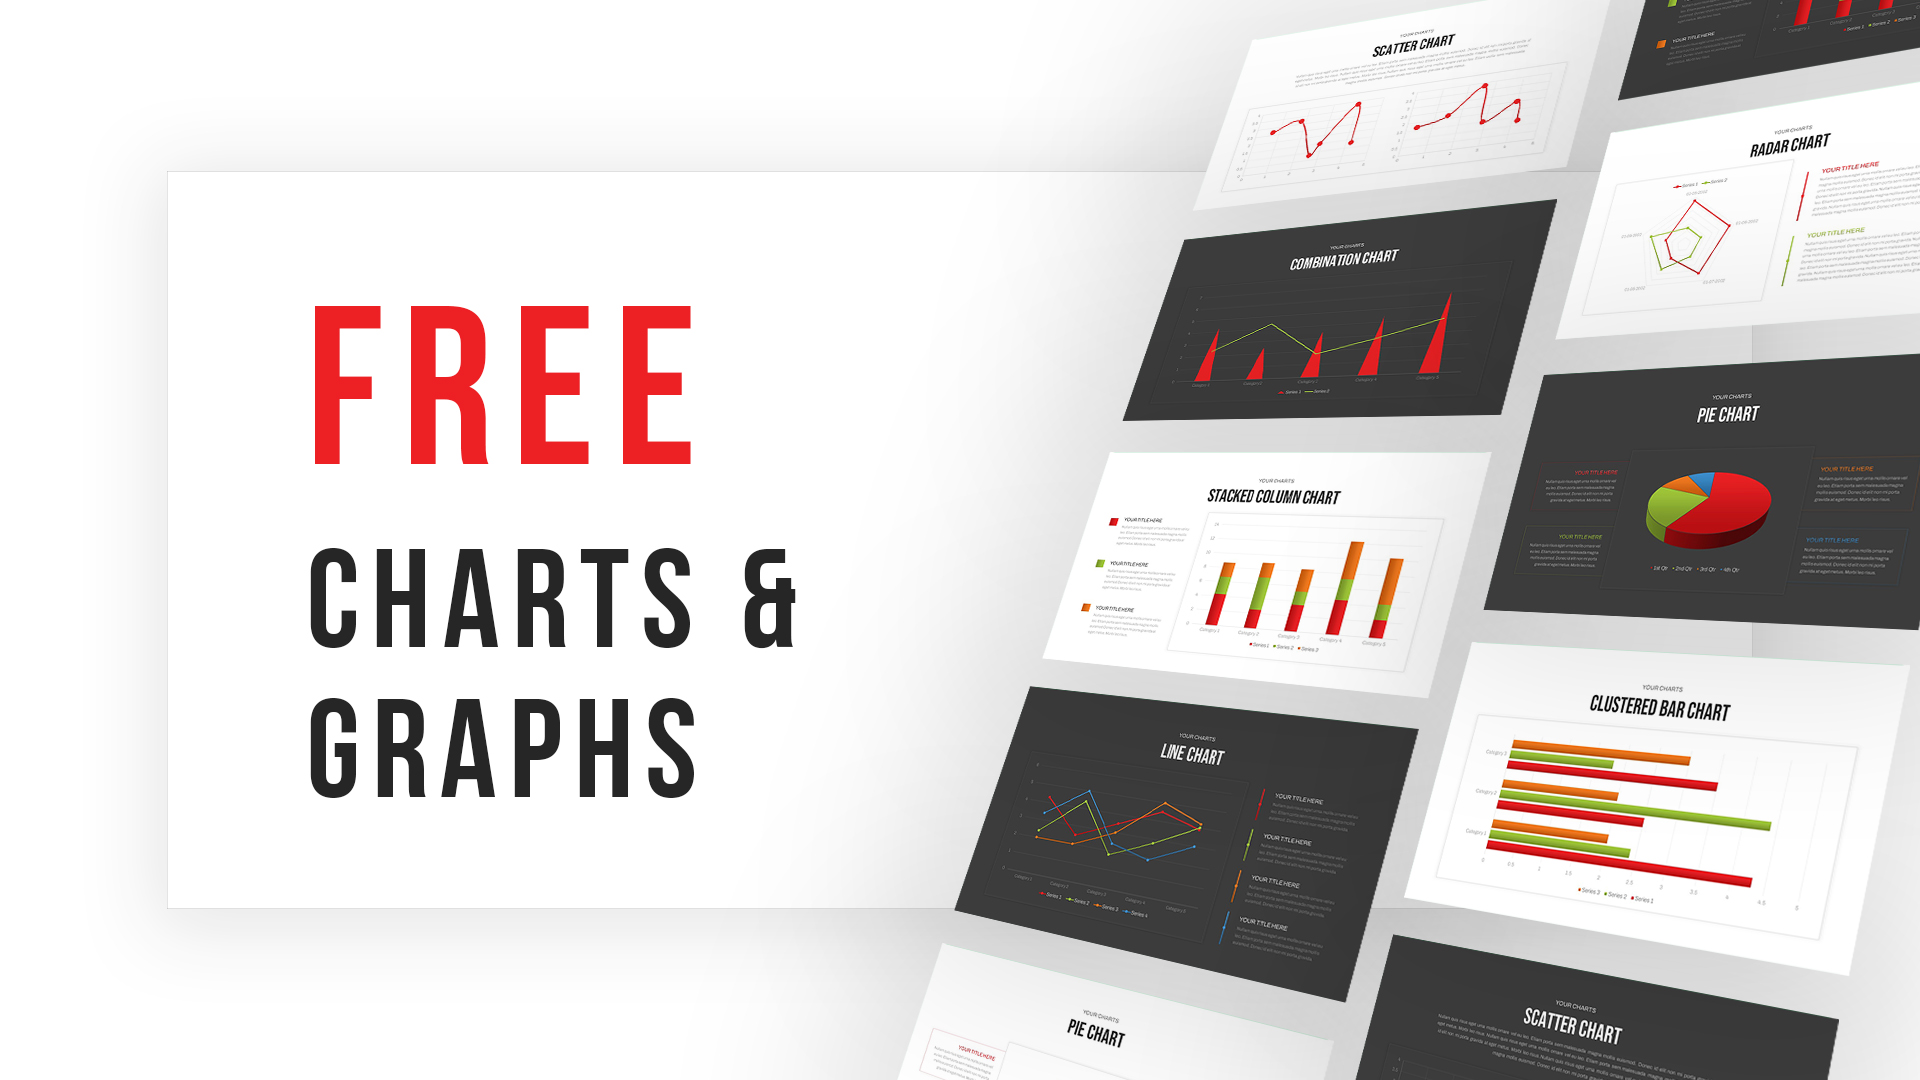
Free Charts & Graphs Deck PowerPoint Template
PowerPoint Templates
Free
-

Clustered Column Chart PowerPoint Template
PowerPoint Charts
Premium
-
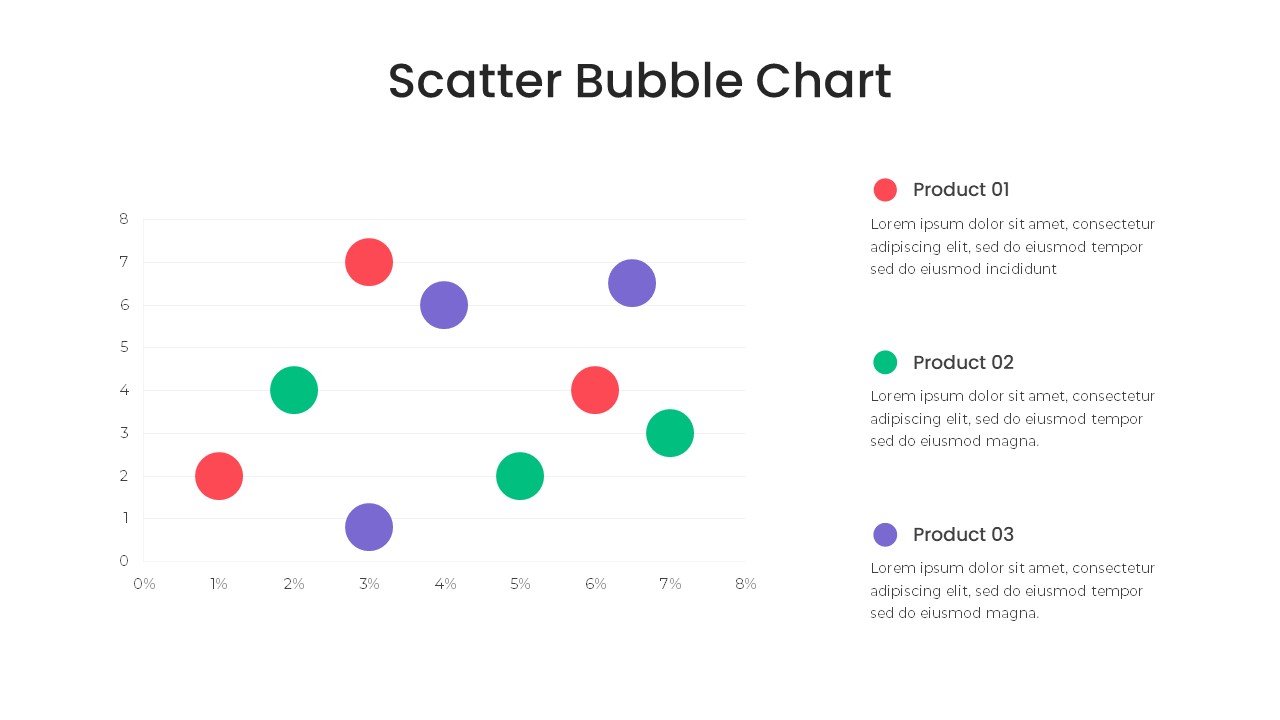
Bubble Chart PowerPoint Template
PowerPoint Templates
Premium
-

Free Charts and Graphs PowerPoint Template
PowerPoint Templates
Free
-
Vertical Process Infographics PowerPoint Templates and Keynote Slides
Process Flow Diagrams
Premium
-
Population Pyramid Chart PowerPoint Template
PowerPoint Templates
Premium
-

Mekko Chart Template
PowerPoint Templates
Premium
-

Proportional Area Chart PowerPoint Template
PowerPoint Templates
Premium
-

Area Chart PowerPoint Template
PowerPoint Charts
Premium
-
Key Financial Ratios PowerPoint Template
PowerPoint Templates
Premium
-

Biotechnology PowerPoint Presentation Template
PowerPoint Templates
Premium
-
Four Quadrant Scatter Chart PowerPoint Template
PowerPoint Charts
Premium
-
Data Driven Line Chart Template for PowerPoint & Keynote
Curves and Lines
Premium
-
Clustered Bar Chart PowerPoint Template
Column and Bar chart
Premium
-
Financial Statement PowerPoint Template
PowerPoint Templates
Premium
-
Connect The Dots PowerPoint Template
Mind Map PowerPoint Template
Premium
-

Smart Bank Isometric PowerPoint Template
PowerPoint Templates
Premium
-
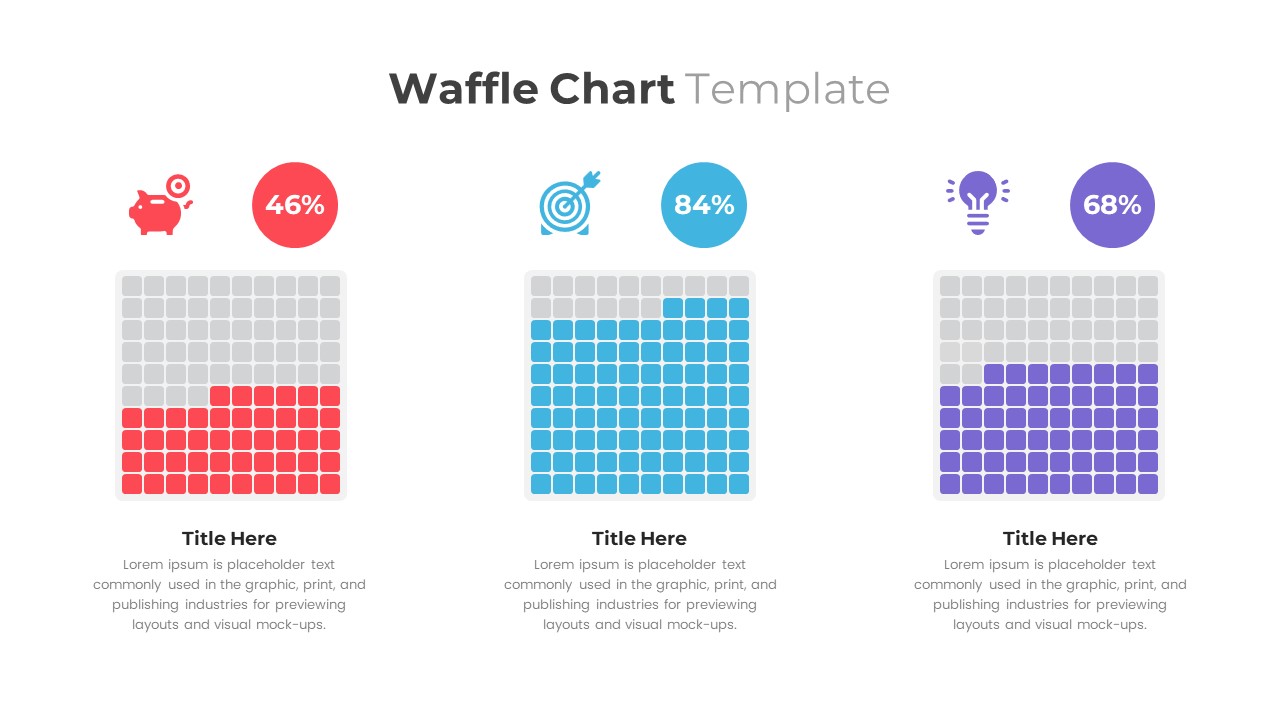
Waffle Chart PowerPoint Template
PowerPoint Templates
Premium
-
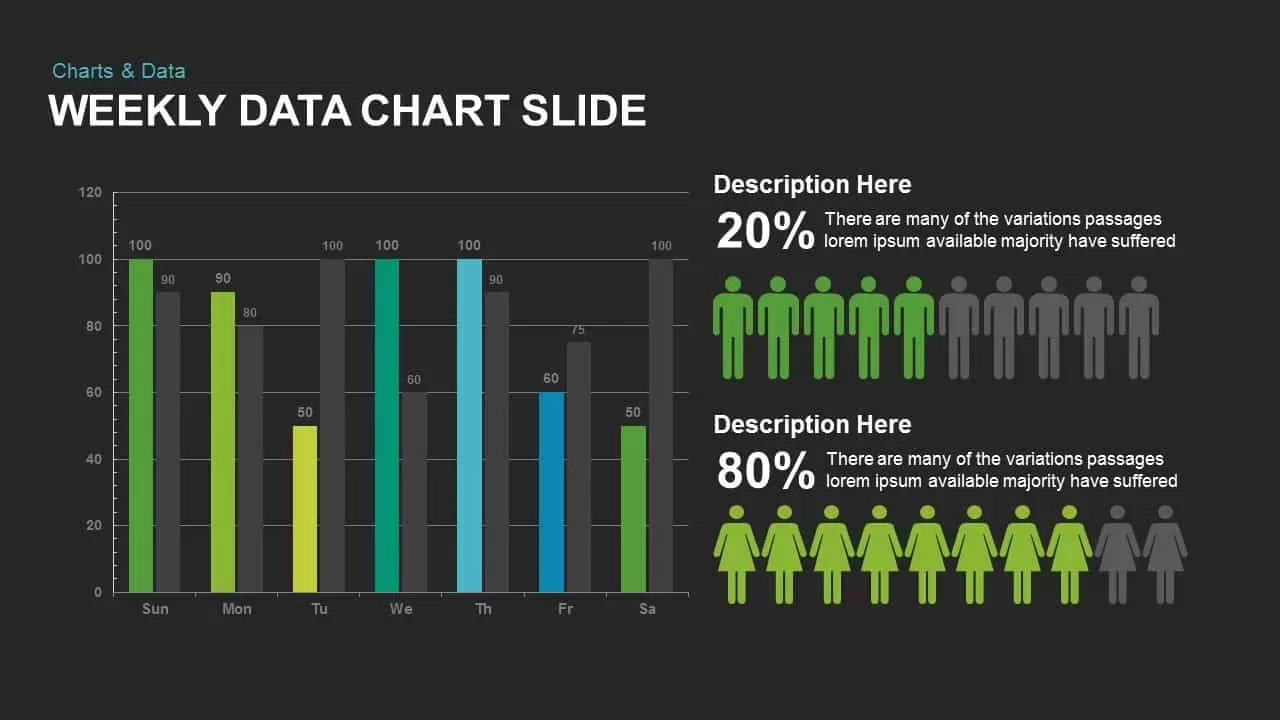
Weekly Data Charts PowerPoint Presentation Template and Keynote Slide
Infographic
Premium
-
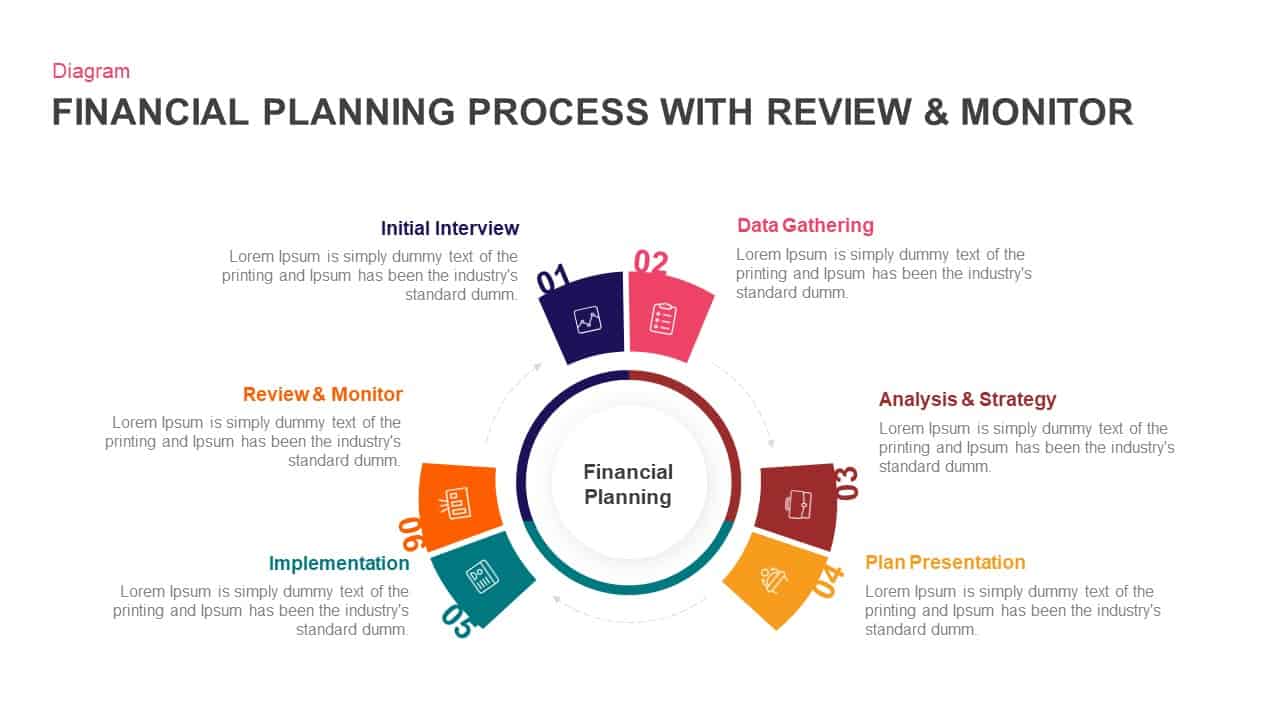
Financial Planning Process With Review and Monitor Template for PowerPoint & Keynote
Business Models
Premium
-
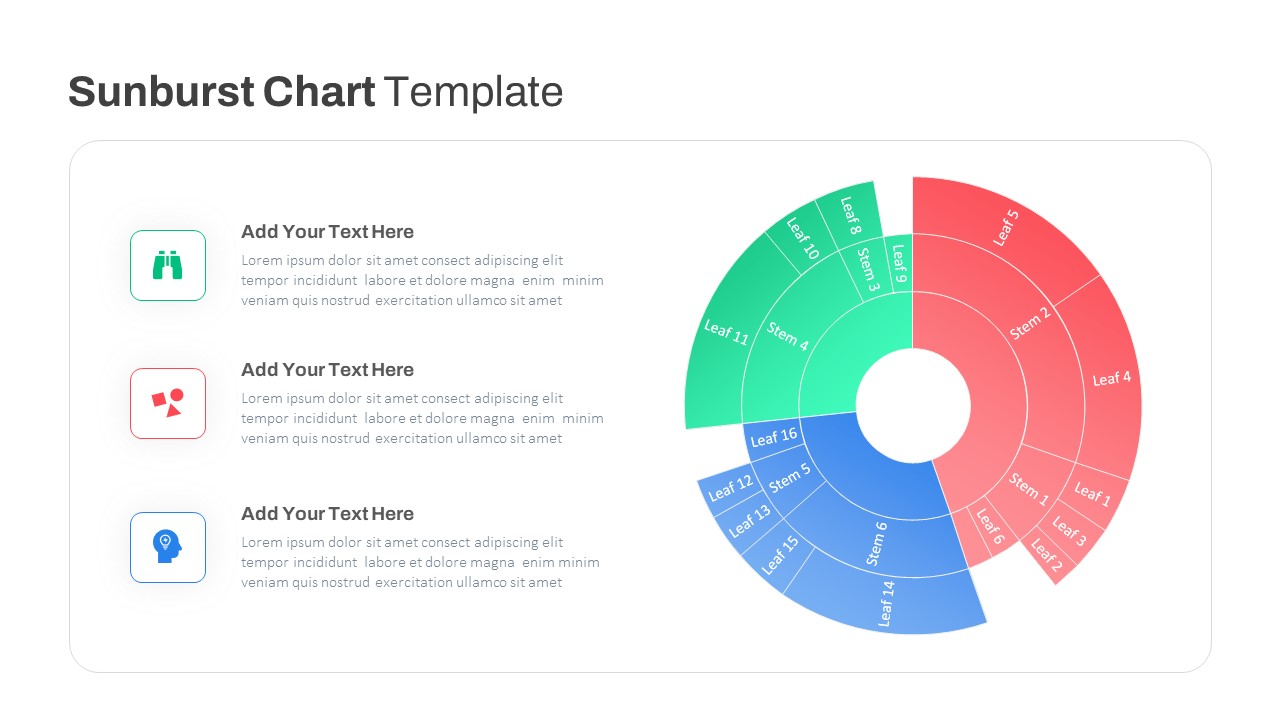
Sun Burst Chart PowerPoint Template
Circular Diagrams
Premium
-
Multiple Line Chart PowerPoint Template
PowerPoint Charts
Premium
-
Segmented Scatter Chart PowerPoint Template
PowerPoint Charts
Premium
-
Stacked Area Chart PowerPoint Template
PowerPoint Charts
Premium
-
Cost Cutting PowerPoint Template
Infographic
Premium
-

Power Analogy Metaphor PowerPoint Template
Metaphor, Simile & Analogy
Premium
-
Simple Scatter Chart PowerPoint Template
PowerPoint Charts
Premium
-

Connect The Dots Slide for PowerPoint
Keynote Templates
Premium
-
Vertical Roadmap PowerPoint Template
Infographic
Premium
-
Jump Line Chart PowerPoint Template
Column and Bar chart
Premium
-
Grouped Column Chart PowerPoint Template
Column and Bar chart
Premium
-
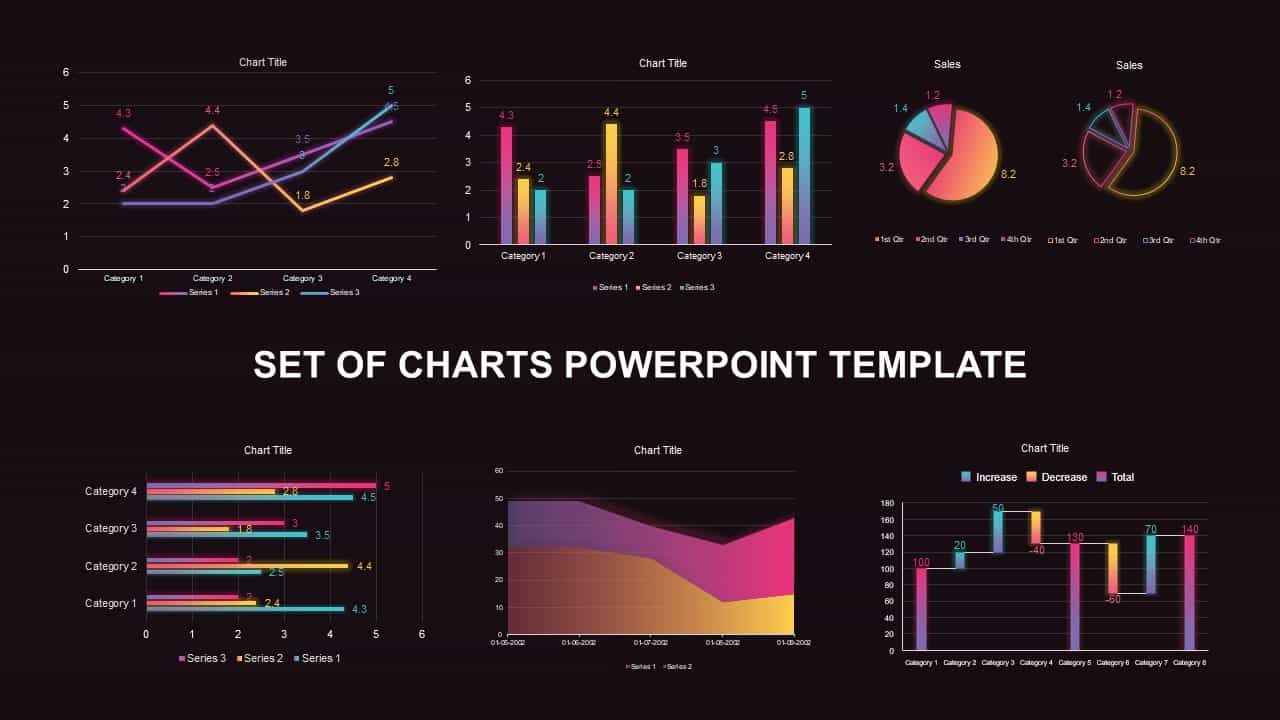
Set of Chart PowerPoint Template and Keynote Diagram
PowerPoint Charts
Premium
-
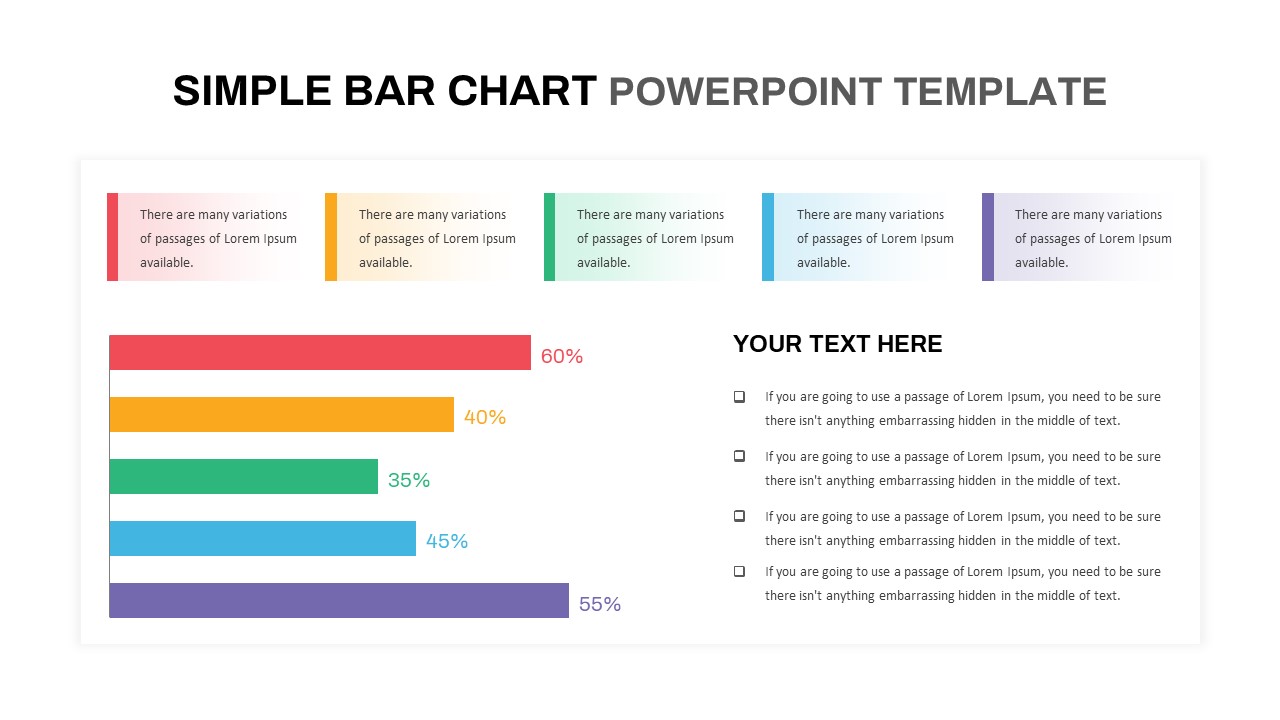
Simple Bar Chart PowerPoint Template
Column and Bar chart
Premium
-

Credit Card PowerPoint Template
PowerPoint Templates
Premium
-

Creative Bar Chart Data Analysis PowerPoint Template and Keynote
Infographic
Premium
-

Attendance Policy Template
Infographic
Premium
-

Animated Clustered Bar Chart PowerPoint Template
PowerPoint Charts
Premium
-
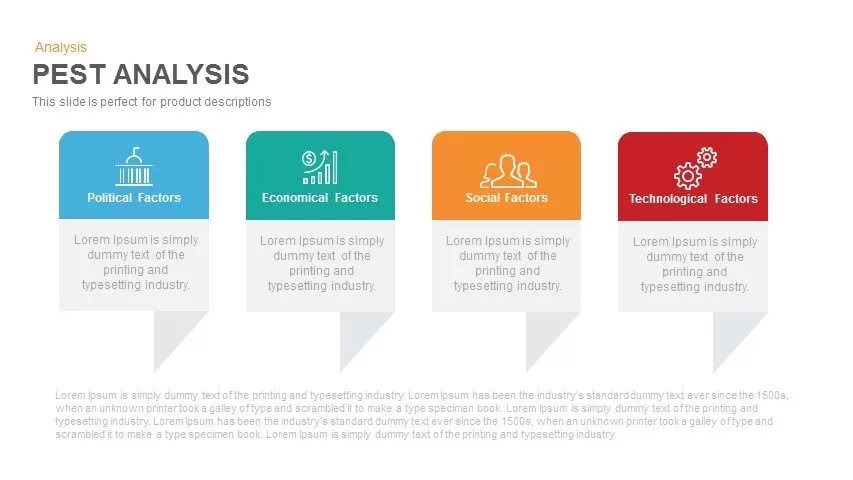
PEST Analysis PowerPoint Template and Keynote Slide
Business Models
Premium
-
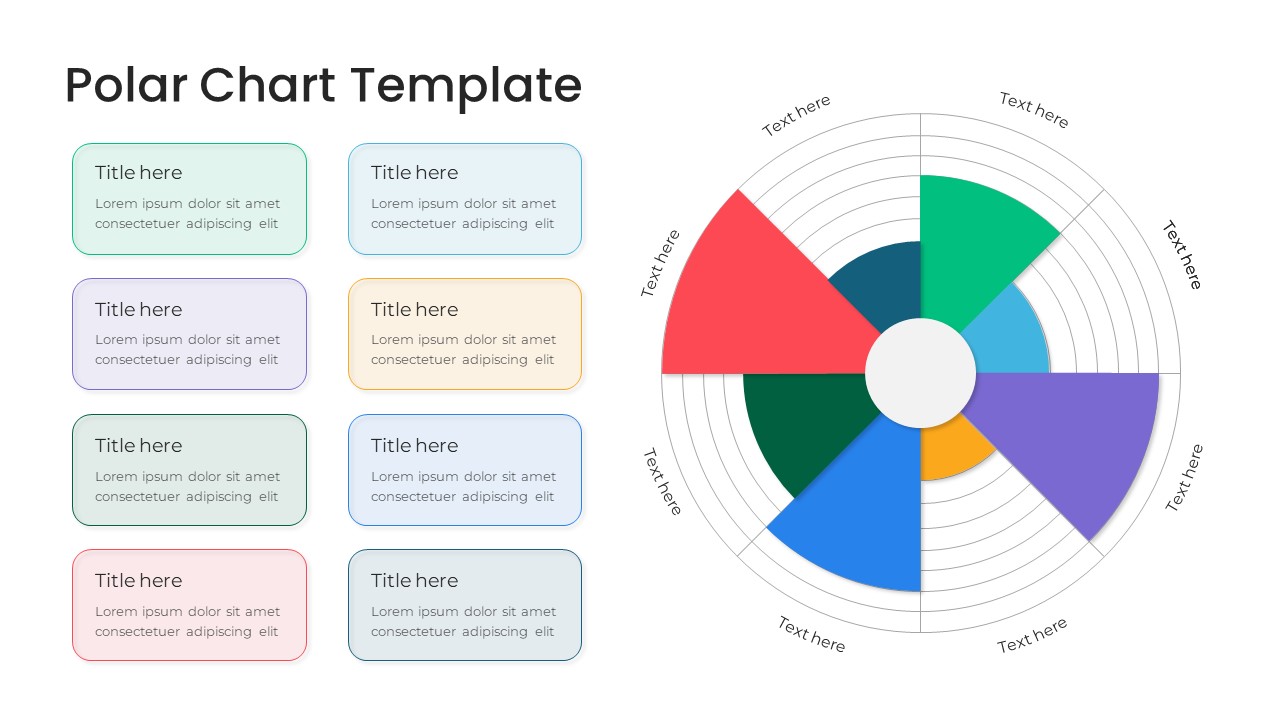
Polar Chart PowerPoint Template
PowerPoint Templates
Premium
-

Radial Bar Chart PowerPoint Templates and Keynote Slides
PowerPoint Charts
Premium
-

Multipurpose Business PowerPoint Template
PowerPoint Business Templates
Premium
-
Free PowerPoint Book Template
Free slides
Free
-
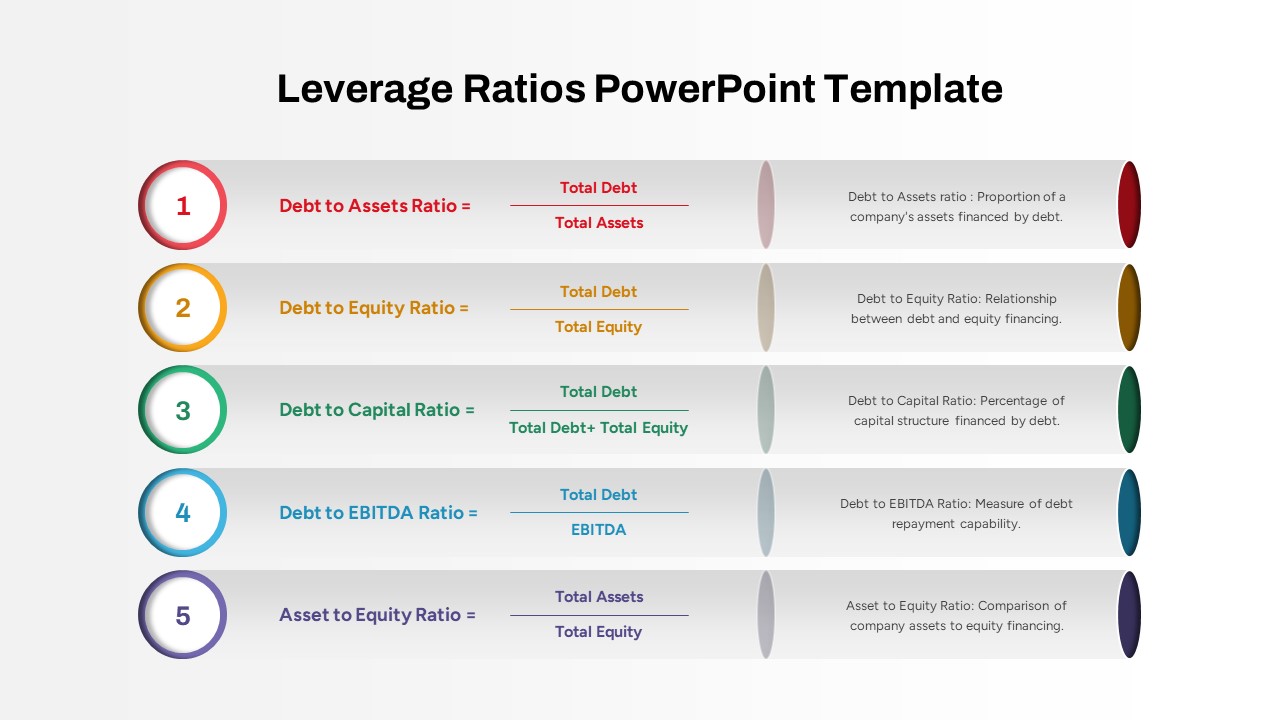
Leverage Ratios PowerPoint Template
PowerPoint Templates
Premium
-
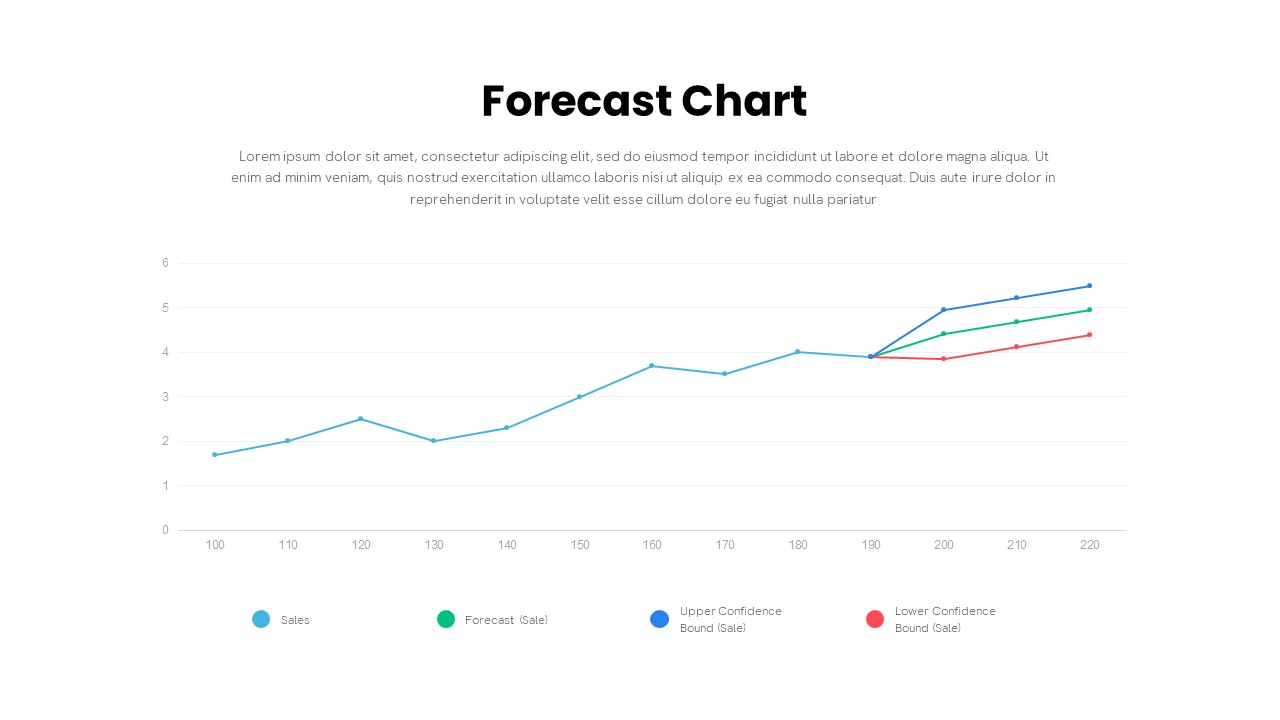
Forecast Chart PowerPoint Template
PowerPoint Charts
Premium
-
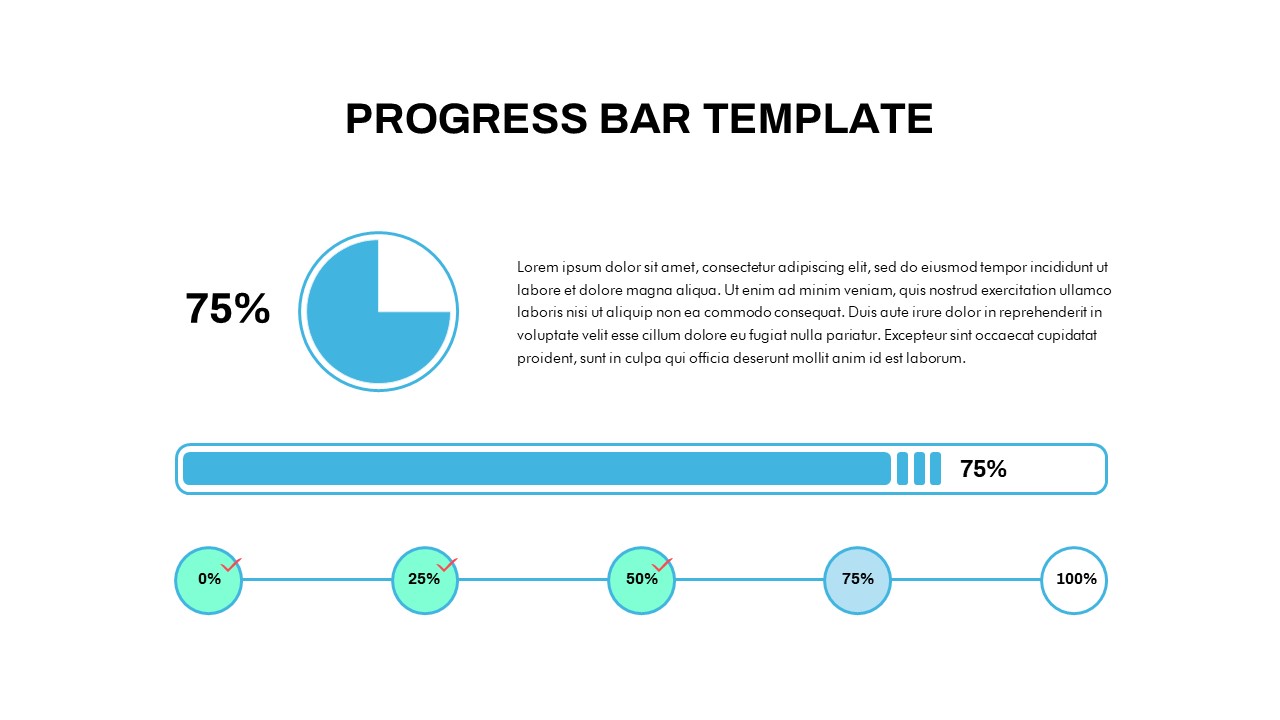
Progress Bar Chart PowerPoint Template
PowerPoint Templates
Premium
-
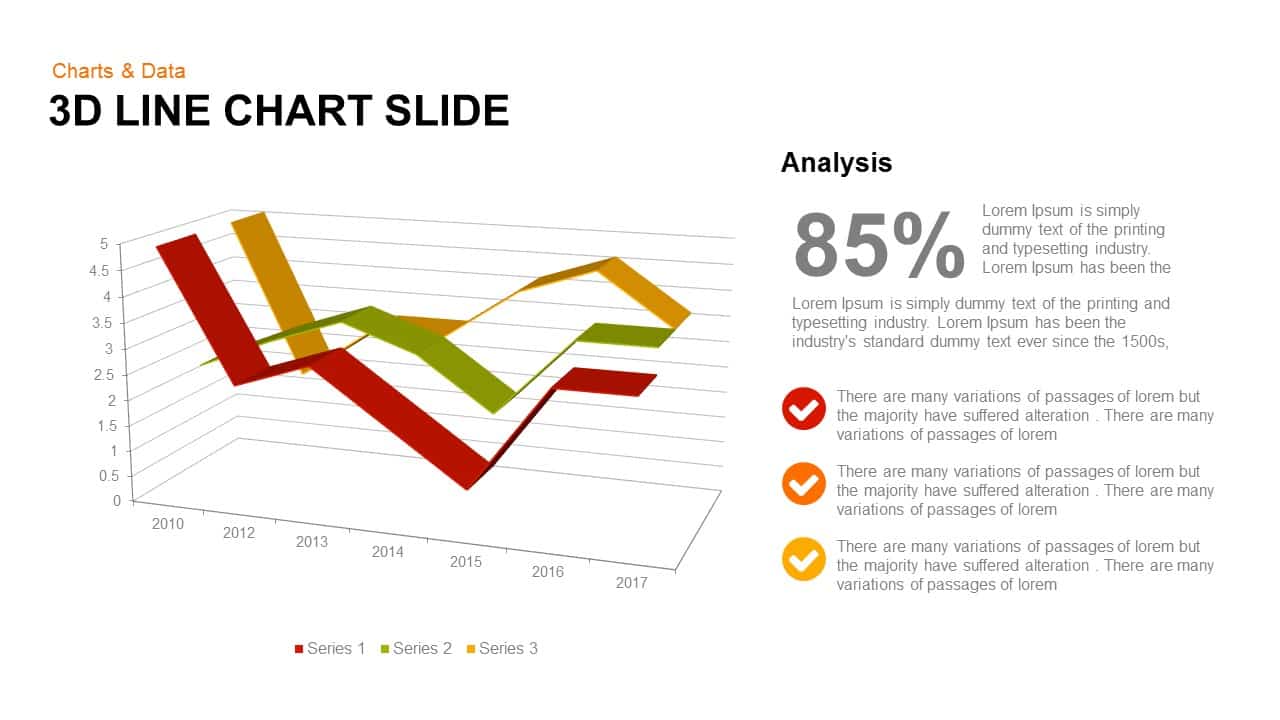
3d Line Chart PowerPoint Template and Keynote Slide
3D Shapes
Premium
-
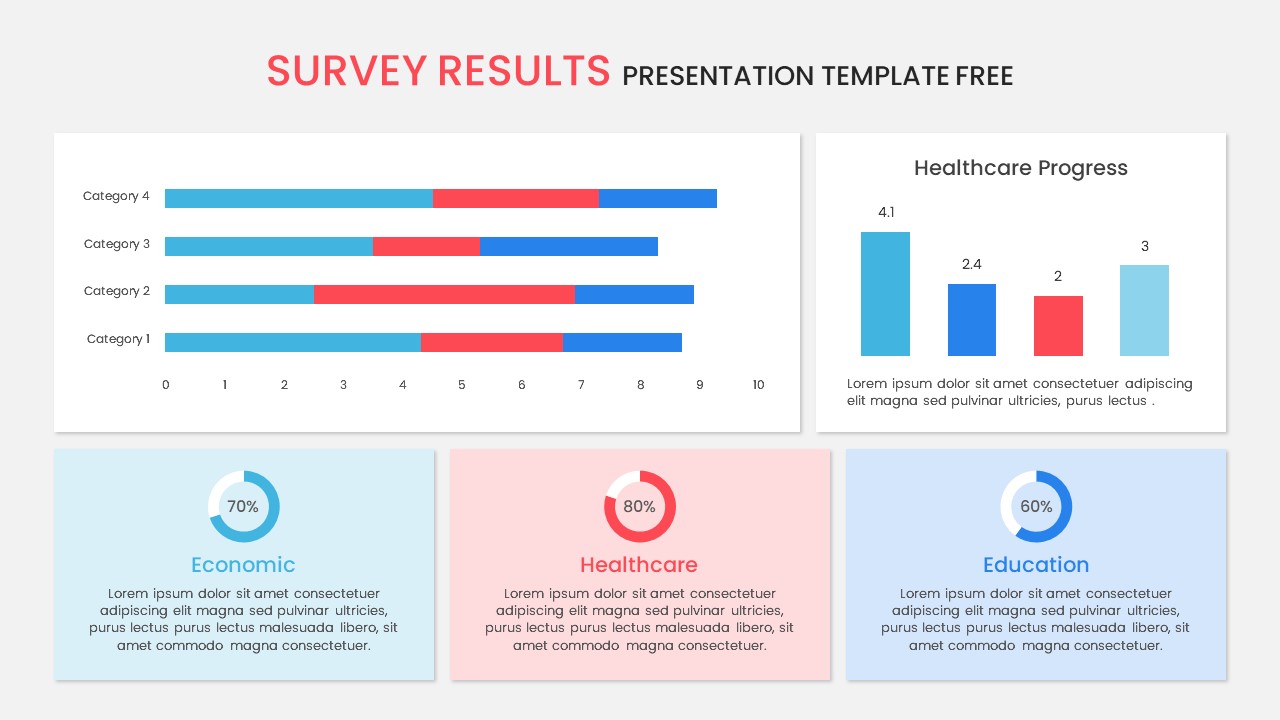
Survey Results PowerPoint Template Free
Free PowerPoint Templates
Free
-
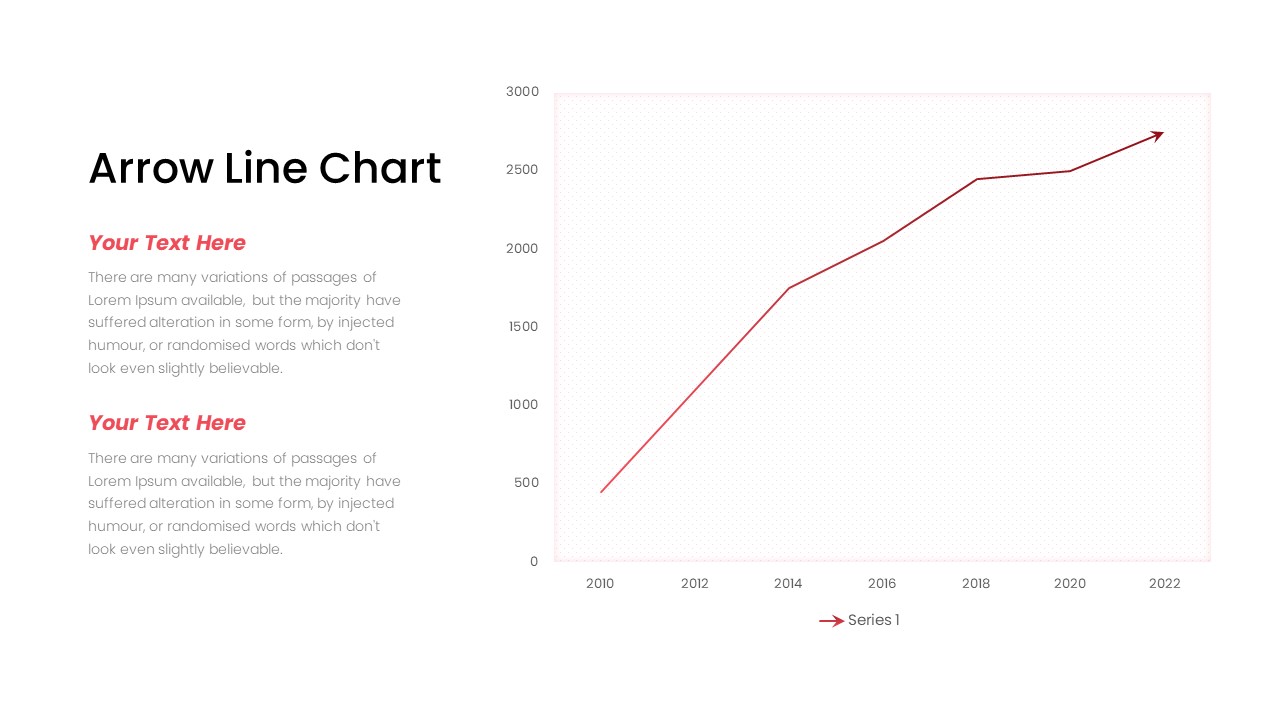
Arrow Line Chart PowerPoint Template
Arrow Diagrams
Premium
-
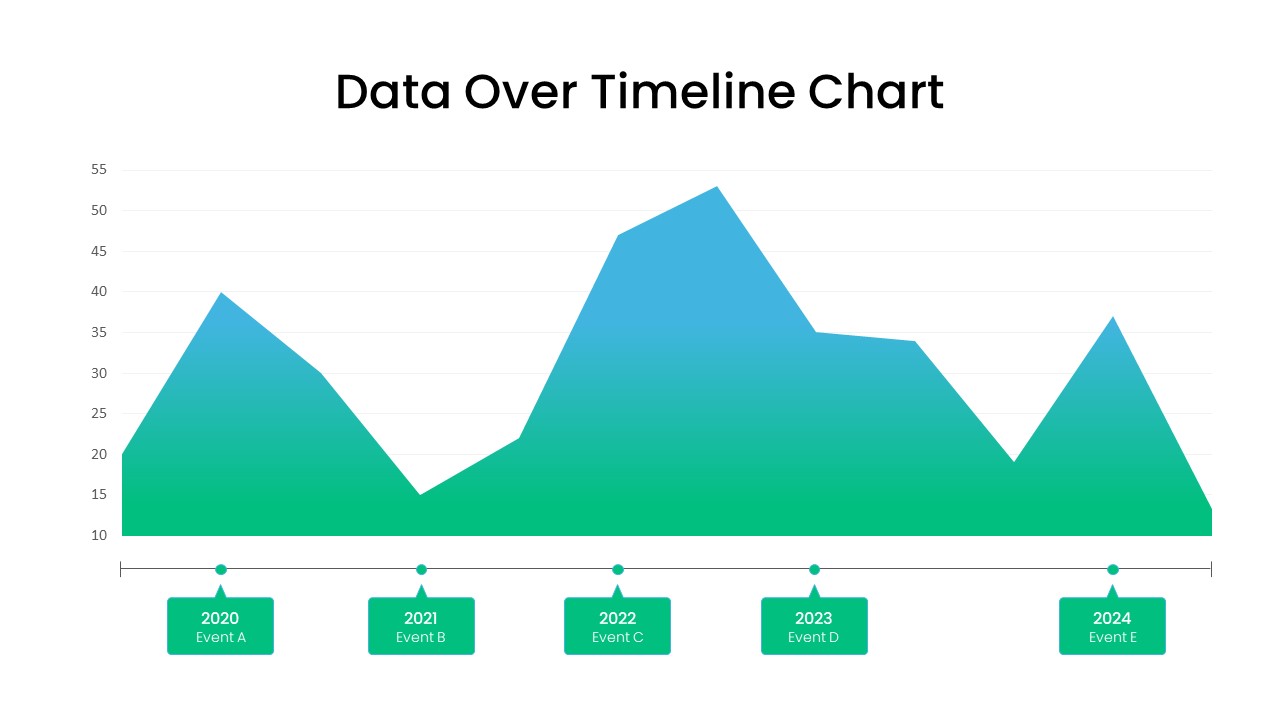
Data Over Time Line Chart PowerPoint Template
PowerPoint Charts
Premium
-
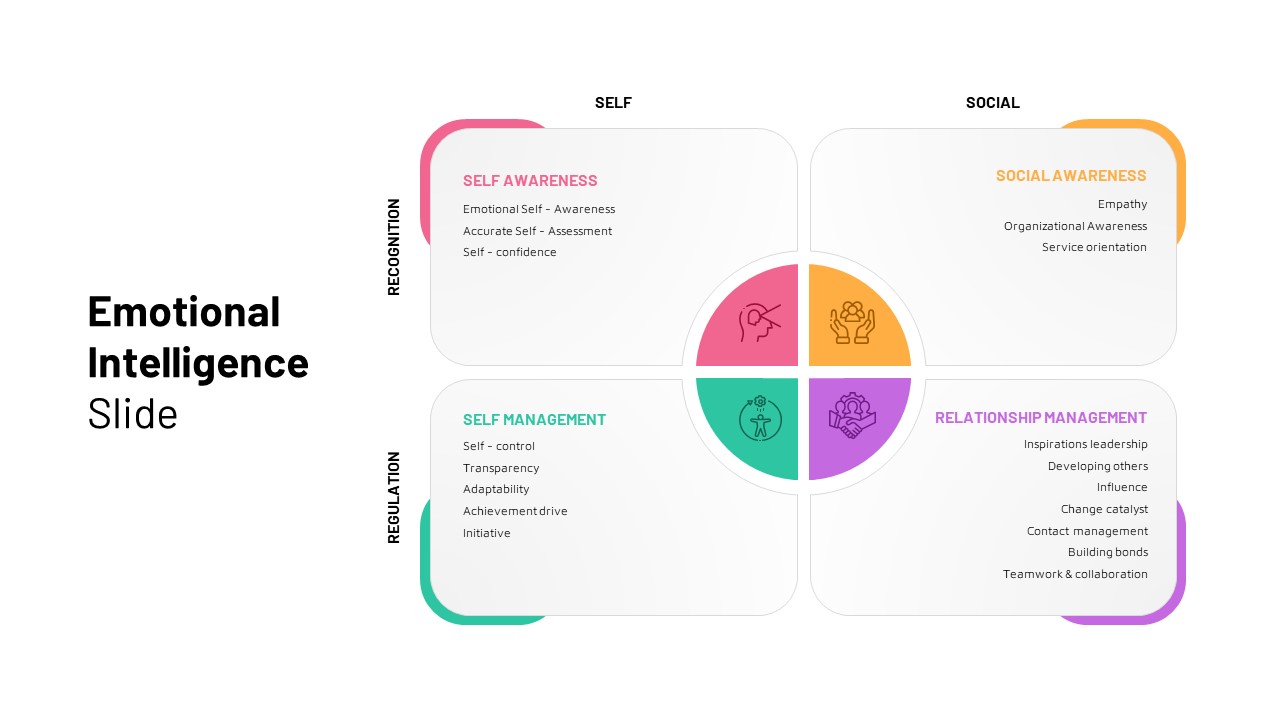
Emotional Intelligence Slide
PowerPoint Templates
Premium
-

Financial Report Metaphor PowerPoint Presentation Template
Metaphor, Simile & Analogy
Premium
-
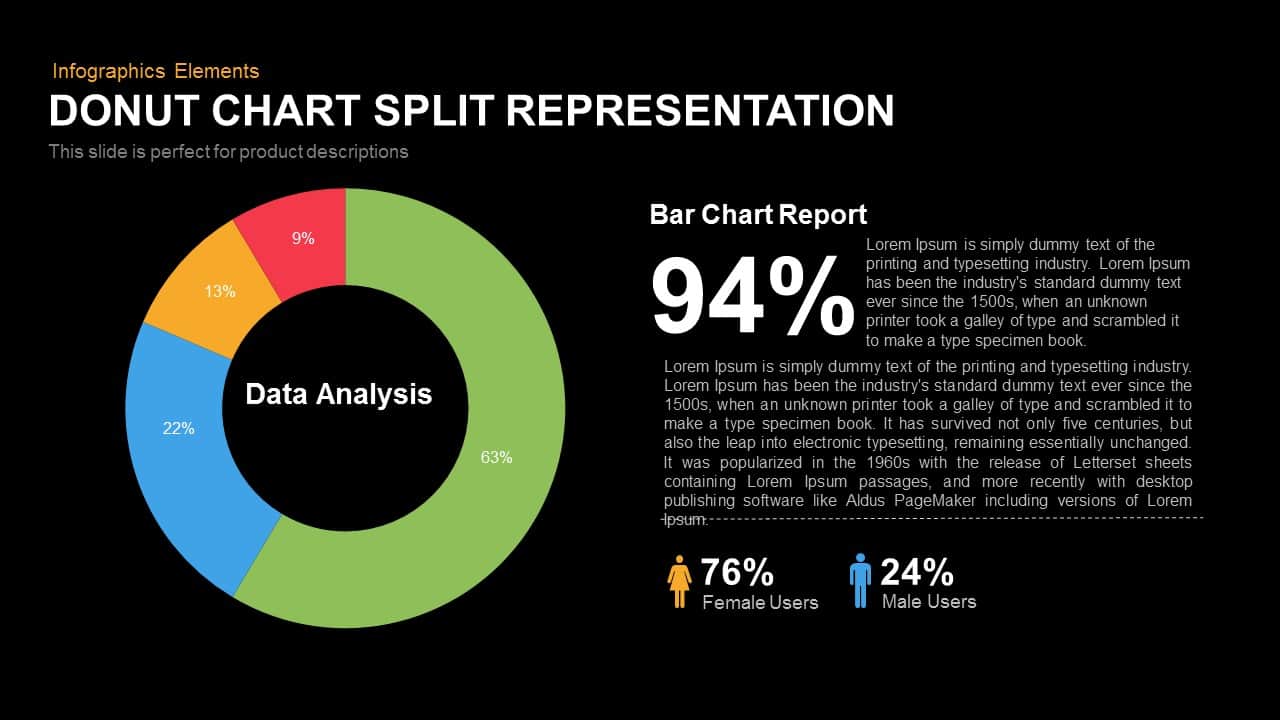
Split Representation Donut Chart Template for PowerPoint and Keynote
Keynote Templates
Premium
-
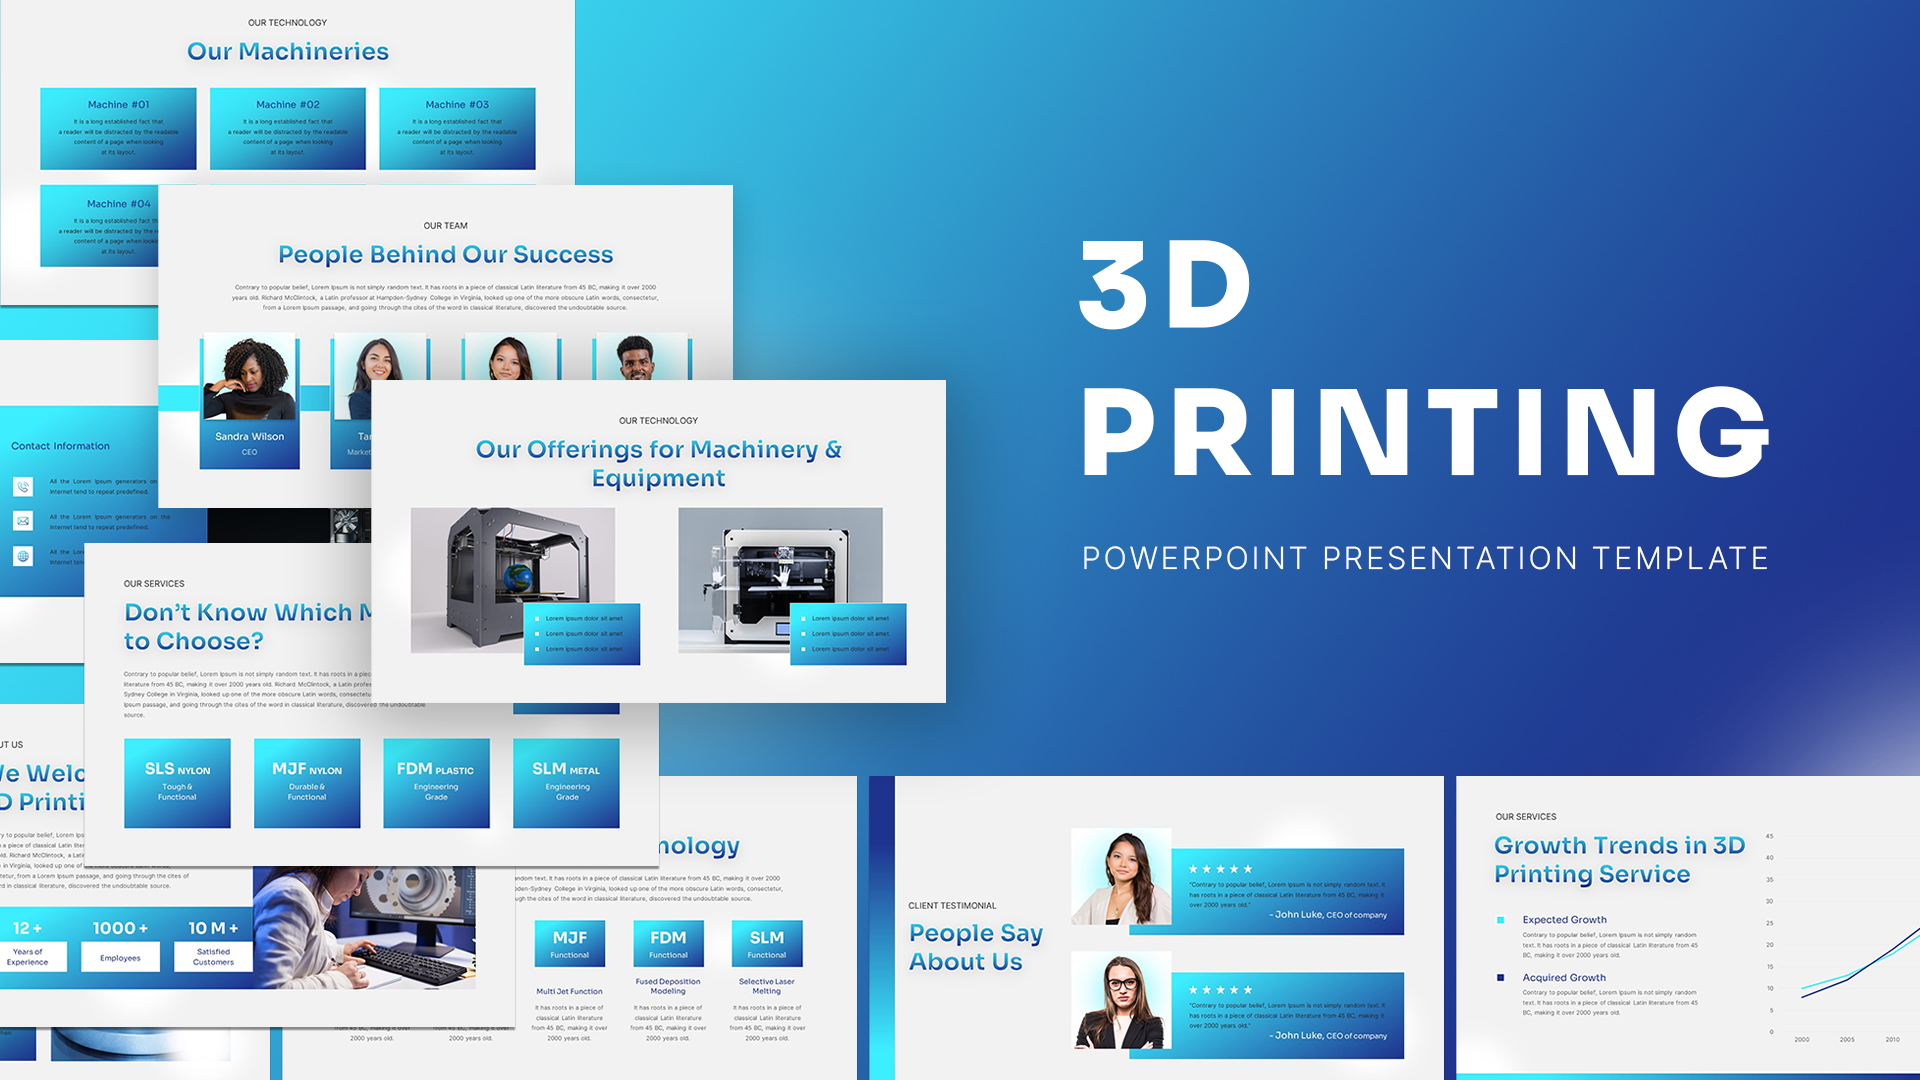
3D Printing Deck PowerPoint Template
PowerPoint Templates
Premium
-
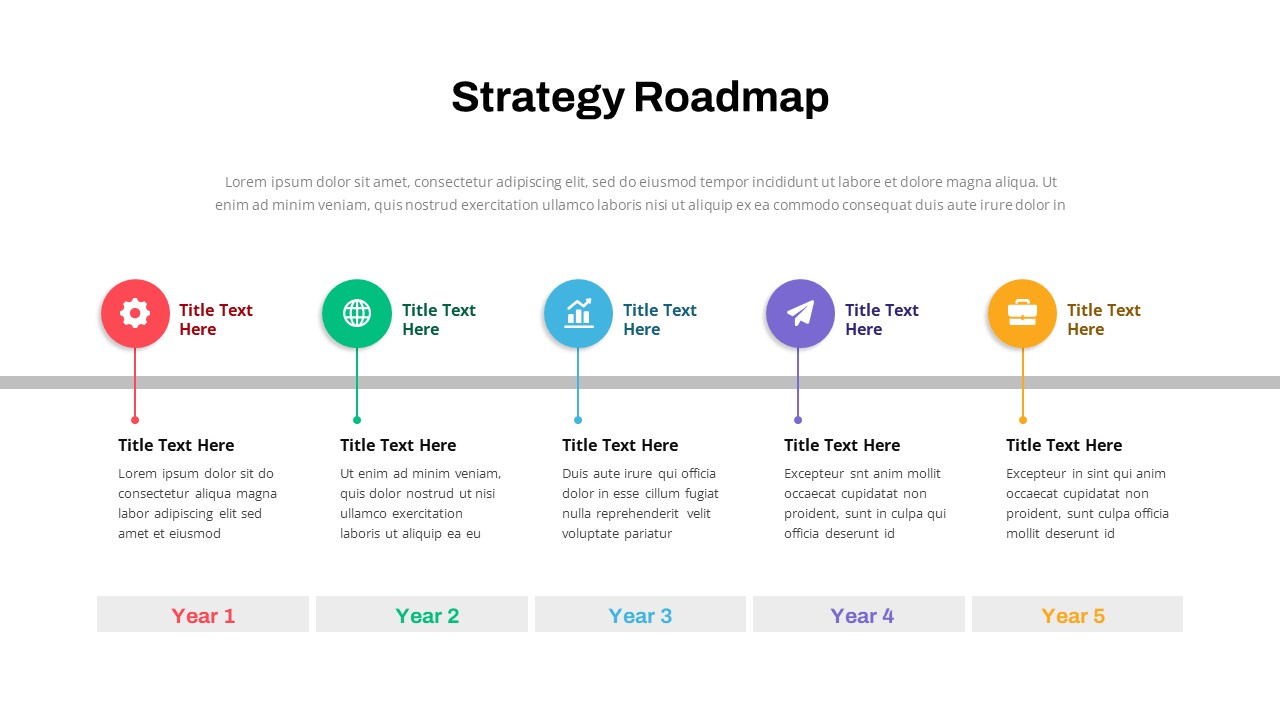
Data Strategy Roadmap PowerPoint Template
PowerPoint Templates
Premium
-

Corporate PowerPoint Presentation Template
PowerPoint Business Templates
Premium