


Venn Diagram infographic PowerPoint Template
- Version
- Download 226
- File Size 0.00 KB
- File Count 1
- Create Date August 30, 2019
- Last Updated July 27, 2024
Venn Diagram infographic PowerPoint Template
Venn Diagram Infographic PowerPoint Template
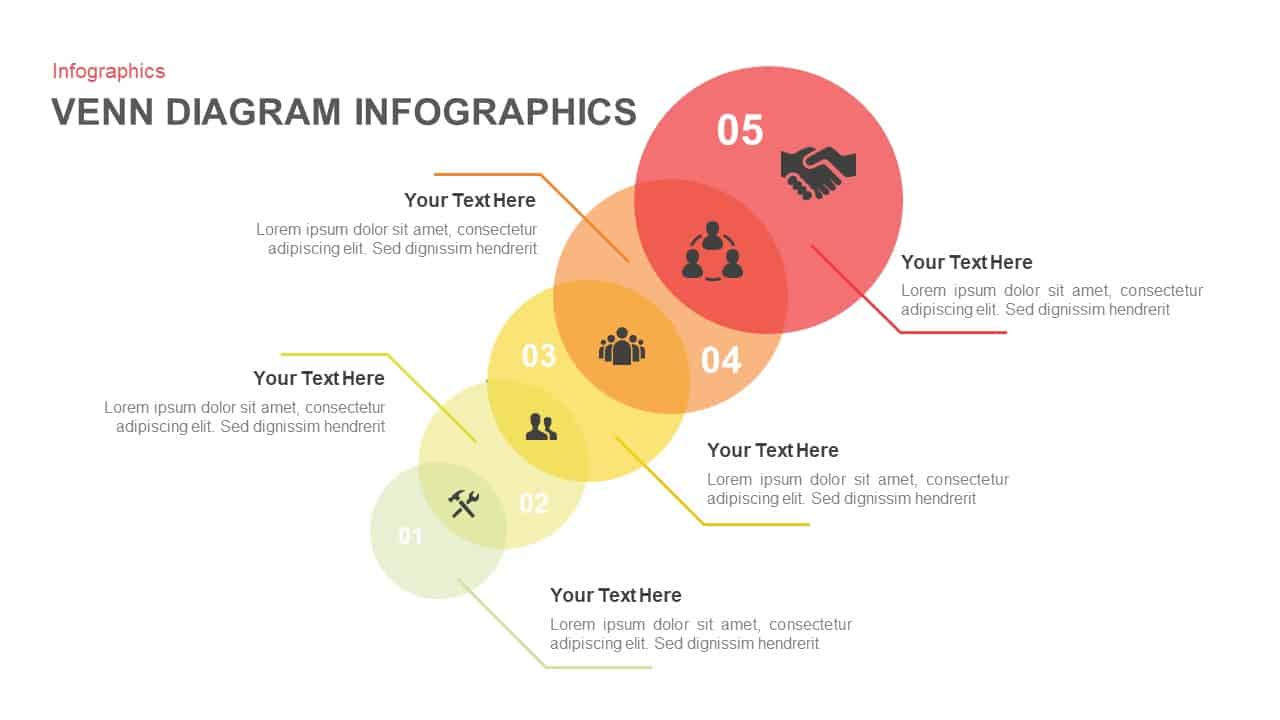
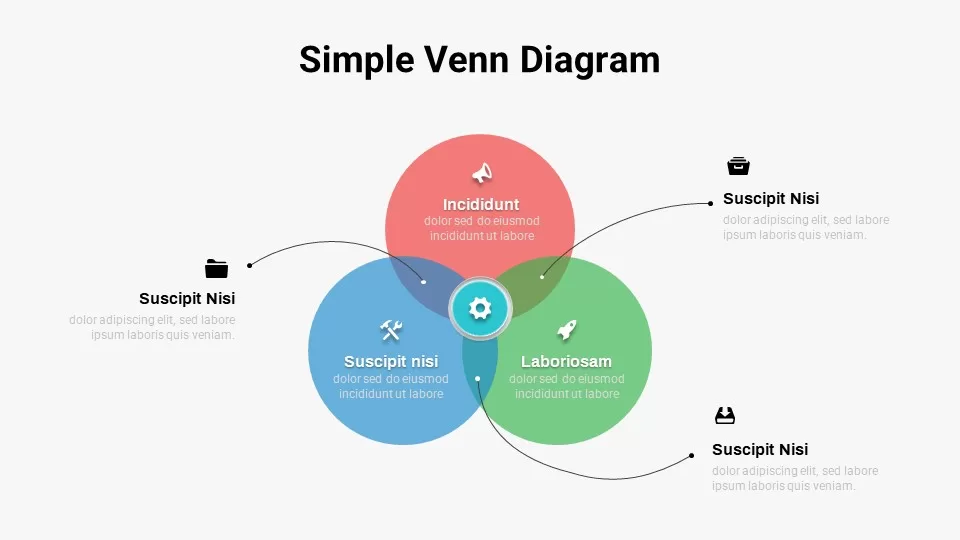
The intersected circle Venn diagram infographic template is perfect for problem-related presentations. You can simply present your mathematical variables using the Venn diagram PowerPoint slide. A Venn diagram is a schematic way of demonstrating the elements of a group or a set. Usually, Venn diagrams show the relations of 2 or 3 sets. But this infographics Venn diagram is useful to show 5 sets of related variables. The PowerPoint presentation template is ideal for illustrating dependencies. The intersection of these circles represents all those elements that are present in the sets. The design is entirely different from a typical Venn diagram. Our Venn diagram infographic PowerPoint template and keynote slide is a pure Venn diagram that you can download from our gallery as well. The Venn diagram infographic template created by the step-by-step layout helps the user produce the concepts in an arranged manner. It can also be used as an evolutionary timeline to show the historical growth of your company with prioritized elements. The varying size of the looping circles is fit for showing financial or sales growth as well. You can access more Venn Diagram PowerPoint templates & free PowerPoint templates here. Grab the free Venn diagram template now!
Each intersecting circle PowerPoint contains PowerPoint icons and numbers. The users can make changes in the metaphor icons according to their presentation theme. This mathematical representation is an easy way to demonstrate the logical relationship between seemingly unrelated ‘sets’ of different groups of things. This PowerPoint slide is perfect for any professional user looking to illustrate five interrelated subjects and their concomitant outcomes. Pictorial representation of sets represented by closed figures is called set diagrams or Venn diagrams. Researchers and teachers can use this PowerPoint diagram to display the relationship between variables. This Venn diagram template shows the sequential relationship of the items.
The infographic Venn diagram PowerPoint template is a flat vector template of 2 slides. It offers text areas for all five segments. The thin lines focusing on the text areas enable the audience to distinct presentation topics. The users can edit infographic icons and shapes using customization options.
Attached Files
| File |
|---|
| https://premiumdownloads.s3.amazonaws.com/SB01455-Venn Diagram Infographics.zip |
Login to download this file
Add to favorites
Add to collection
-

Item ID
SB01455 -

Related Templates
-
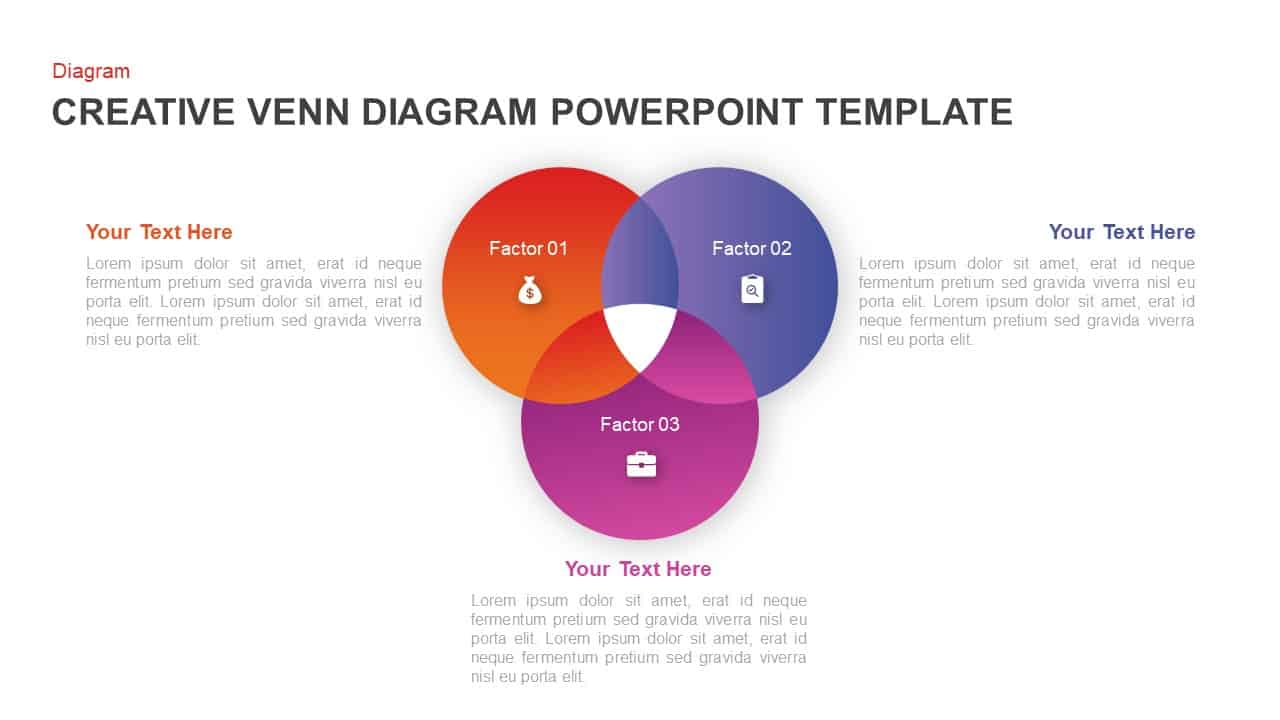
Creative Venn Diagram Template for PowerPoint & Keynote
Circular Diagrams
Premium
-
Venn Diagram PPT Template and Keynote Slide
Diagrams
Premium
-
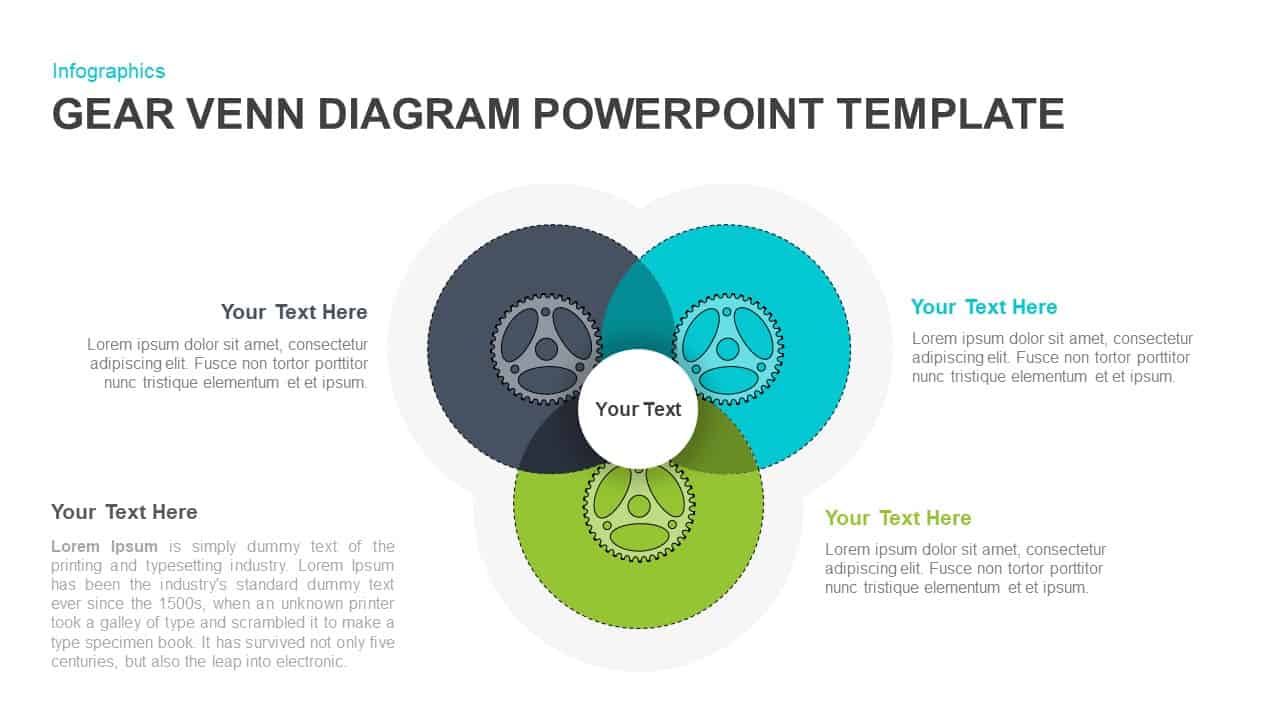
Gear Venn Diagram PowerPoint Template
Business Models
Premium
-
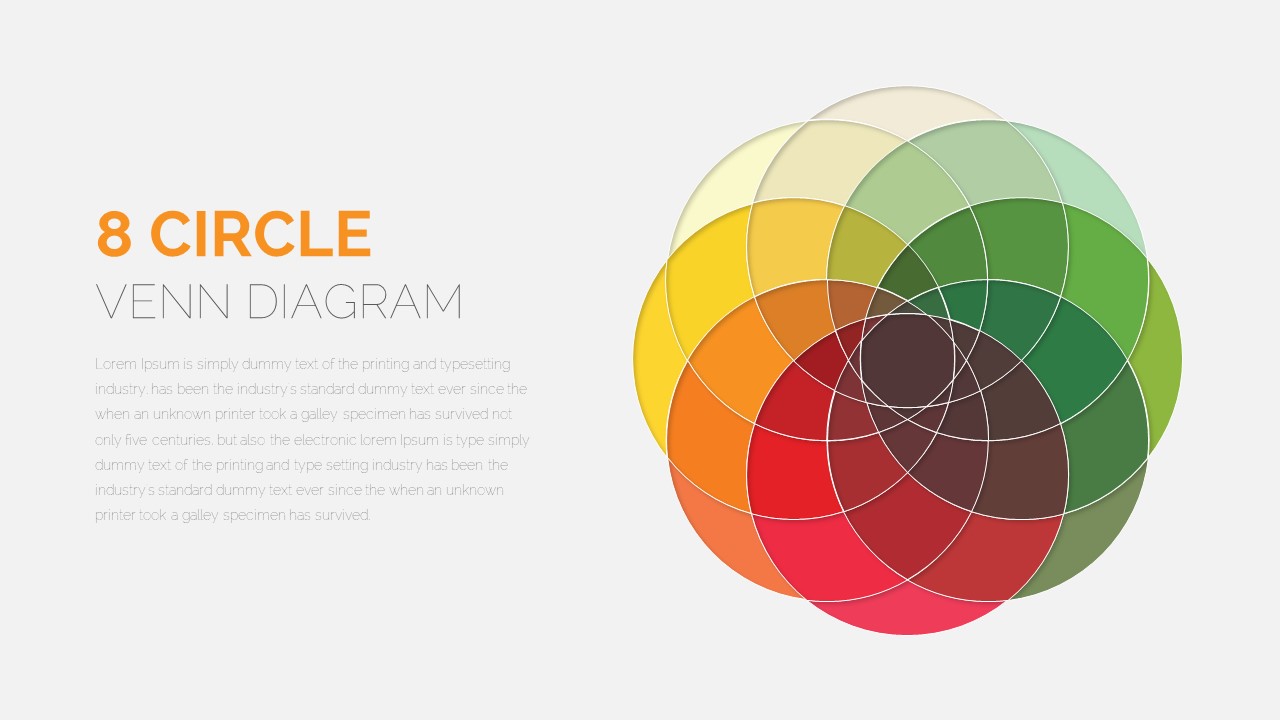
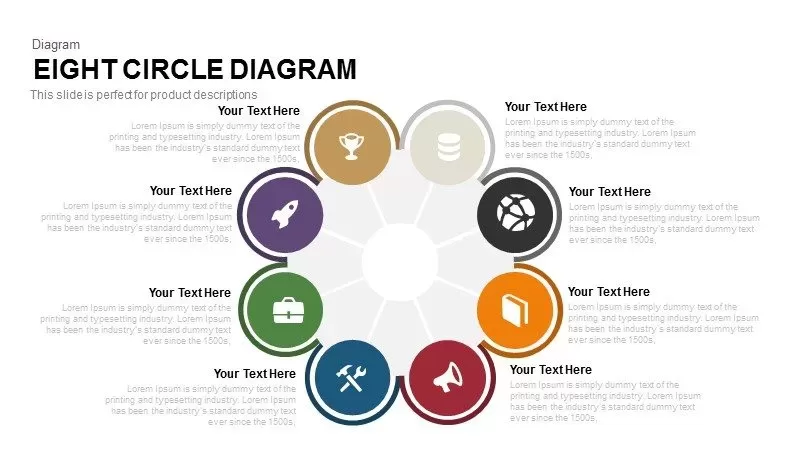
8 Circle Venn Diagram PowerPoint Template
PowerPoint Templates
Premium
-
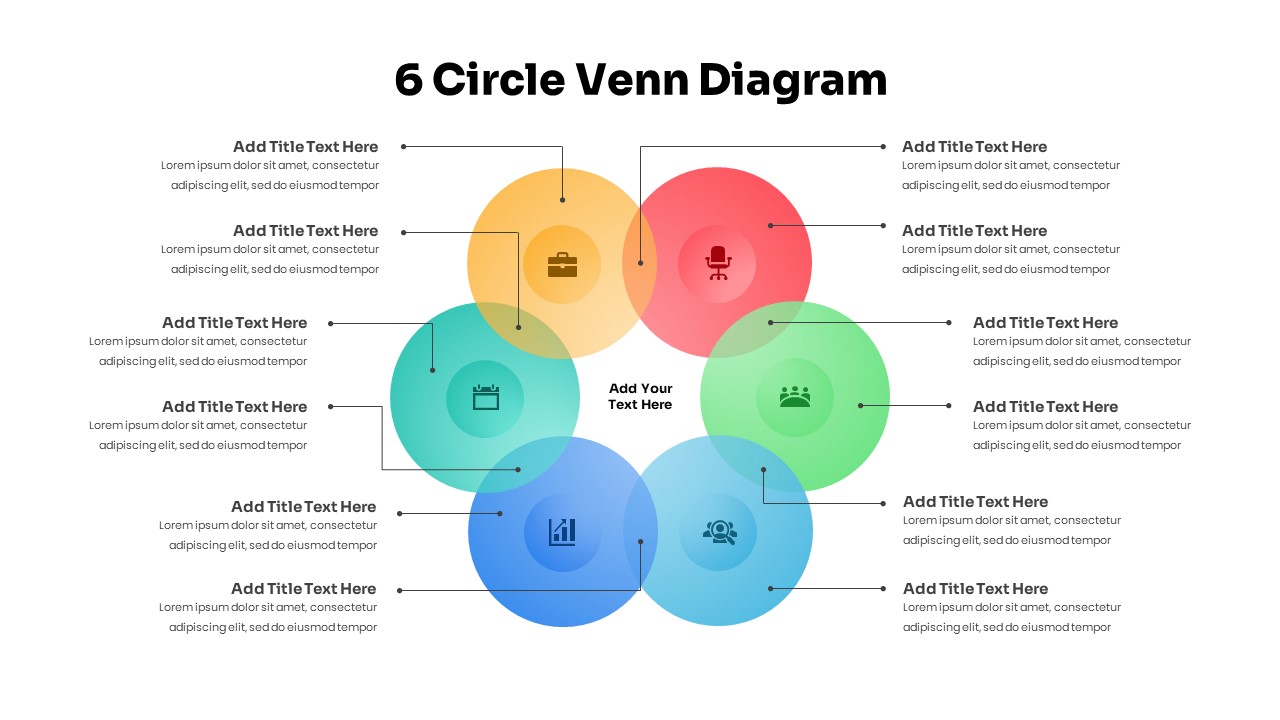
6 Circle Venn Diagram PowerPoint Template
PowerPoint Templates
Premium
-
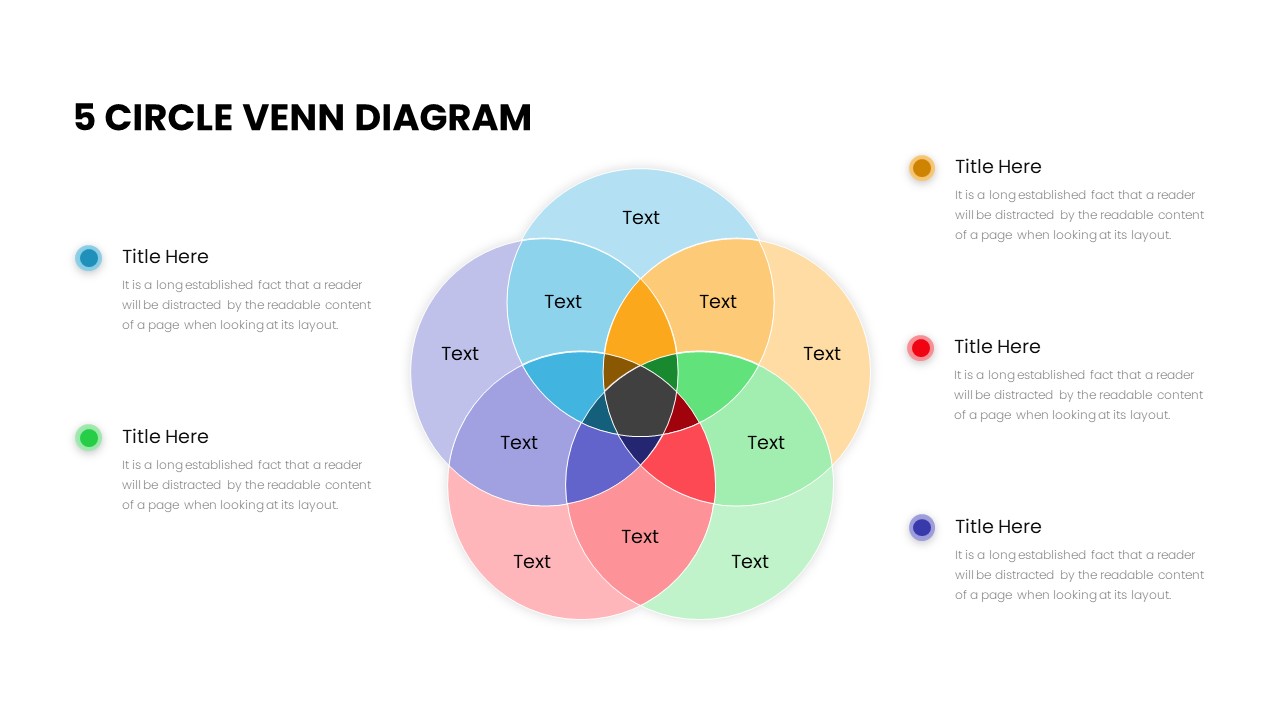
5 Circle Venn Diagram PowerPoint Template
Diagrams
Premium
-
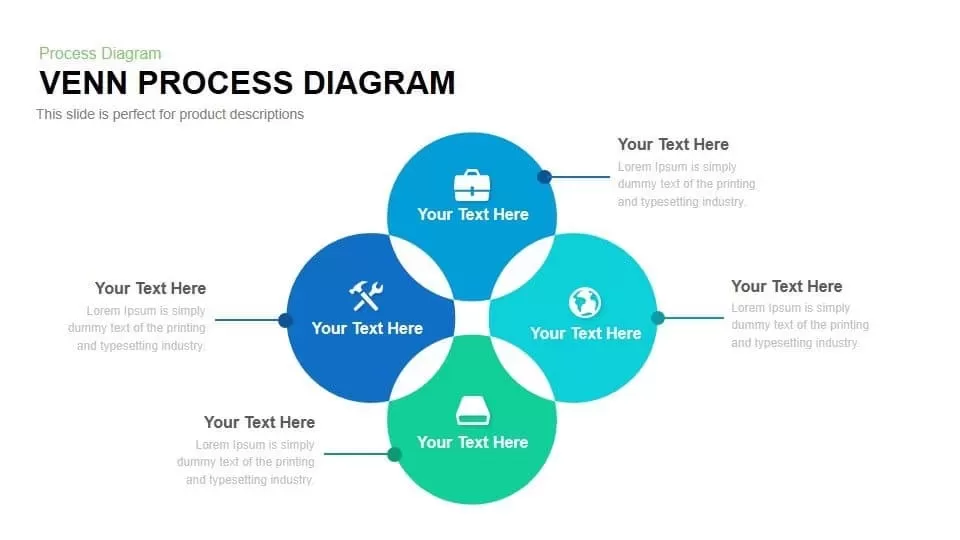
Venn Diagram Process PowerPoint Template and Keynote Slide
Diagrams
Premium
-
Free Simple Venn Diagram PowerPoint Template
Free PowerPoint Templates
Free
-
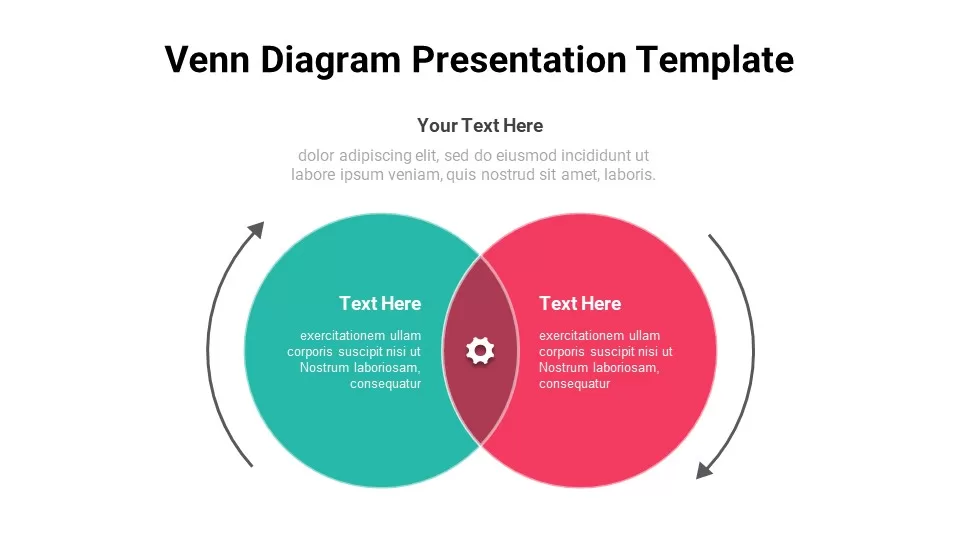
Free Venn Diagram Presentation Template
Infographic
Free
-
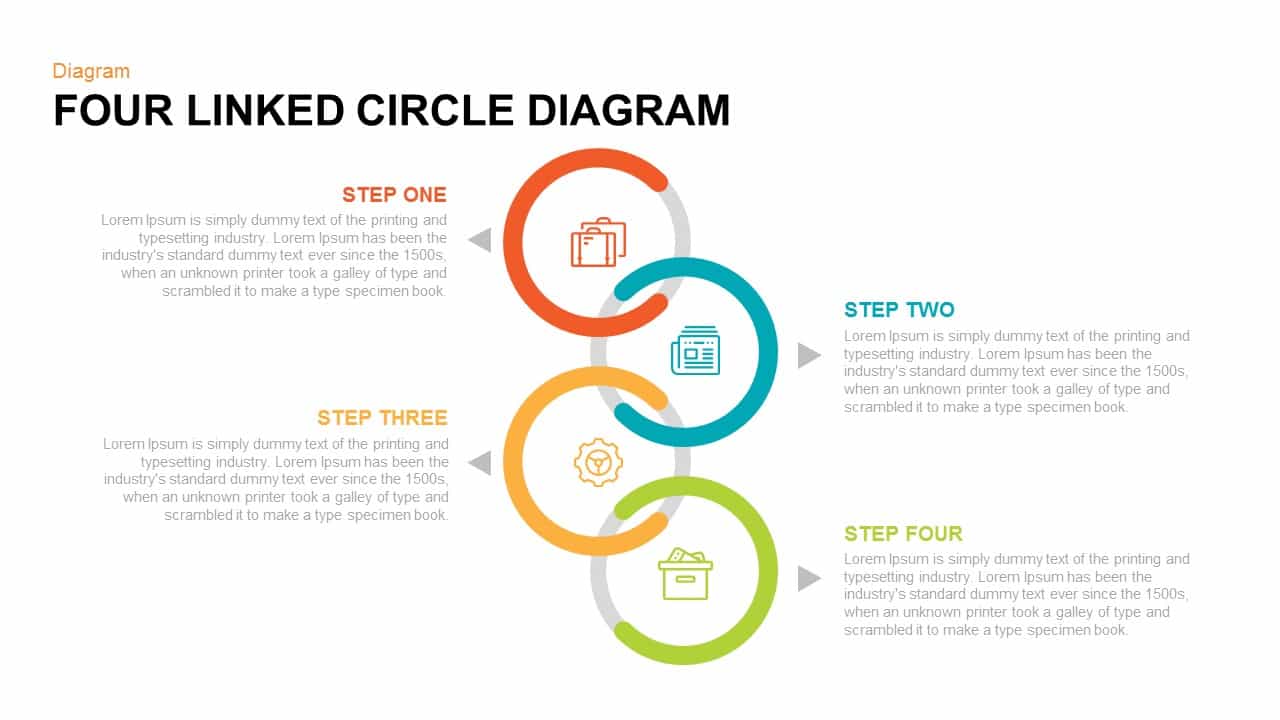
4 Linked Circle Diagram PowerPoint Template & Keynote
Diagrams
Premium
-
Circle Diagram Template for PowerPoint and Keynote
Circular Diagrams
Premium
-
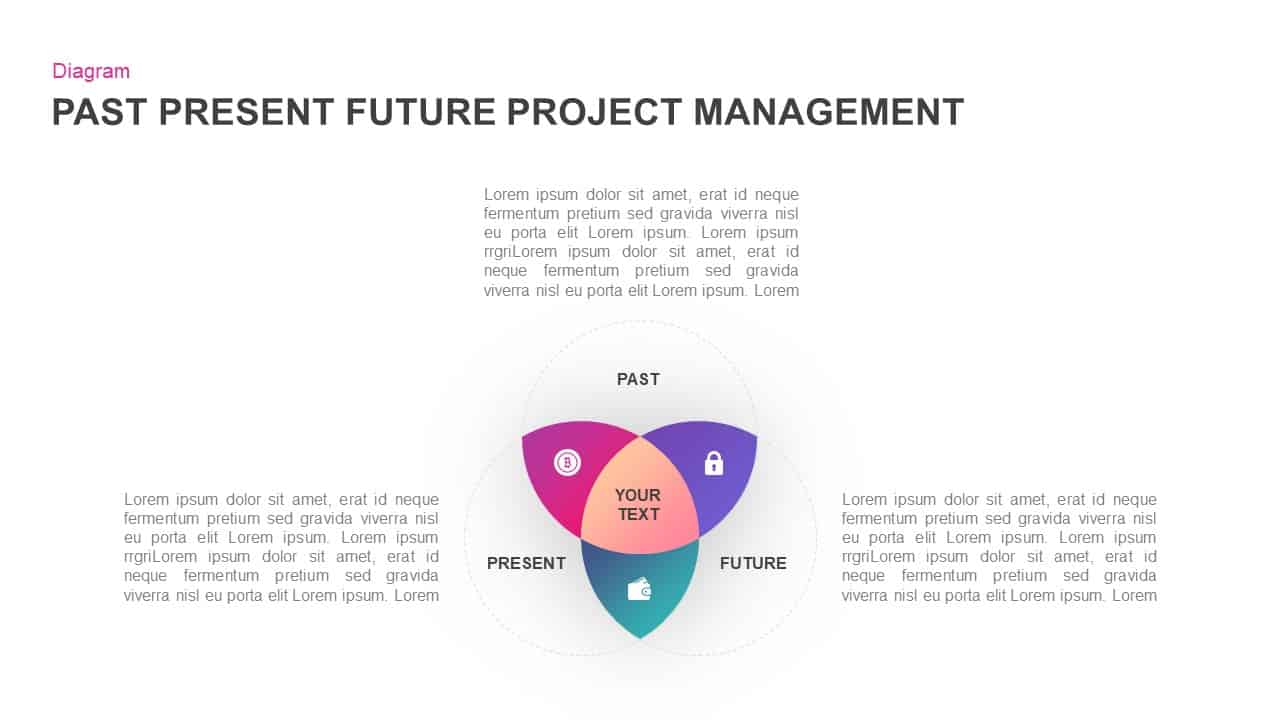
Past Present Future Project Management Template for PowerPoint & Keynote
Business Models
Premium
-
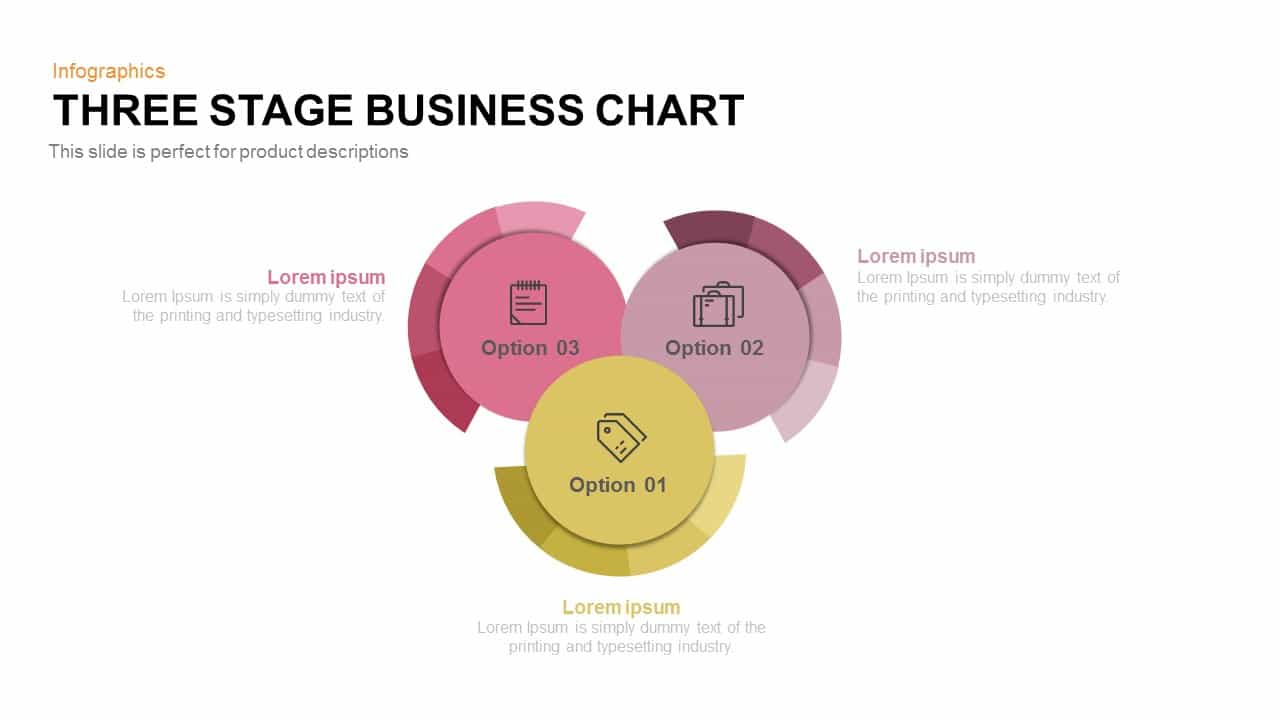
3 Stage Business Chart PowerPoint Template and Keynote Slide
Diagrams
Premium
-
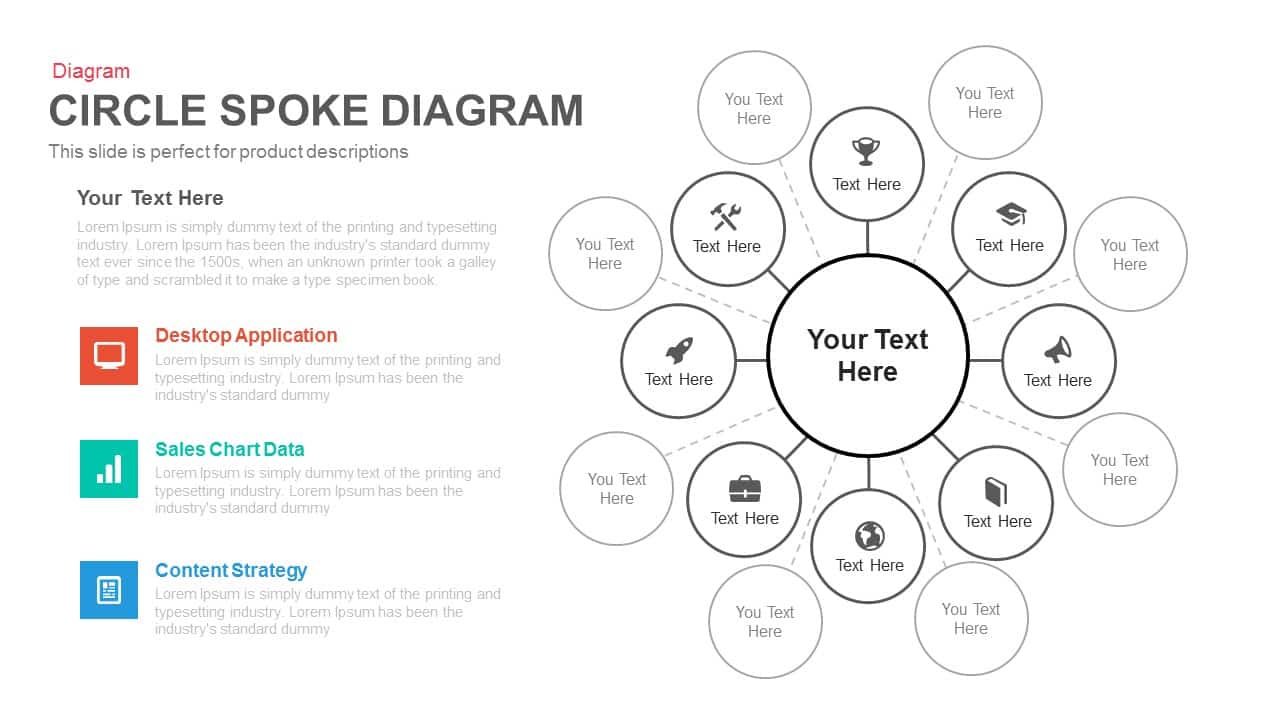
Circle Spoke Diagram Template for PowerPoint and Keynote
Circular Diagrams
Premium
-
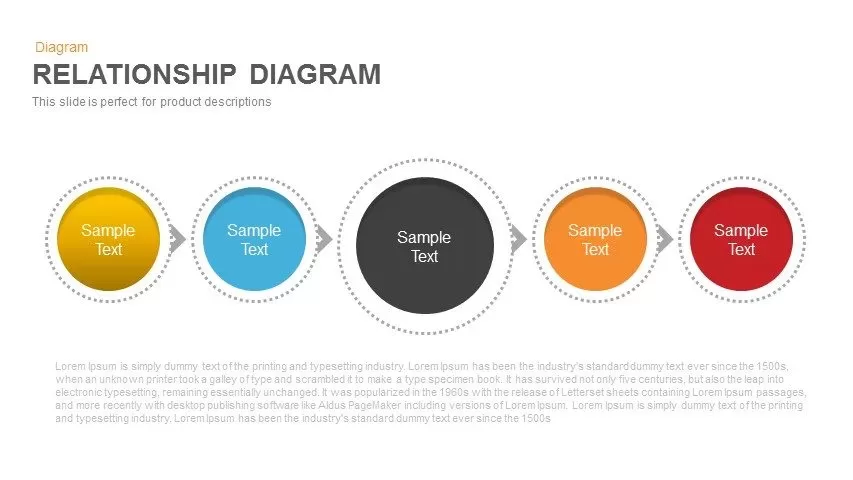
Relationship Diagram PowerPoint Template and Keynote Slide
Business Models
Premium
-
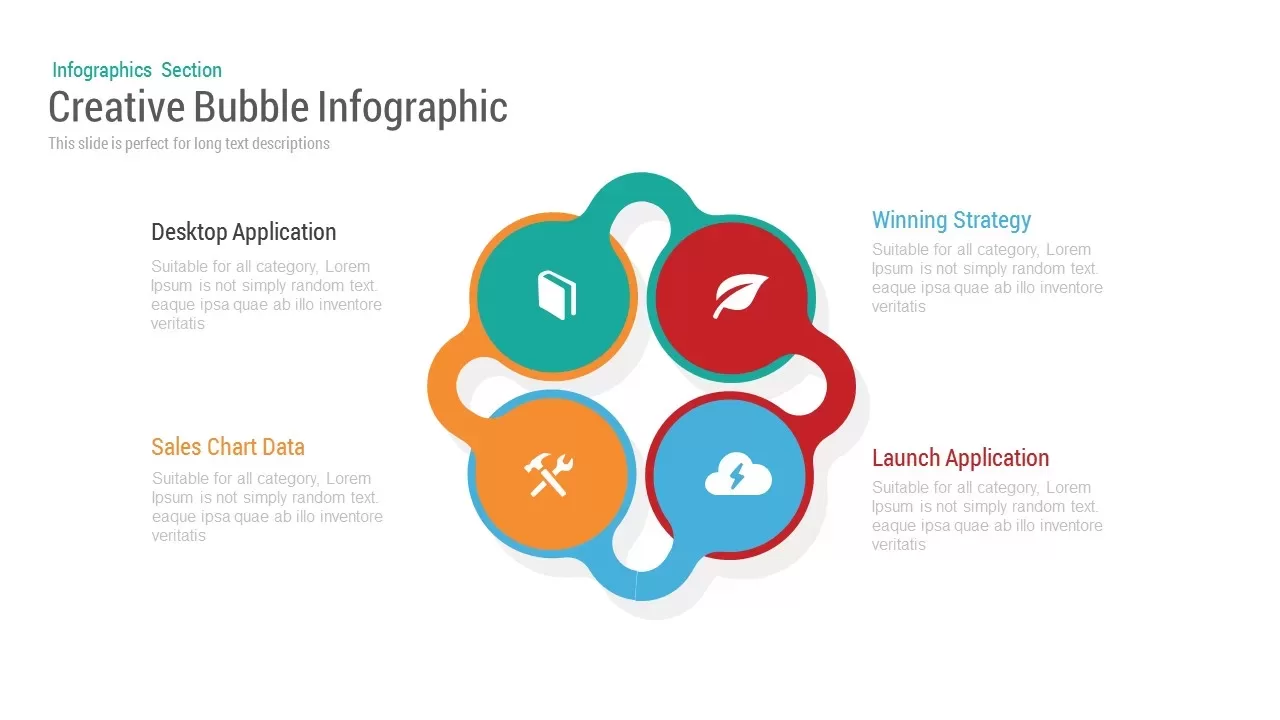
Four Bubble Infographic PowerPoint Template and Keynote
Business Models
Premium
-
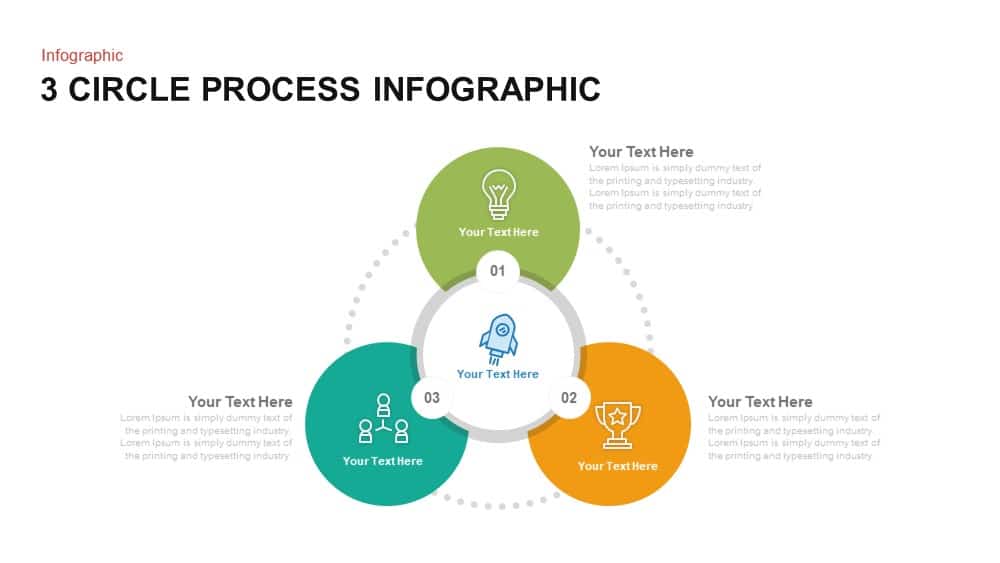
3 Circle Process PowerPoint Infographic Template and Keynote
Circular Diagrams
Premium
-
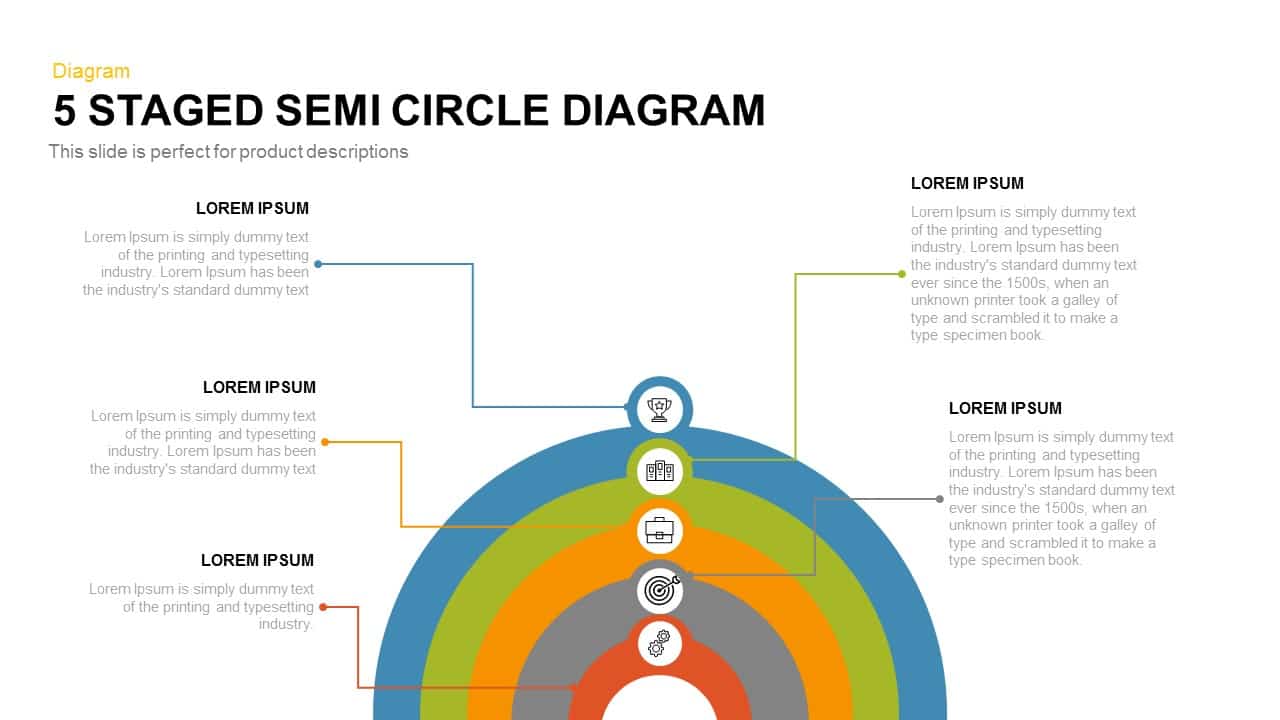
5 Staged Semi Circle Diagram for PowerPoint and Keynote
Business Models
Premium
-
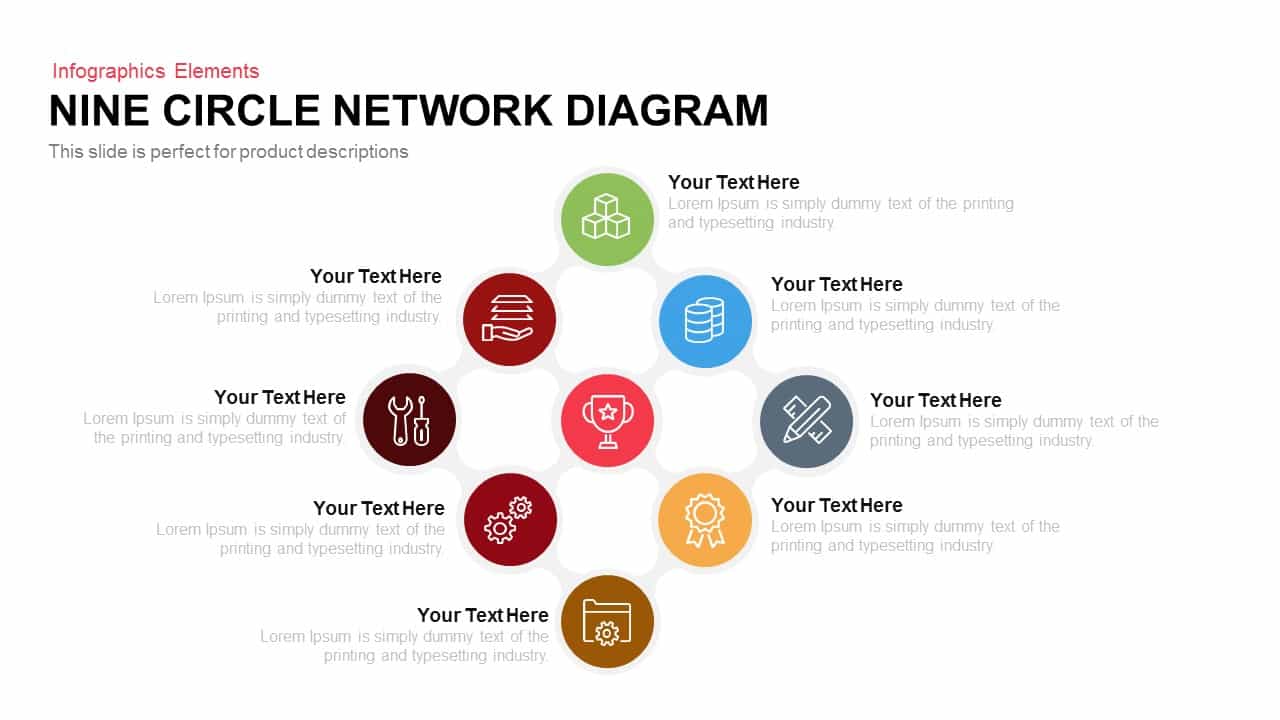
Nine Circle Network Diagram Template for PowerPoint and Keynote
Business Models
Premium
-
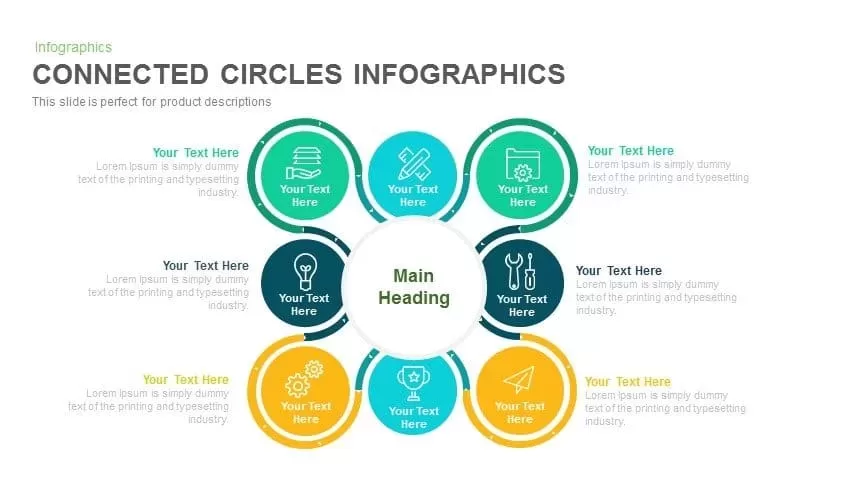
Connected Circles Infographics PowerPoint Template and Keynote
Circular Diagrams
Premium
-
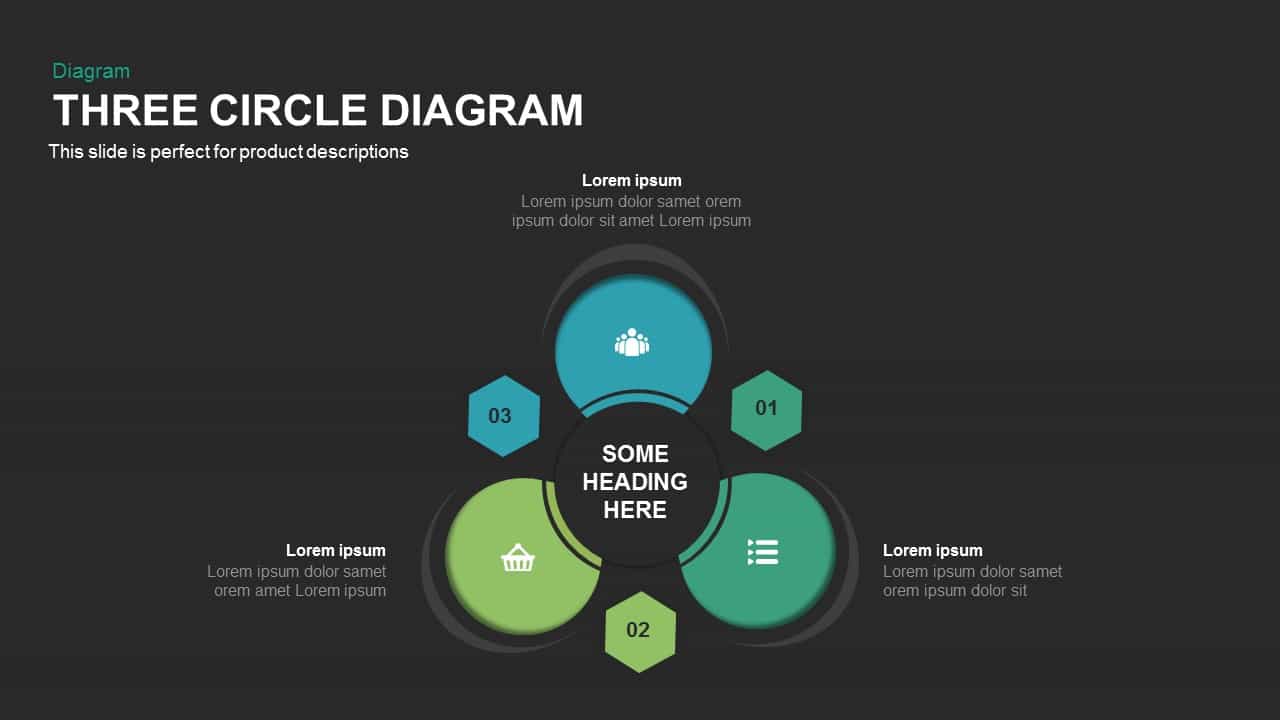
Three Circle Diagram PowerPoint Template and Keynote
Circular Diagrams
Premium
-
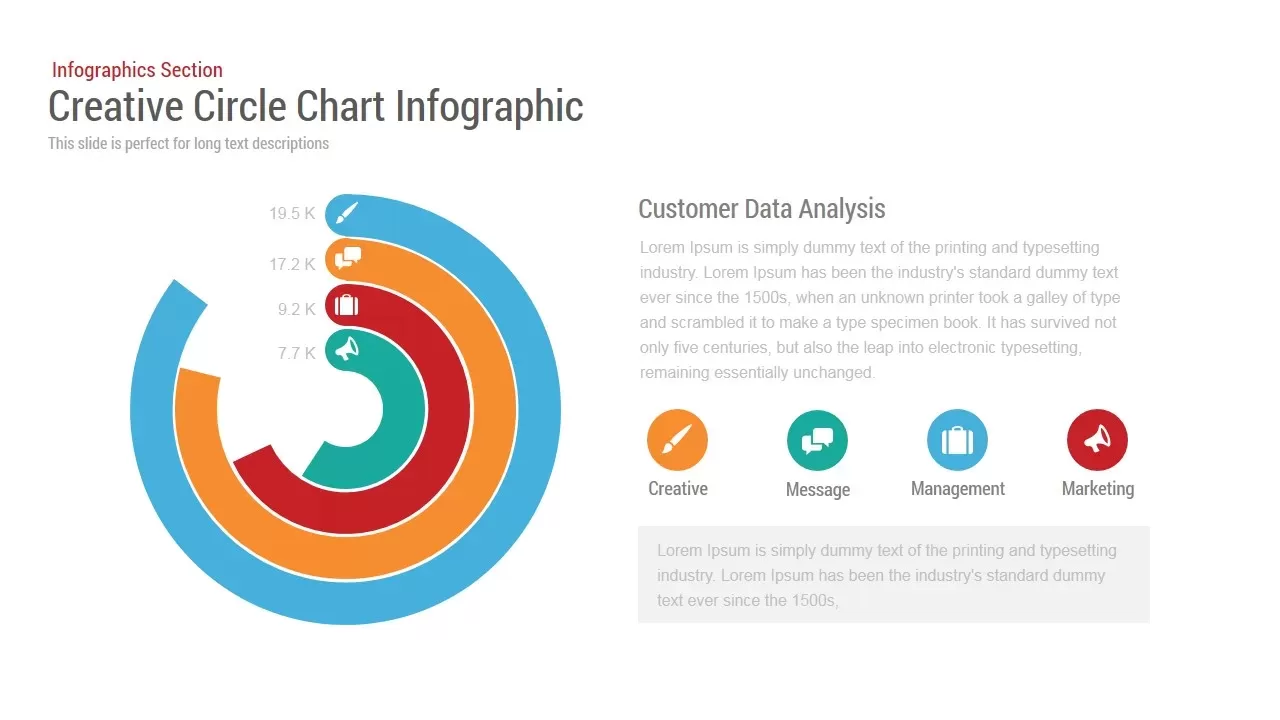
Circle Chart Infographic PowerPoint Template and Keynote
Infographic
Premium
-
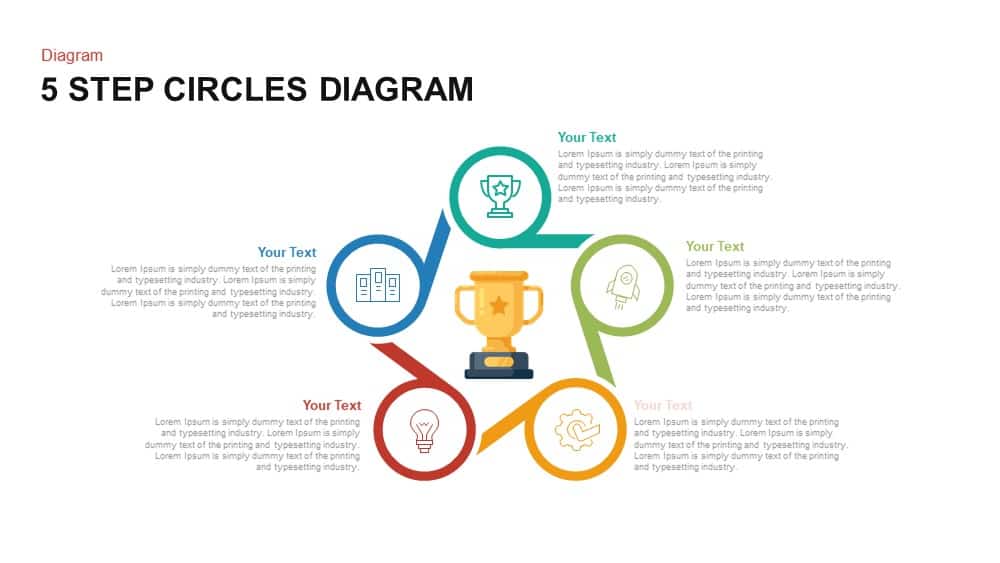
5 Step Circles Diagram Template for PowerPoint and Keynote
Circular Diagrams
Premium
-
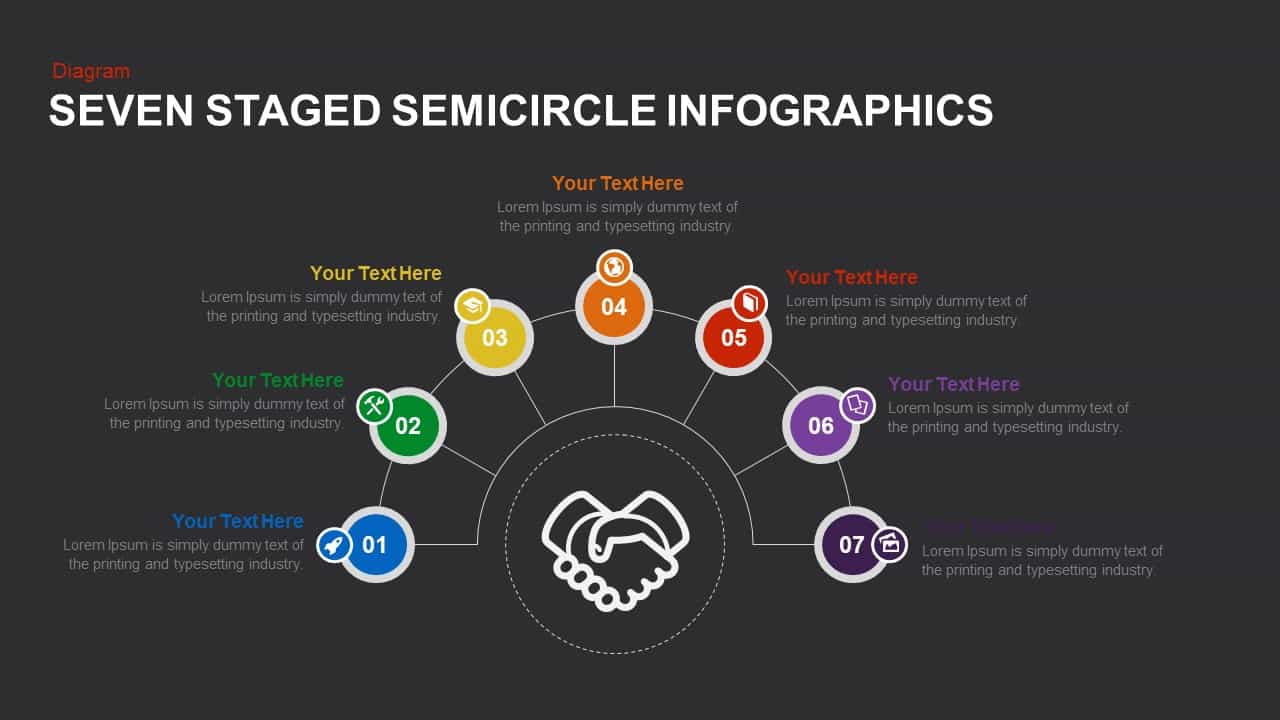
7 Step Semi Circle PowerPoint Template & Keynote
Business Models
Premium
-
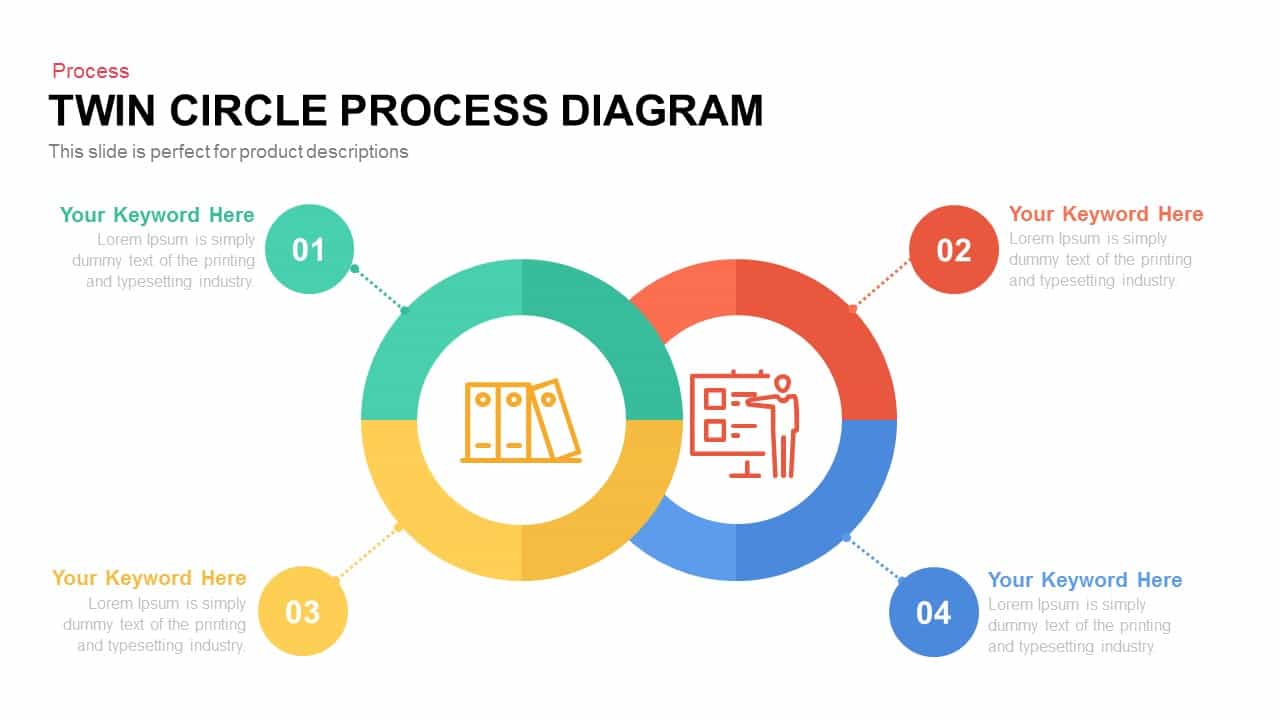
Twin Circle Process Diagram PowerPoint Template and Keynote Template
Circular Diagrams
Premium
-
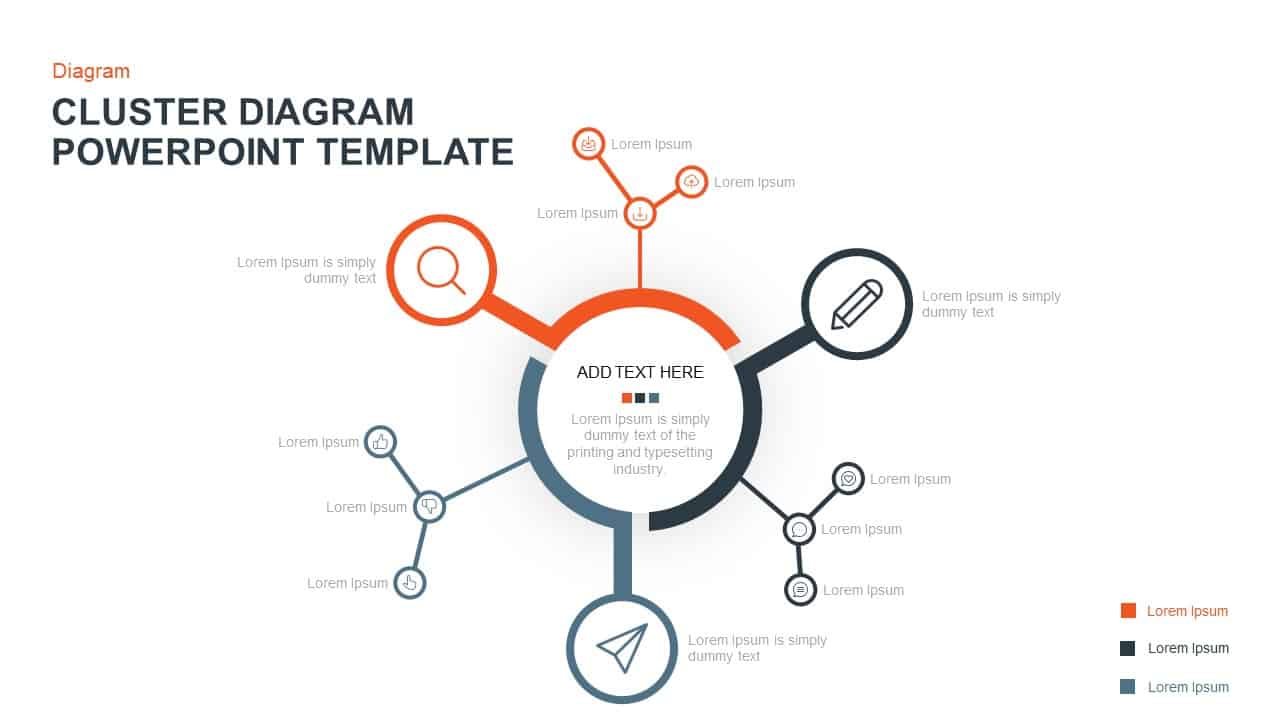
Cluster Diagram PowerPoint Template & Keynote
Diagrams
Premium
-
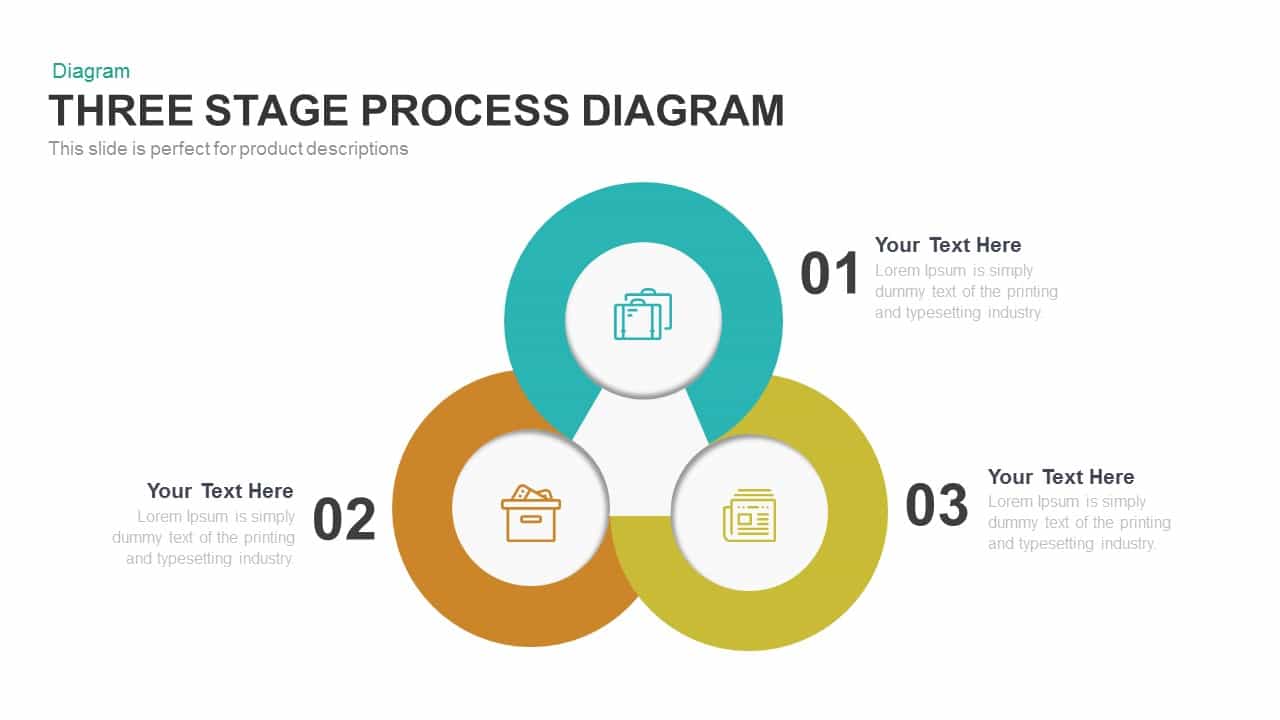
Three Stage Process Diagram Template for PowerPoint and Keynote
Diagrams
Premium
-
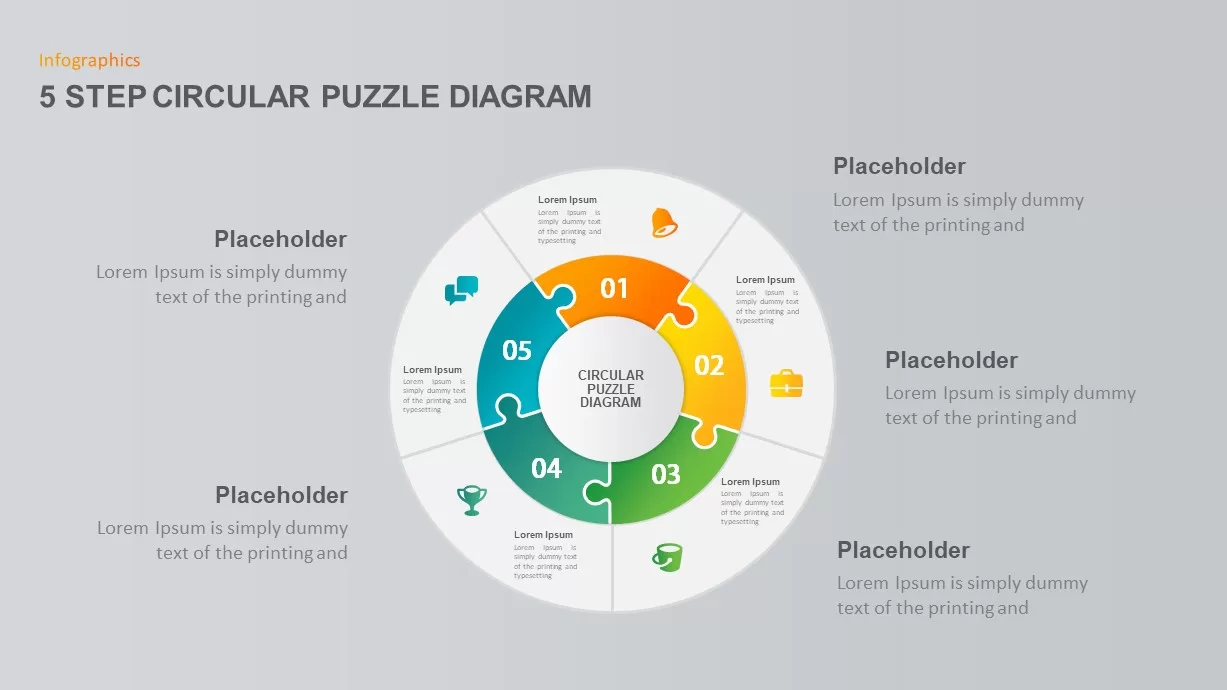
5 Step Circular Puzzle Diagram Template for PowerPoint
Puzzle
Premium
-
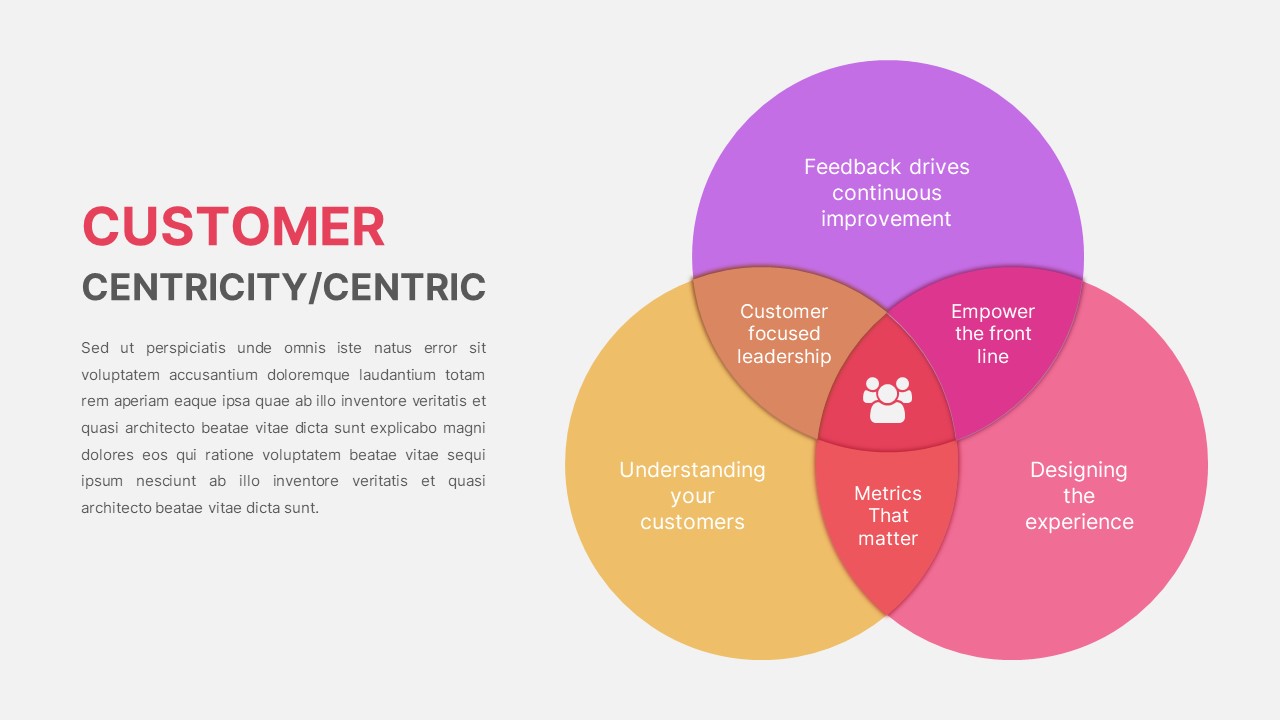
Customer Centricity PowerPoint Template
PowerPoint Templates
Premium
-
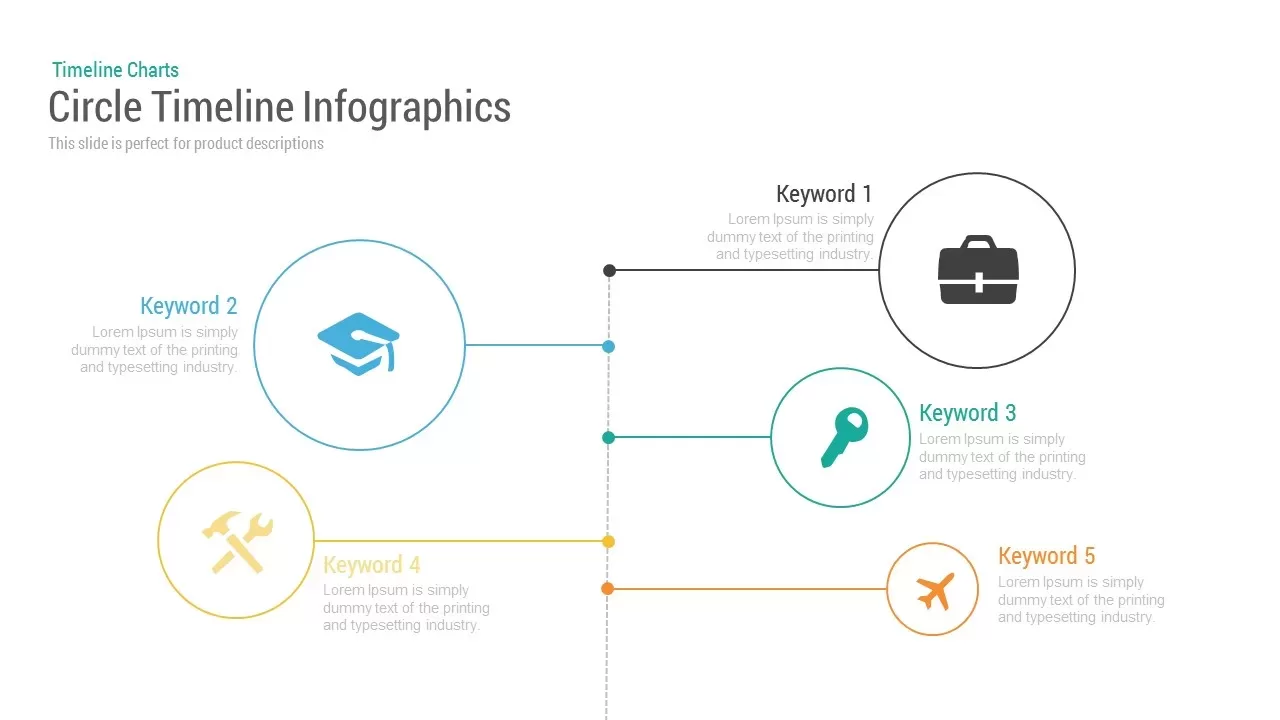
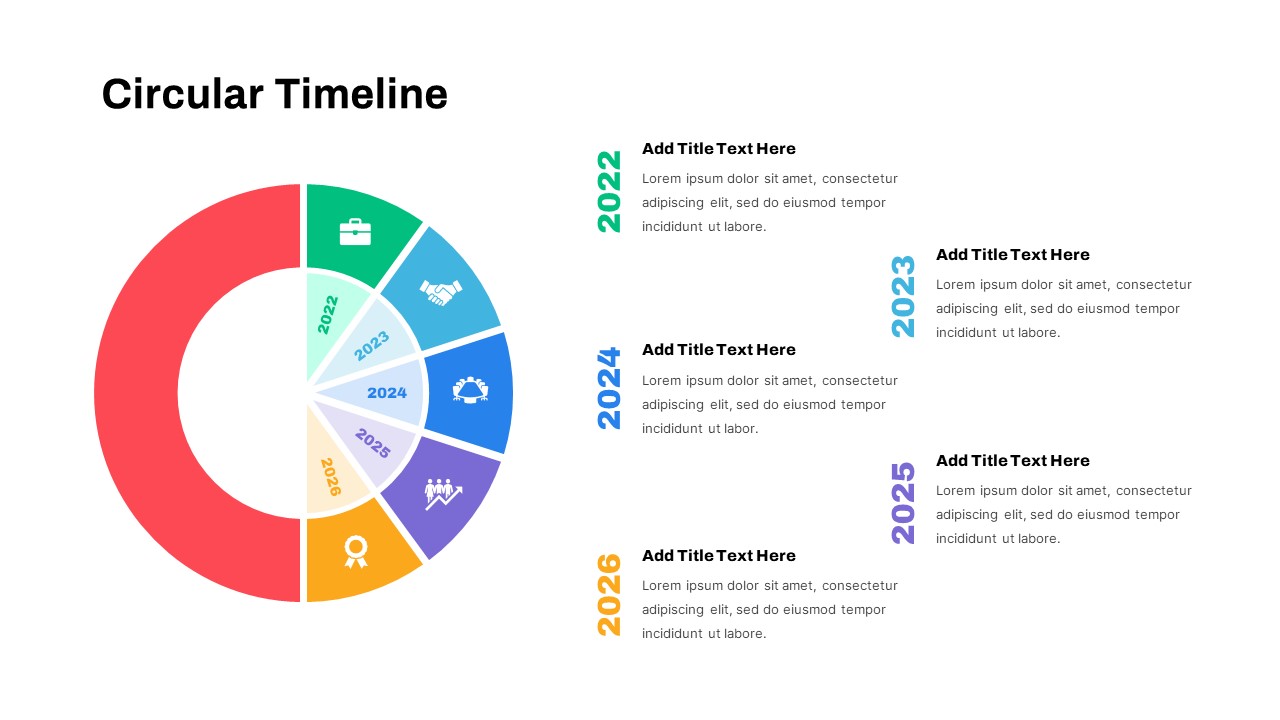
Circle Timeline Template Infographic for PowerPoint and Keynote
Timeline PowerPoint Template
Premium
-
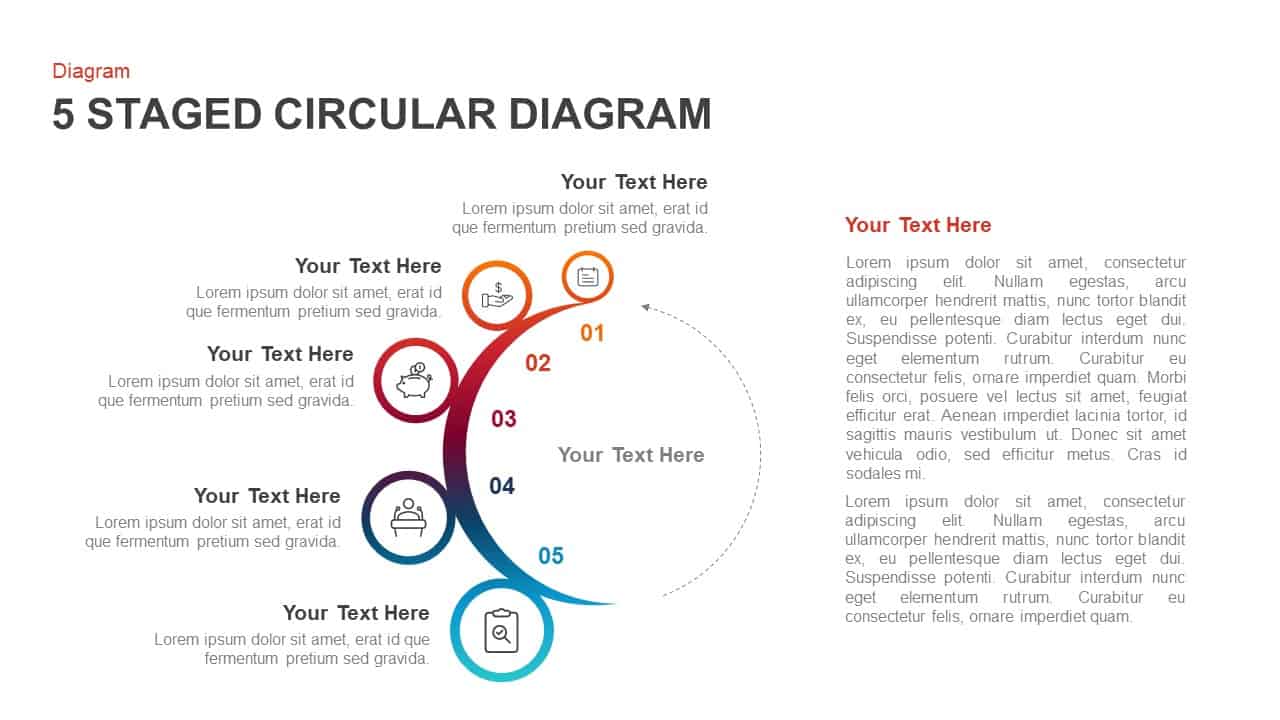
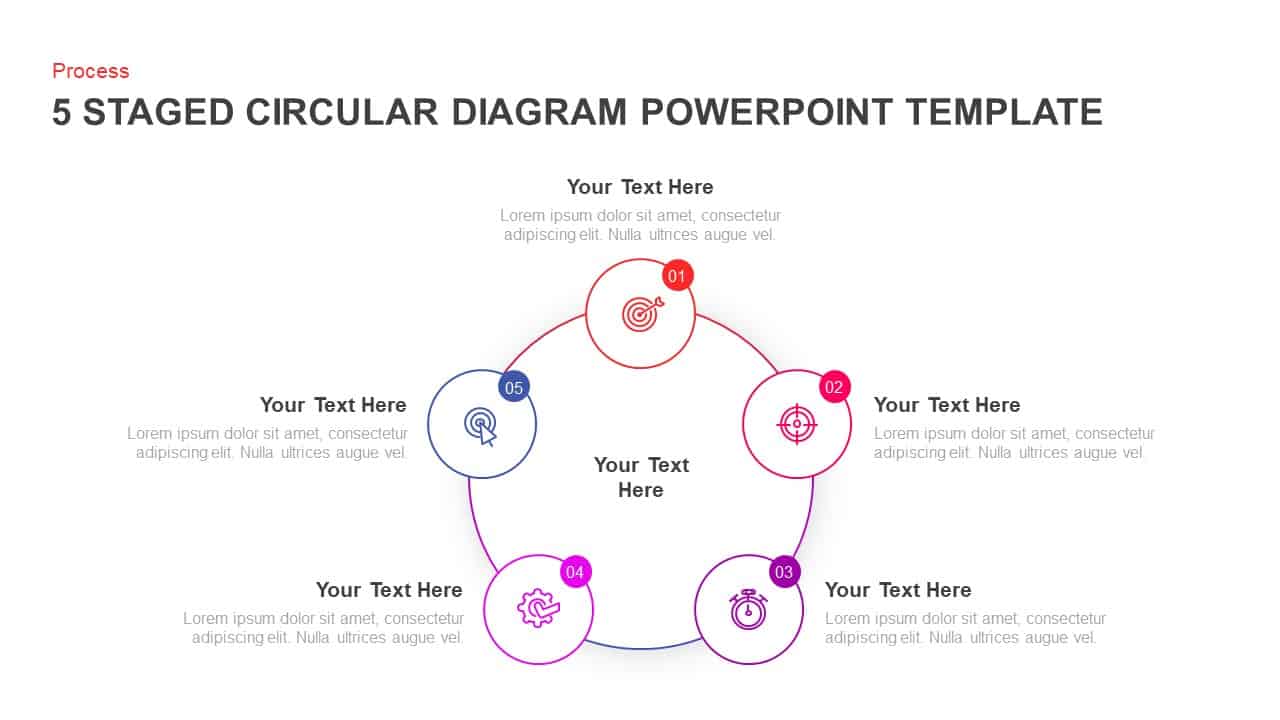
5 Staged Circular Diagram PowerPoint Template & Keynote
Circular Diagrams
Premium
-
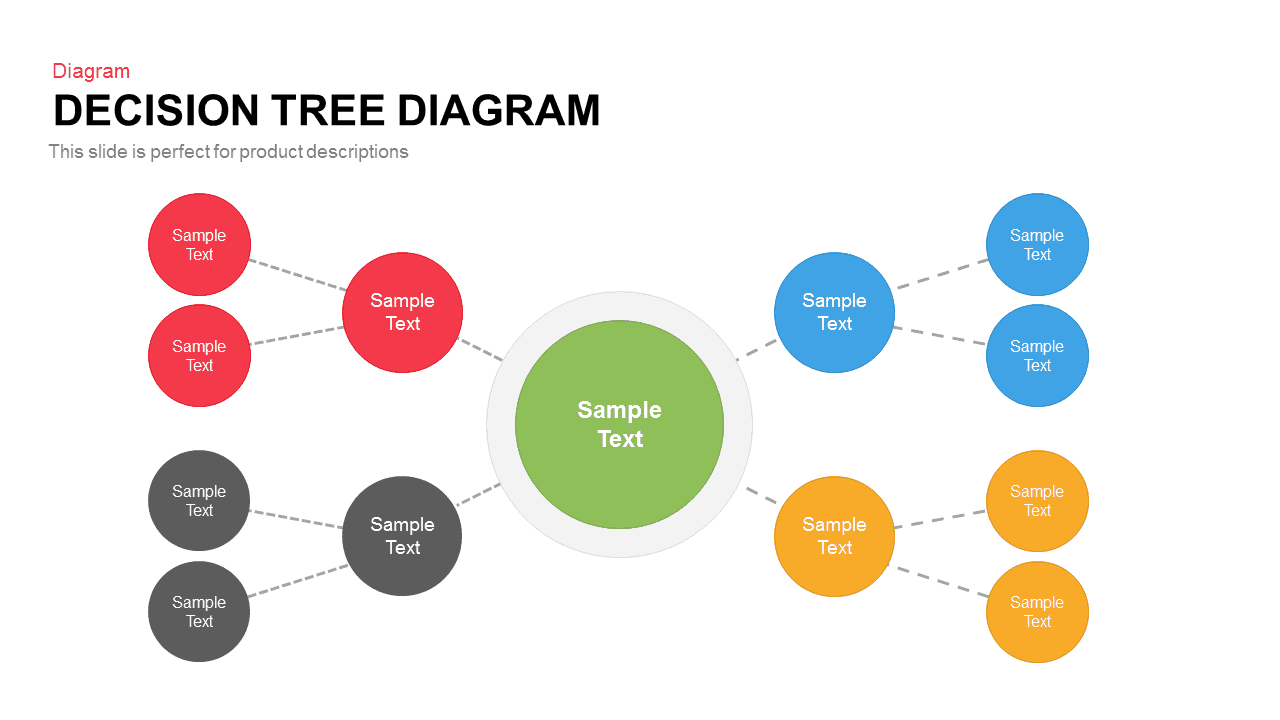
Decision Tree Diagram Template for PowerPoint and Keynote Presentation
Diagrams
Premium
-
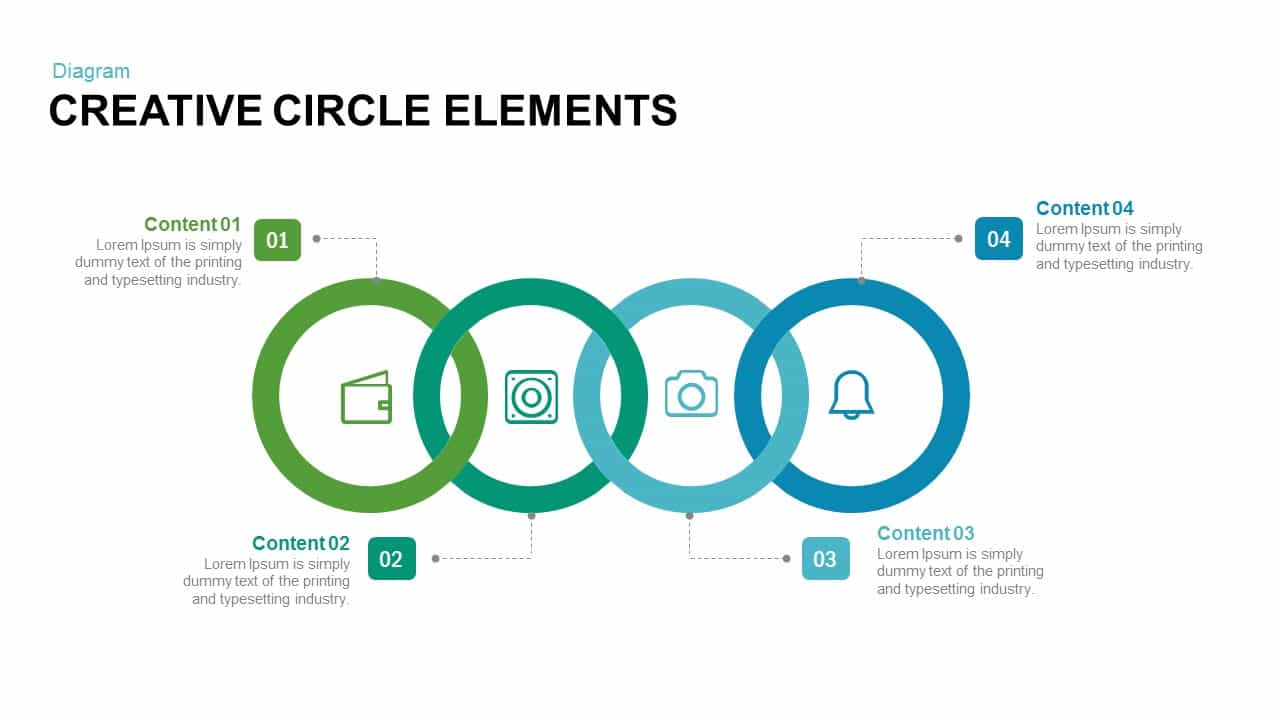
Creative Circle Elements PowerPoint Template and Keynote
Business Models
Premium
-
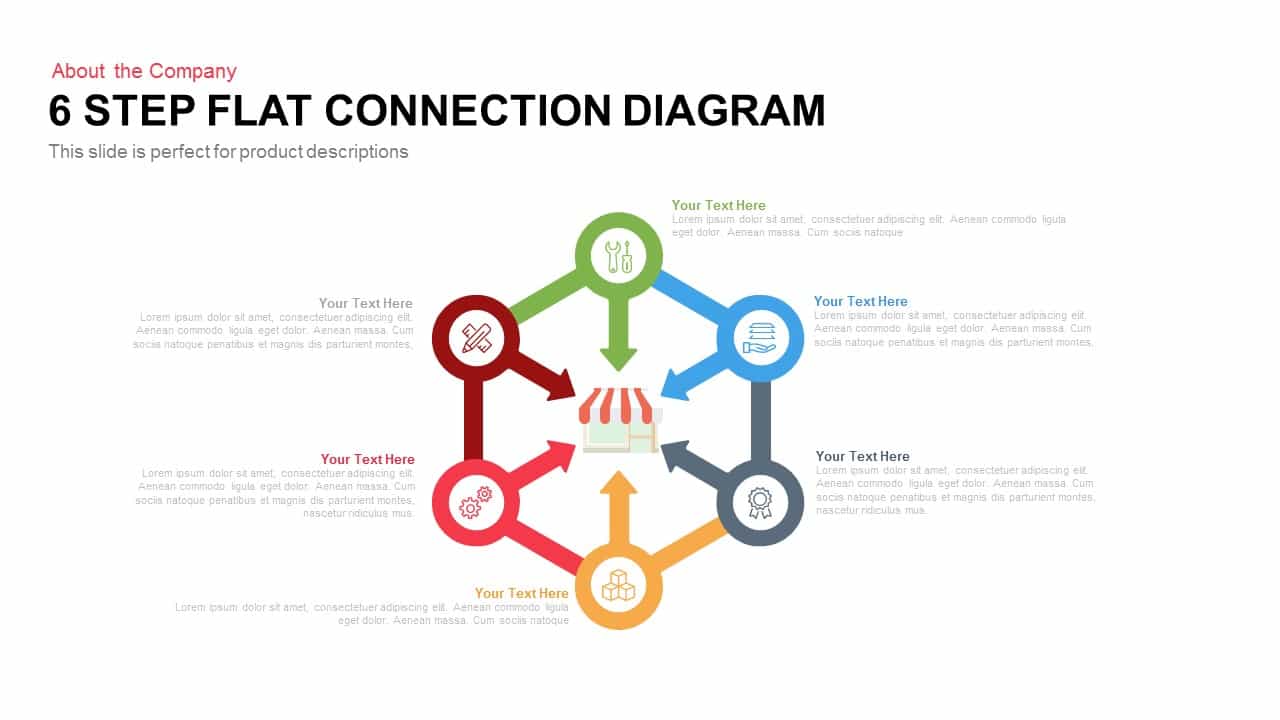
6 Step Flat Connection Diagram for PowerPoint and Keynote
Arrow Diagrams
Premium
-
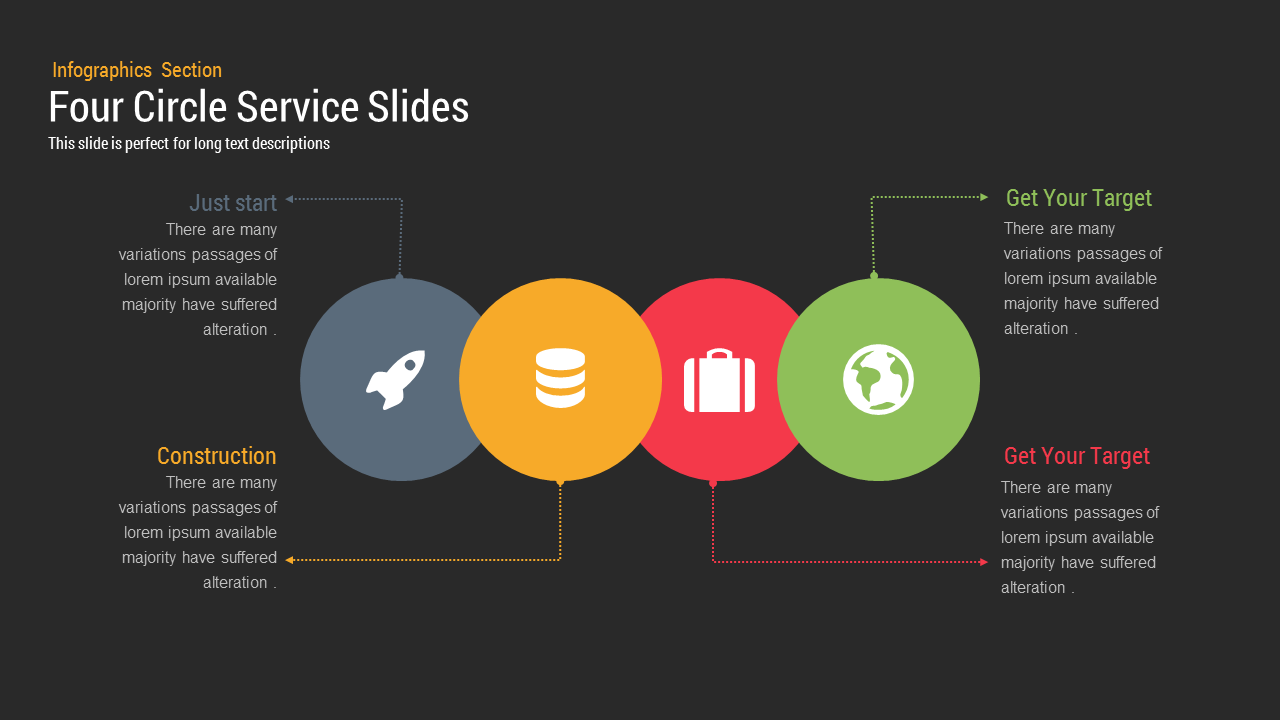
Four Circle Service PowerPoint Template and Keynote Slides
Shapes
Premium
-
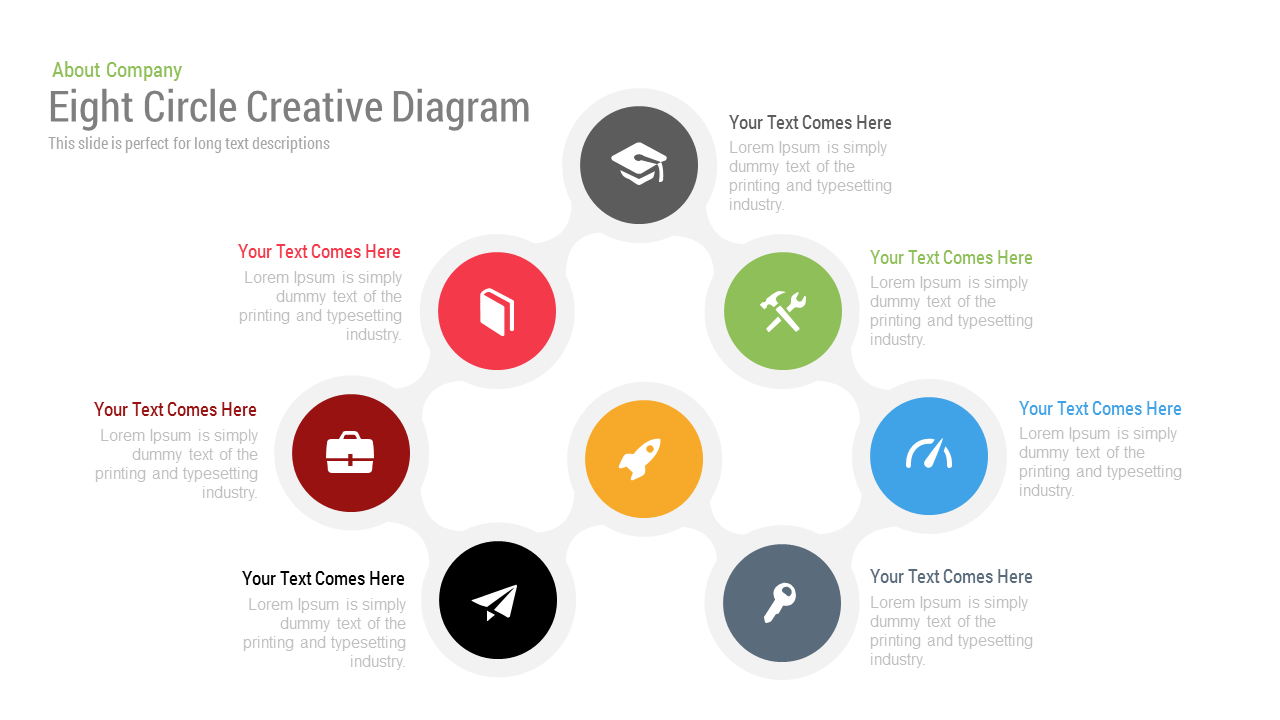
8 Circle Creative Diagram Free PowerPoint Template and Keynote Slide
Free PowerPoint Templates
Free
-
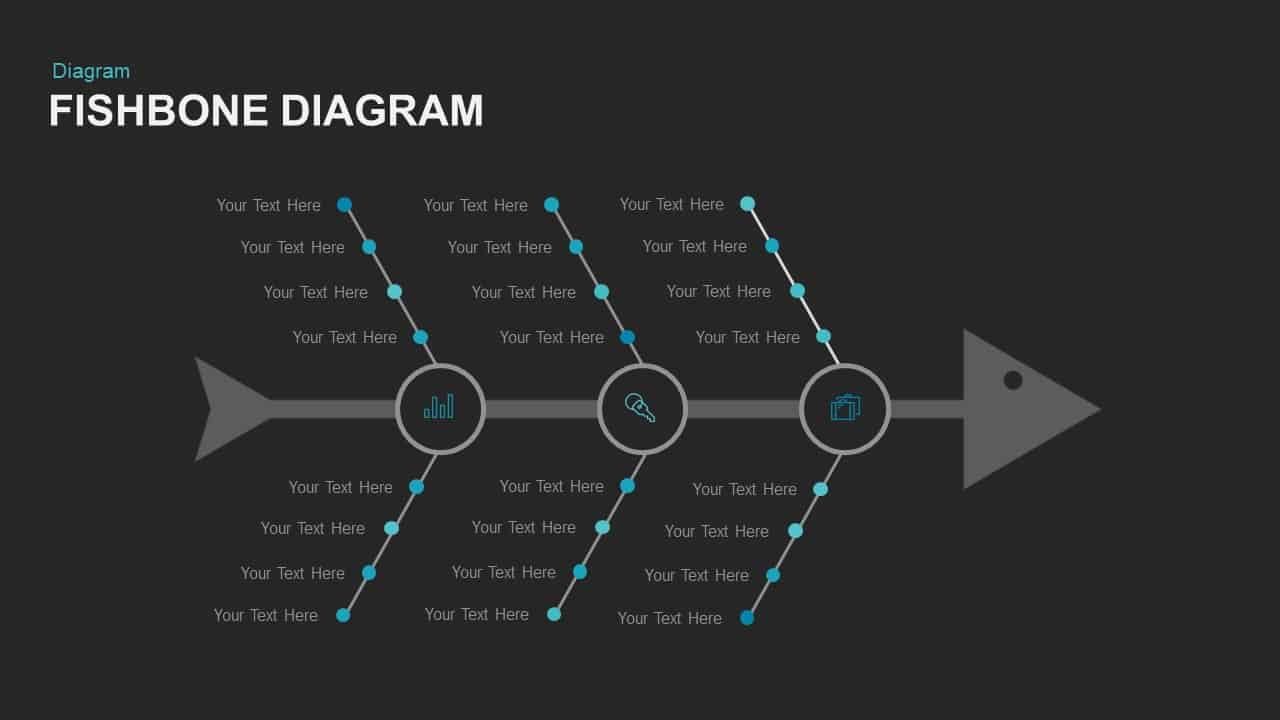
Fishbone Diagram Template for PowerPoint and Keynote Slide
Fishbone PowerPoint Templates
Premium
-
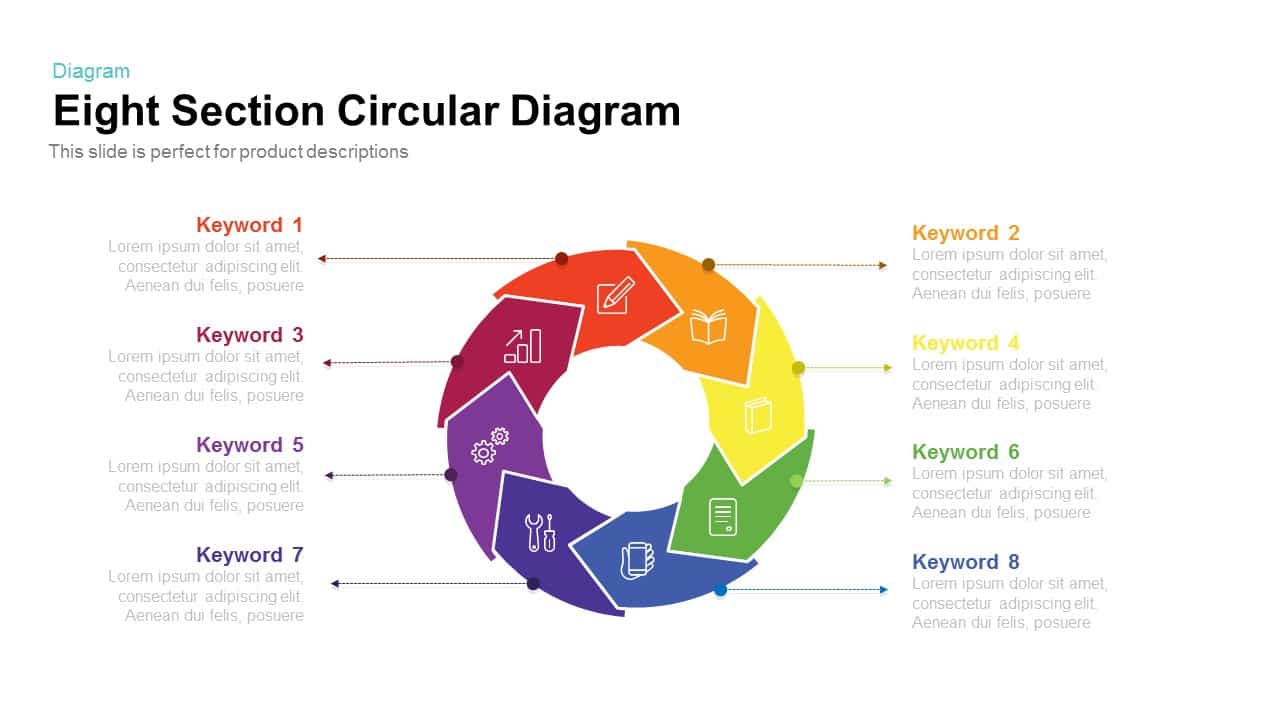
Section Circular Diagram PowerPoint Template and Keynote
Arrow Diagrams
Premium
-
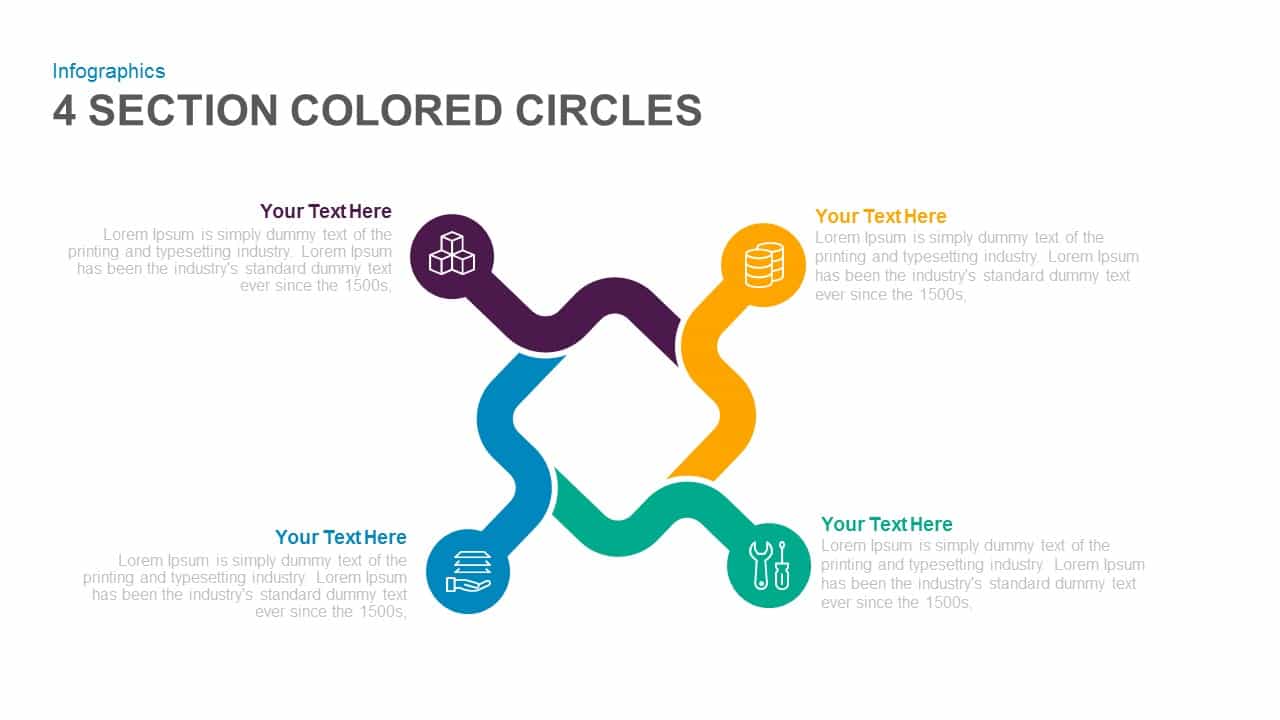
4 Section Colored Circles PowerPoint Template and Keynote Slide
Circular Diagrams
Premium
-
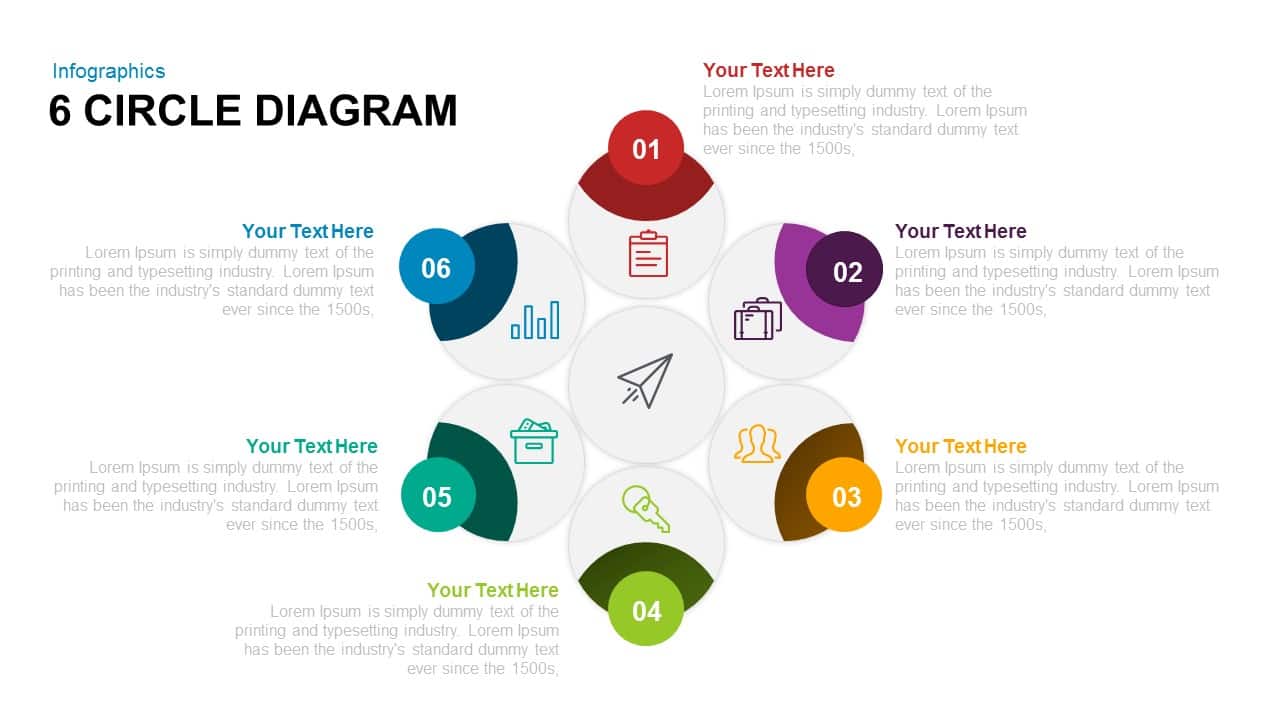
6 Circle Diagram PowerPoint Template and Keynote Slide
Circular Diagrams
Premium
-
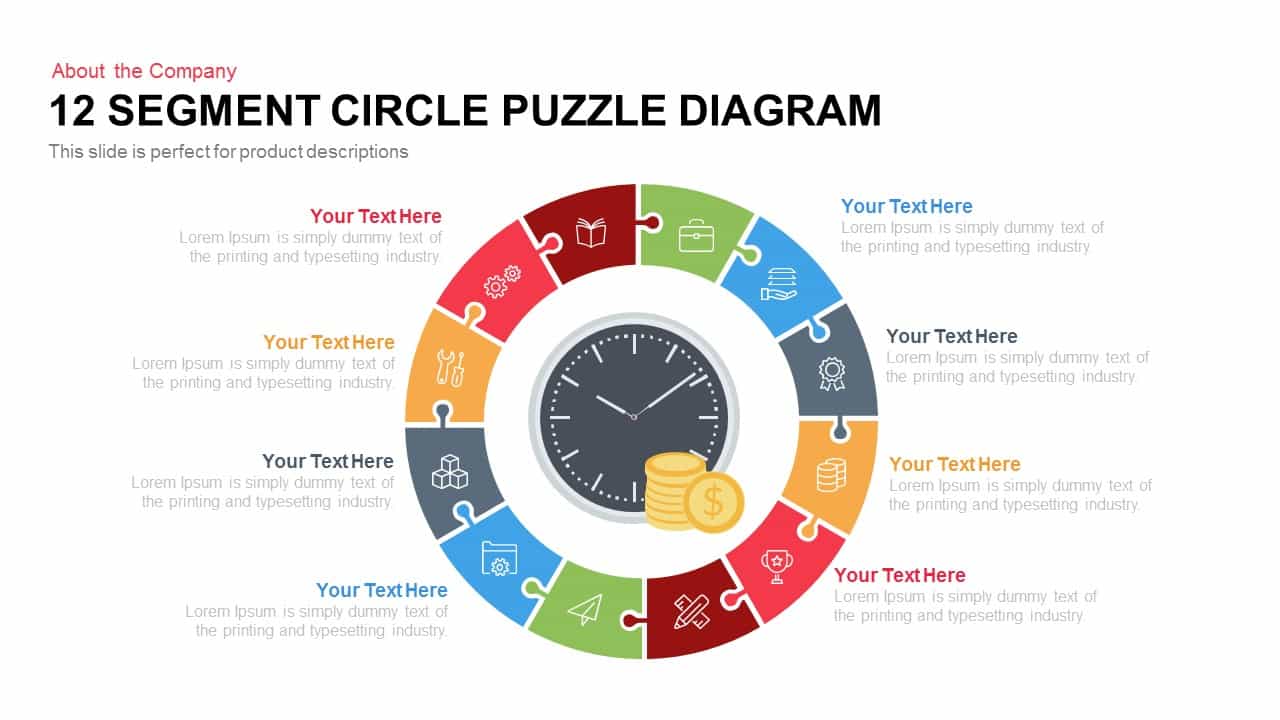
12 Segment Circle Puzzle Diagram Template for PowerPoint and Keynote
Puzzle
Premium
-
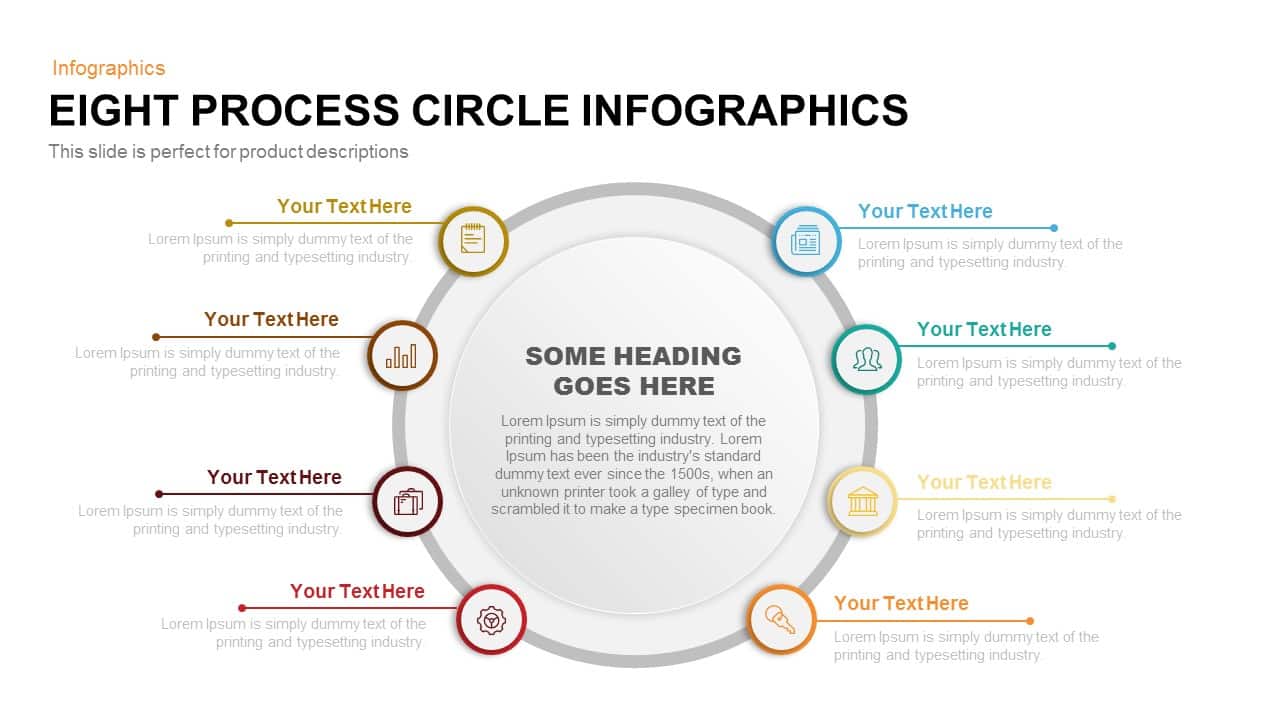
8 Process Circle Infographics Template for PowerPoint and Keynote
Circular Diagrams
Premium
-
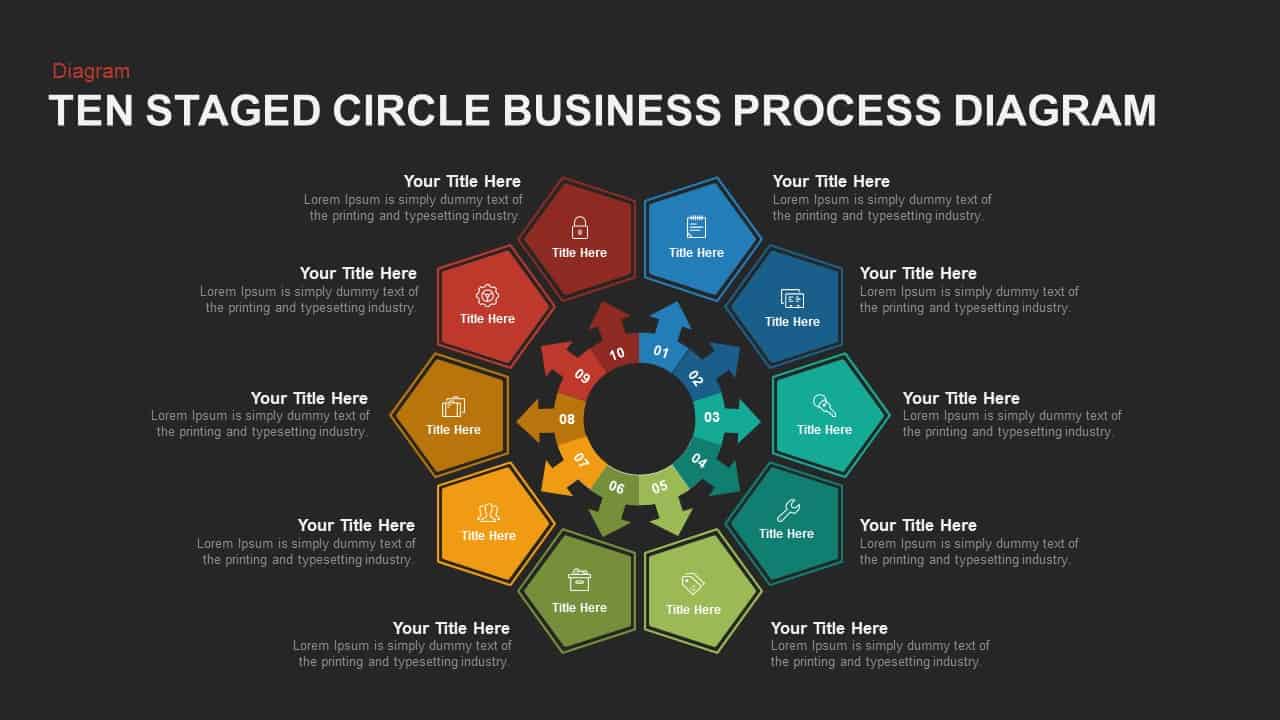
10 Staged Business Circle Process Diagram Template for PowerPoint and Keynote
Process Flow Diagrams
Premium
-
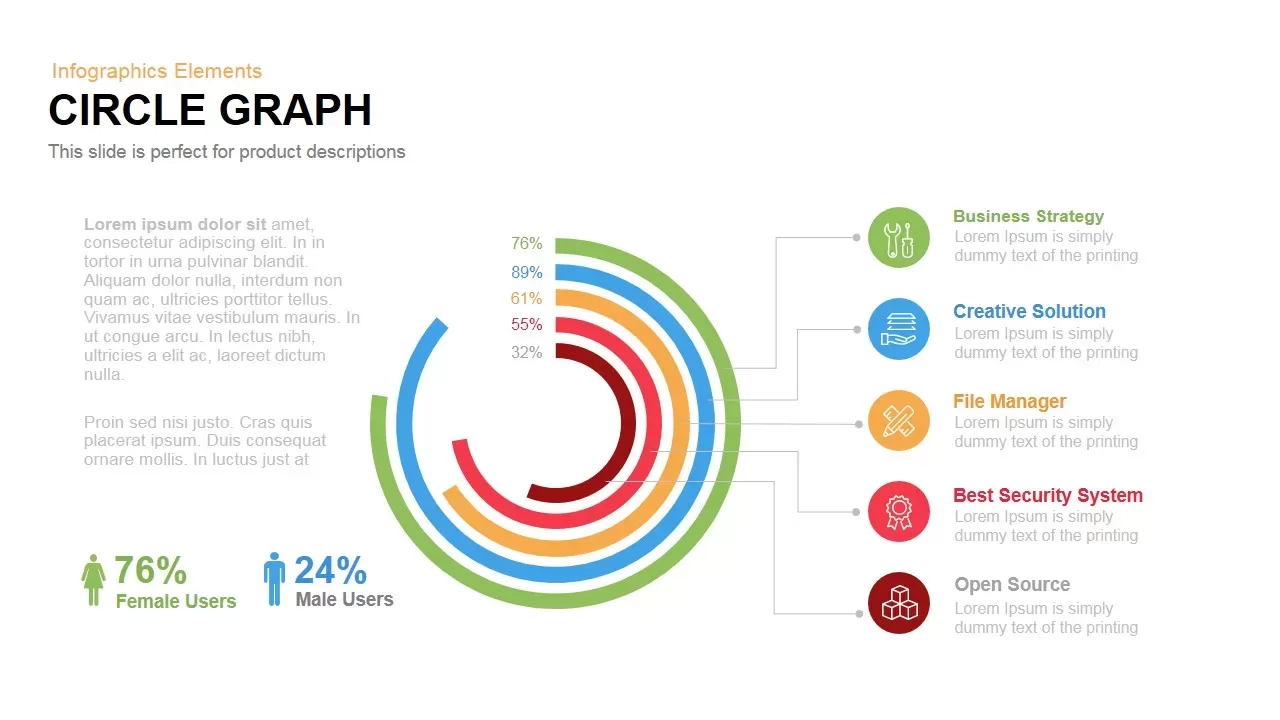
Circle Graph PowerPoint Template and Keynote Slide
Business Models
Premium
-
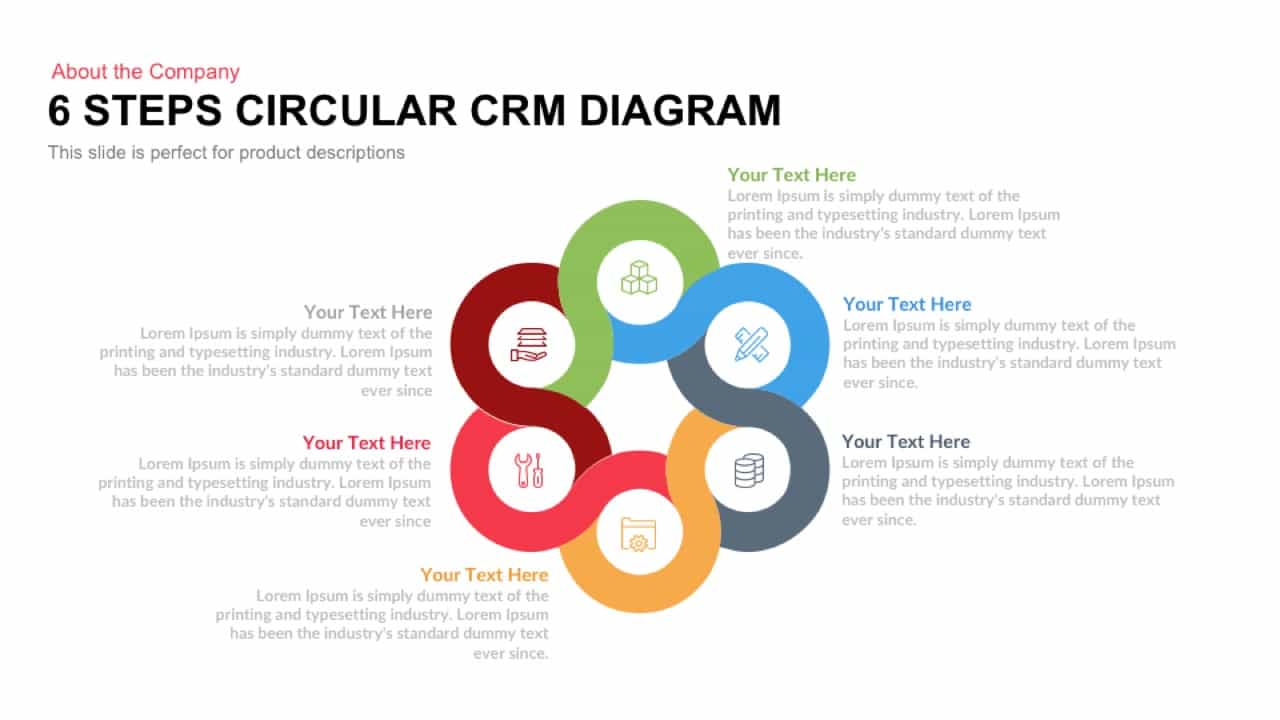
6 Steps Circular CRM Diagram for PowerPoint and Keynote
Circular Diagrams
Premium
-
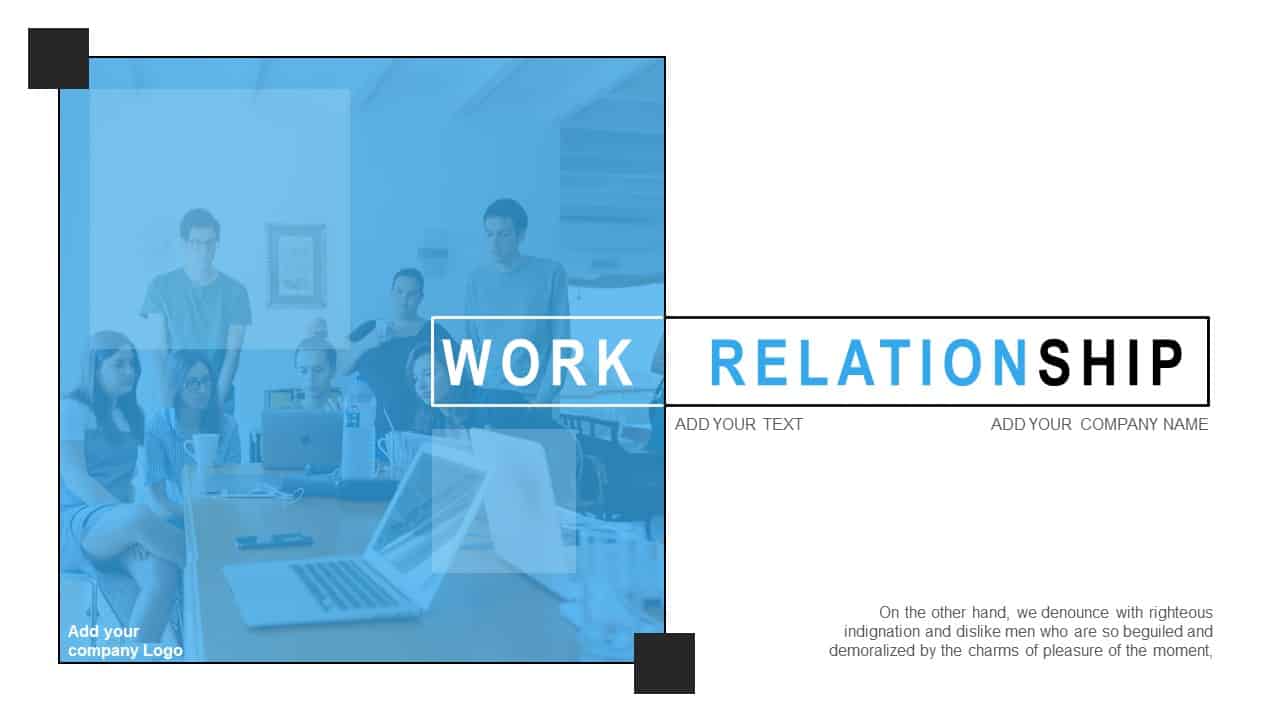
Work Relationship Template for PowerPoint
Business Models
Premium
-
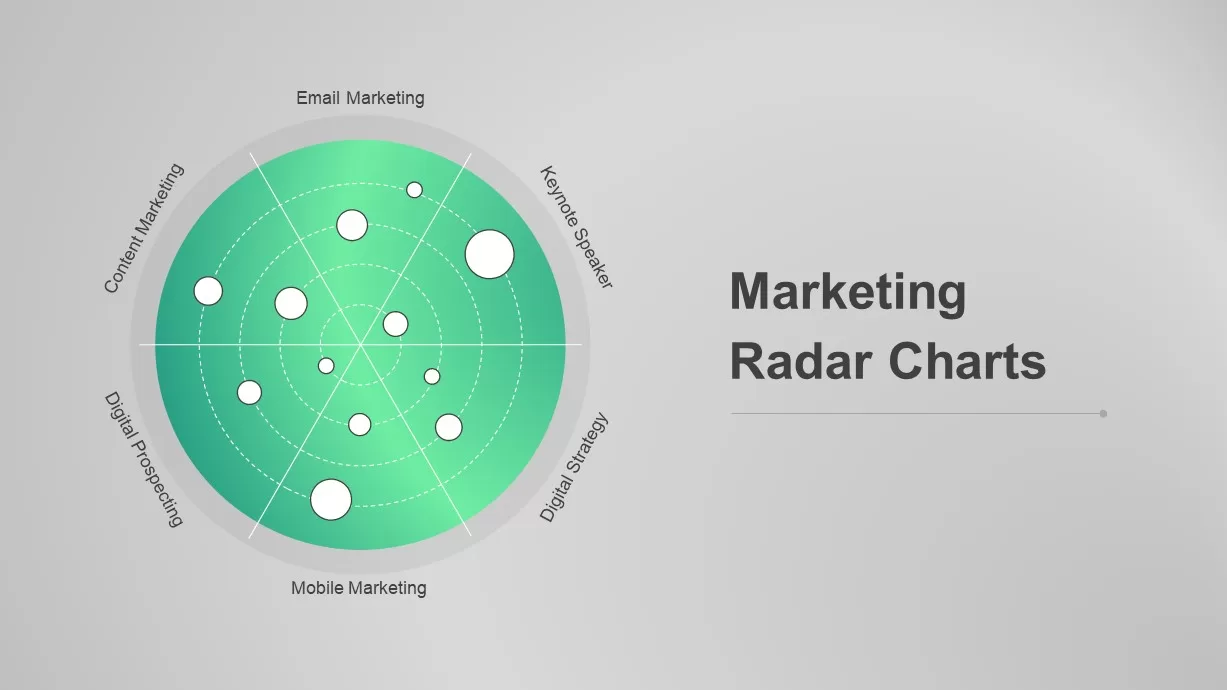
Marketing Radar Charts for PowerPoint
PowerPoint Charts
Premium
-
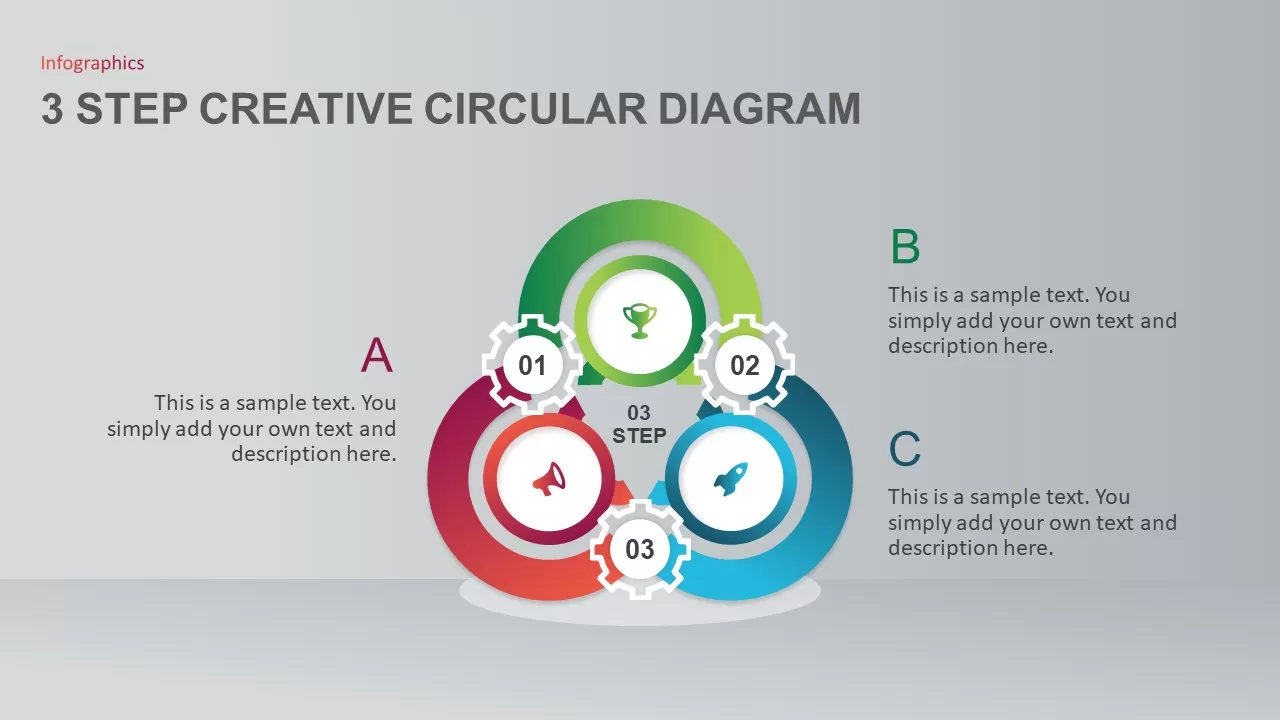
3 Step Creative Circle PowerPoint Template
Circular Diagrams
Premium
-
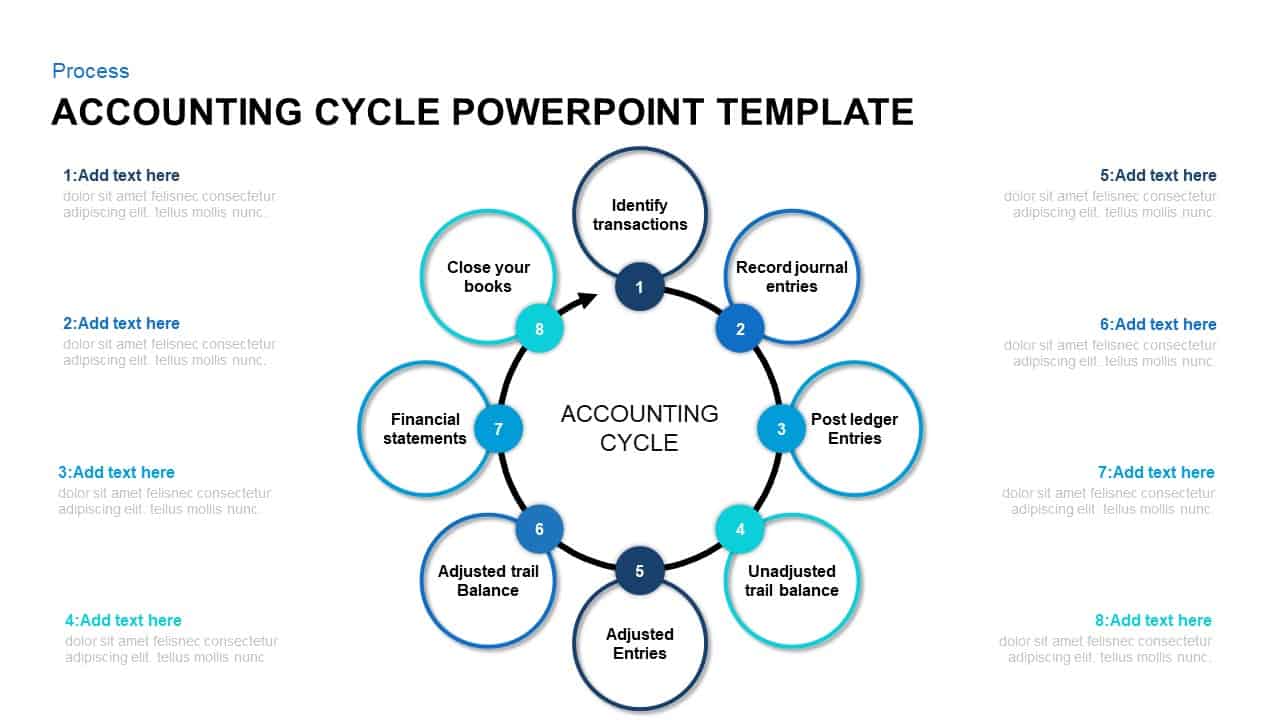
8 Step of Accounting Cycle PowerPoint Template
Circular Diagrams
Premium
-
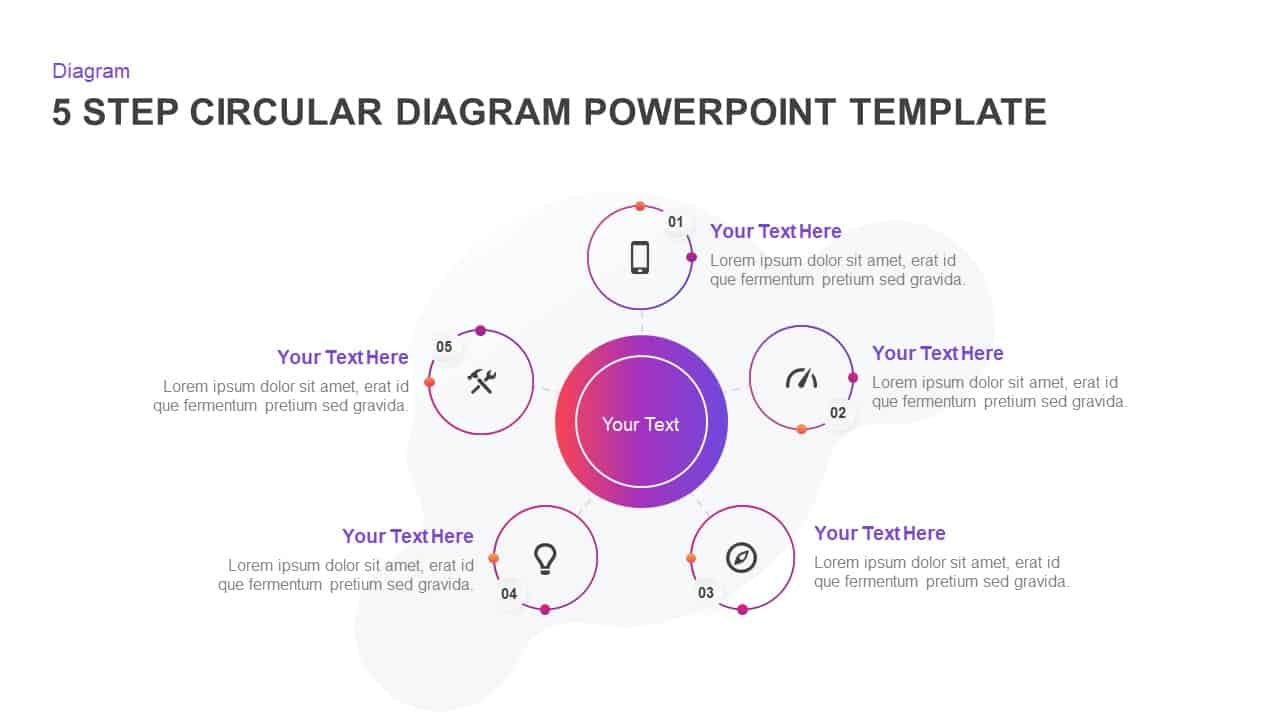
5 Step Creative Circular Diagram Design for PowerPoint & Keynote
Circular Diagrams
Premium
-
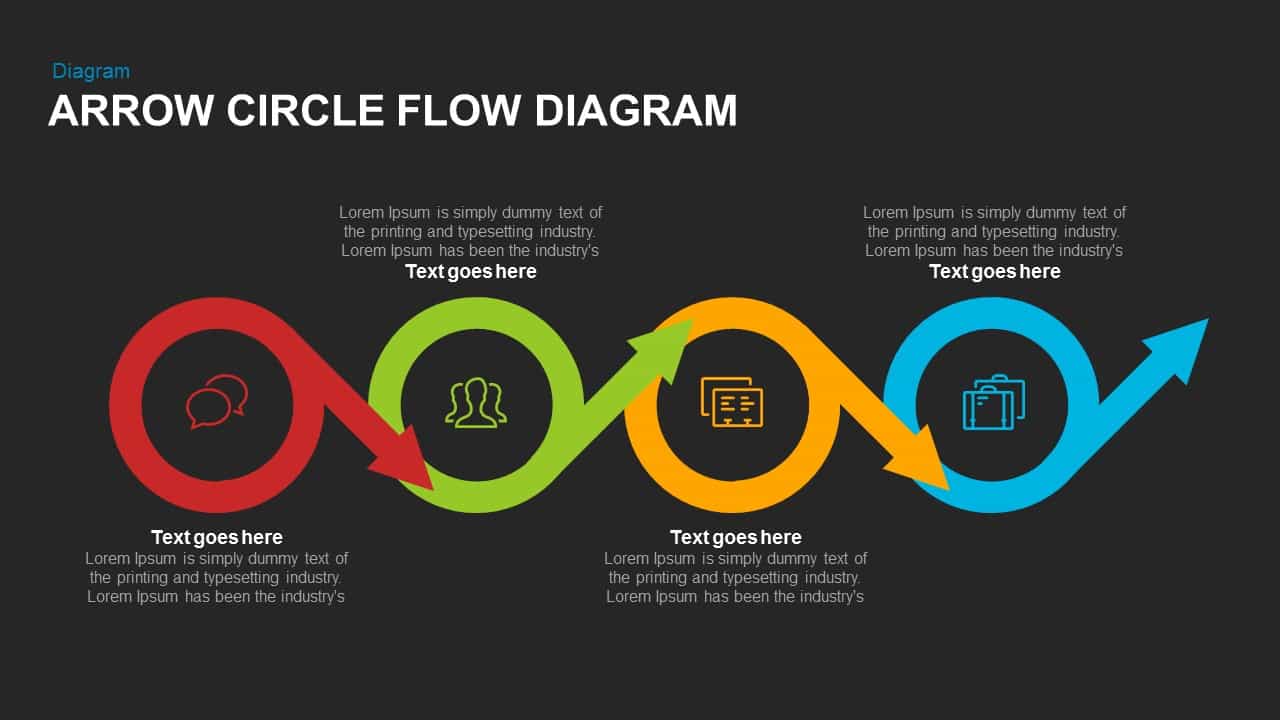
Arrow Circle Flow Diagram PowerPoint Template and Keynote
Arrow Diagrams
Premium
-
Simple Scatter Chart PowerPoint Template
PowerPoint Charts
Premium
-
Radar Chart Product Comparison PowerPoint Template
Business Models
Premium
-
Creative Diagram Infographic Template
Diagrams
Premium
-
Creative Circle Service PowerPoint and Keynote Template
Business Models
Premium
-
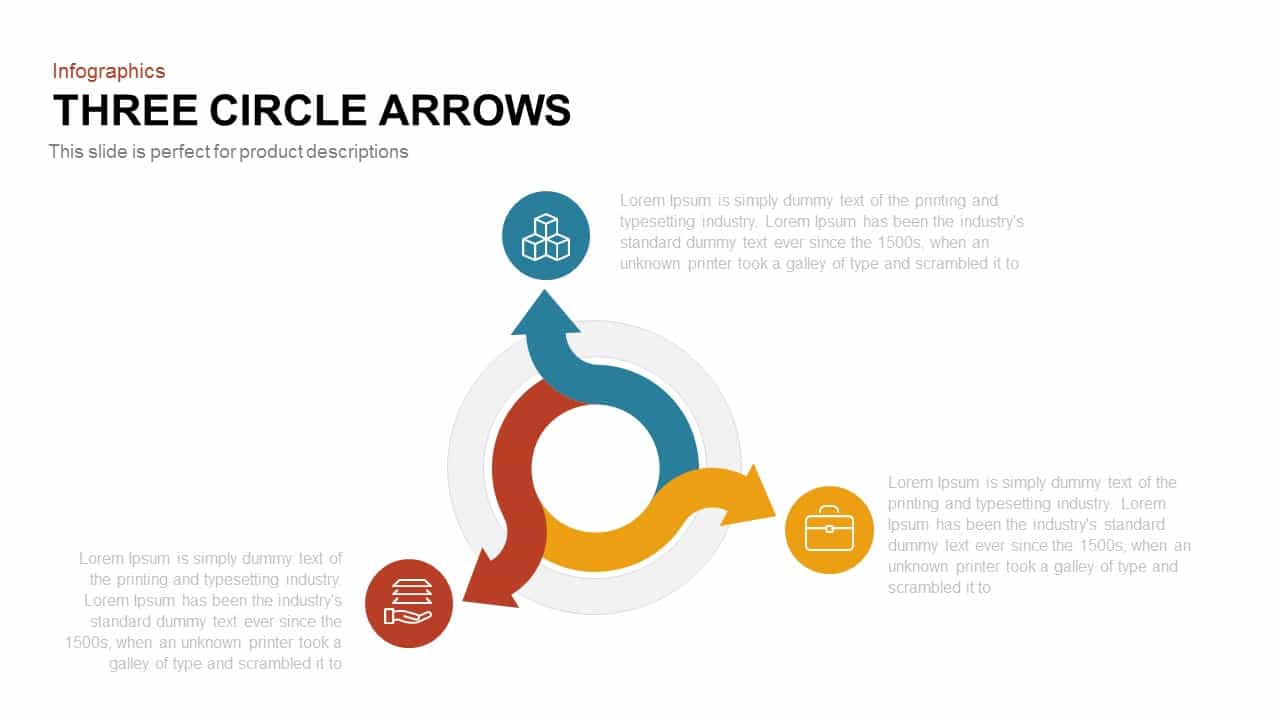
3 Arrows Circle PowerPoint Template and Keynote Slide
Arrow Diagrams
Premium
-
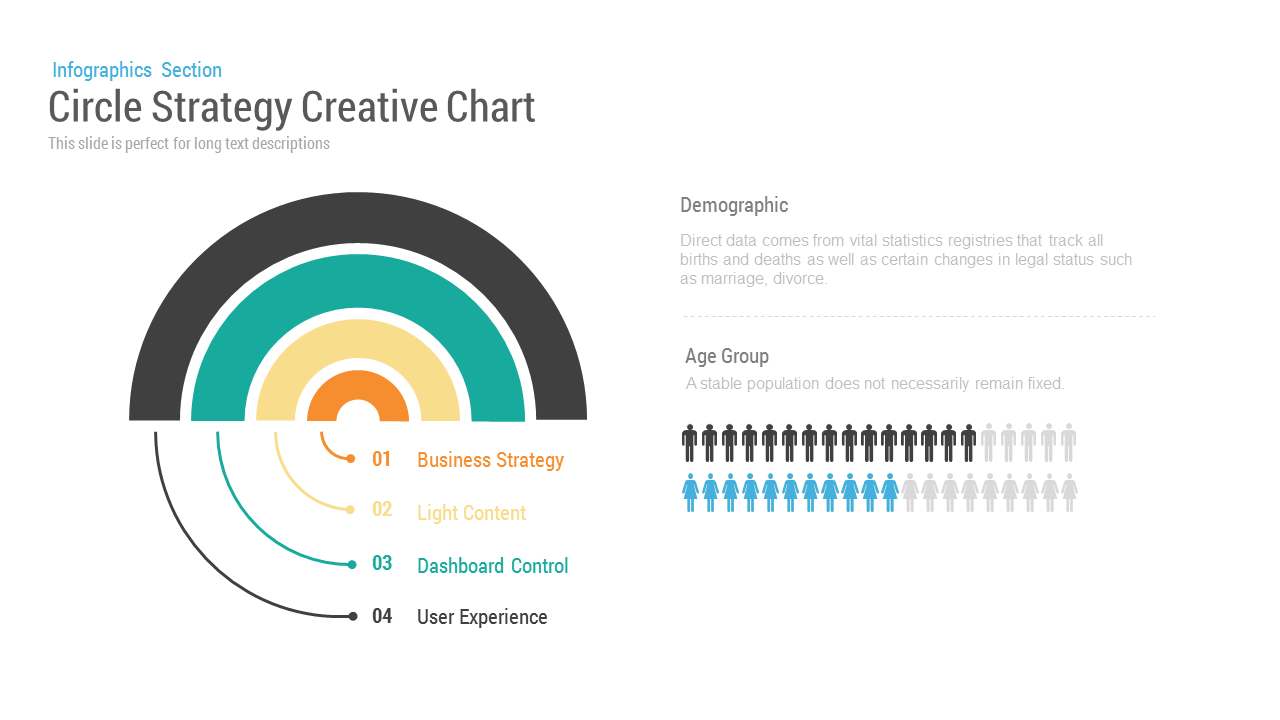
Circle Strategy Creative Chart PowerPoint template
Infographic
Premium
-
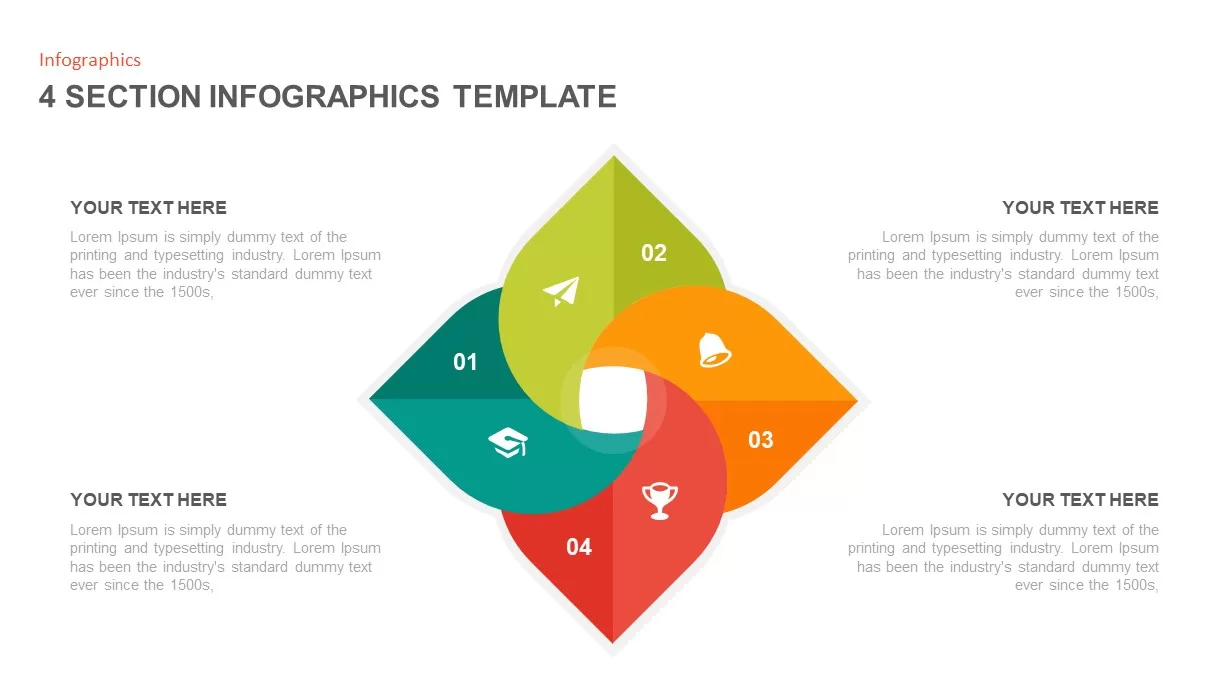
4 Section Infographic Template
Business Models
Premium
-
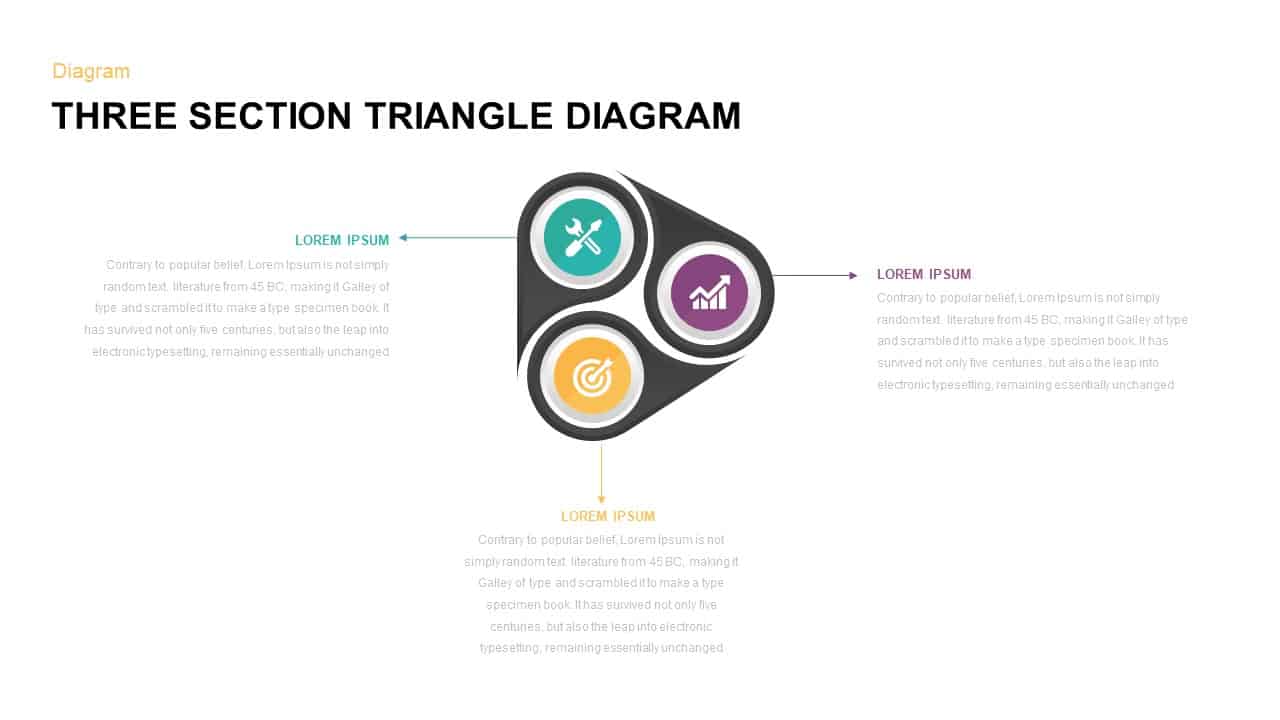
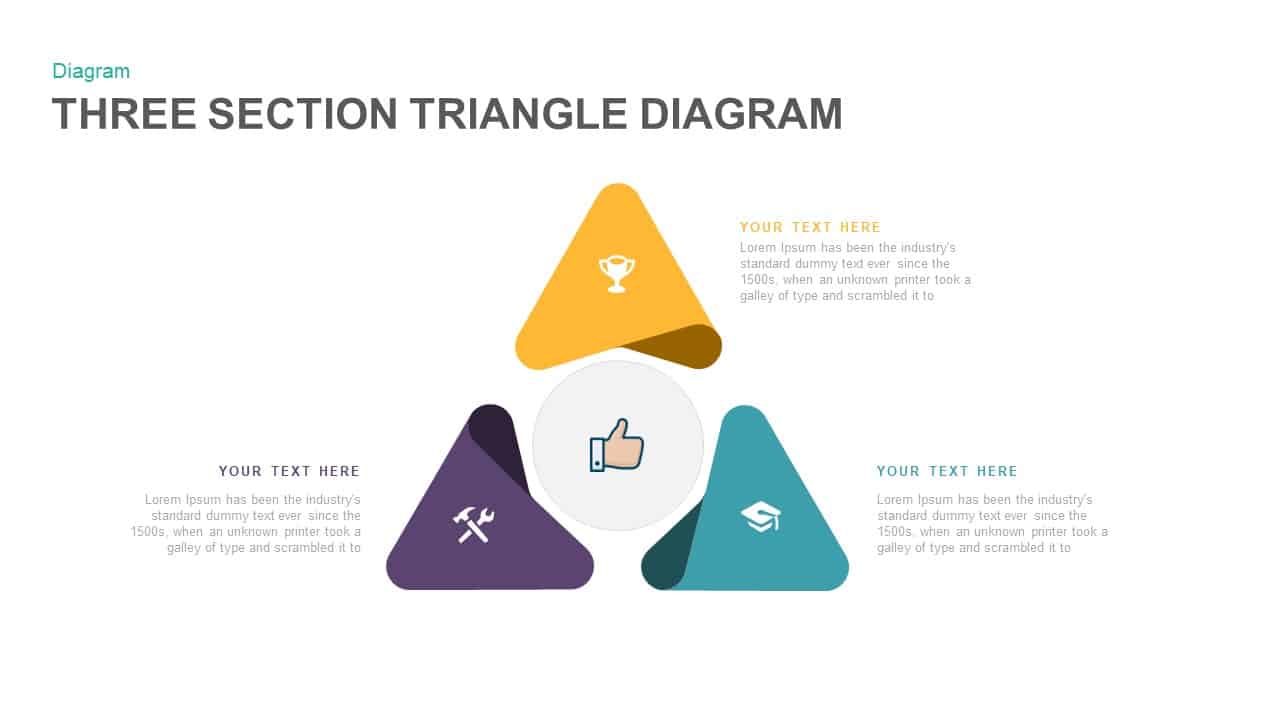
3 Section Triangle Diagram Template for PowerPoint
PowerPoint Templates
Premium
-
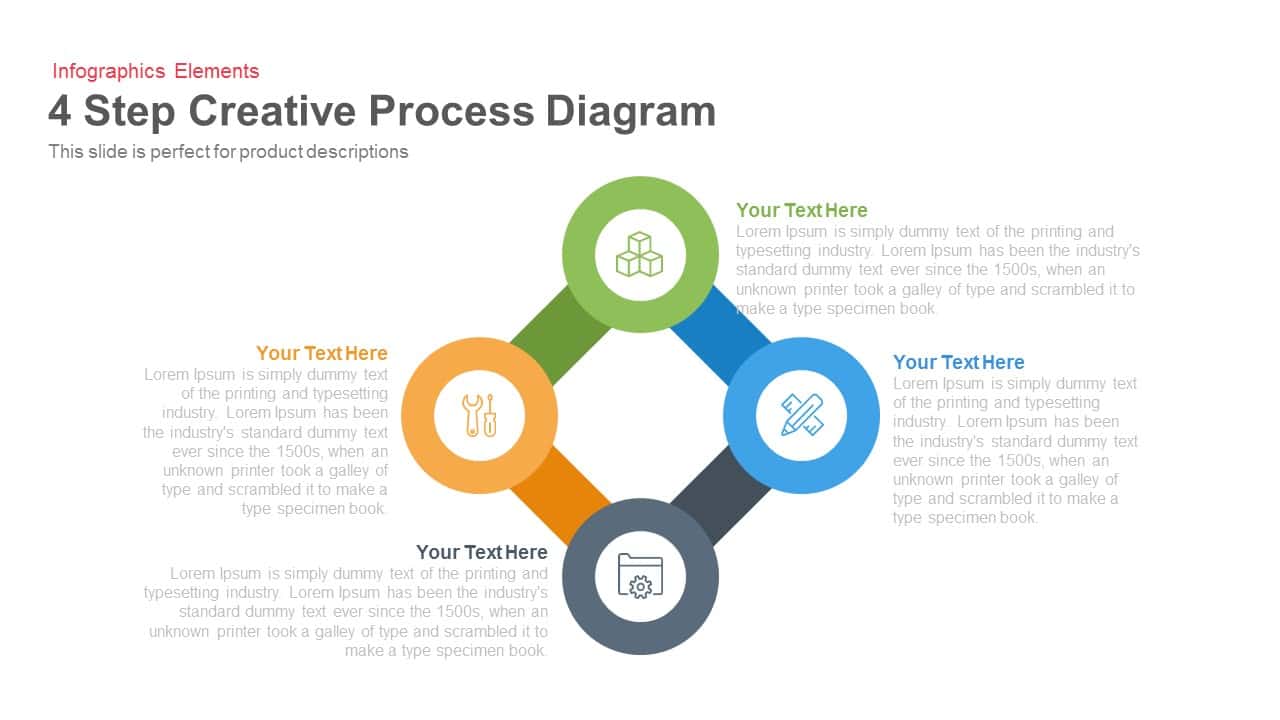
4 Step Creative Process Diagram PowerPoint Template and Keynote Slide
Business Models
Premium
-
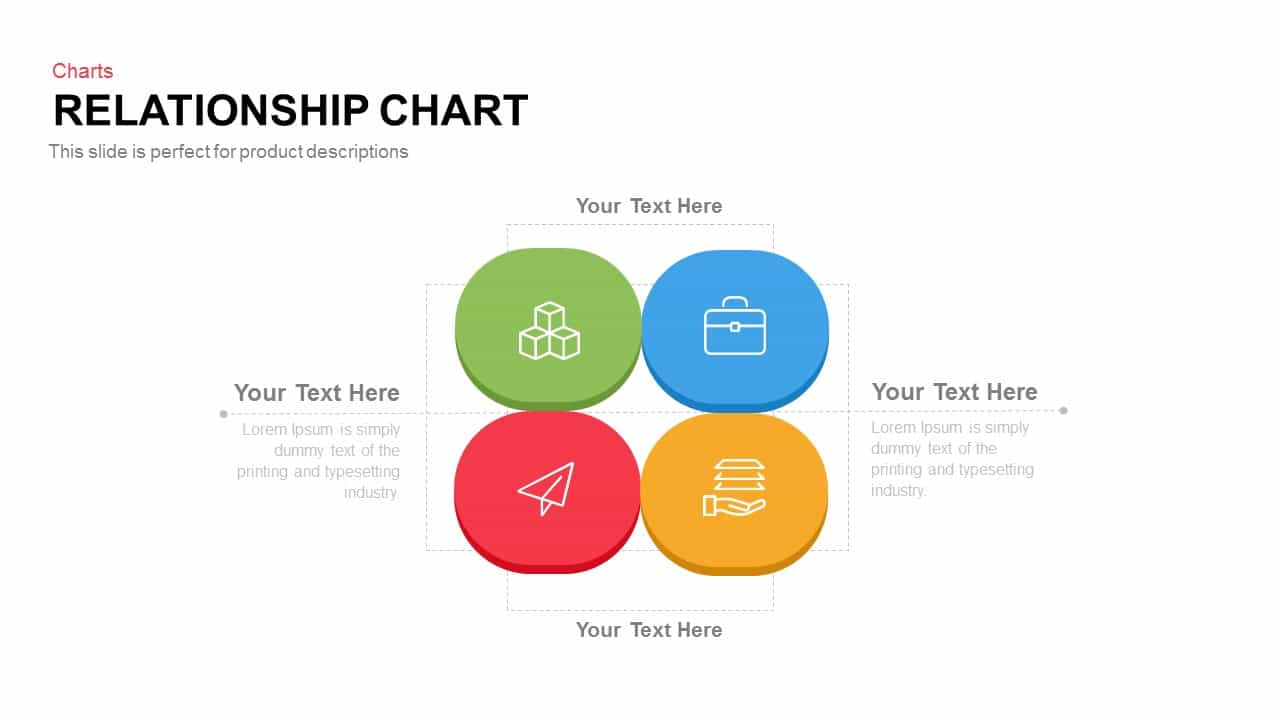
Relationship Chart PowerPoint Template and Keynote Slide
Diagrams
Premium
-
5 Staged Circle Diagram PowerPoint Template and Keynote
Infographic
Premium
-
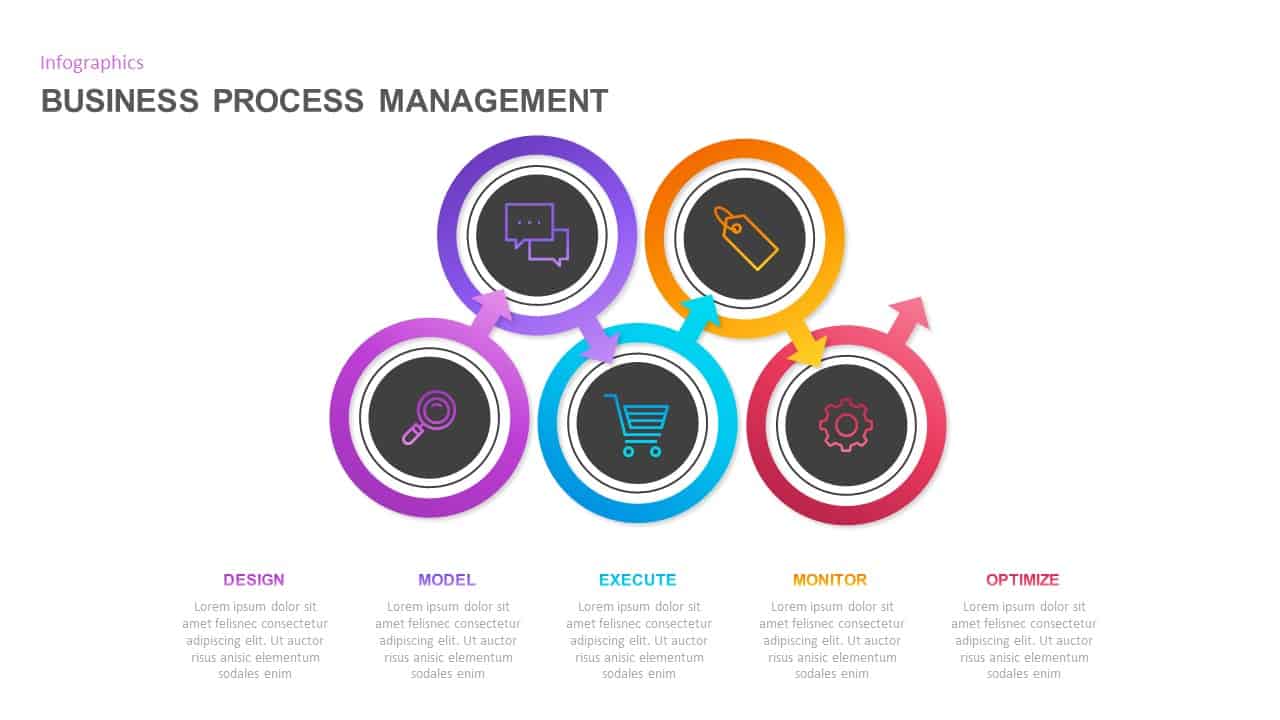
Business Process Management PowerPoint Template
Business Models
Premium
-
Circular CRM PowerPoint Template
Business Models
Premium
-
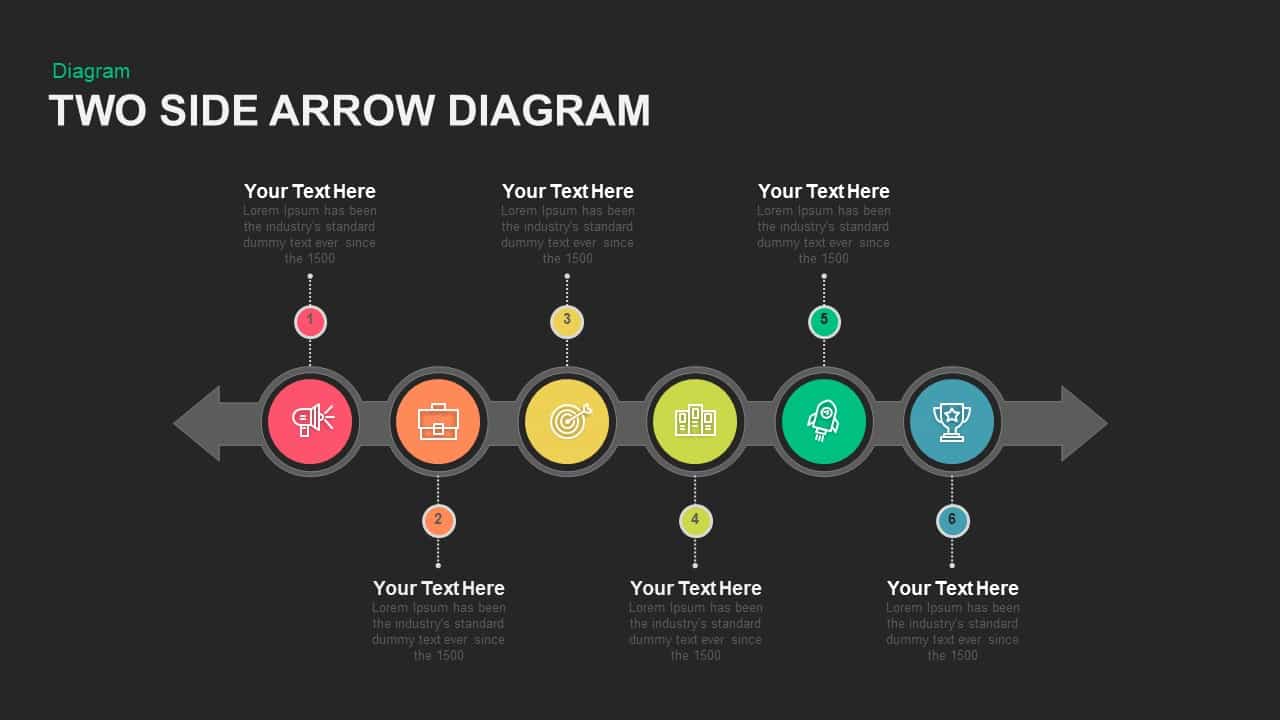
Two Sided Arrow Diagram PowerPoint Template and Keynote Slide
Arrow Diagrams
Premium
-
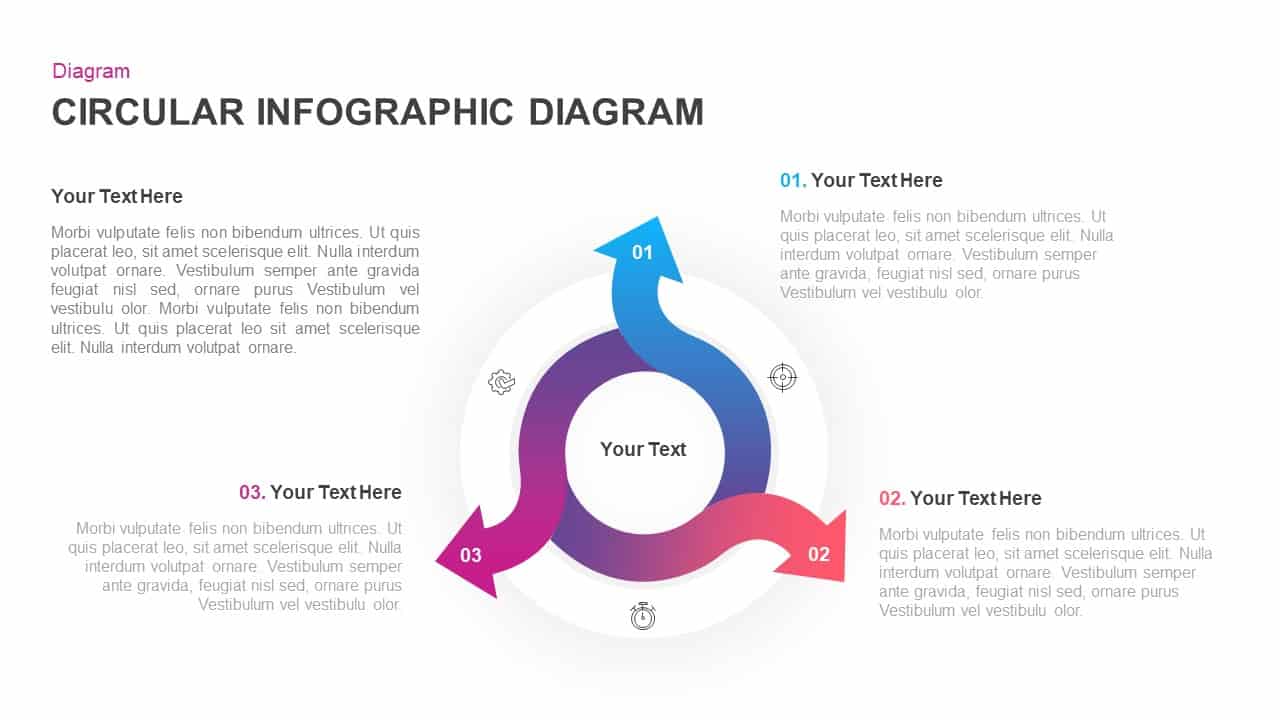
Infographic Circular Diagram for PowerPoint & Keynote
Circular Diagrams
Premium
-
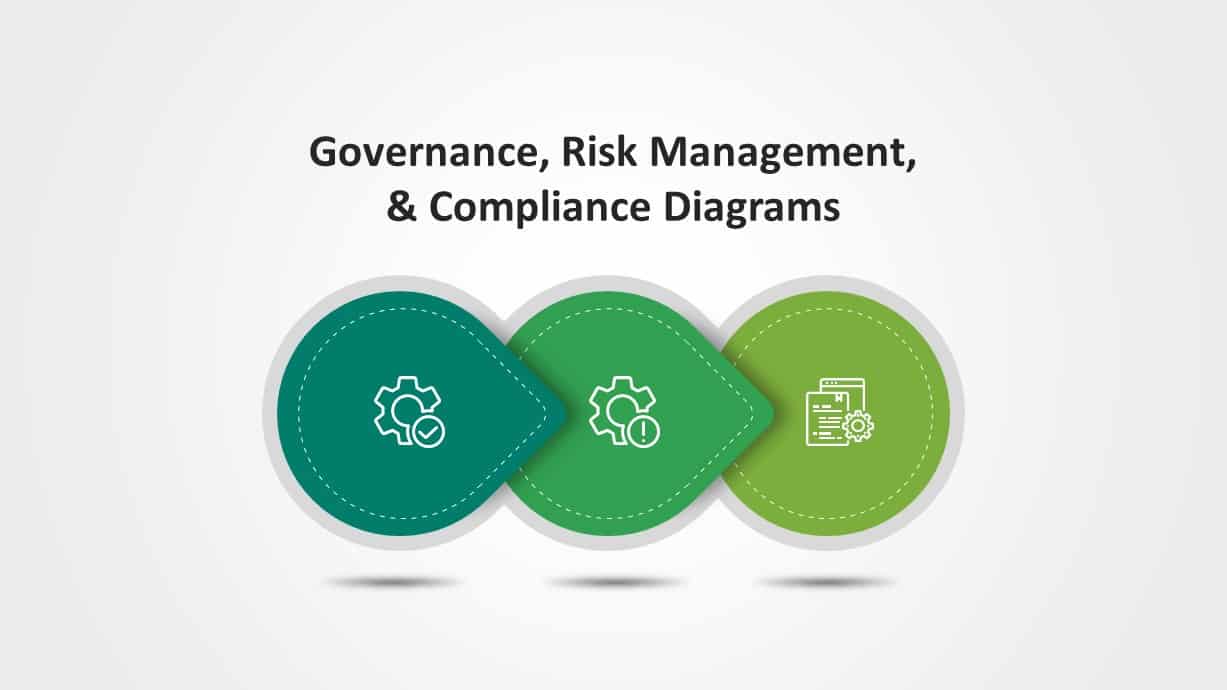
Governance, Risk Management and Compliance Slide Templates
Business Models
Premium
-
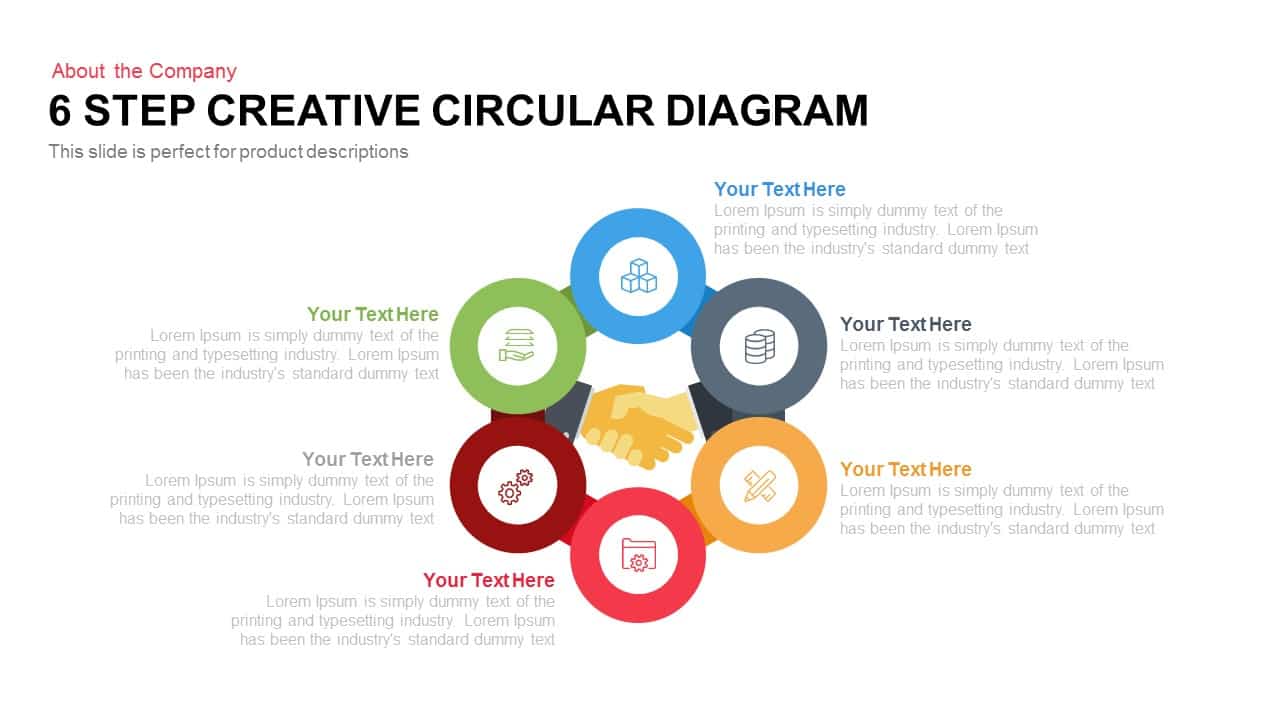
6 Step Creative Circular Diagram for PowerPoint & Keynote
Business Models
Premium
-
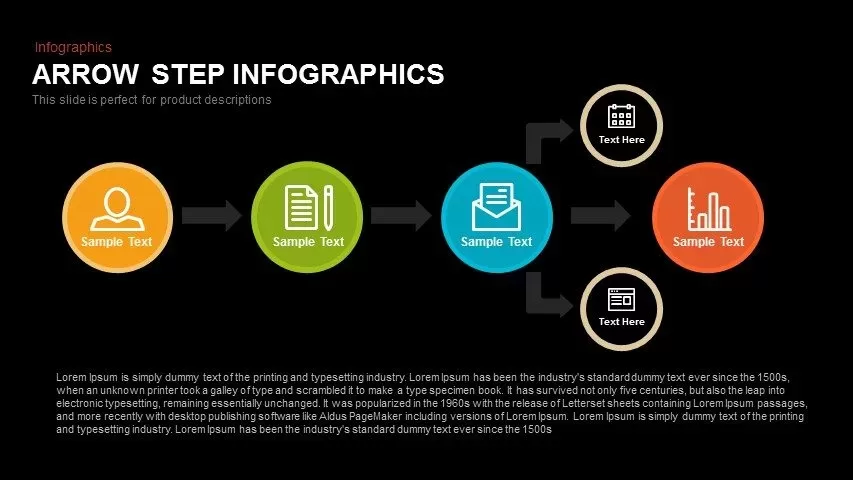
Step Infographics Arrow PowerPoint Template and Keynote Slide
Arrow Diagrams
Premium
-
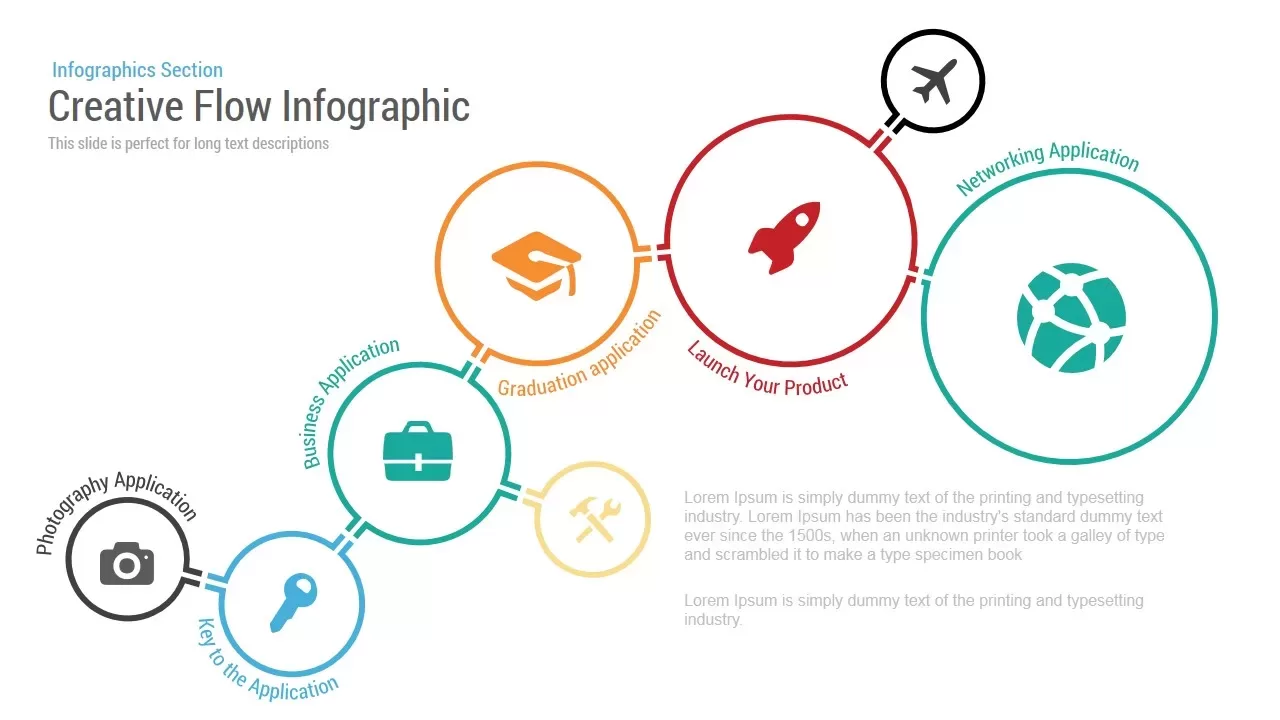
Creative Flow Infographic PowerPoint Template
Diagrams
Premium
-
4 and 6 Section Circle Diagram PowerPoint Template and Keynote Slide
Circular Diagrams
Premium
-
Circular Timeline PowerPoint Template
Circular Diagrams
Premium
-
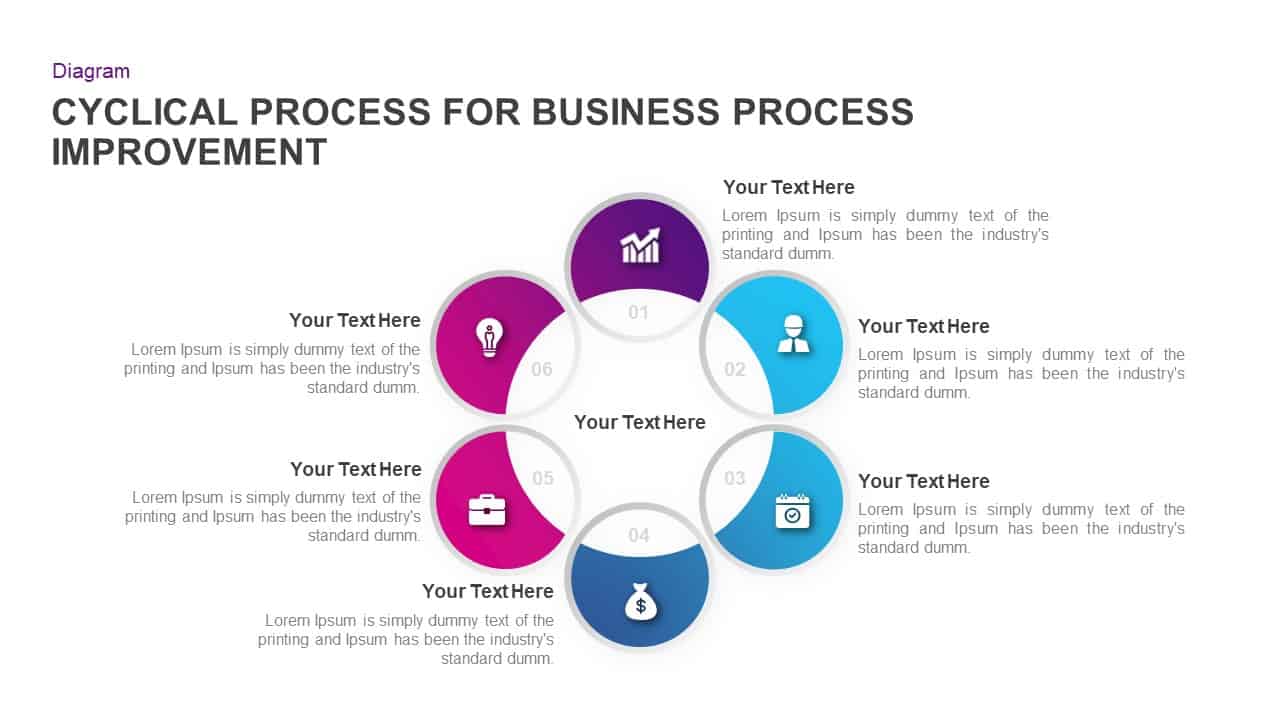
Cyclical Process for Business Process Improvement Ppt Diagram
Circular Diagrams
Premium
-
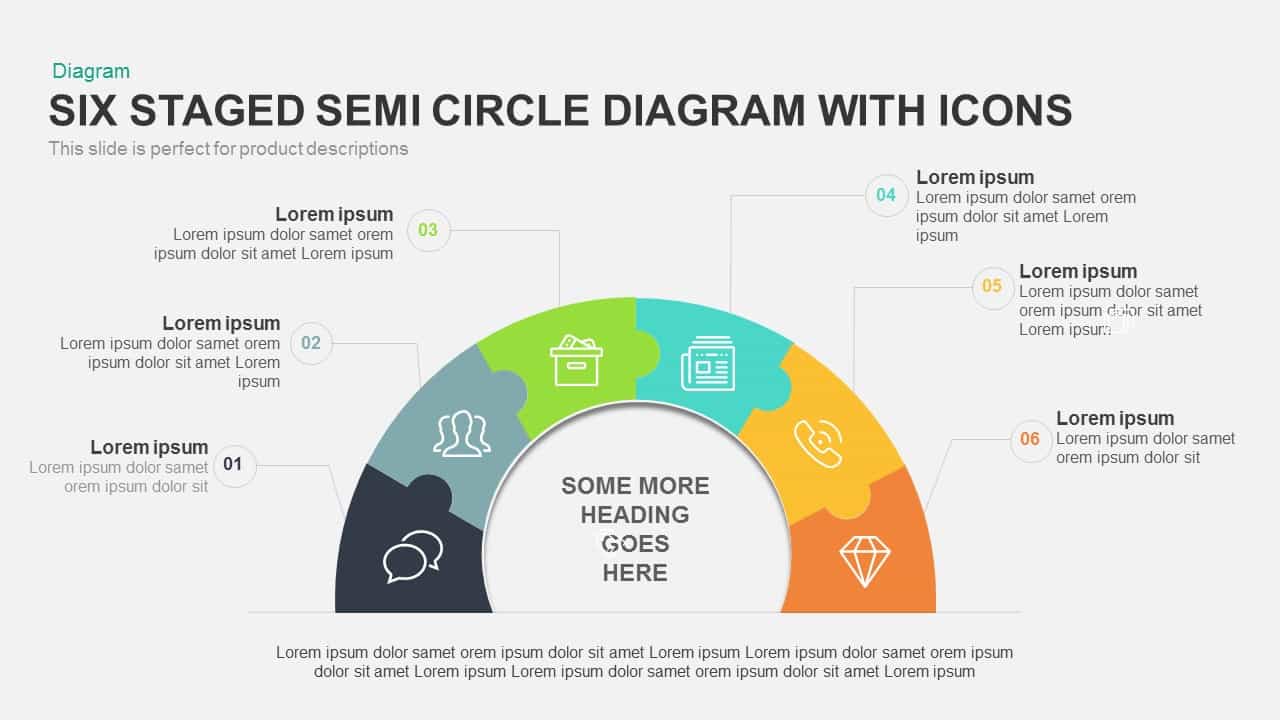
6 Staged Semi Circle Diagram PowerPoint Template with Icons
Diagrams
Premium
-
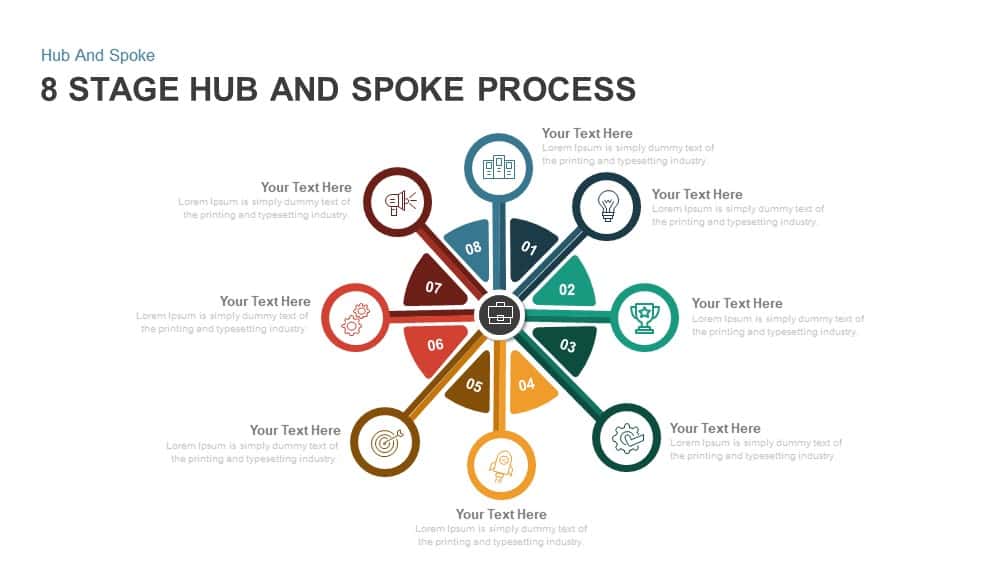
8 Stage Hub and Spoke Process PowerPoint Template and Keynote
Circular Diagrams
Premium
-
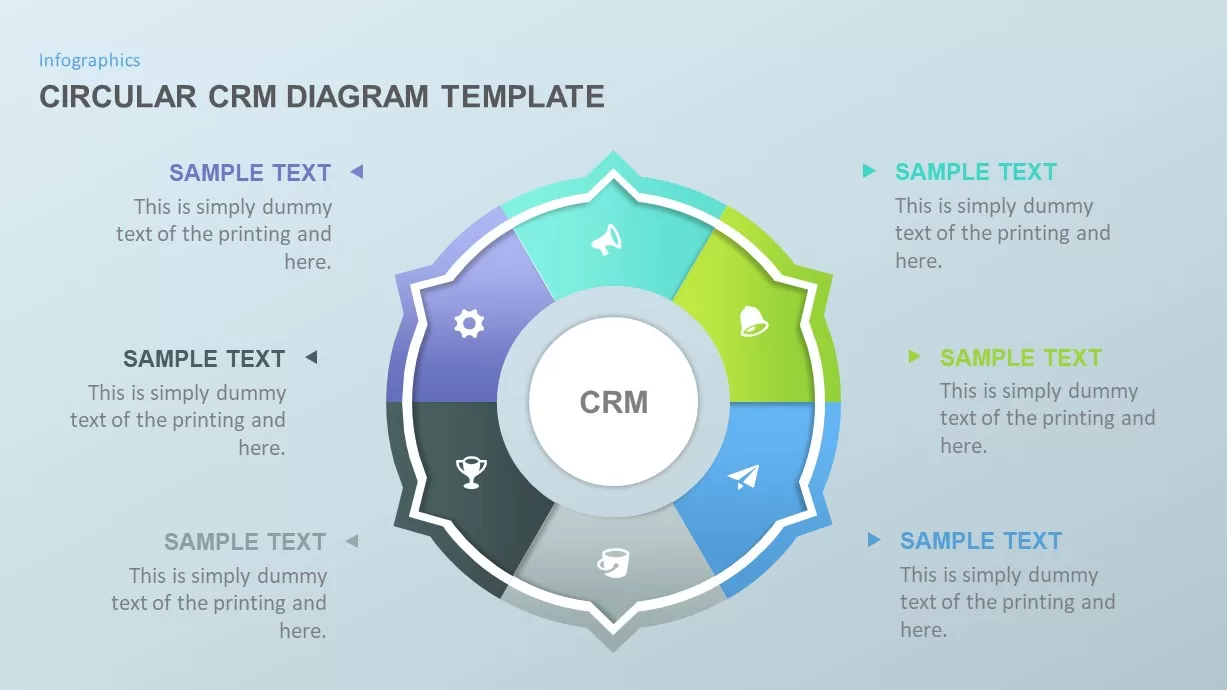
Circular CRM Diagram for PowerPoint & Keynote
Circular Diagrams
Premium
-
6 Steps Circle Diagram PowerPoint Template
Circular Diagrams
Premium
-
Cycle Object Infographic Free PowerPoint Template and Keynote Slide
Circular Diagrams
Free
-
Triangle Gear Diagram Template
Gear
Premium
-
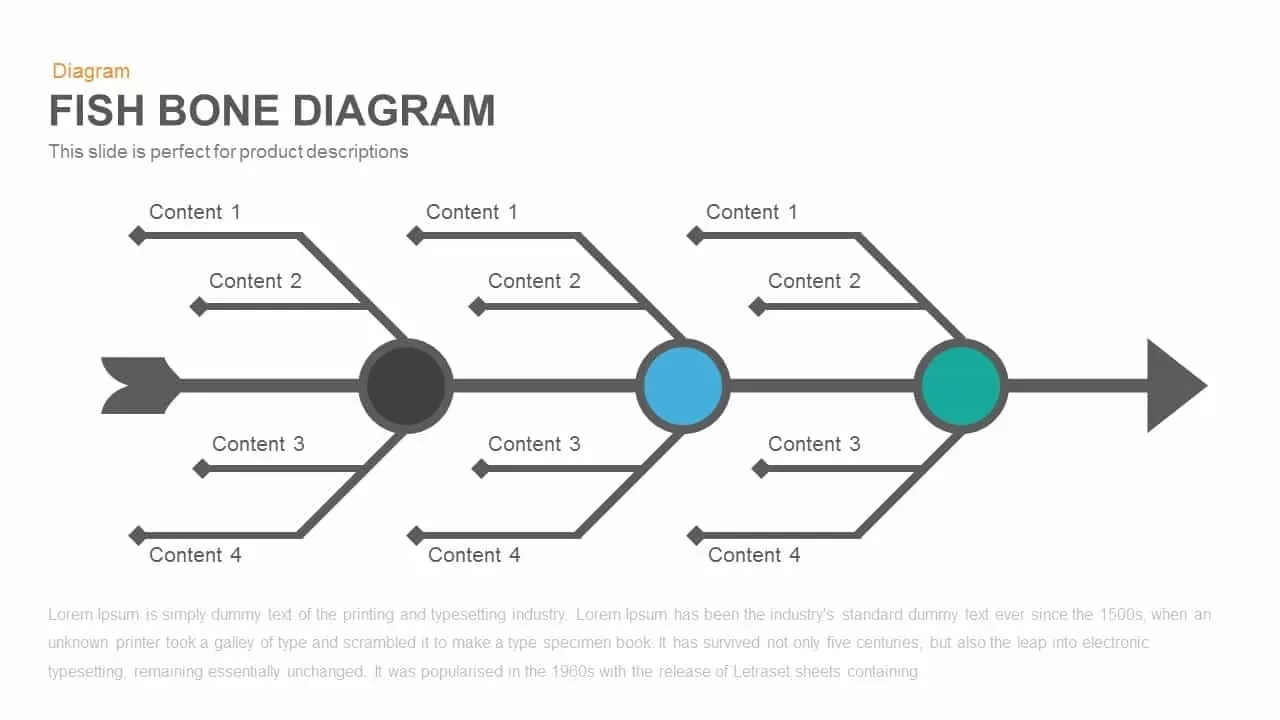
Fishbone Diagram PPT Template and Keynote Slide
Diagrams
Premium
-
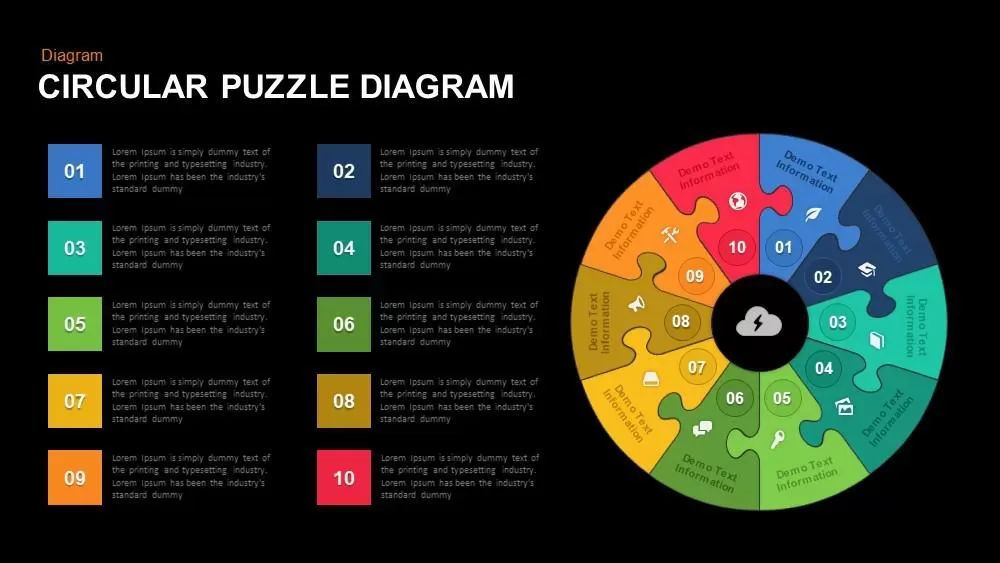
Circular Puzzle Diagram Template for PowerPoint and Keynote
Puzzle
Premium
-
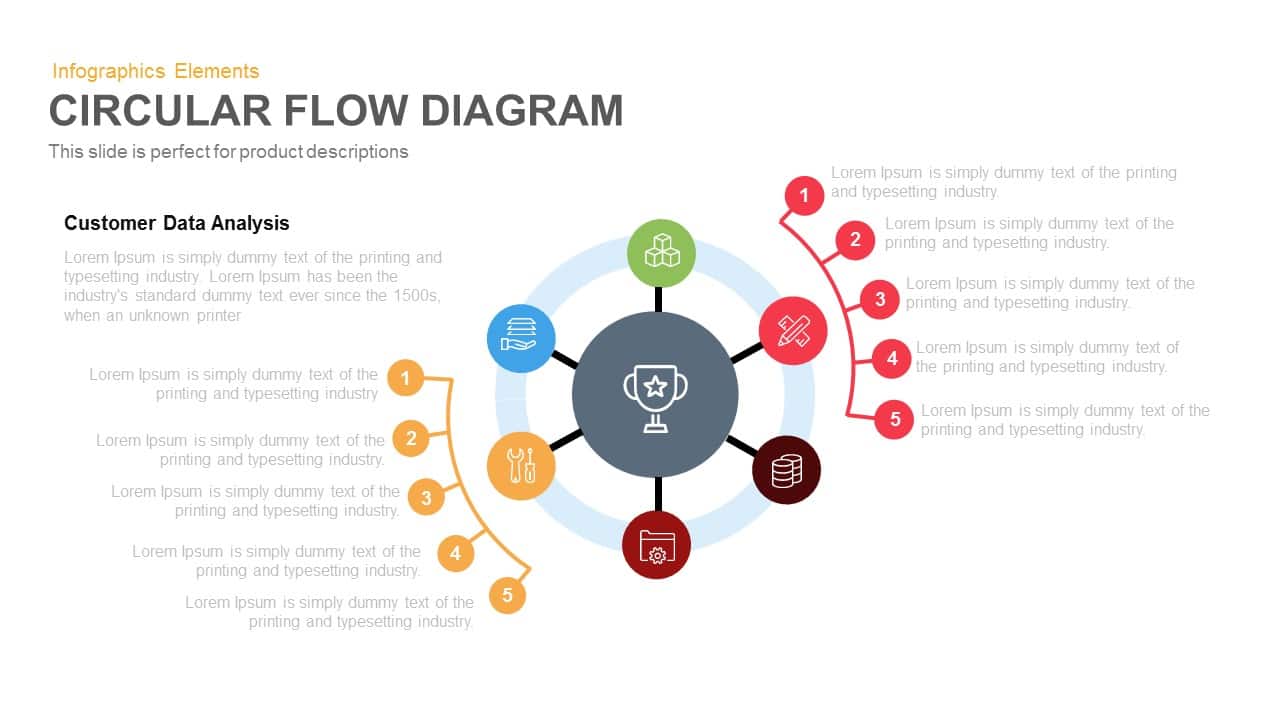
Circular Flow Diagram Template for PowerPoint and Keynote
Circular Diagrams
Premium
-
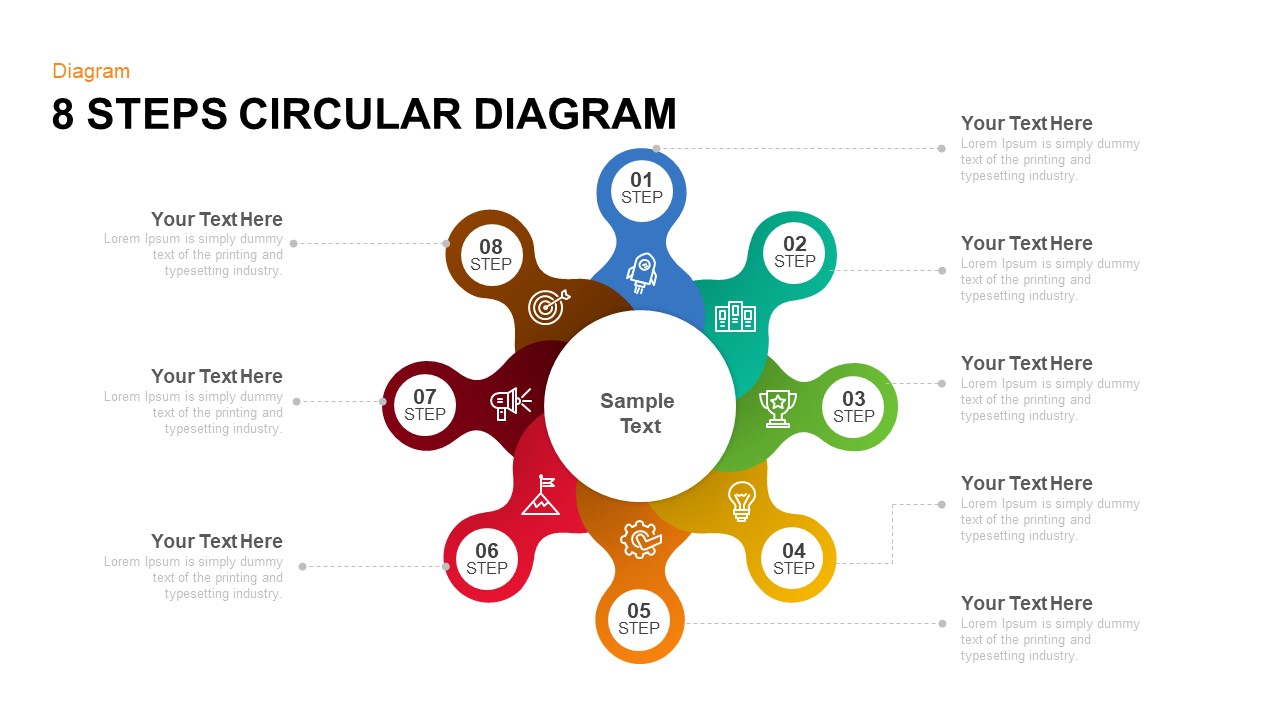
8 Steps Circular Diagram PowerPoint Template and Keynote Slide
Circular Diagrams
Premium
-
3 Section Triangle Diagram PowerPoint Template and Keynote Slide
Business Models
Premium
-
8 Steps Circular Process Diagram PowerPoint Template and Keynote Slide
Circular Diagrams
Premium
-
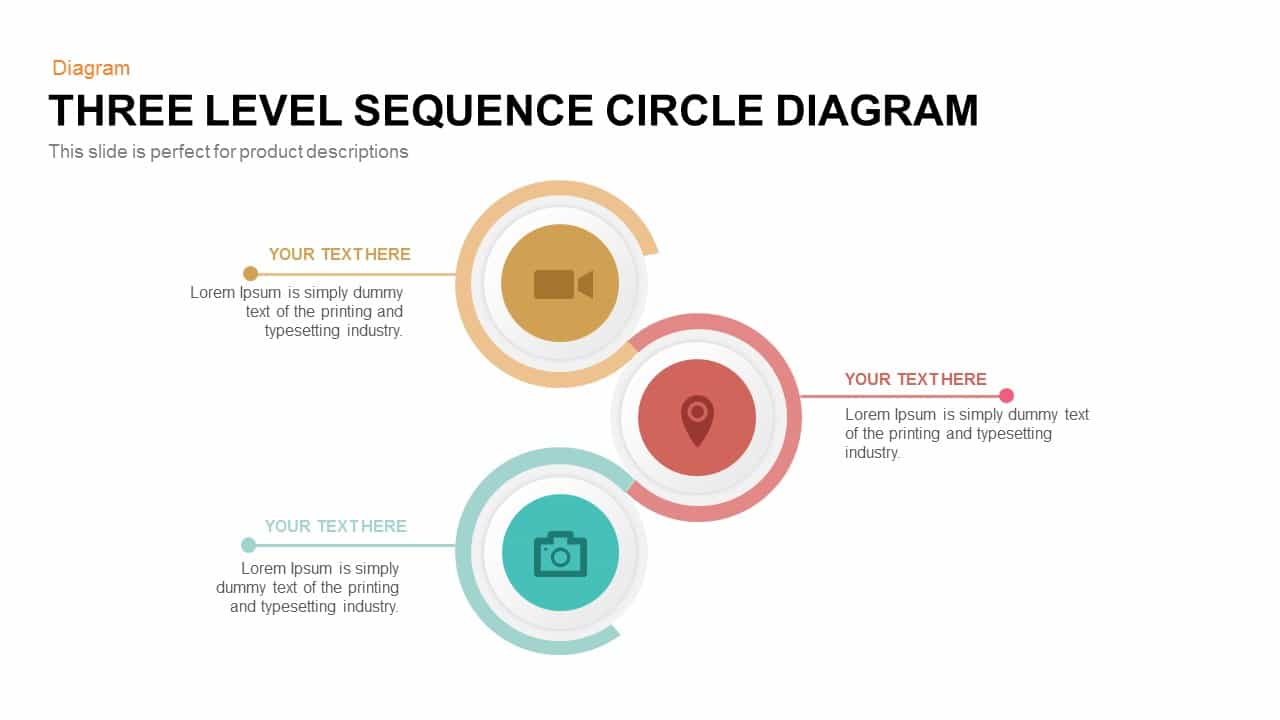
3 Level Sequence Circle Diagram PowerPoint Template and Keynote
Circular Diagrams
Premium
-
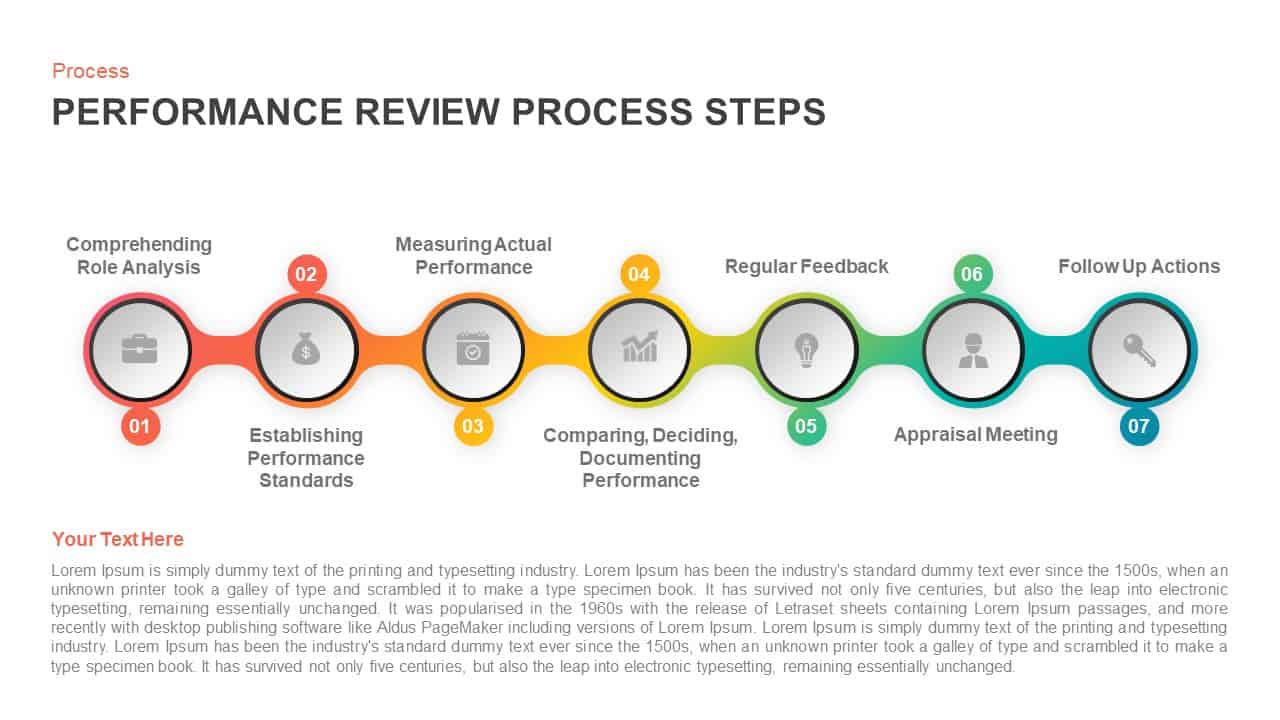
Performance Review Process Steps Timeline for PowerPoint Presentation
Keynote Templates
Premium
-
5 Step Creative Circular Diagram Design for PowerPoint and Keynote
Circular Diagrams
Premium
-
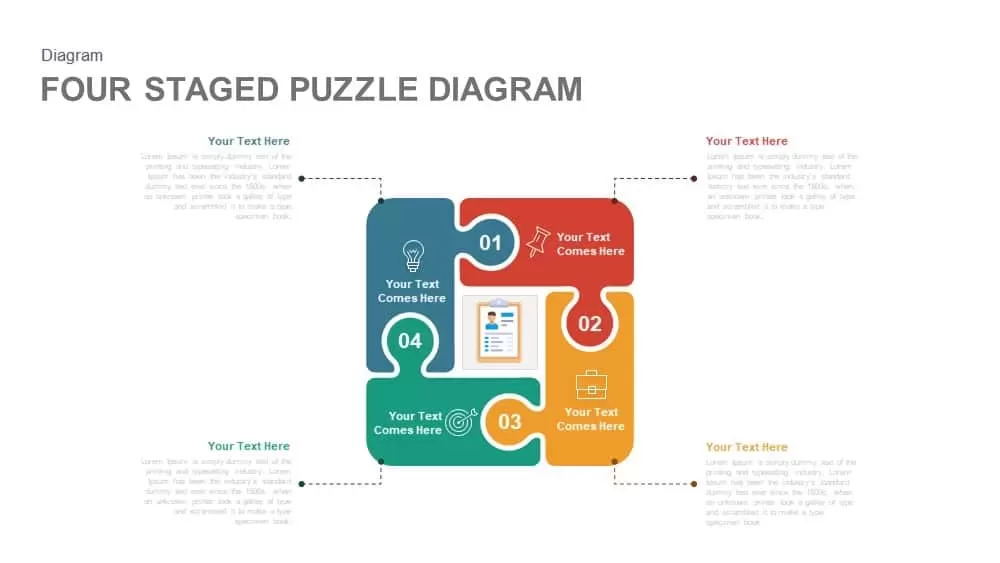
4 Staged PowerPoint Puzzle Diagram Template and Keynote Slide
Puzzle
Premium
-
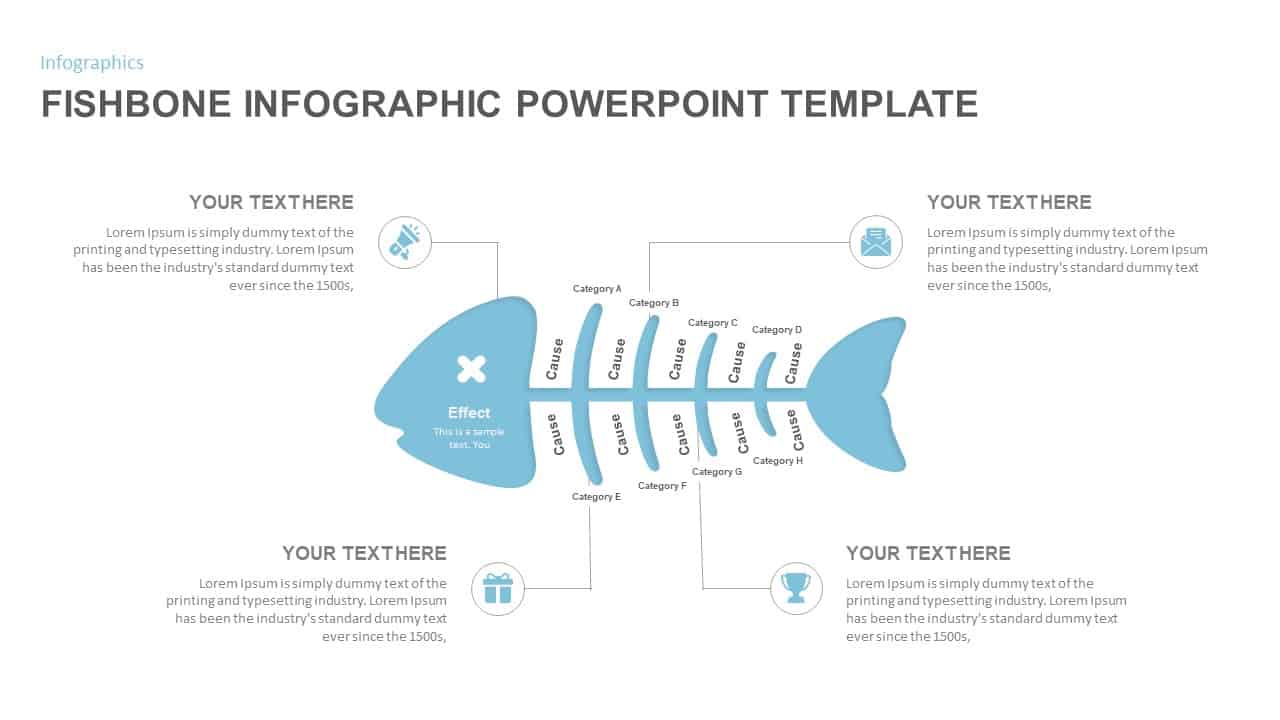
Fishbone Diagram PowerPoint Template
Fishbone PowerPoint Templates
Premium
-
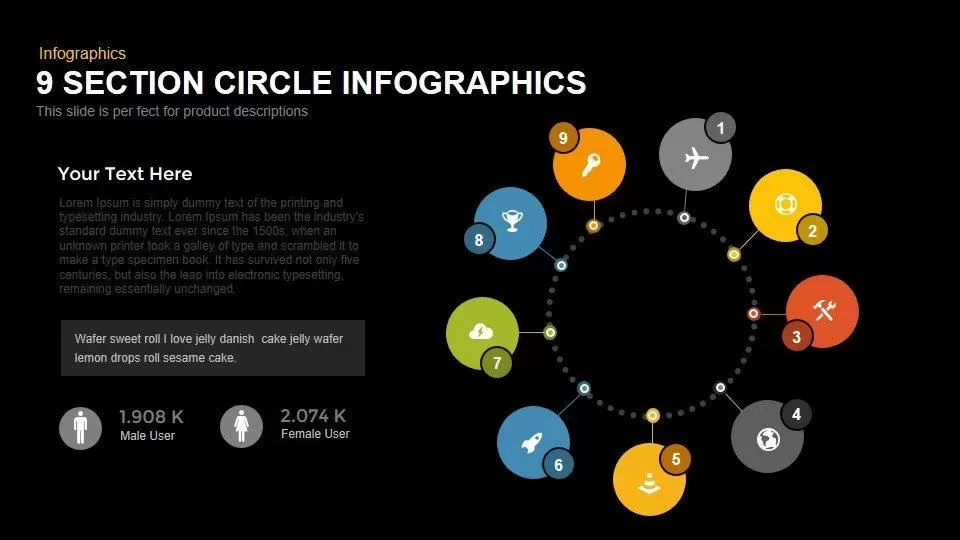
9 Section Circle PowerPoint Template and Keynote Infographics Slide
Circular Diagrams
Premium
-
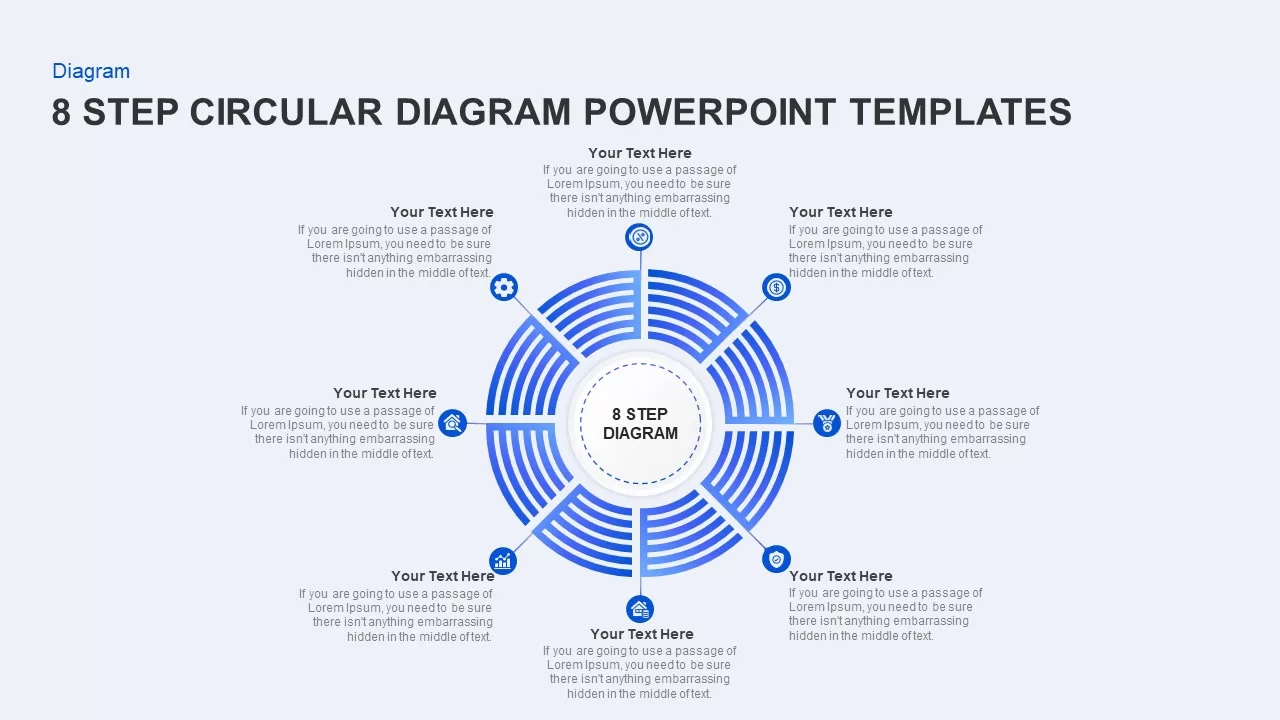
8 Step Circular Diagram for PowerPoint Presentation
Circular Diagrams
Premium
-
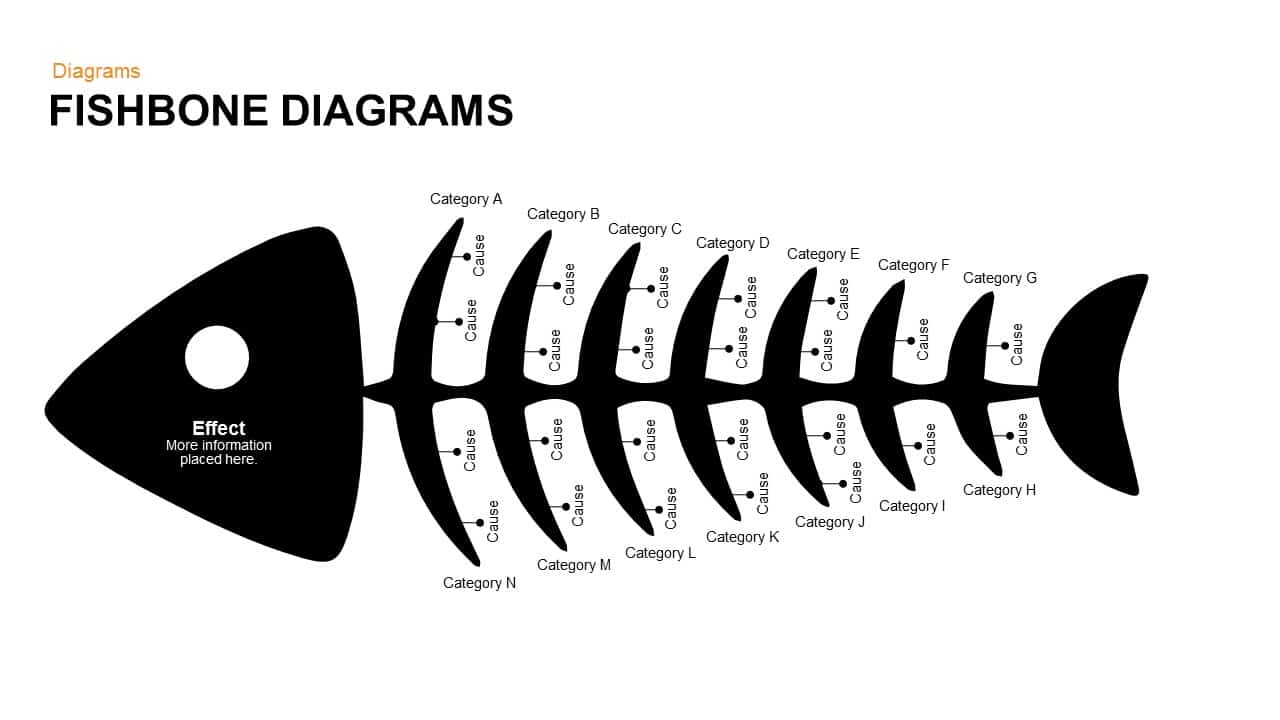
Fishbone Diagram PowerPoint Template and Keynote Slide
Diagrams
Premium
-
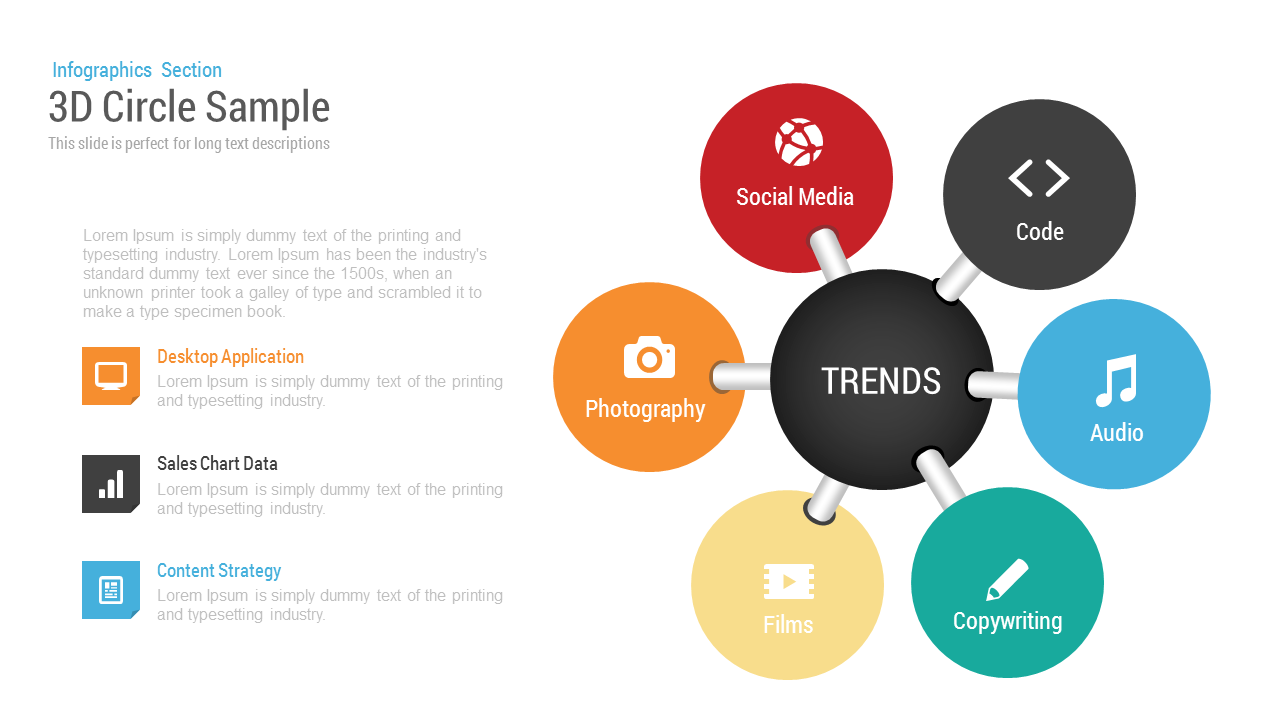
3D Circle Charts Infographics Template for PowerPoint & Keynote
Circular Diagrams
Premium
-
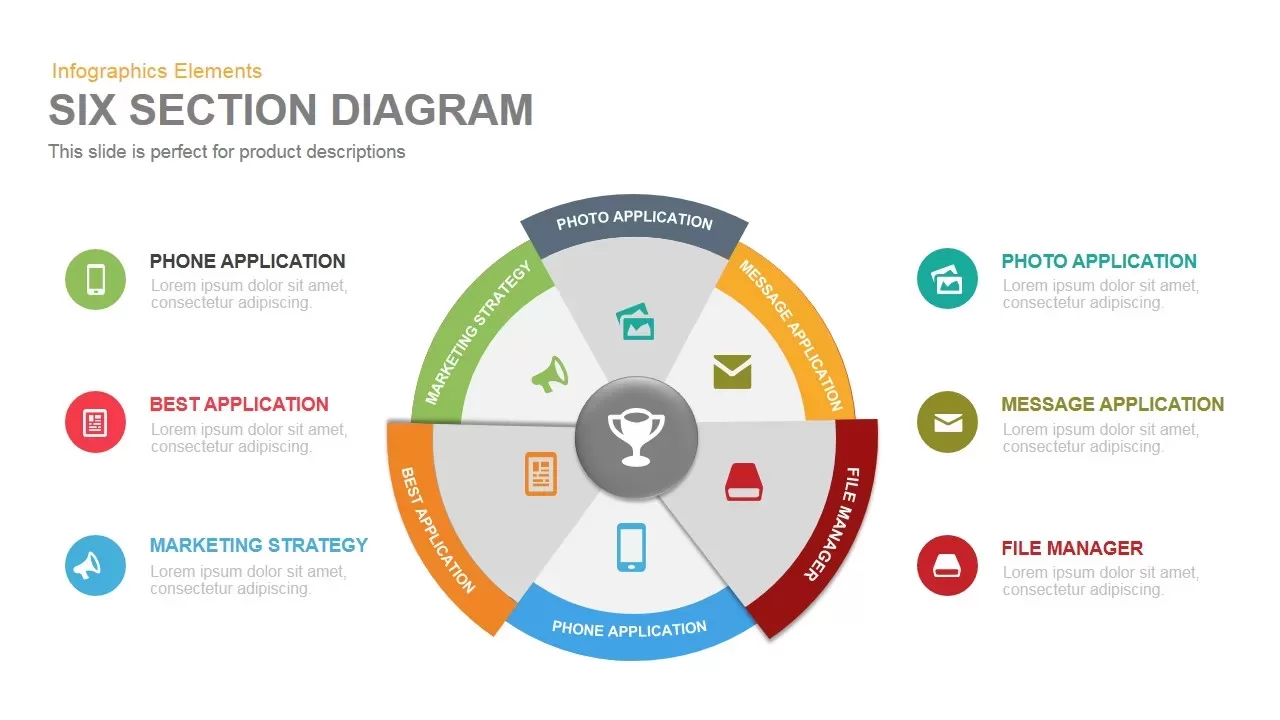
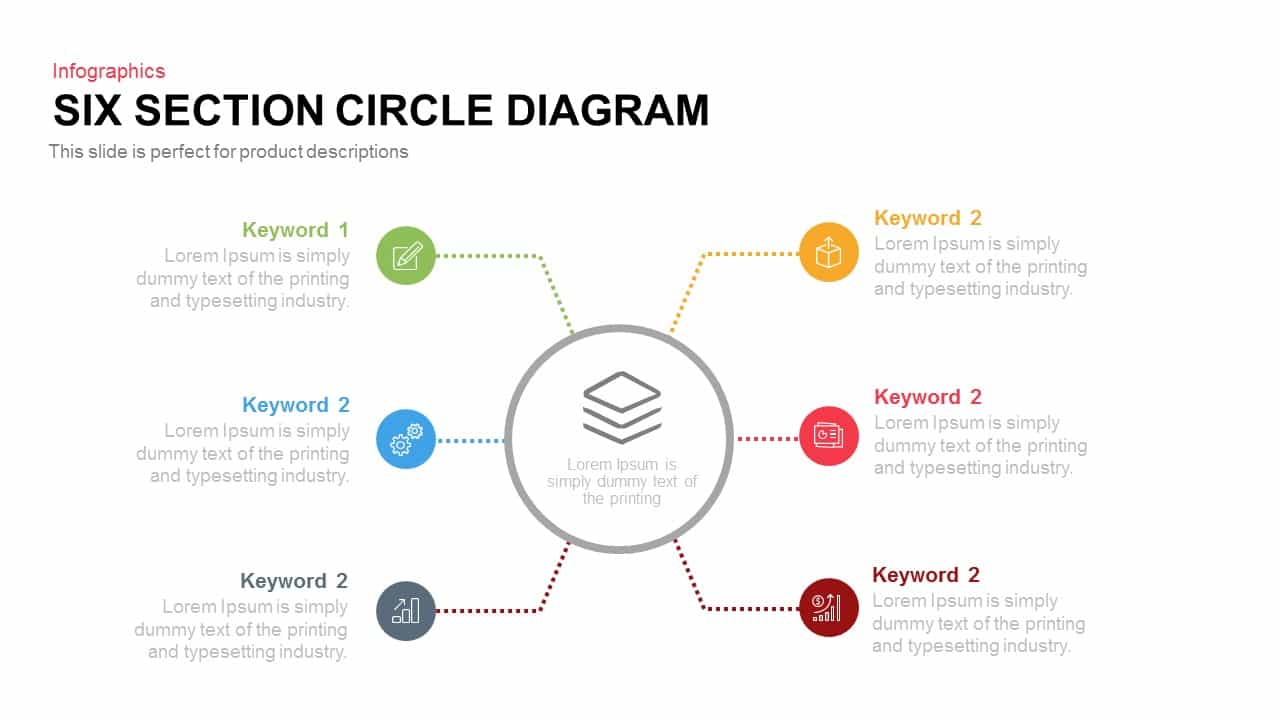
6 Section Diagram PowerPoint Template and Keynote Slide
Circular Diagrams
Premium
-
5 Section Arrow Diagram Template for PowerPoint and Keynote
Arrow Diagrams
Premium
-
Circle Split Diagram PowerPoint Template and Keynote Slide
Circular Diagrams
Premium
-
8-Steps Circular Ring PowerPoint Template and Keynote Slide
Circular Diagrams
Premium
-
Bubble Chart PowerPoint Template
PowerPoint Templates
Premium
-
Circle Spider Diagram Template for PowerPoint and Keynote Slide
Circular Diagrams
Premium