


Timeline Bar Chart PowerPoint


- Version
- Download 27
- File Size 0.00 KB
- File Count 1
- Create Date September 15, 2023
- Last Updated September 4, 2023
Timeline Bar Chart PowerPoint
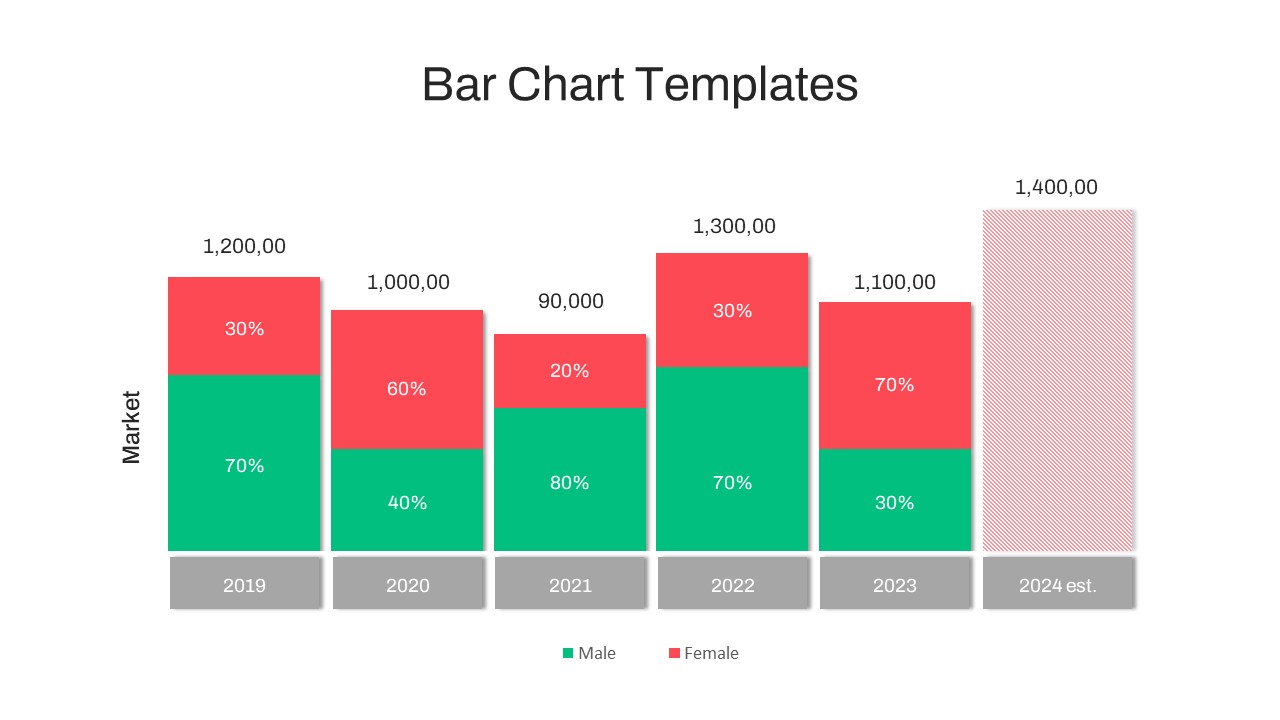
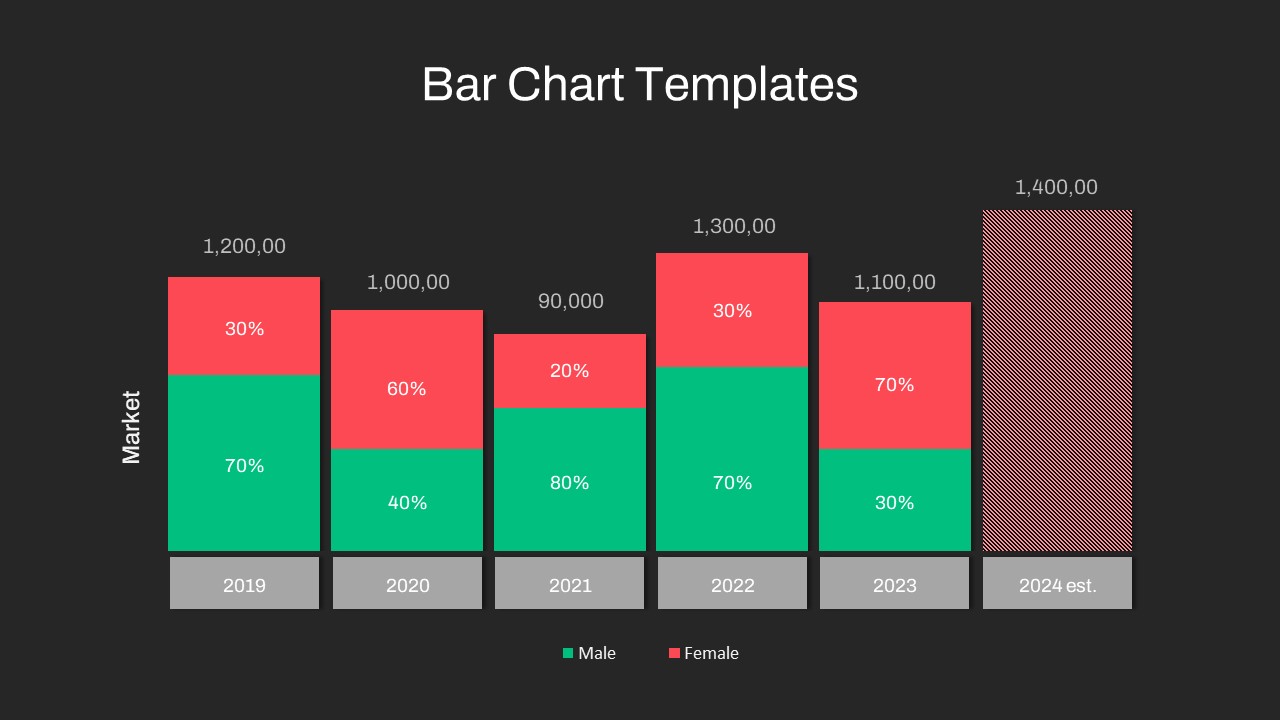
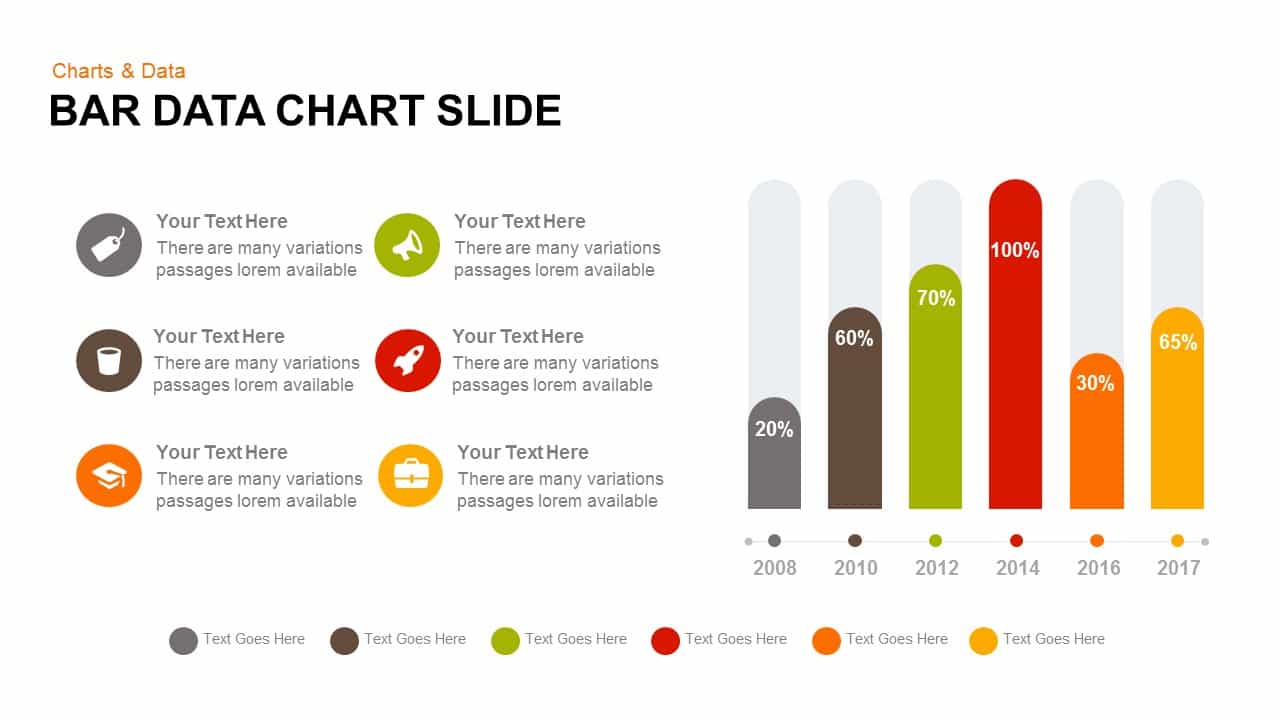
The Timeline Bar Chart PowerPoint Template combines the functionalities of a timeline and a bar chart, offering a visually compelling way to illustrate the progressive evolution of metrics over time. This timeline bar chart template features a dual-division bar chart, color-coded to highlight distinct phases or categories, enabling the audience to discern the complex transitions in data. at the end of the bar chart, a single-colour bar chart graces the presentation, aligned with a chronological timeline positioned at the bottom. This innovative fusion empowers presenters to effectively communicate the chronological advancements of metrics, fostering a deeper understanding of the data's narrative and significance.
The timeline bar chart template for PowerPoint presentations has many uses. One of its significant applications lies in visualizing the evolution of public opinion over time. For instance, when gauging shifts in election preferences, this template proves invaluable by vividly illustrating the changing sentiment towards various political parties through color-coded divisions of red and green. Simultaneously, the lower timeline component of the chart provides a dynamic representation of these fluctuations, offering a comprehensive view of the temporal changes in popular sentiment.
Whether you're analyzing electoral dynamics, tracking consumer sentiment, or presenting historical trends, the timeline bar chart template effectively briefs the essence of changing opinions and trends. Its user-friendly format facilitates clear communication of complex data, making it an indispensable tool for conveying nuanced information to diverse audiences. By using the power of this statistical template, you can explain the evolution of ideas, preferences, and viewpoints with striking visuals that engage, inform, and captivate your audience.
The One pager slide in two background options is a generic bar diagram created for research purposes. It comes with two background options. This PowerPoint bar chart timeline template facilitates the discussion of various statistical trend analyses, making it well-suited for presenting industry-wide business data. It enables you to convey data clearly and straightforwardly, ensuring that viewers comprehend the information without any confusion. Feel free to download and customize this graphical representation to align with your specific needs. Get it now!
Attached Files
| File | Action |
|---|---|
| https://premiumdownloads.s3.amazonaws.com/SB03747-Timeline Bar Chart PowerPoint .ZIP | Download |
Login to download this file
Add to favorites
Add to collection
-

Item ID
SB03747 -

Related Templates
-

Free Vertical PowerPoint Template
PowerPoint Business Templates
Free
-

Nature PowerPoint Presentation Template
PowerPoint Business Templates
Premium
-

Research Proposal PowerPoint Template
PowerPoint Templates
Premium
-

Sales Deck Free PowerPoint Template
PowerPoint Templates
Free
-

Cab Service PowerPoint Template
PowerPoint Templates
Premium
-

Gym PowerPoint Template
PowerPoint Templates
Premium
-

Free Nursing Capstone PowerPoint Deck
PowerPoint Templates
Free
-

Travel Agency PowerPoint Template
PowerPoint Templates
Premium
-

VET Clinic PowerPoint Template
PowerPoint Templates
Premium
-

Free Space Minimal Deck Template
PowerPoint Templates
Free
-

IoT Presentation Template
PowerPoint Templates
Premium
-

Free Physical Education PowerPoint Template Deck
Free PowerPoint Templates
Free
-

Effective Communication PowerPoint Template
PowerPoint Templates
Premium
-

PowerPoint Quiz With Timer
PowerPoint Templates
Premium
-

Graph Paper PowerPoint Template Deck
PowerPoint Templates
Premium
-

Free Economics PowerPoint Template
Free PowerPoint Templates
Free
-

Macroeconomics PowerPoint Template
PowerPoint Templates
Premium
-

Customer Experience Loyalty PowerPoint Deck Template
PowerPoint Templates
Premium
-

Free Army PowerPoint Template
PowerPoint Templates
Free
-

Free Charity PowerPoint Template Deck
PowerPoint Templates
Free
-

Free Aviation PowerPoint Template
Free PowerPoint Templates
Free
-

Free Cartoon PowerPoint Template
Free PowerPoint Templates
Free
-

Free Real Estate Listing PowerPoint Template
Free PowerPoint Templates
Free
-

Free Event Planning PowerPoint Template
Free PowerPoint Templates
Free
-

Free Book Review PowerPoint Template
Free PowerPoint Templates
Free
-

Free University Presentation PowerPoint Template
PowerPoint Templates
Free
-

Animated Agriculture PowerPoint Deck Template
PowerPoint Templates
Premium
-

Annual Report PowerPoint Template and Keynote
PowerPoint Templates
Premium
-

Creative Bar Chart Data Analysis PowerPoint Template and Keynote
Infographic
Premium
-

Global Warming Infographic PowerPoint Template Deck
PowerPoint Templates
Premium
-

EFQM Model PowerPoint Template
PowerPoint Templates
Premium
-

Pencil Bar Chart PowerPoint Template and Keynote Slide
Column and Bar chart
Premium
-

Free Dunder Mifflin Paper Company Pitch Deck
Free PowerPoint Templates
Free
-

Data Science PowerPoint Template
PowerPoint Templates
Premium
-
Simple Bar Chart PowerPoint Template
Column and Bar chart
Premium
-
Creative Bar Chart Analysis PowerPoint Template and Keynote
Column and Bar chart
Premium
-

Radial Bar Chart PowerPoint Templates and Keynote Slides
PowerPoint Charts
Premium
-

Real Estate PowerPoint Theme
PowerPoint Themes
Premium
-
Evolution Line Chart PowerPoint Template
PowerPoint Templates
Premium
-

Animated Clustered Bar Chart PowerPoint Template
PowerPoint Charts
Premium
-
Radial Bar Chart Template for PowerPoint and Keynote
Circular Diagrams
Premium
-
Progress Bar Chart PowerPoint Template
PowerPoint Templates
Premium
-
Clustered Bar Chart PowerPoint Template
Column and Bar chart
Premium
-
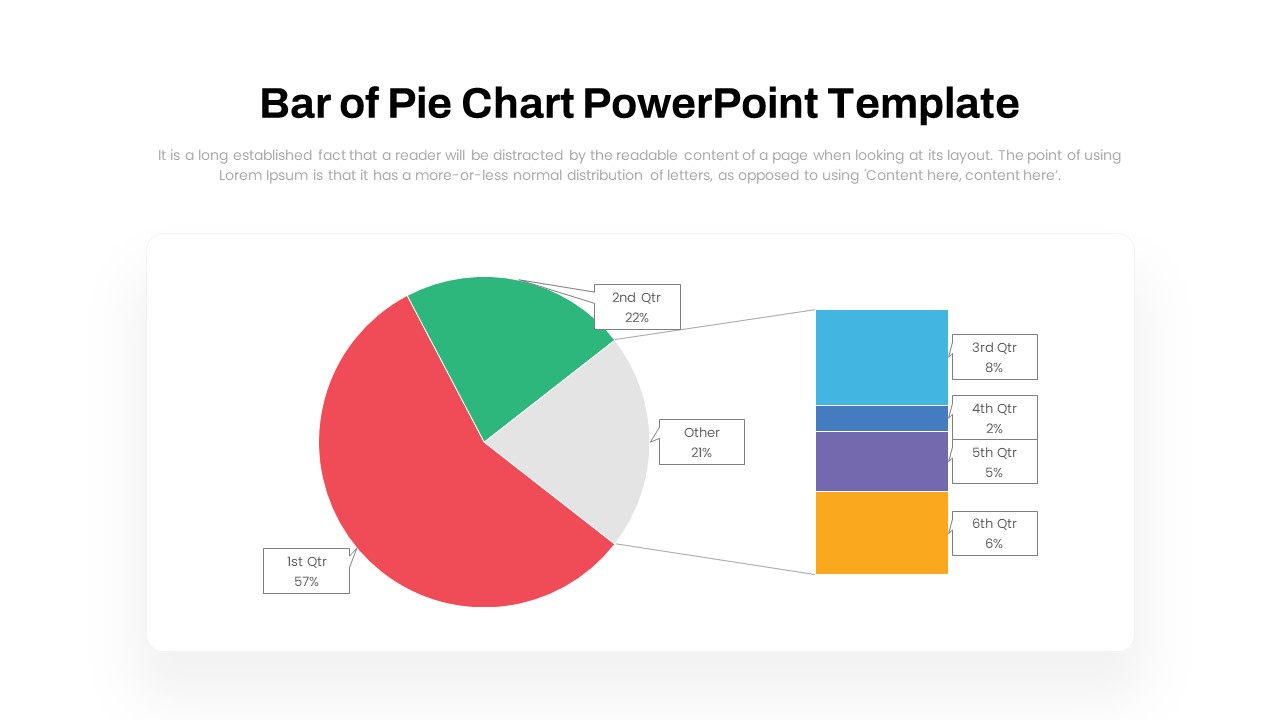
Bar of Pie Chart PowerPoint Template
PowerPoint Templates
Premium
-

Free AI Artificial Intelligence PowerPoint Template
PowerPoint Templates
Free
-

Stakeholder Register PowerPoint Template
PowerPoint Templates
Premium
-
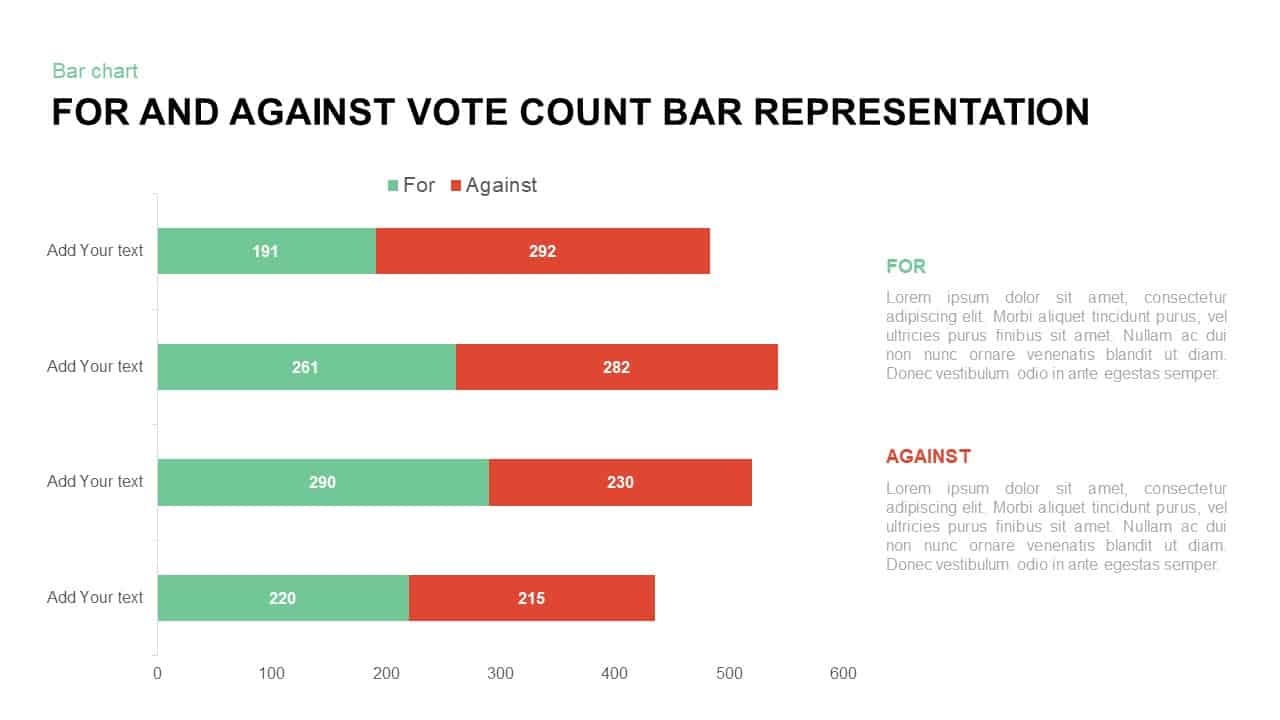
For and Against Vote Count Bar Chart for PowerPoint Presentation
Column and Bar chart
Premium
-

Business Process Reengineering Template
PowerPoint Templates
Premium
-
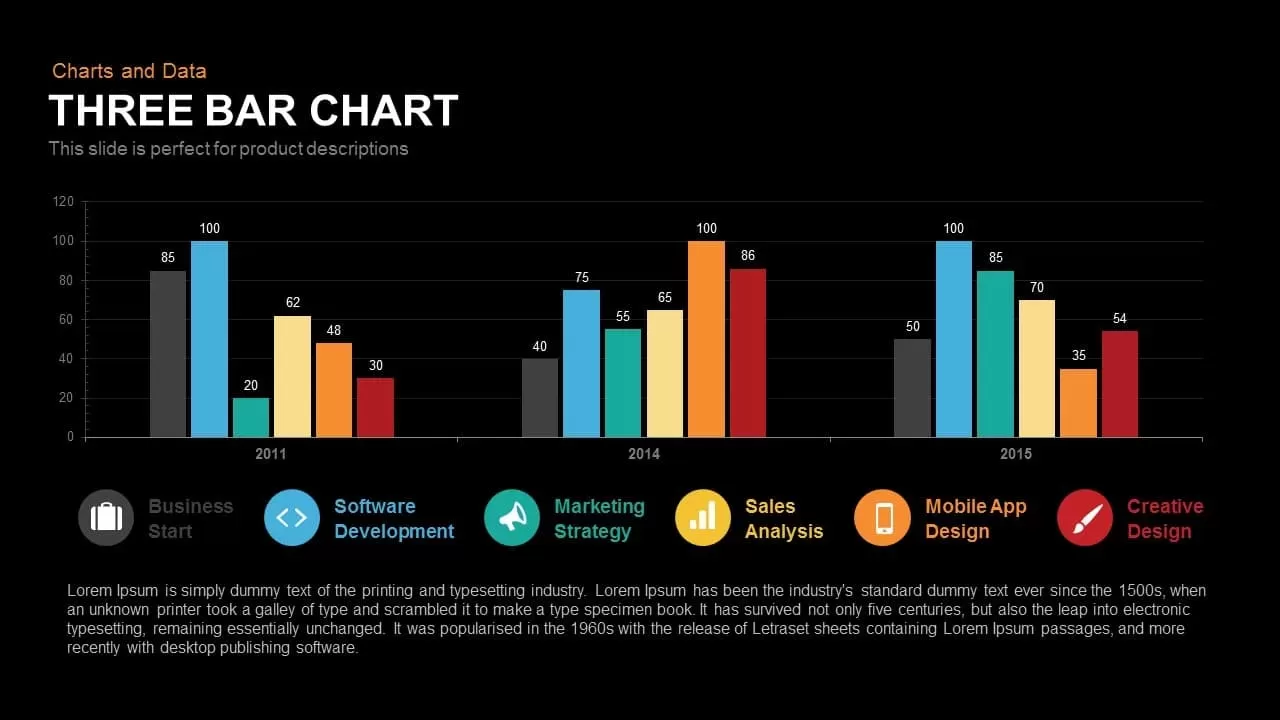
3 Bar Chart PowerPoint Template and Keynote Slide
Column and Bar chart
Premium
-
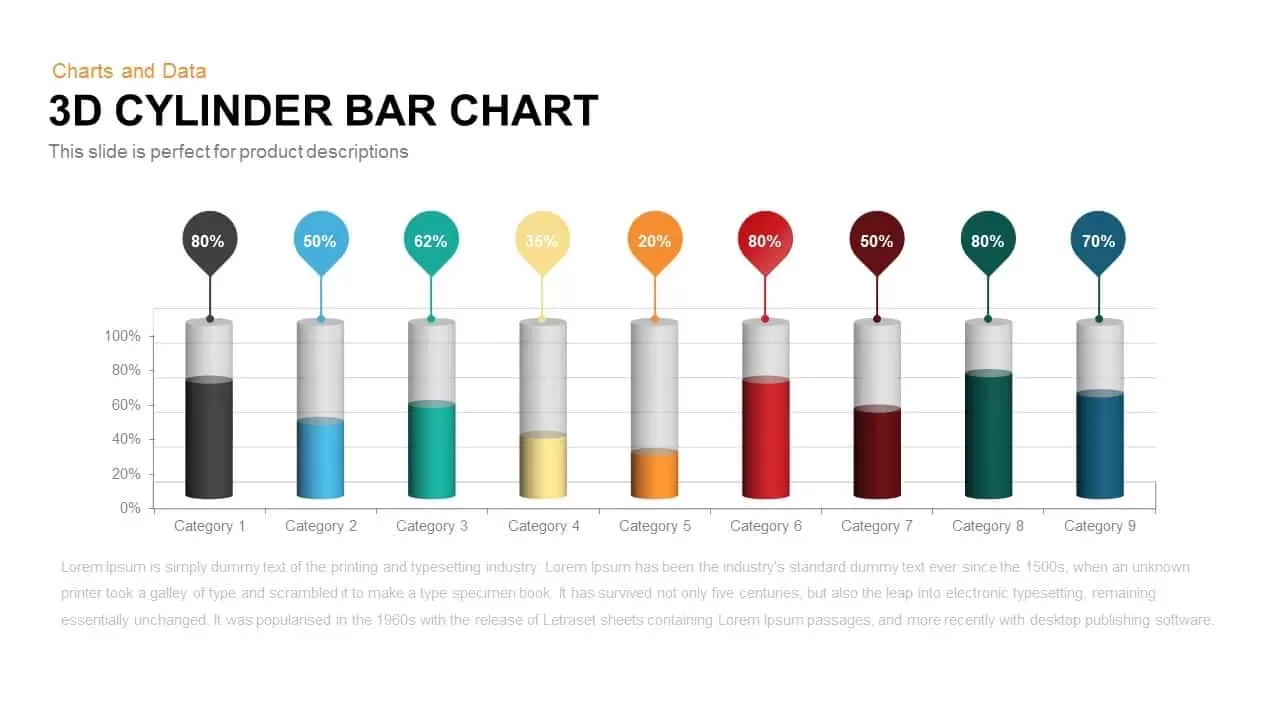
3D Cylinder Bar Chart PowerPoint Template and Keynote Slide
Column and Bar chart
Premium
-
Data Bar Chart Template for PowerPoint and Keynote
Column and Bar chart
Premium
-

Animated Upcoming Event Poster PowerPoint Template
PowerPoint Templates
Premium
-

Mekko Chart Template
PowerPoint Templates
Premium
-
Cylinder Bar Chart PowerPoint Template and Keynote Slide
Column and Bar chart
Premium
-
Grouped Column Chart PowerPoint Template
Column and Bar chart
Premium
-
Waterfall Bar Chart PowerPoint Template
PowerPoint Charts
Premium
-
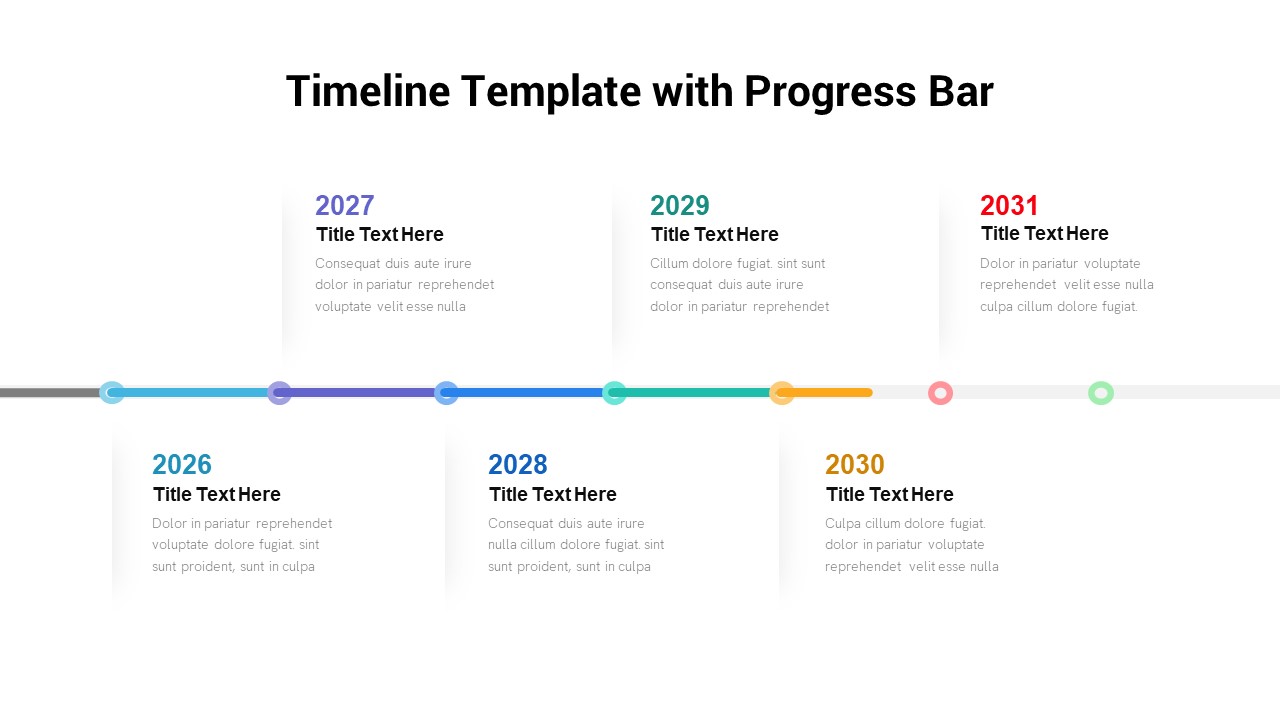
Legal Timeline Template PowerPoint
Timeline PowerPoint Template
Premium
-

Open Door Policy PowerPoint Template
PowerPoint Templates
Premium
-
3D Printing Deck PowerPoint Template
PowerPoint Templates
Premium
-

Clustered Column Chart PowerPoint Template
PowerPoint Charts
Premium
-

Biotechnology PowerPoint Presentation Template
PowerPoint Templates
Premium
-
High Level Timeline PowerPoint Template
Timeline PowerPoint Template
Premium
-
Spline Chart PowerPoint Template
PowerPoint Charts
Premium
-
Progress Timeline Bar PowerPoint Template
Timeline PowerPoint Template
Premium
-
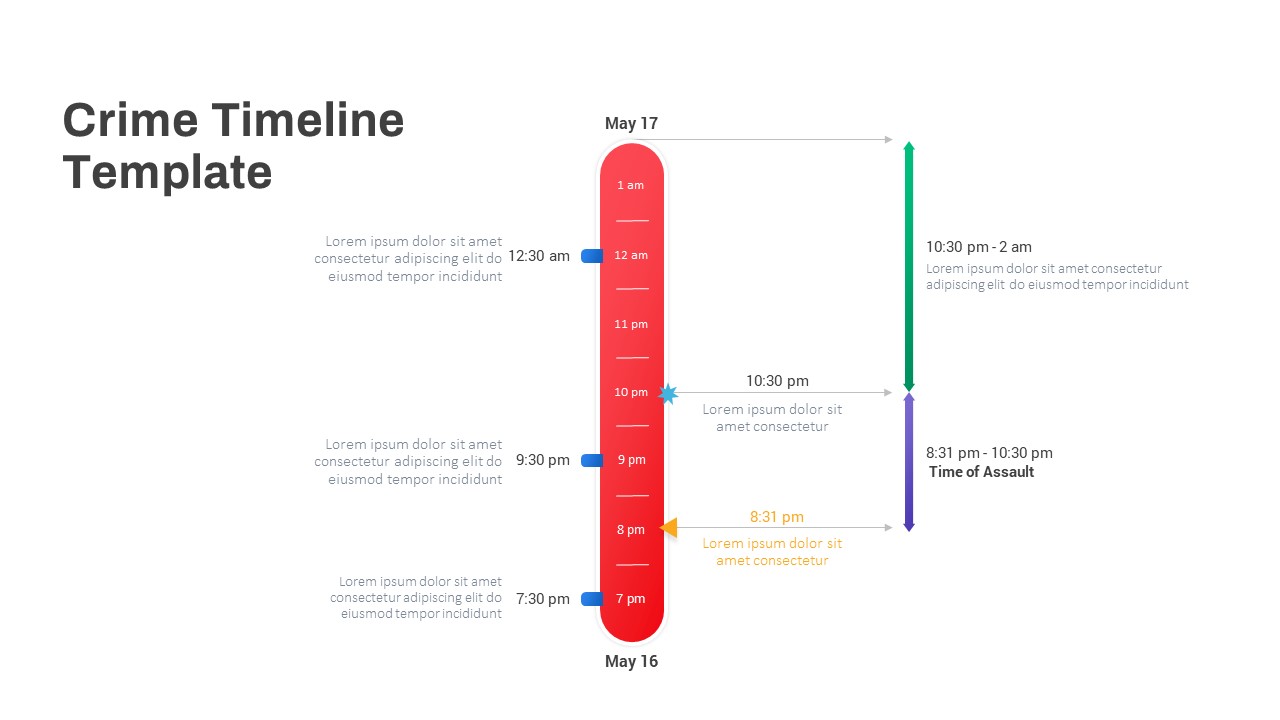
Crime Timeline PowerPoint Template
Timeline PowerPoint Template
Premium
-

Power Analogy Metaphor PowerPoint Template
Metaphor, Simile & Analogy
Premium
-
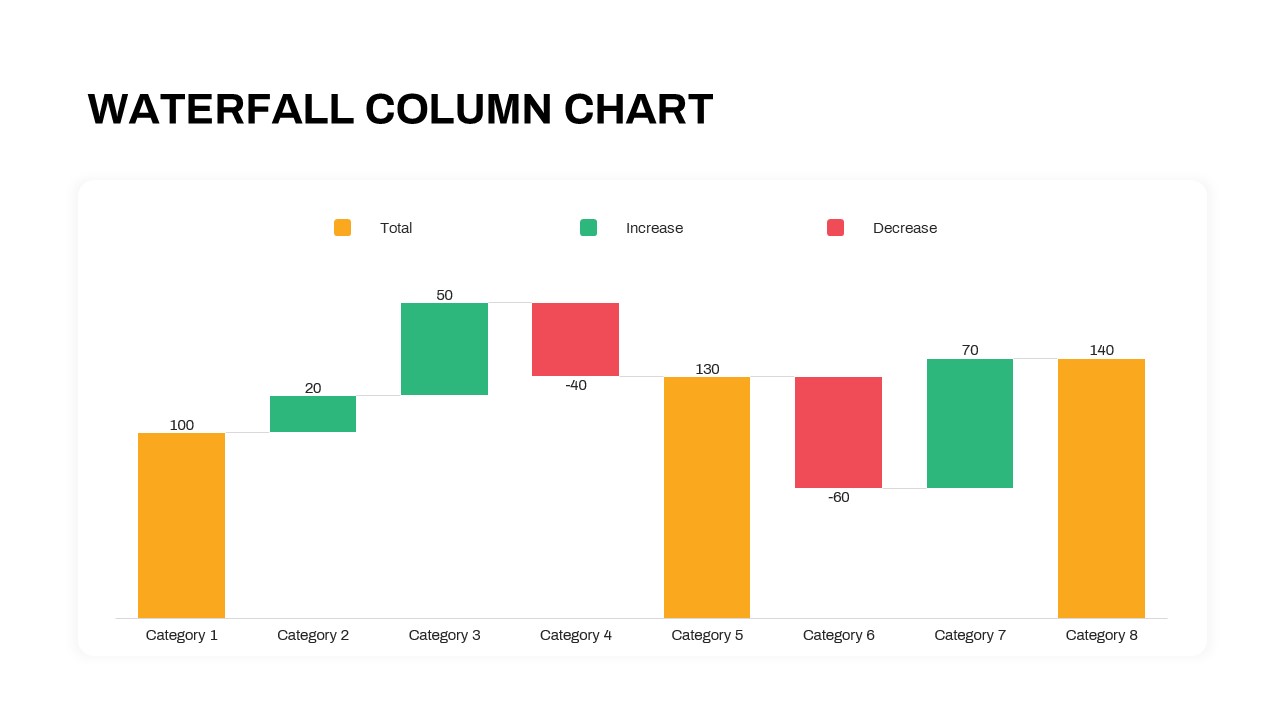
Waterfall Column Chart PowerPoint Template
Column and Bar chart
Premium
-
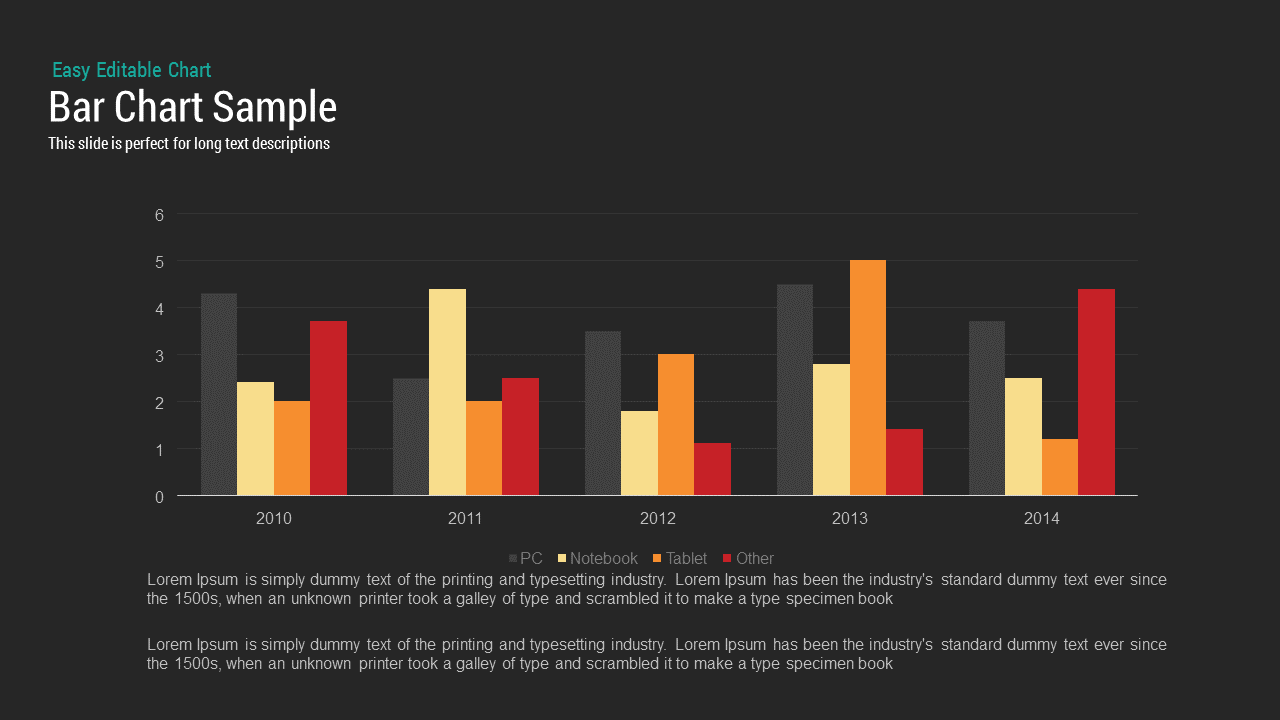
Sample Bar Chart Template for PowerPoint and Keynote Presentation
Column and Bar chart
Premium
-
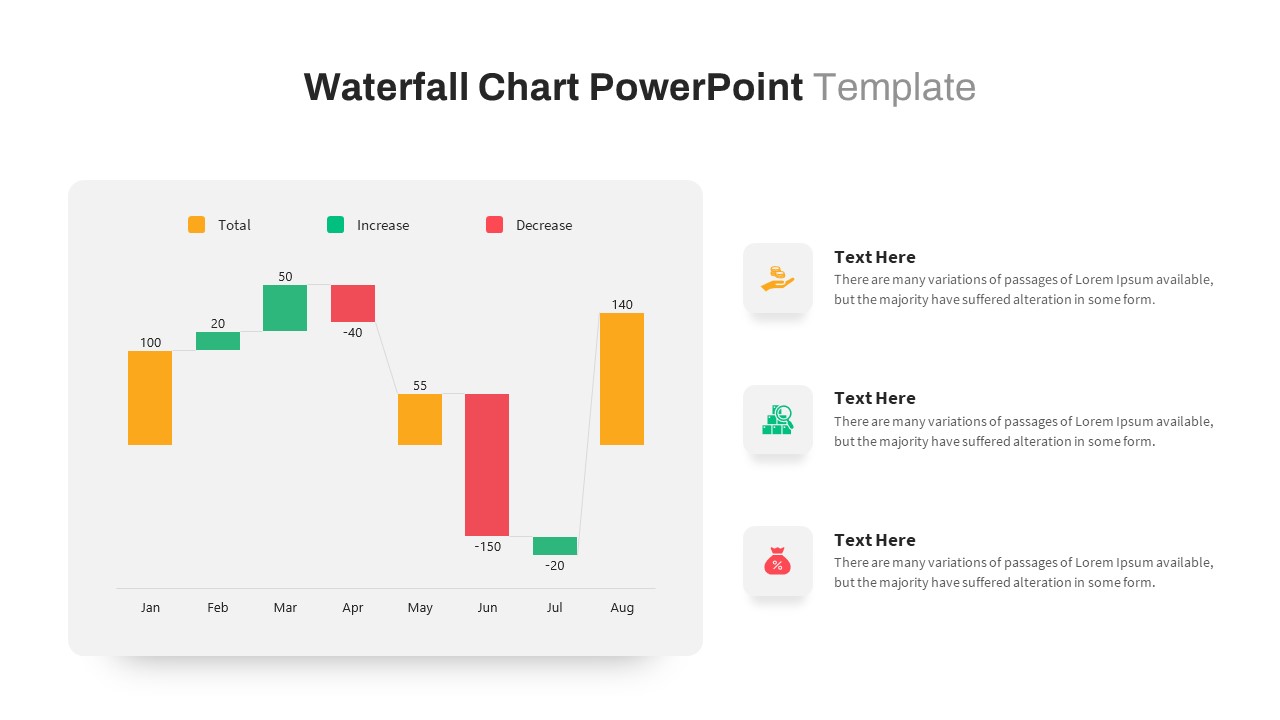
Waterfall Chart PowerPoint Template
PowerPoint Charts
Premium
-

Area Chart PowerPoint Template
PowerPoint Charts
Premium
-
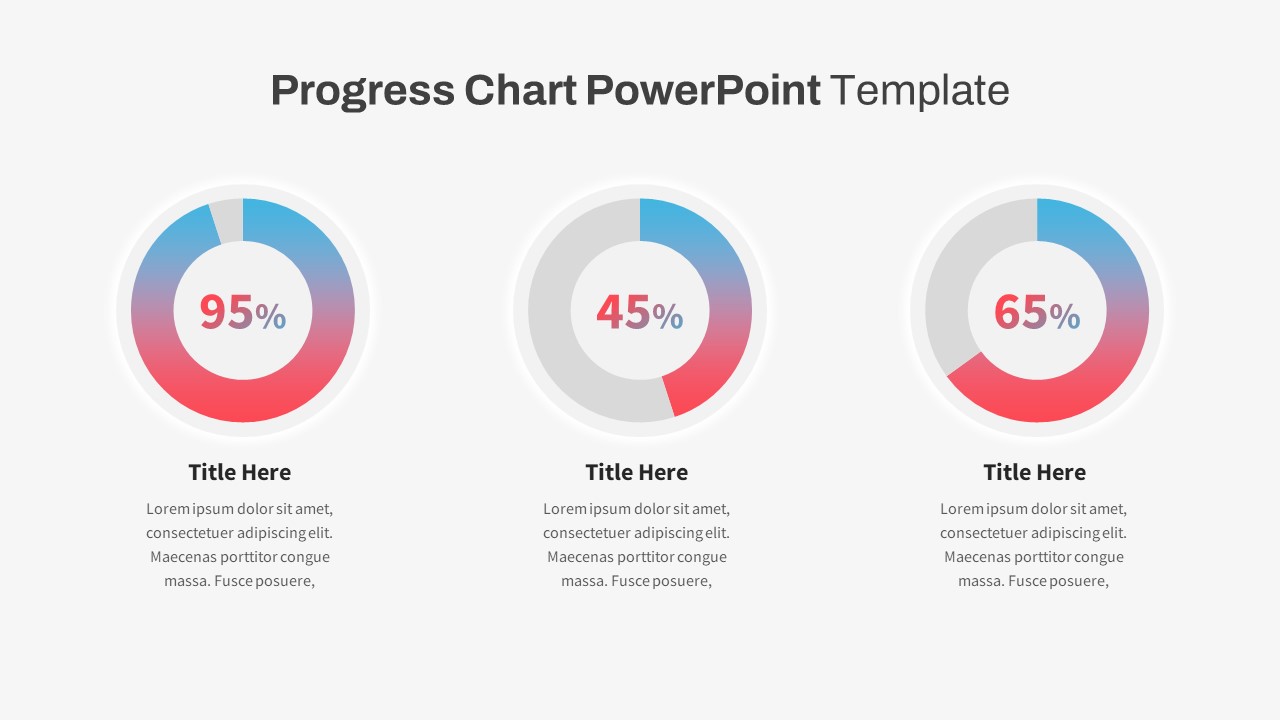
Progress Chart PowerPoint Template
PowerPoint Templates
Premium
-
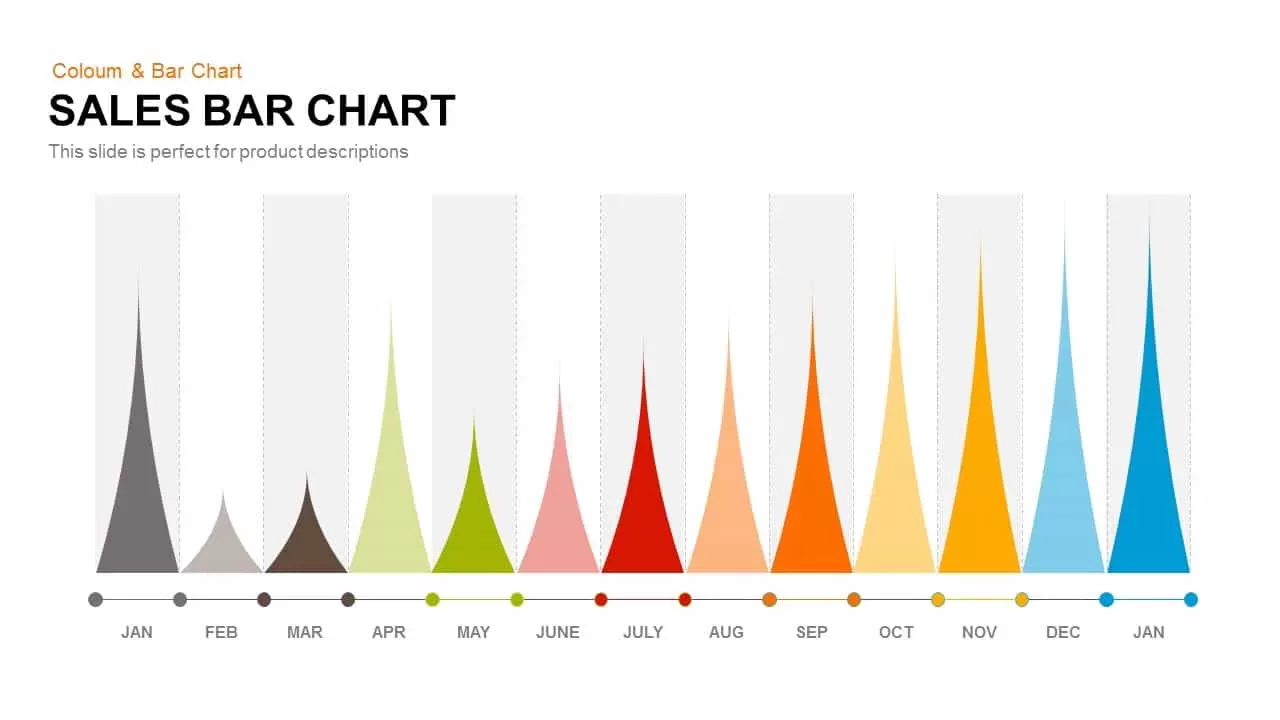
Sales Bar Chart Template for PowerPoint and Keynote
Column and Bar chart
Premium
-
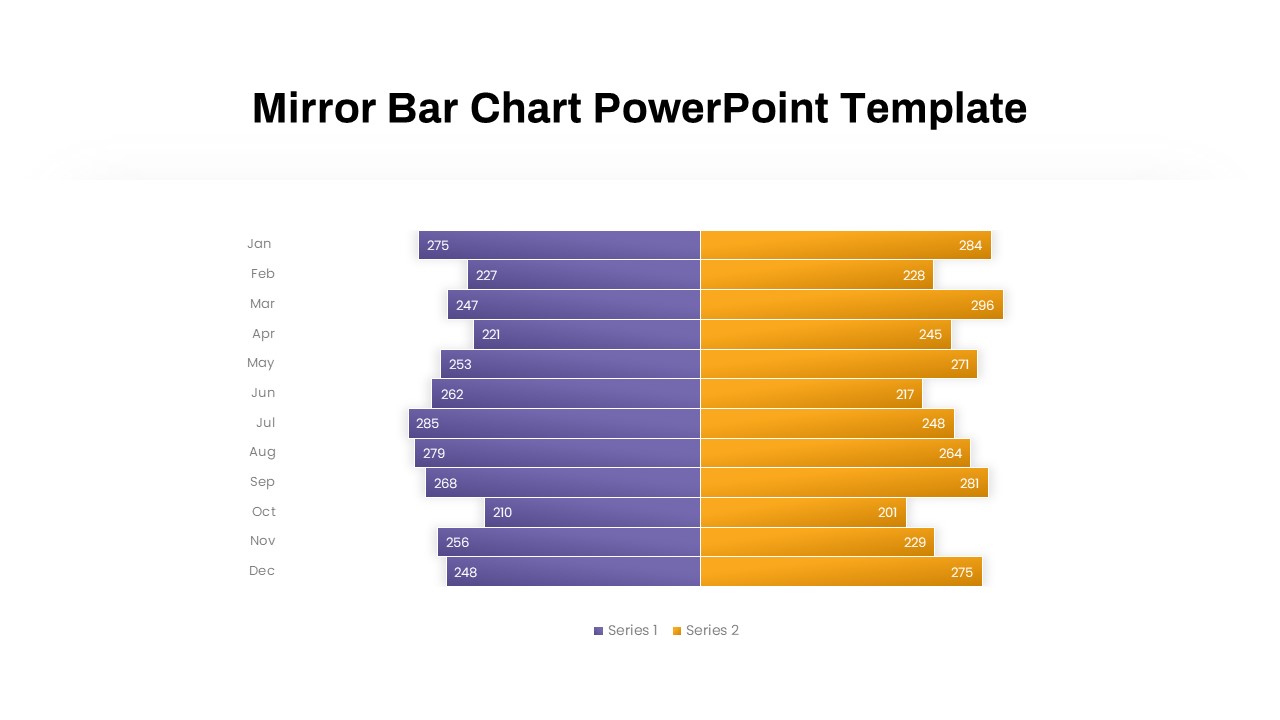
Mirror Bar Chart PowerPoint Template
PowerPoint Templates
Premium
-
Free PowerPoint Book Template
Free slides
Free
-
Product Comparison Bar Chart Template for PowerPoint and Keynote
PowerPoint Charts
Premium
-
Data Strategy Roadmap PowerPoint Template
PowerPoint Templates
Premium
-
Sun Burst Chart PowerPoint Template
Circular Diagrams
Premium
-

Cyber Monday PowerPoint Template
PowerPoint Business Templates
Premium
-
Free Scientific Poster PowerPoint Template
Free slides
Free
-

Combination Chart PowerPoint Template
PowerPoint Charts
Premium
-
Report Bar Chart PowerPoint Template and Keynote
Column and Bar chart
Premium
-

Finance Consulting PowerPoint Template
PowerPoint Templates
Premium
-
5 Year Timeline Template
Infographic
Premium
-
Serpentine PowerPoint Template
Timeline PowerPoint Template
Premium
-
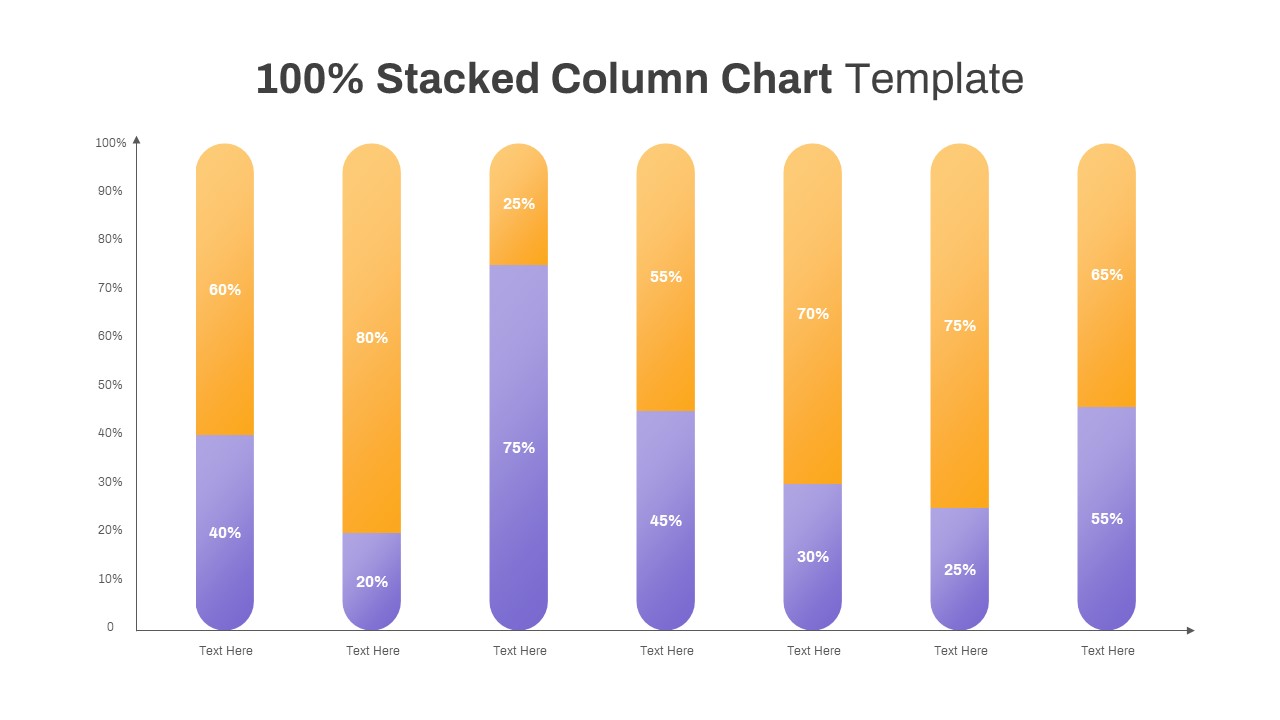
100% Stacked Column Chart PowerPoint Template
Column and Bar chart
Premium
-
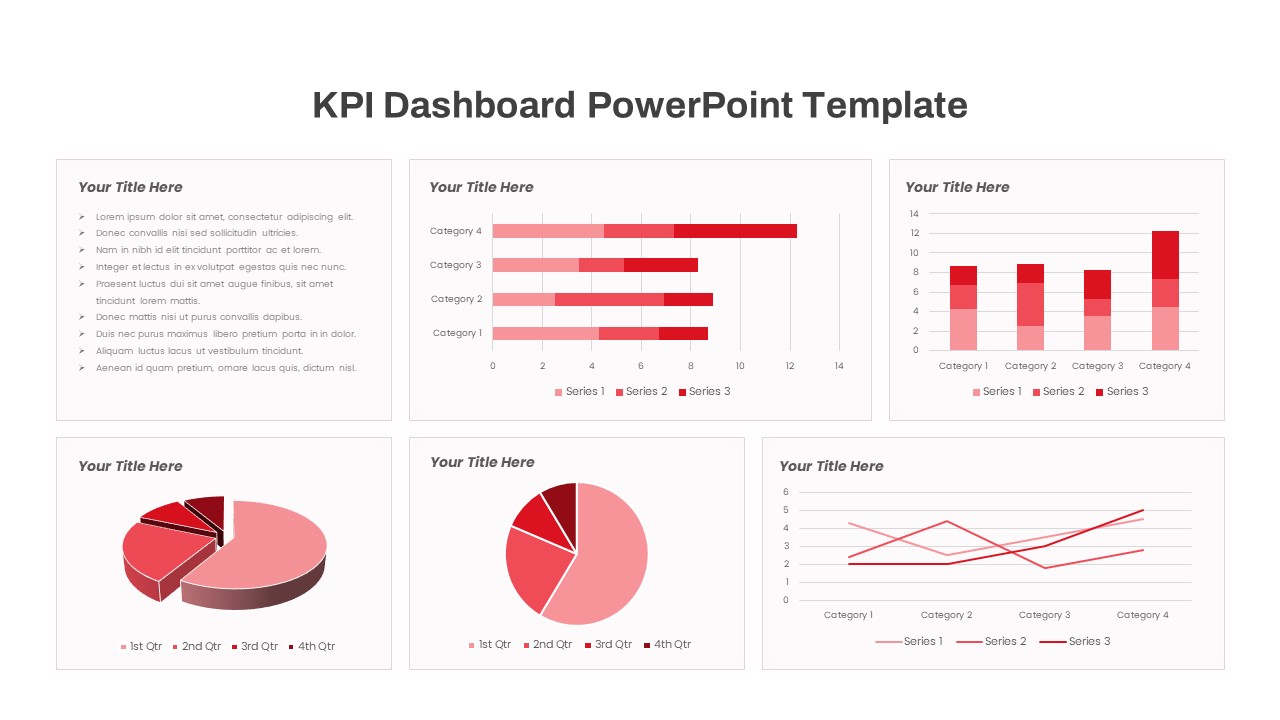
Free KPI Dashboard PowerPoint Template
PowerPoint Templates
Free
-
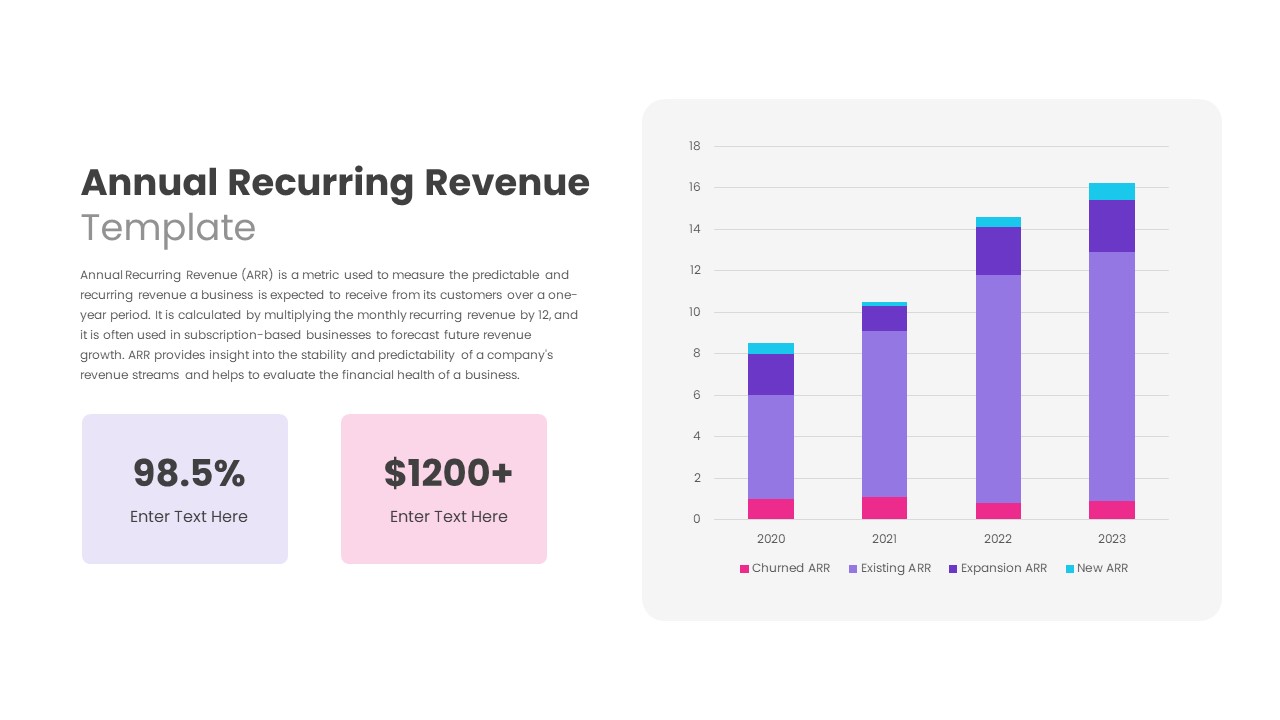
Annual Recurring Revenue PowerPoint Template
PowerPoint Templates
Premium
-
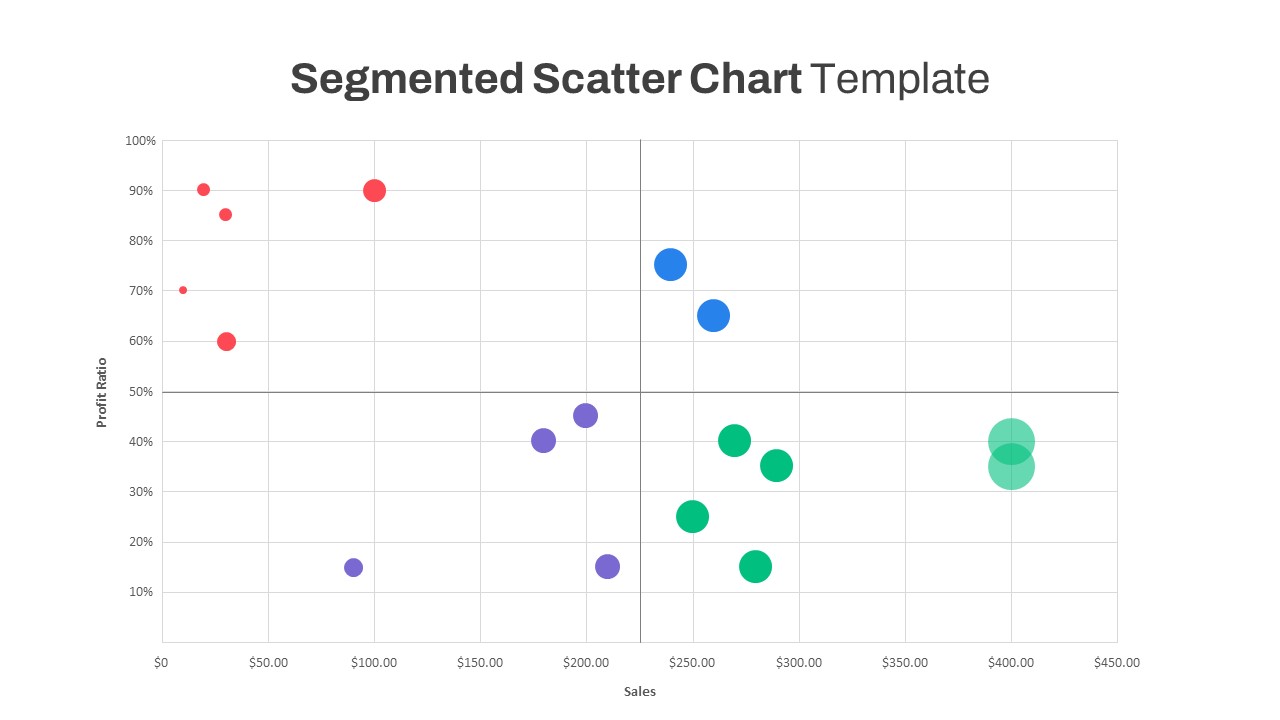
Segmented Scatter Chart PowerPoint Template
PowerPoint Charts
Premium
-
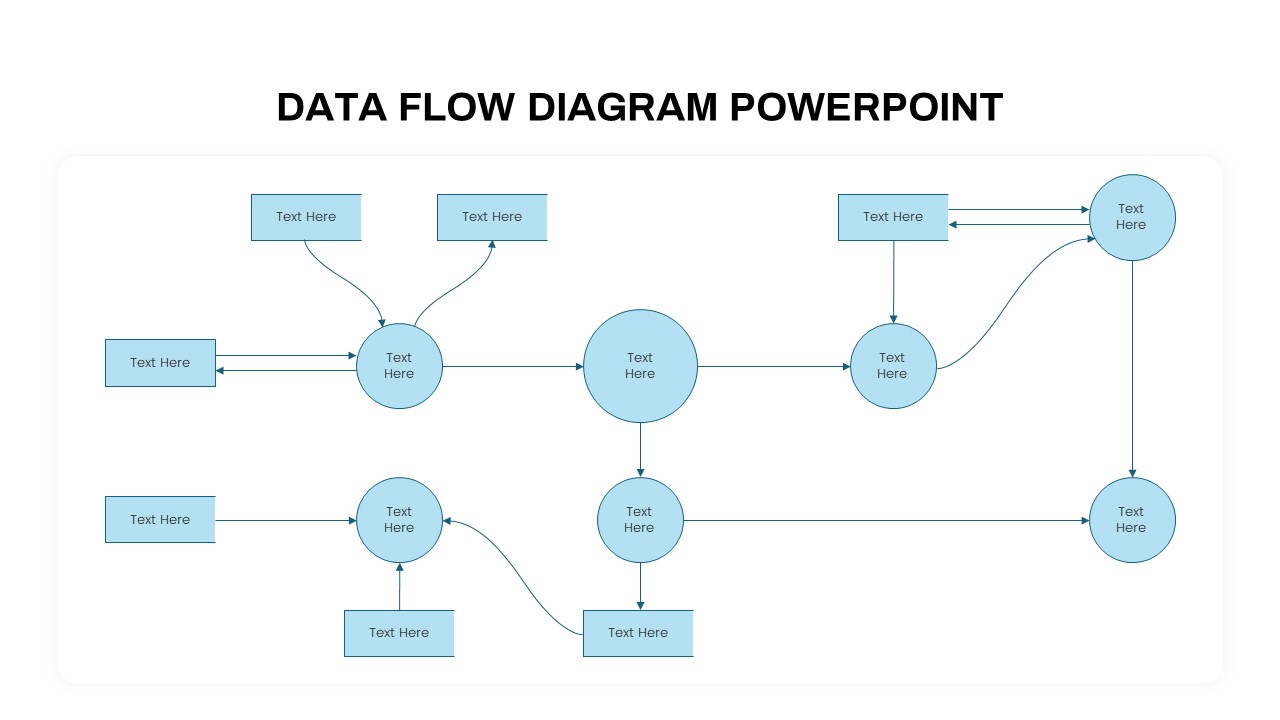
Data Flow PowerPoint Presentation Template
PowerPoint Templates
Premium
-
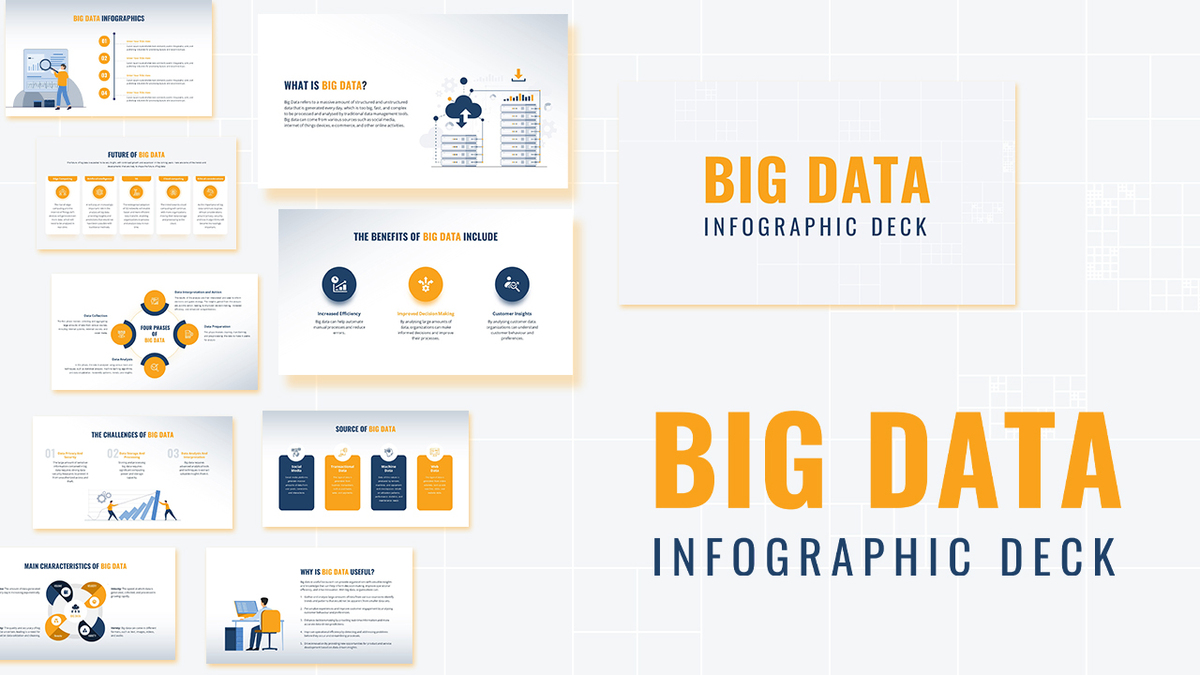
Big Data Infographic Deck For PowerPoint
PowerPoint Business Templates
Premium
-
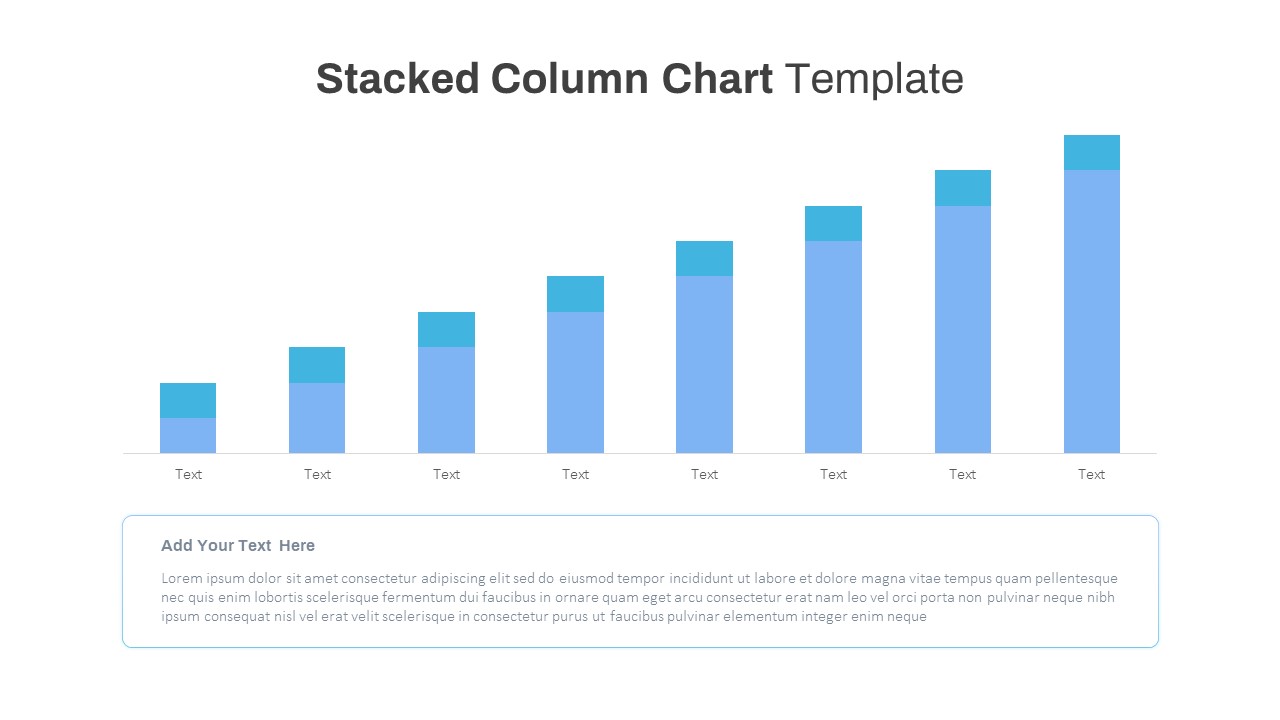
Free Stacked Column Chart Template
Column and Bar chart
Free
-

Proportional Area Chart PowerPoint Template
PowerPoint Templates
Premium
-
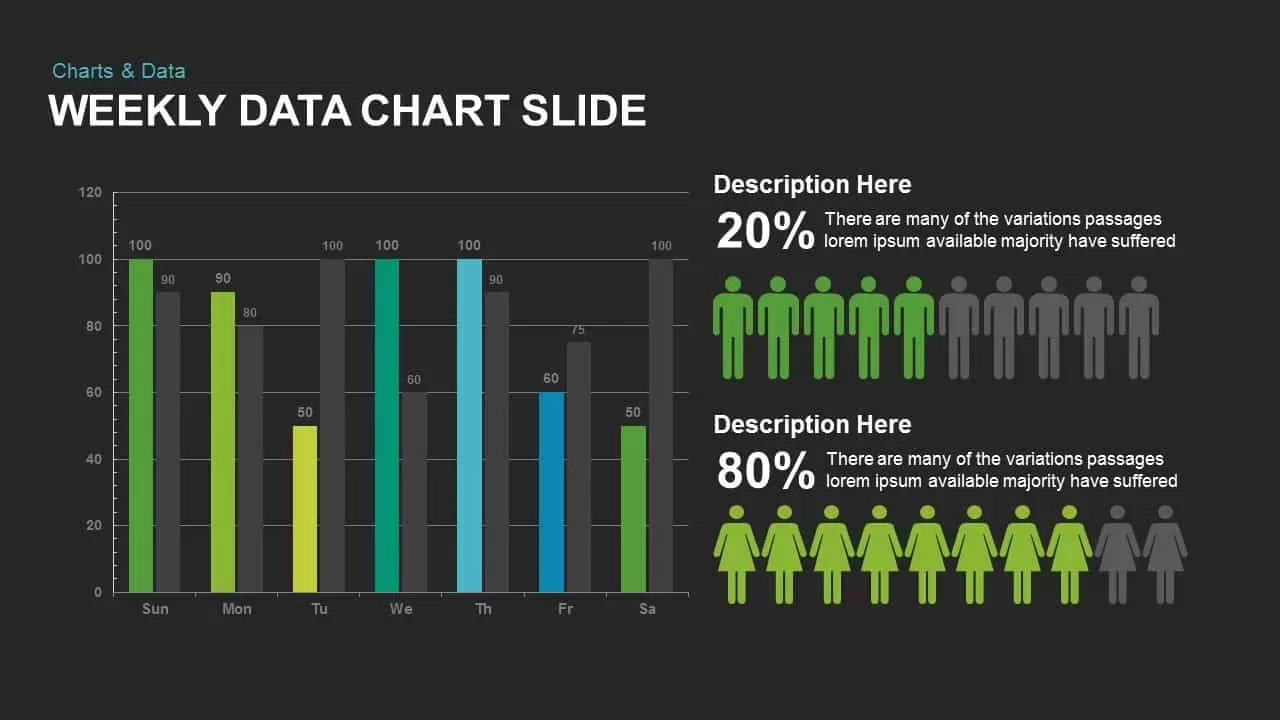
Weekly Data Charts PowerPoint Presentation Template and Keynote Slide
Infographic
Premium
-
Waffle Chart PowerPoint Template
PowerPoint Templates
Premium
-
Animated Company Evolution Timeline PowerPoint Template and Keynote
Timeline PowerPoint Template
Premium
-
Social Media Timeline Template
PowerPoint Templates
Premium
-
Free PowerPoint Gantt Chart Template
PowerPoint Charts
Free
-
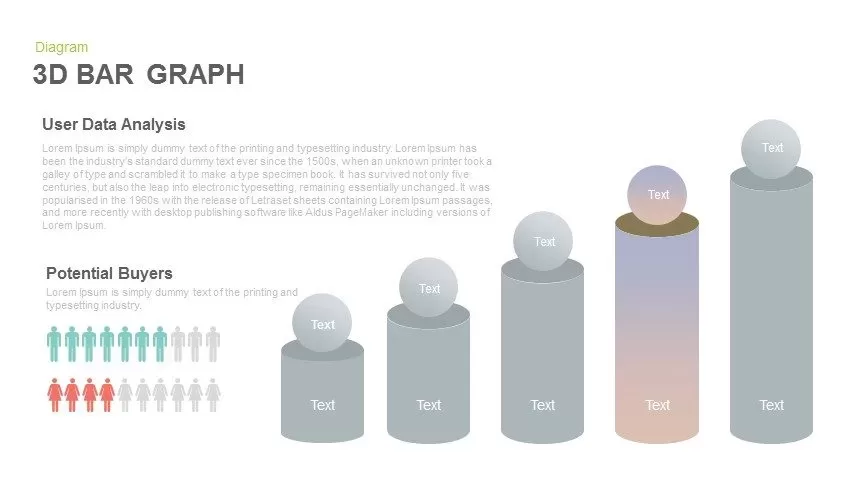
3d Bar Graph PowerPoint Template and Keynote Slide
Diagrams
Premium
-
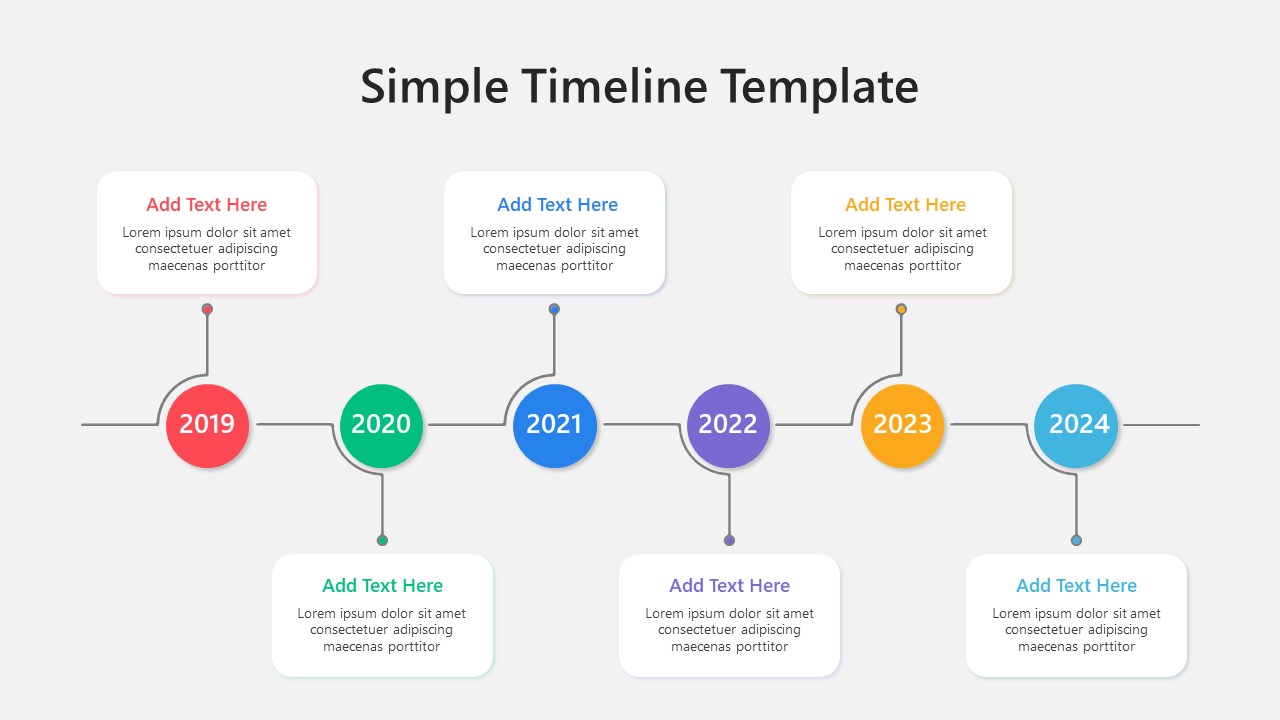
Simple Timeline PowerPoint Template
Timeline PowerPoint Template
Premium
-
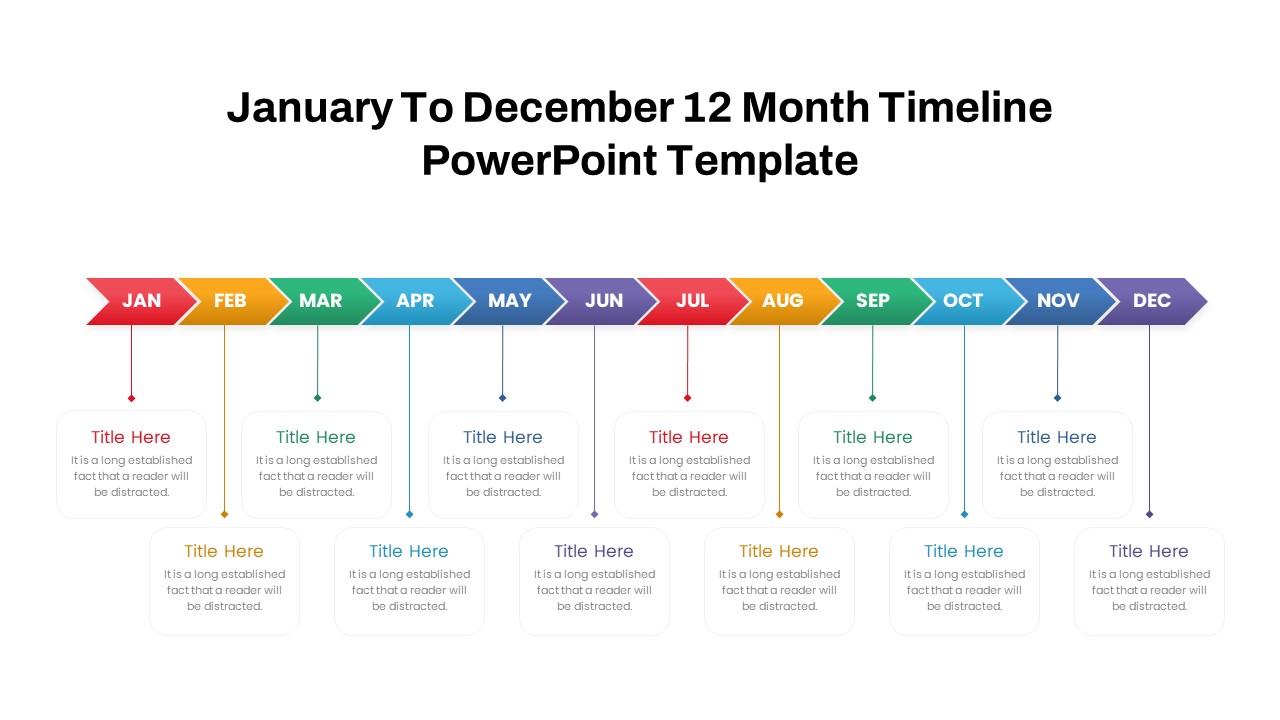
January to December 12 Month Timeline PowerPoint Template
Timeline PowerPoint Template
Premium