


Survey Results Infographics Template


- Version 1.0.0
- Download 135
- File Size 0.00 KB
- File Count 1
- Create Date December 2, 2022
- Last Updated December 2, 2022
Survey Results Infographics Template
Survey results presentation is crucial for businesses and organizations. This 16-slide presentation survey results infographics created with different layouts and shapes. These multiple presentation slides for survey results presentation examples drive you to create compelling data in powerpoint. You can visualize your customer voices using the survey results infographics. Of course, reporting facts and figures with a storytelling methodology enable your viewers to easily interprets visuals. A survey result is a statistical presentation, so it may bore the audience. So, when you embed data and divert it into digital visuals, it may take your entire audience, and they can easily grab what you have presented. Use the survey presentation powerpoint template for an easy understanding of statistical data.
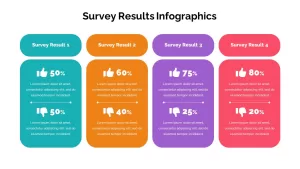
The survey results an infographic is a visual tool containing charts and graphs for powerpoint presentation. Survey data charts in an engaging fashion will relay your research findings with statistical tools and tables. Powerpoint statistics presentation demands high-quality slides because people are often not interested to learn facts and figures than flat stories. So, you need visually compelling slides for data presentations. These graphics convey your business survey results and provide appealing visuals to understand customer voices.
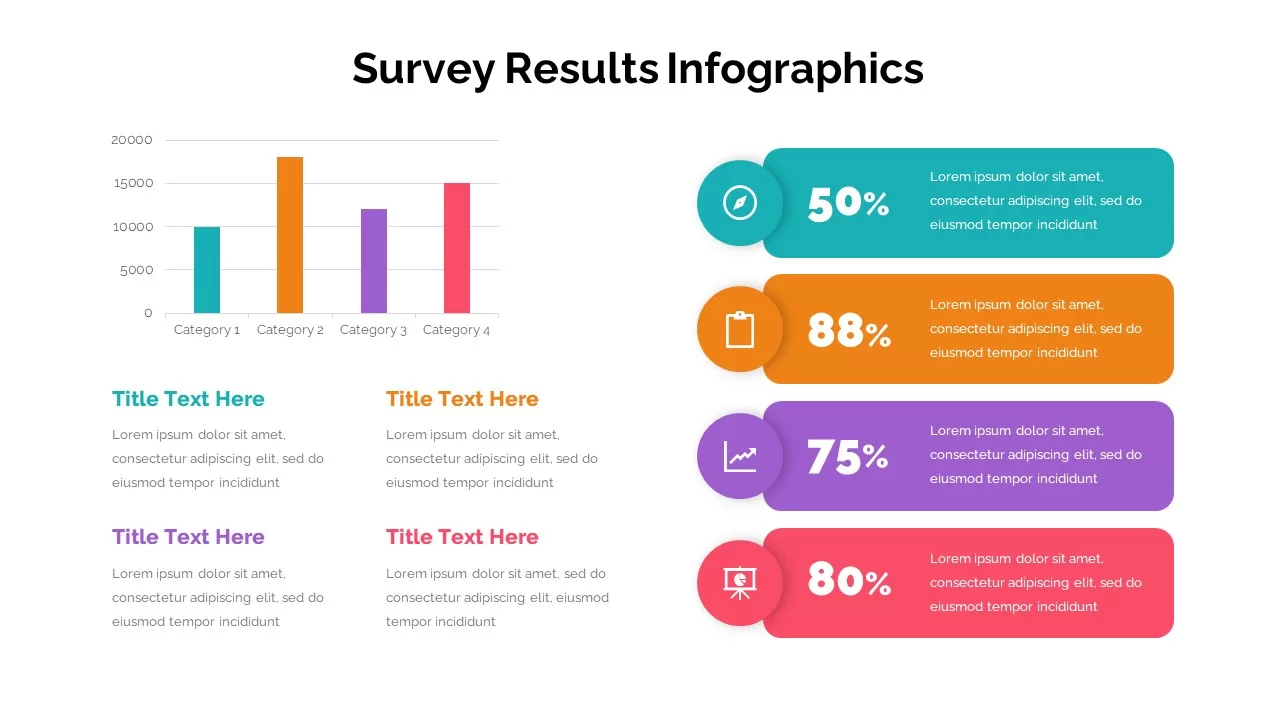
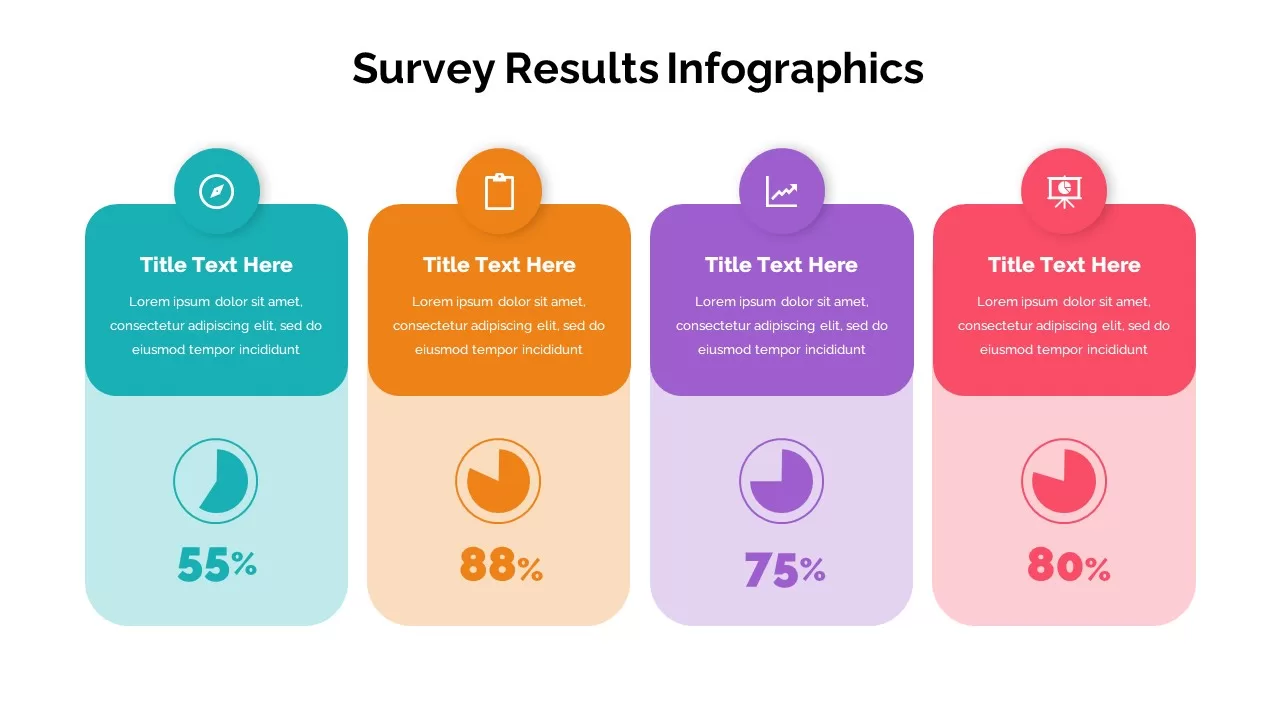
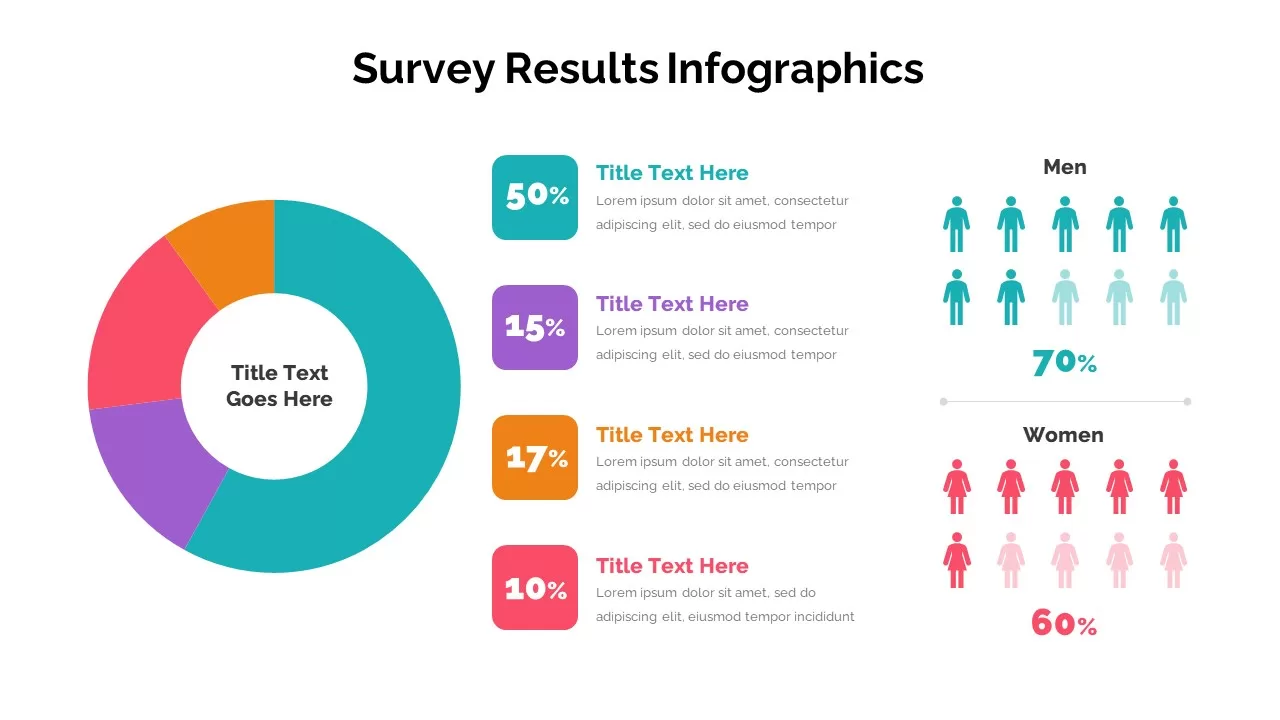
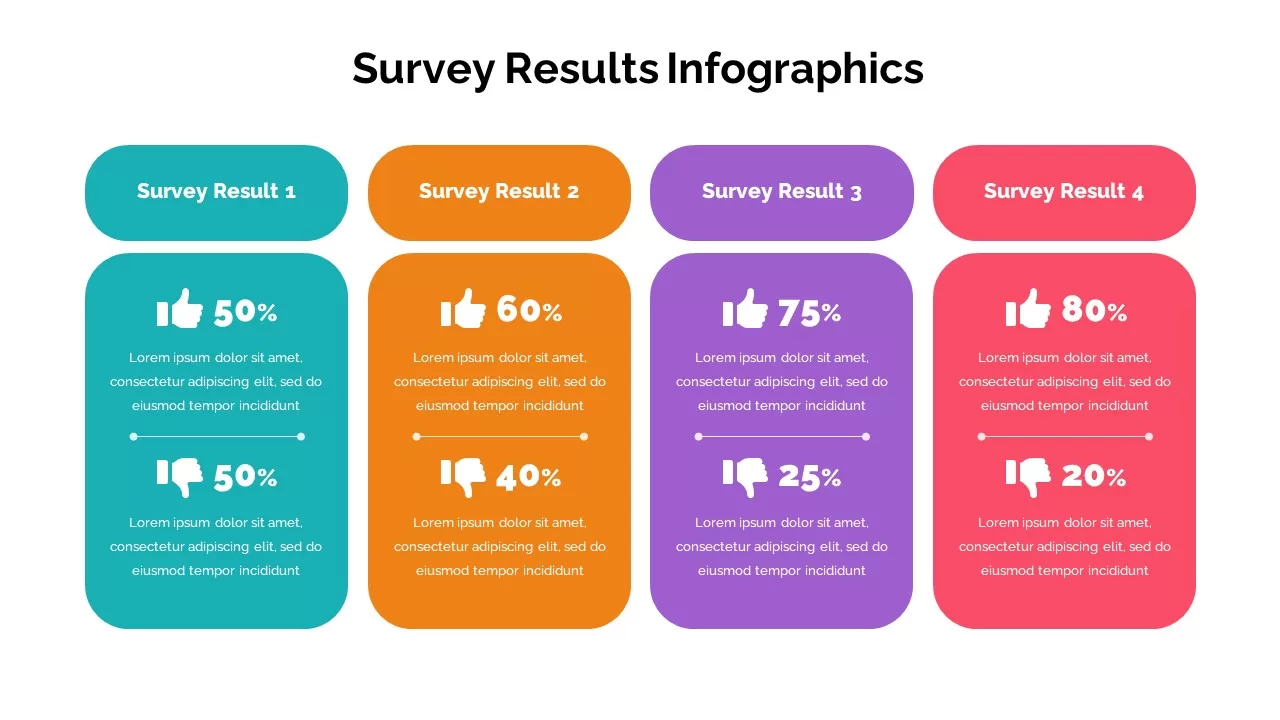
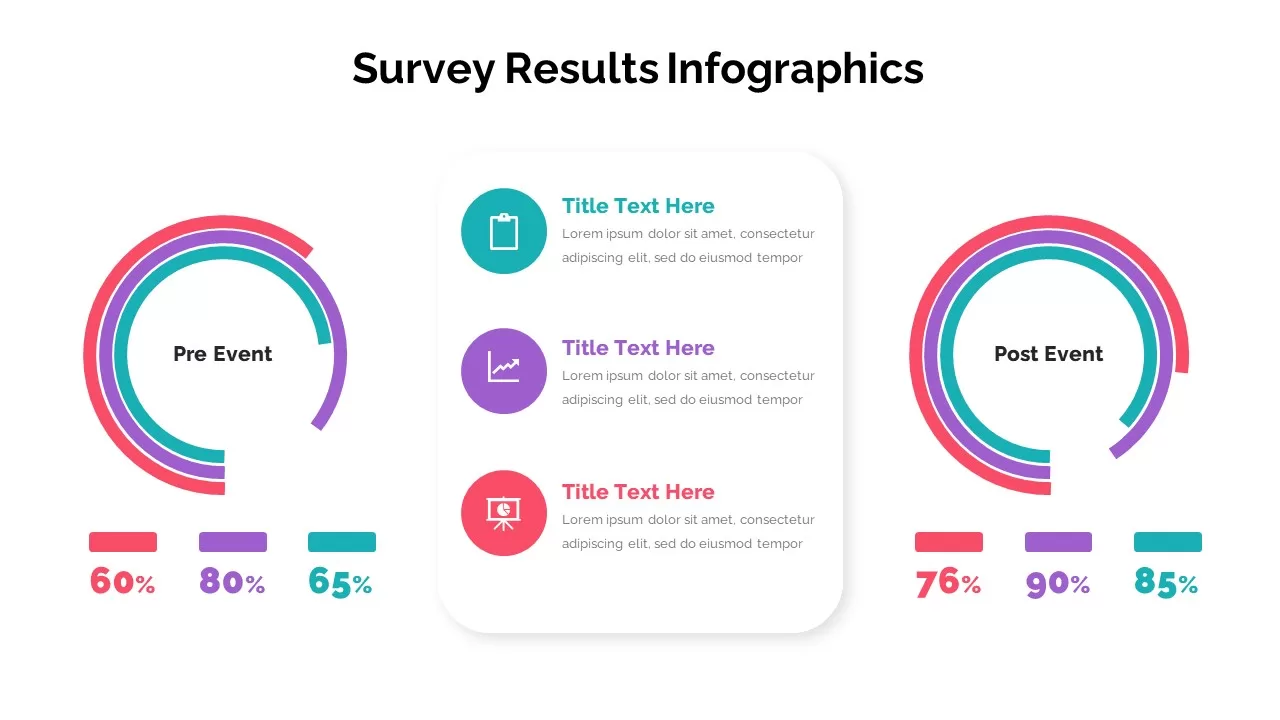
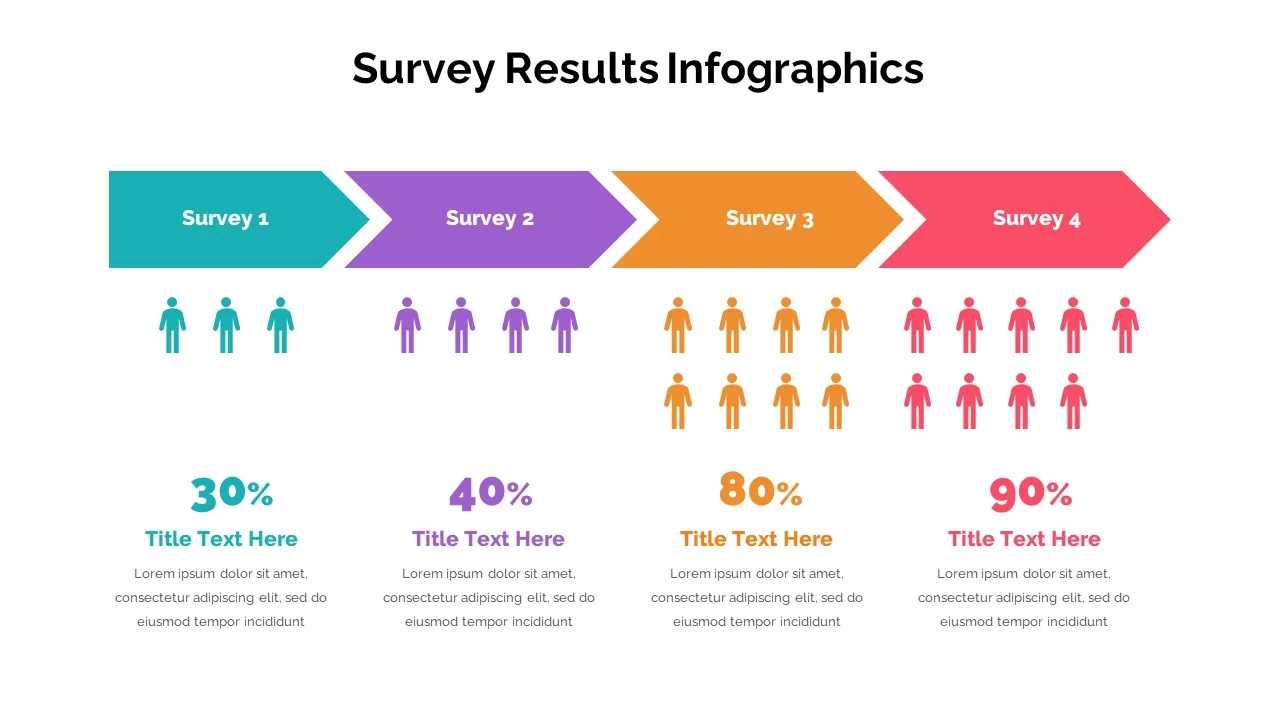
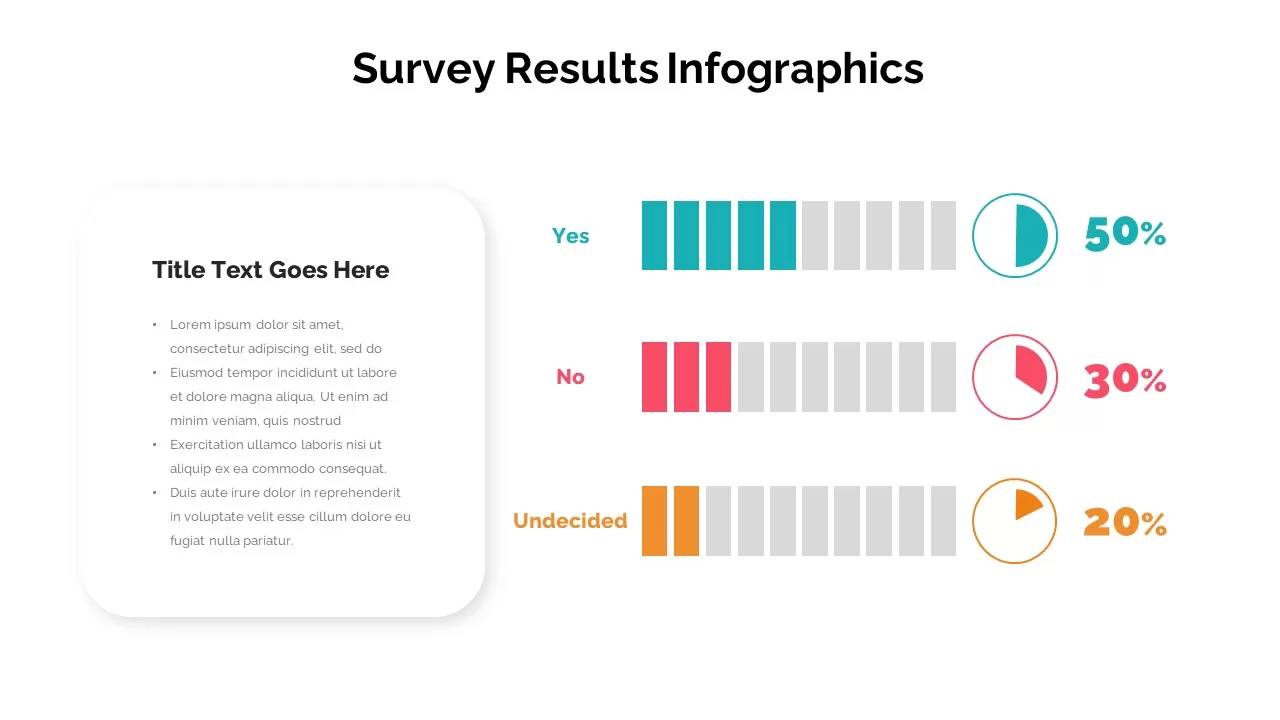
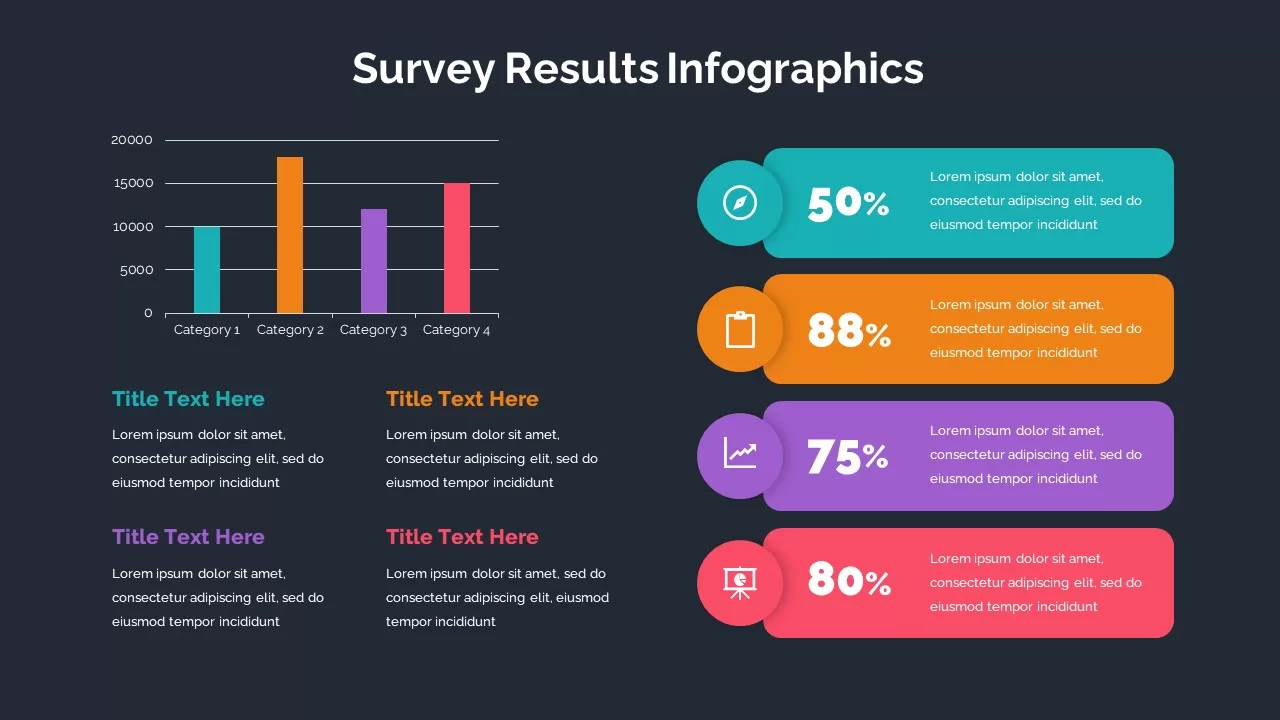
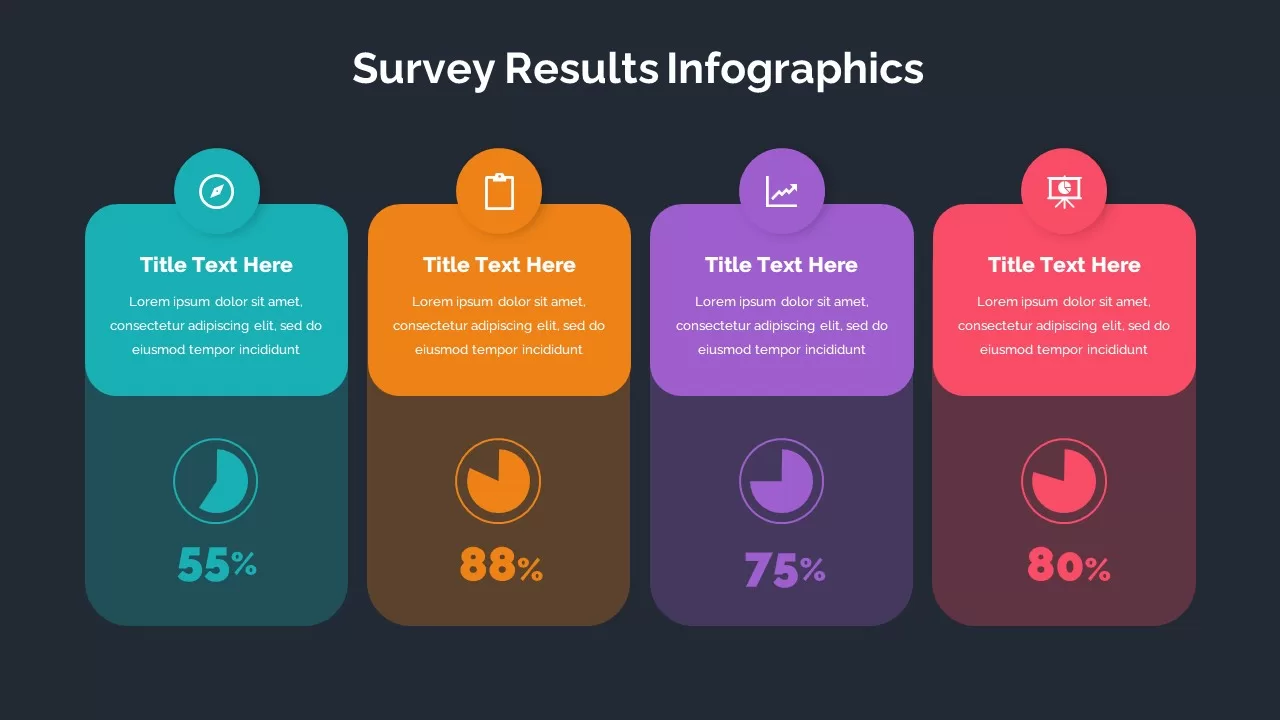
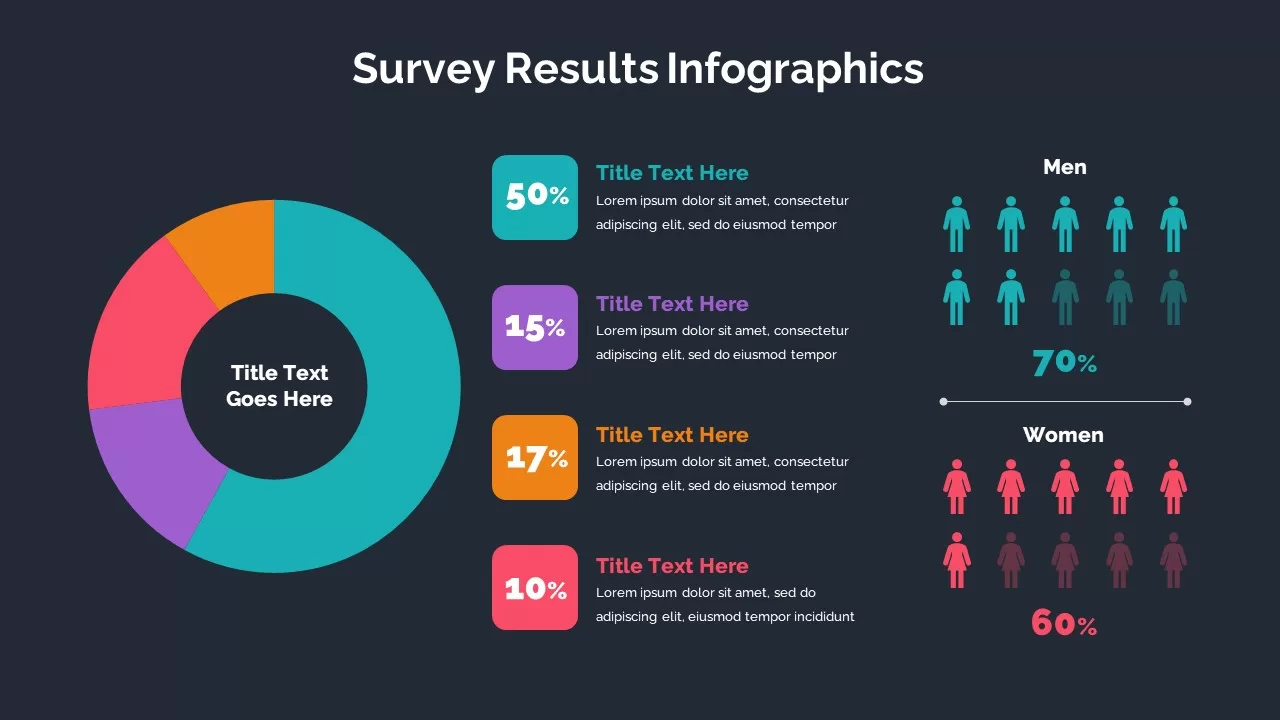
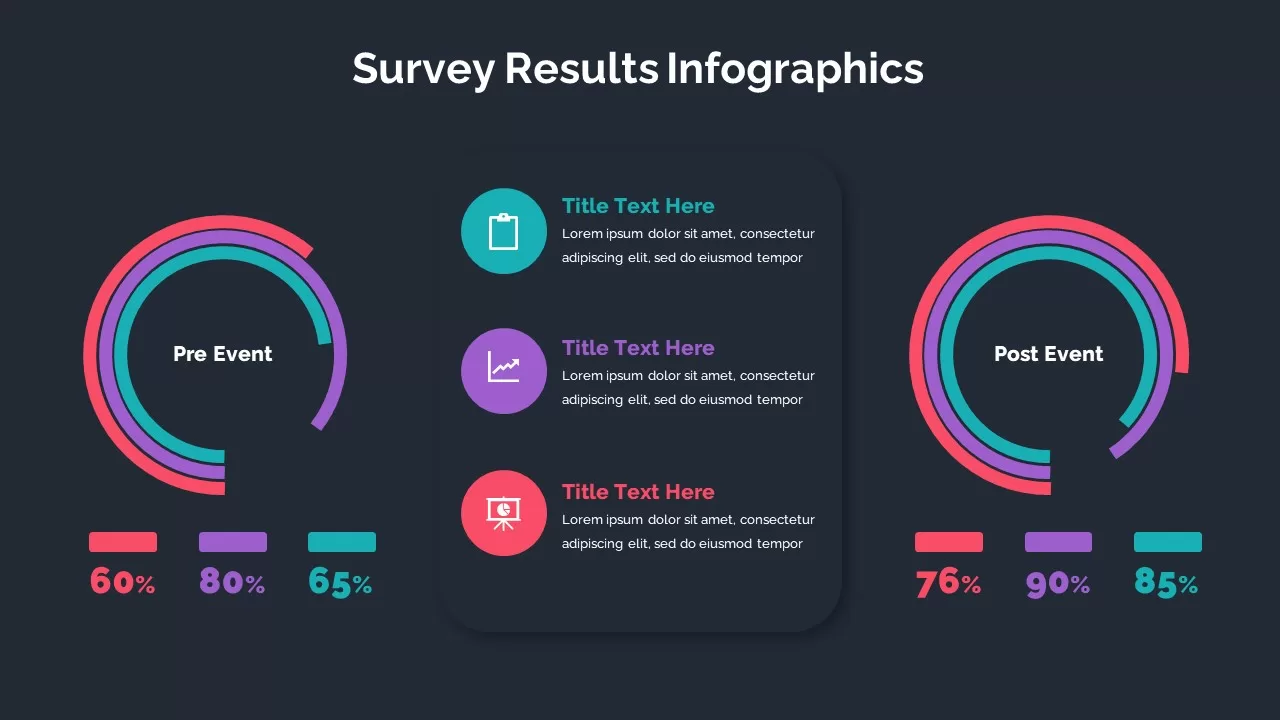
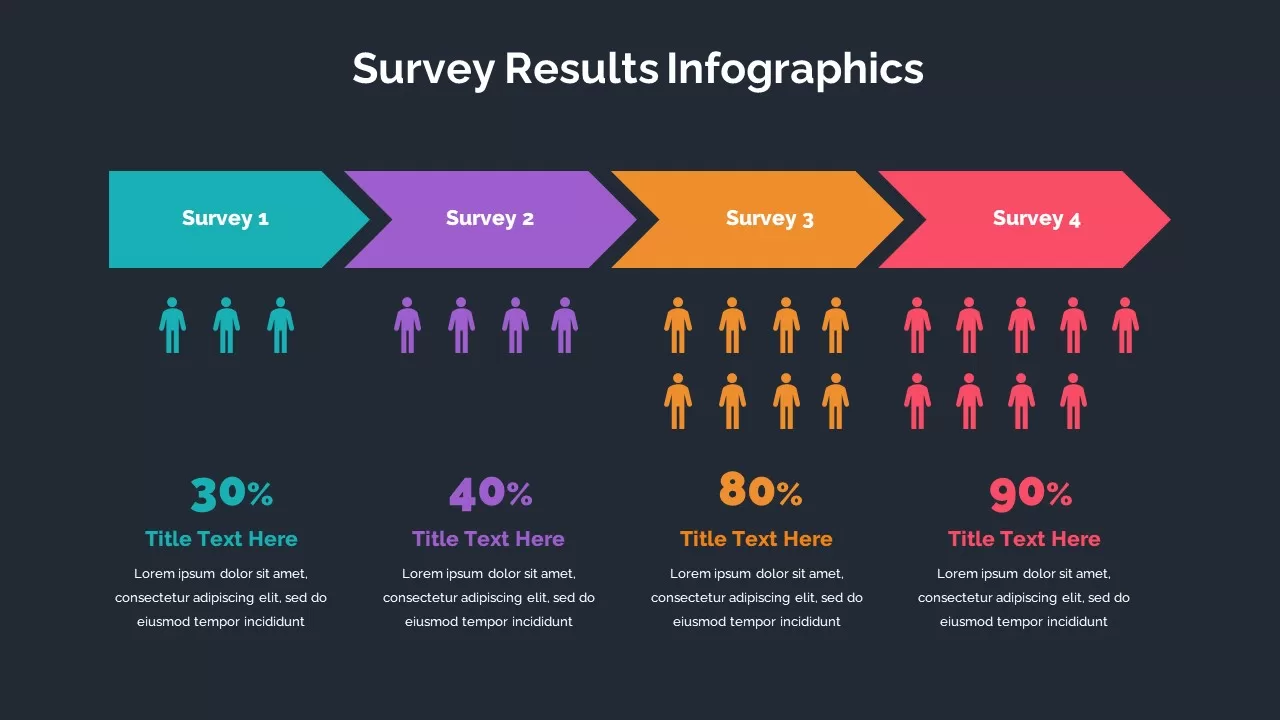
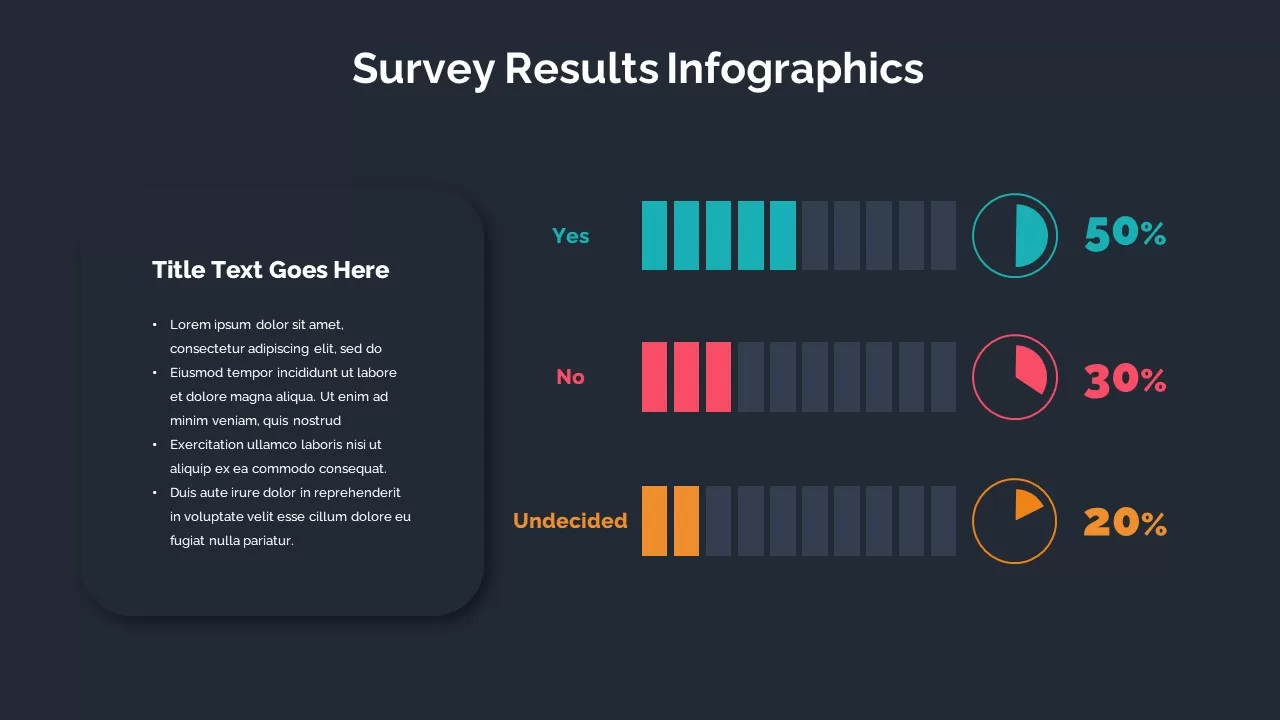
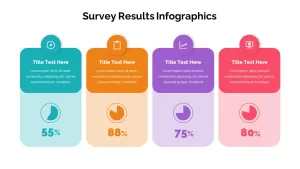
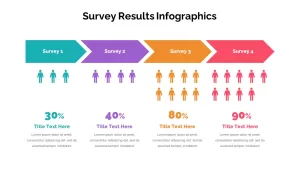
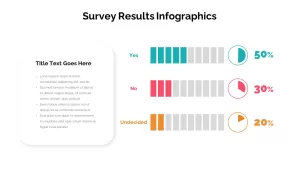
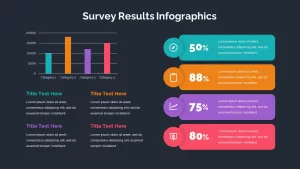
The survey result template for the powerpoint presentation has table and ppt graphics in both white and black powerpoint backgrounds. It is comprised of different slides, such as bar chart slide with tinted square presentation and text areas; each bar in the chart has been colored differently so the viewers can easily get the survey results. The timeline template with Harvey's ball presentation best shows opinion polls. A powerpoint pie chart displaying the demographic is also tinted with different color combinations. Besides, a radial chart powerpoint is also there to offer percentages—a chevron arrow timeline template designed for presenting survey results. Finally, a parallel bar diagram shows percentage distribution in the engaging visual chart—download the survey results presentation template for presenting facts and figures.
Attached Files
| File |
|---|
| https://premiumdownloads.s3.amazonaws.com/SB02735-Survey Results Infographics.ZIP |
Login to download this file
Add to favorites
Add to collection
-

Item ID
SB02735 -

Related Templates
-

Nature PowerPoint Presentation Template
PowerPoint Business Templates
Premium
-
Survey Results PowerPoint Template Free
Free PowerPoint Templates
Free
-

Sales Deck Free PowerPoint Template
PowerPoint Templates
Free
-

Free Vertical PowerPoint Template
PowerPoint Business Templates
Free
-

Cab Service PowerPoint Template
PowerPoint Templates
Premium
-

Travel Agency PowerPoint Template
PowerPoint Templates
Premium
-

Research Proposal PowerPoint Template
PowerPoint Templates
Premium
-

VET Clinic PowerPoint Template
PowerPoint Templates
Premium
-

Free Nursing Capstone PowerPoint Deck
PowerPoint Templates
Free
-

Free Physical Education PowerPoint Template Deck
Free PowerPoint Templates
Free
-

Gym PowerPoint Template
PowerPoint Templates
Premium
-

Free Space Minimal Deck Template
PowerPoint Templates
Free
-

IoT Presentation Template
PowerPoint Templates
Premium
-

Effective Communication PowerPoint Template
PowerPoint Templates
Premium
-

Customer Experience Loyalty PowerPoint Deck Template
PowerPoint Templates
Premium
-

PowerPoint Quiz With Timer
PowerPoint Templates
Premium
-
Customer Satisfaction Survey Result PowerPoint Template
Pie & Donut
Premium
-

Graph Paper PowerPoint Template Deck
PowerPoint Templates
Premium
-

Free Aviation PowerPoint Template
Free PowerPoint Templates
Free
-

Free Charity PowerPoint Template Deck
PowerPoint Templates
Free
-

Free Economics PowerPoint Template
Free PowerPoint Templates
Free
-

Macroeconomics PowerPoint Template
PowerPoint Templates
Premium
-

Free Army PowerPoint Template
PowerPoint Templates
Free
-

Free University Presentation PowerPoint Template
PowerPoint Templates
Free
-

Free Real Estate Listing PowerPoint Template
Free PowerPoint Templates
Free
-

Animated Agriculture PowerPoint Deck Template
PowerPoint Templates
Premium
-

Free Cartoon PowerPoint Template
Free PowerPoint Templates
Free
-

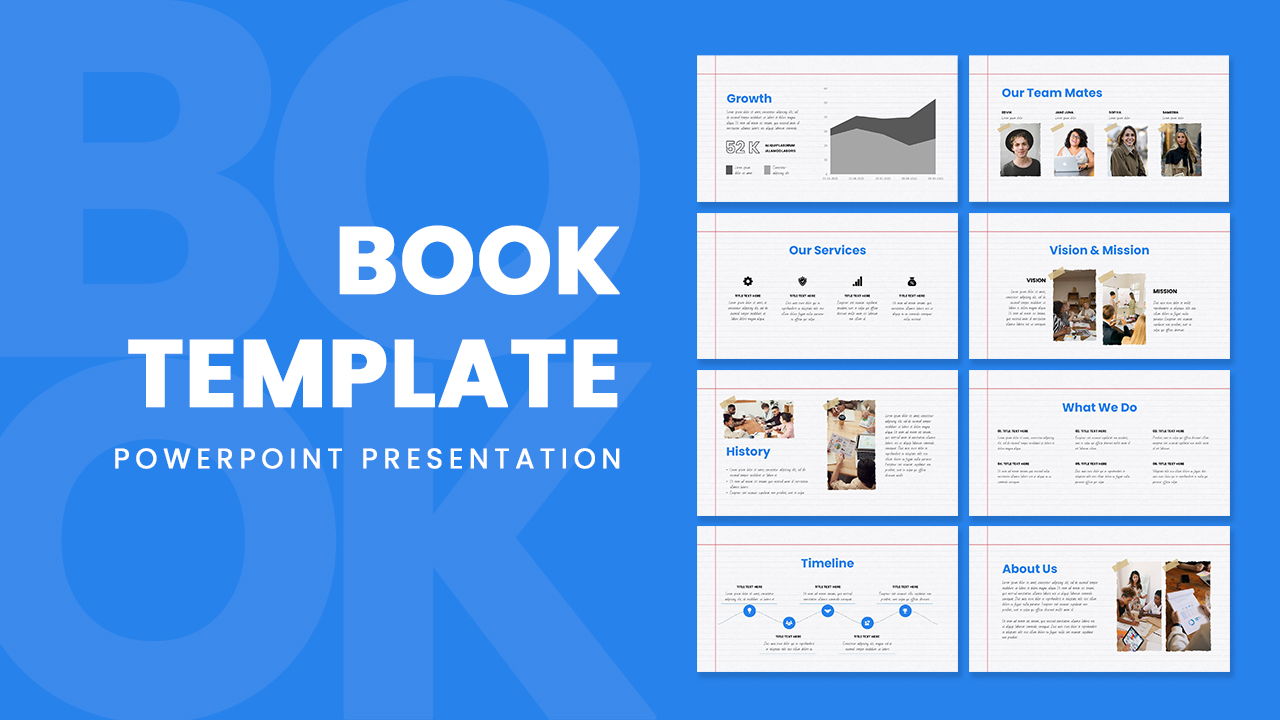
Free Book Review PowerPoint Template
Free PowerPoint Templates
Free
-

Free Event Planning PowerPoint Template
Free PowerPoint Templates
Free
-

Annual Report PowerPoint Template and Keynote
PowerPoint Templates
Premium
-

EFQM Model PowerPoint Template
PowerPoint Templates
Premium
-

Global Warming Infographic PowerPoint Template Deck
PowerPoint Templates
Premium
-

Data Science PowerPoint Template
PowerPoint Templates
Premium
-

Pencil Bar Chart PowerPoint Template and Keynote Slide
Column and Bar chart
Premium
-

Radial Bar Chart PowerPoint Templates and Keynote Slides
PowerPoint Charts
Premium
-

Free Dunder Mifflin Paper Company Pitch Deck
Free PowerPoint Templates
Free
-

Real Estate PowerPoint Theme
PowerPoint Themes
Premium
-

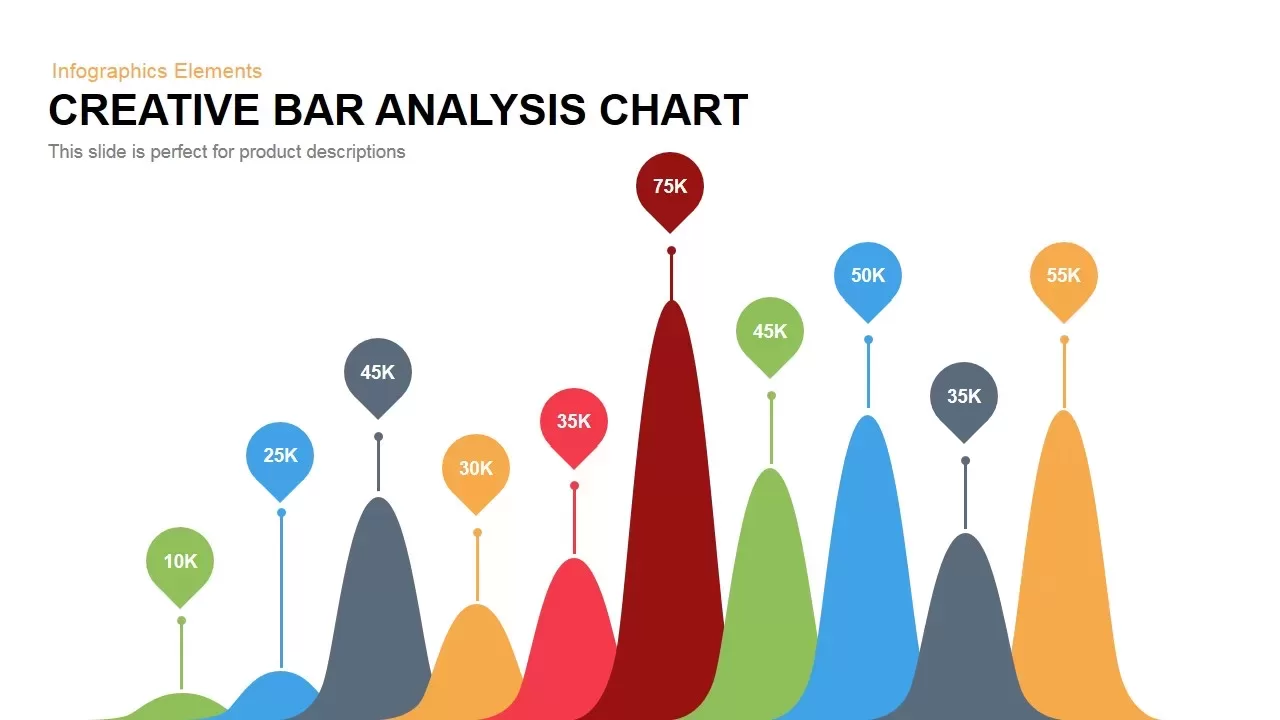
Creative Bar Chart Data Analysis PowerPoint Template and Keynote
Infographic
Premium
-
Creative Bar Chart Analysis PowerPoint Template and Keynote
Column and Bar chart
Premium
-
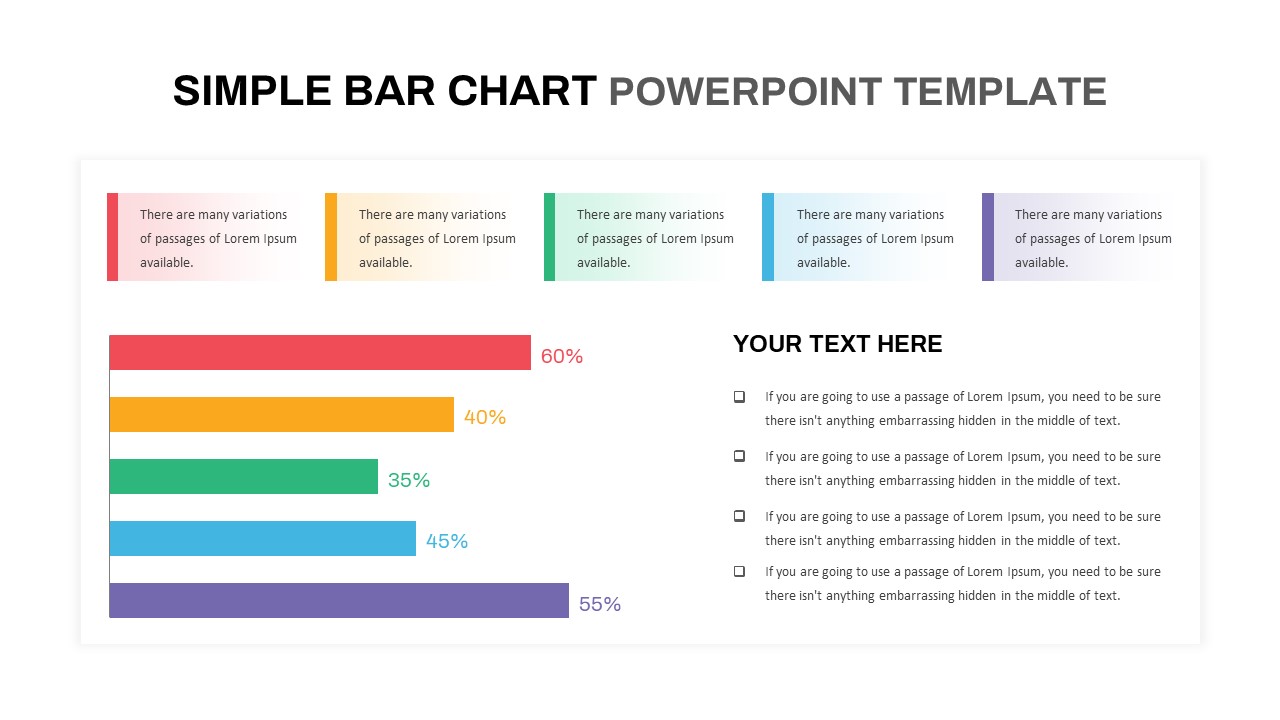
Simple Bar Chart PowerPoint Template
Column and Bar chart
Premium
-
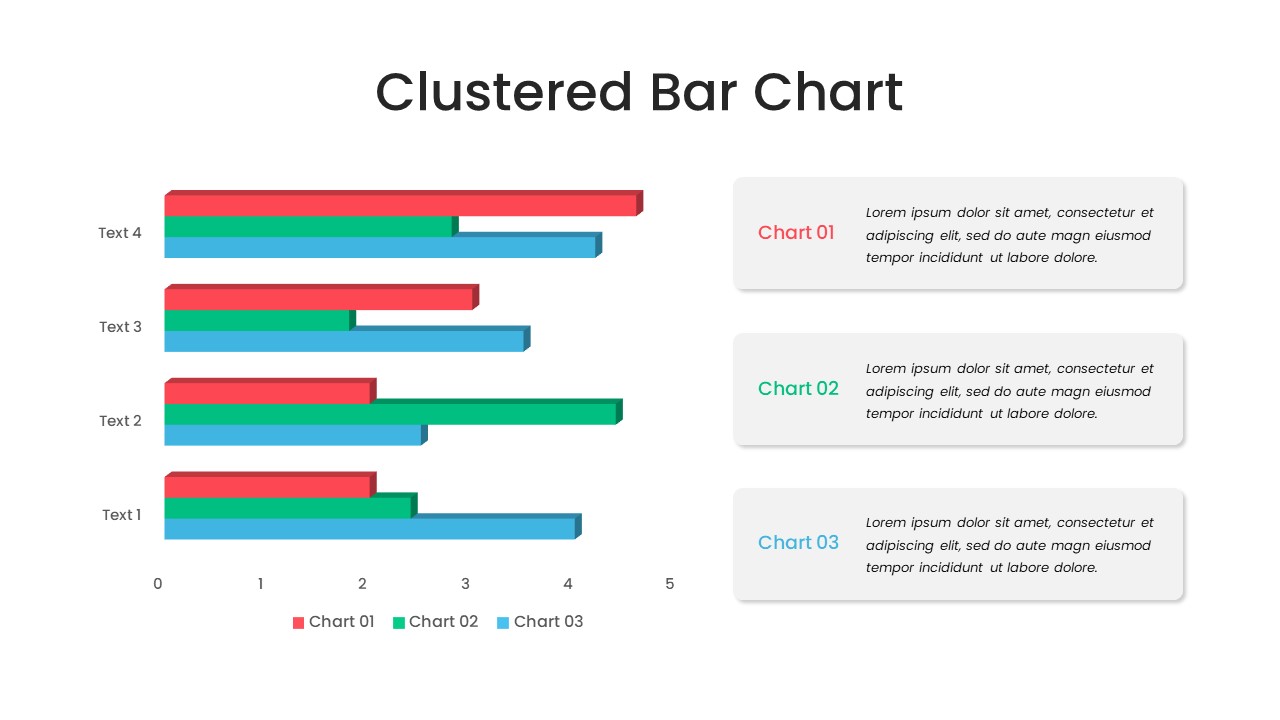
Clustered Bar Chart PowerPoint Template
Column and Bar chart
Premium
-

Animated Upcoming Event Poster PowerPoint Template
PowerPoint Templates
Premium
-

Business Process Reengineering Template
PowerPoint Templates
Premium
-

Free AI Artificial Intelligence PowerPoint Template
PowerPoint Templates
Free
-
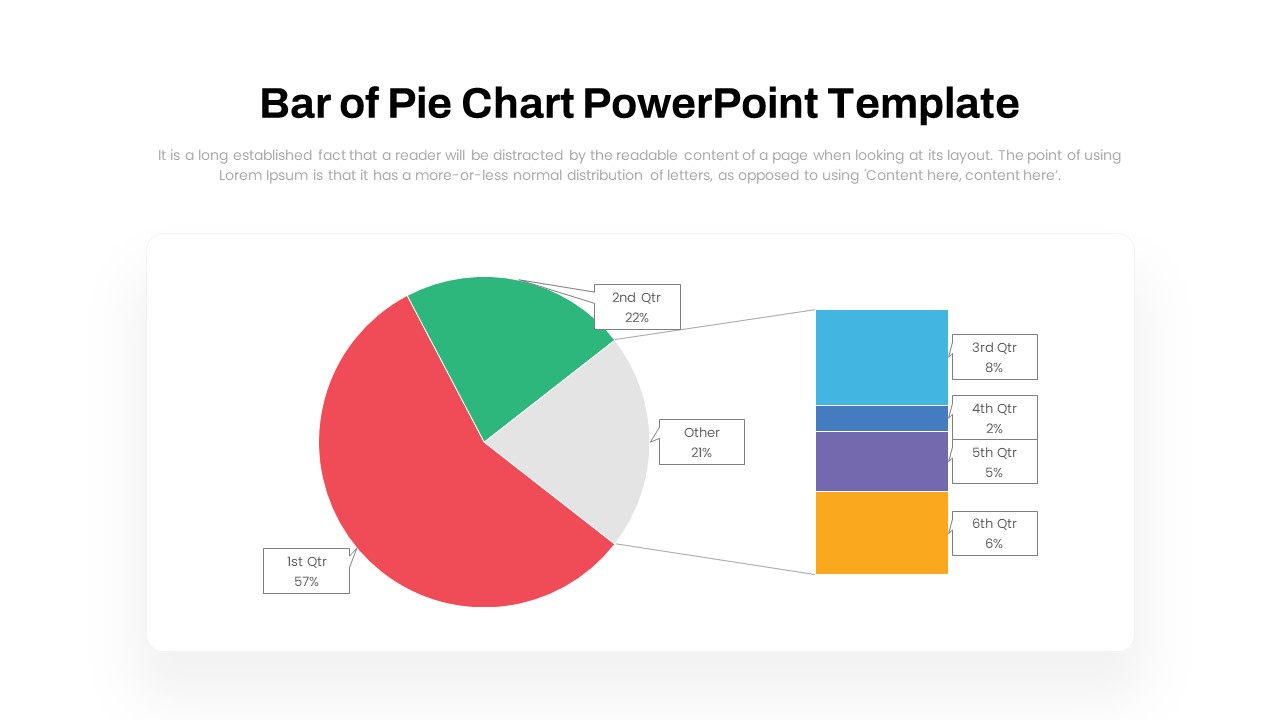
Bar of Pie Chart PowerPoint Template
PowerPoint Templates
Premium
-
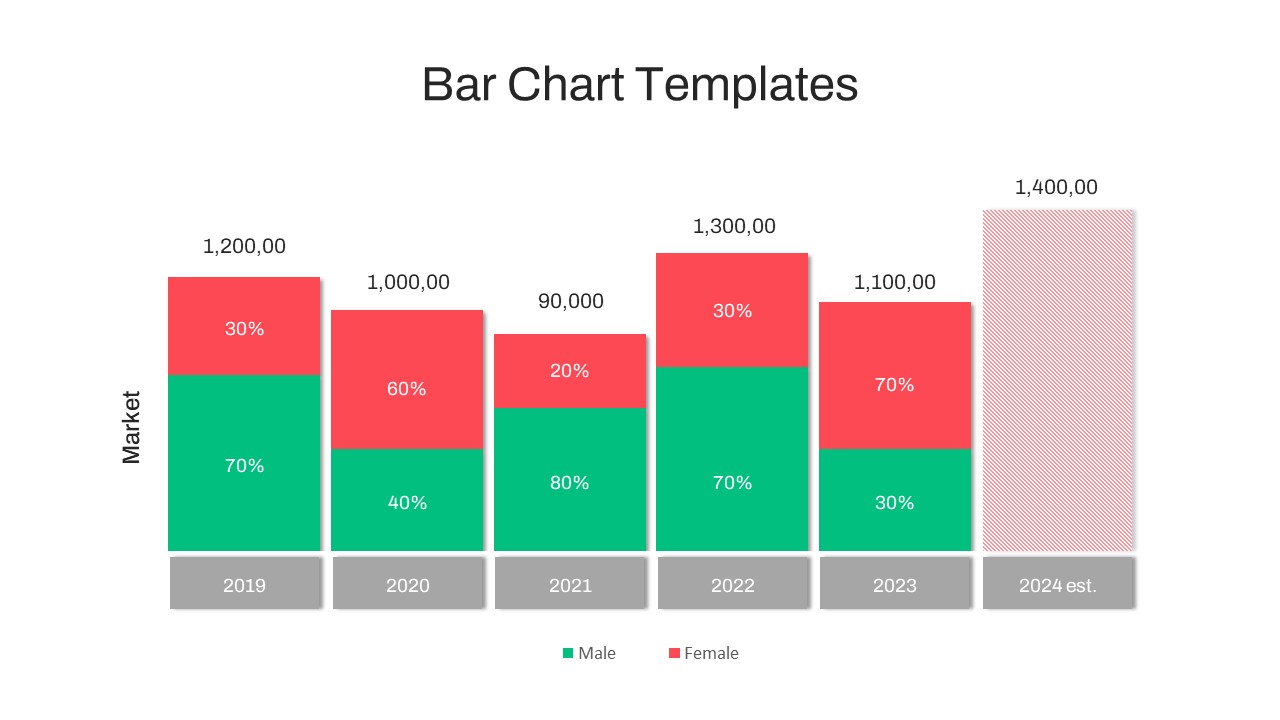
Timeline Bar Chart PowerPoint
Column and Bar chart
Premium
-
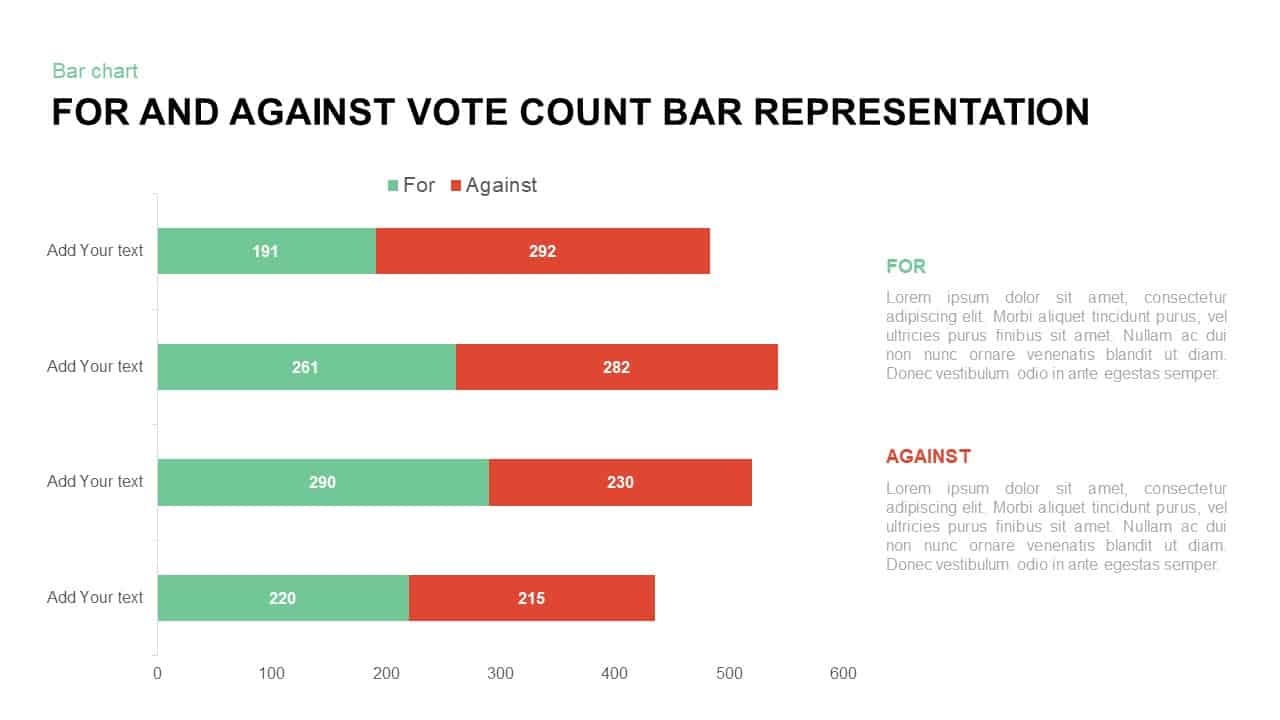
For and Against Vote Count Bar Chart for PowerPoint Presentation
Column and Bar chart
Premium
-

Stakeholder Register PowerPoint Template
PowerPoint Templates
Premium
-
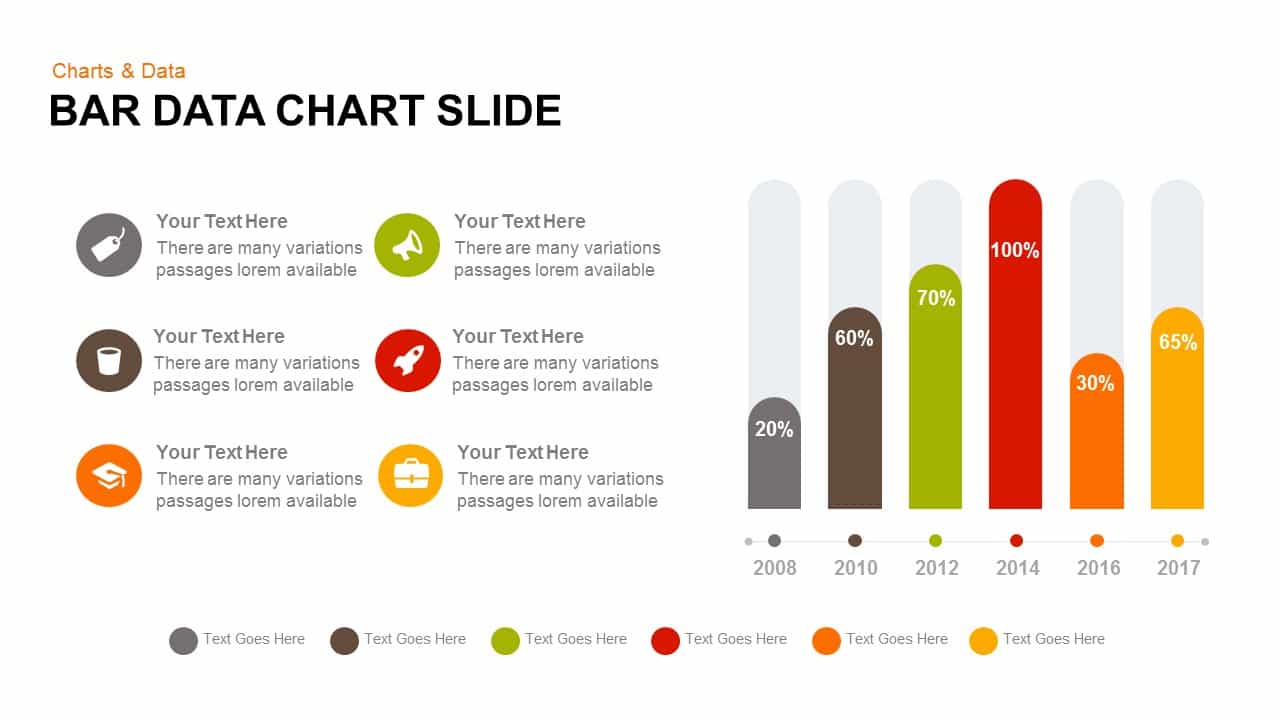
Data Bar Chart Template for PowerPoint and Keynote
Column and Bar chart
Premium
-

Animated Clustered Bar Chart PowerPoint Template
PowerPoint Charts
Premium
-
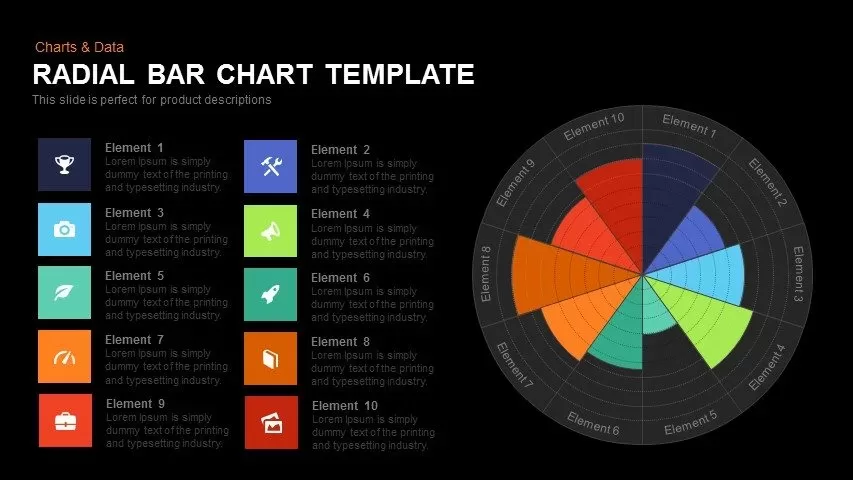
Radial Bar Chart Template for PowerPoint and Keynote
Circular Diagrams
Premium
-

Clustered Column Chart PowerPoint Template
PowerPoint Charts
Premium
-
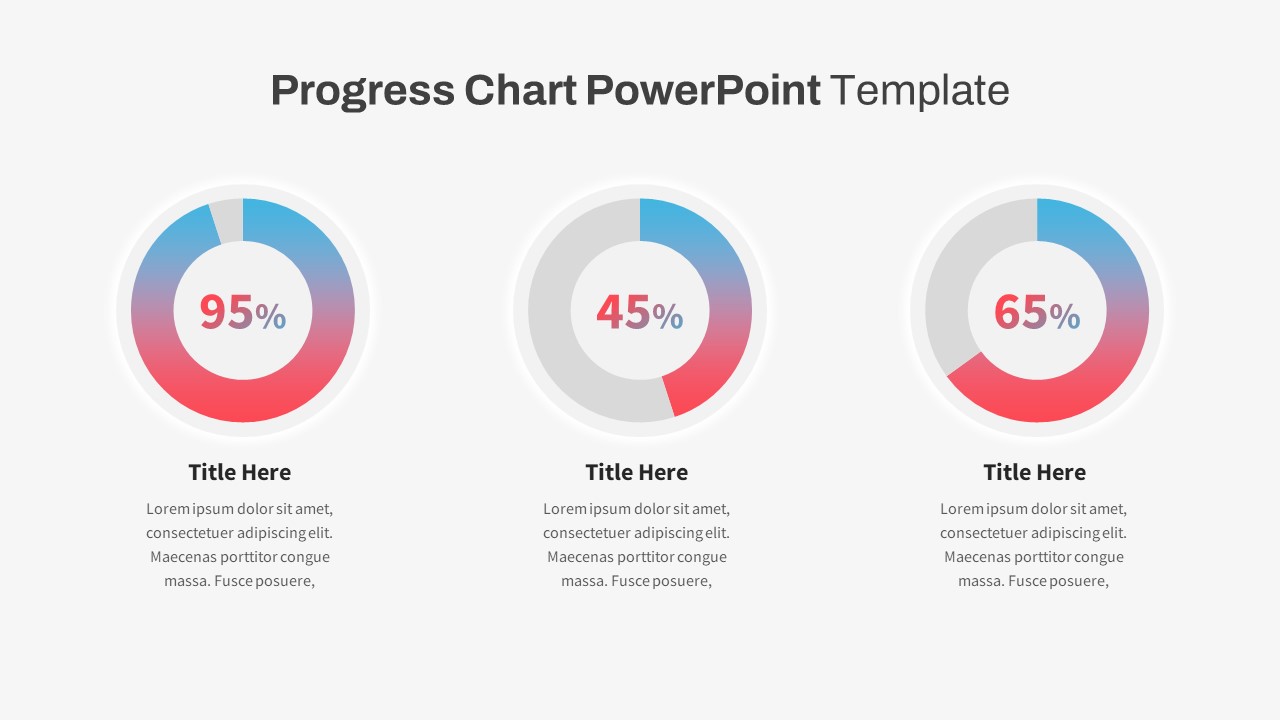
Progress Chart PowerPoint Template
PowerPoint Templates
Premium
-
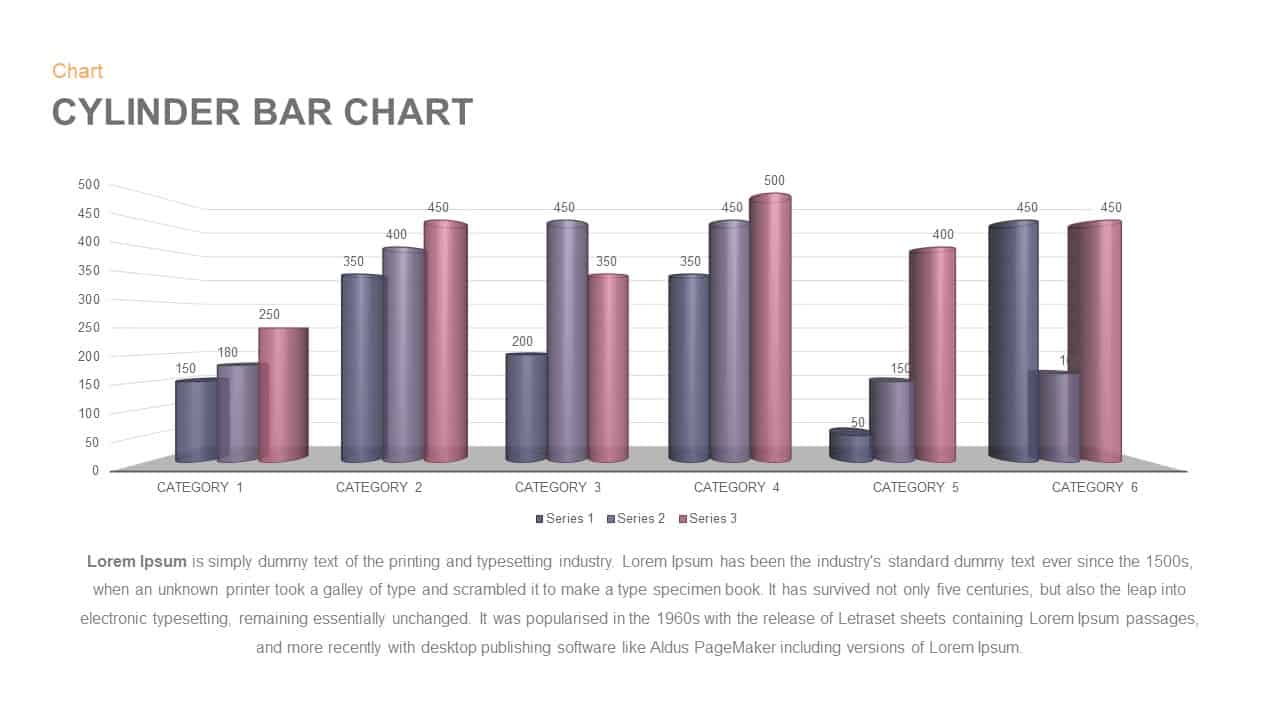
Cylinder Bar Chart PowerPoint Template and Keynote Slide
Column and Bar chart
Premium
-
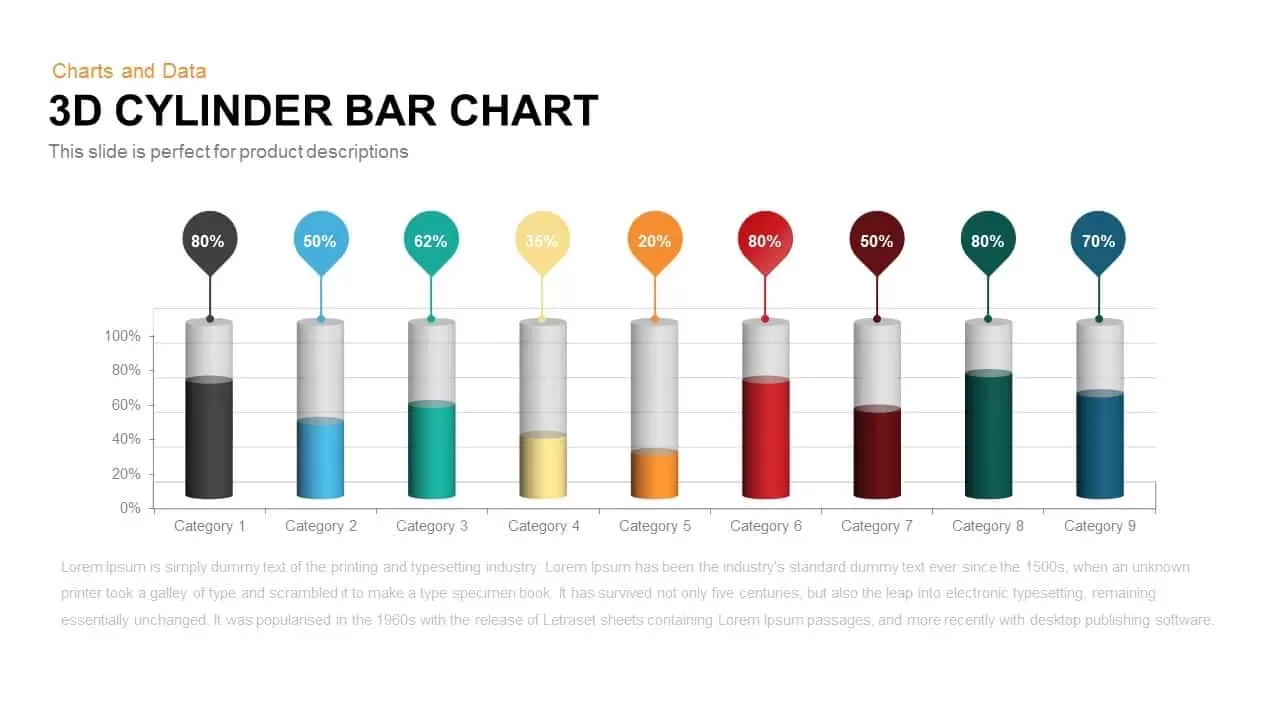
3D Cylinder Bar Chart PowerPoint Template and Keynote Slide
Column and Bar chart
Premium
-

Combination Chart PowerPoint Template
PowerPoint Charts
Premium
-
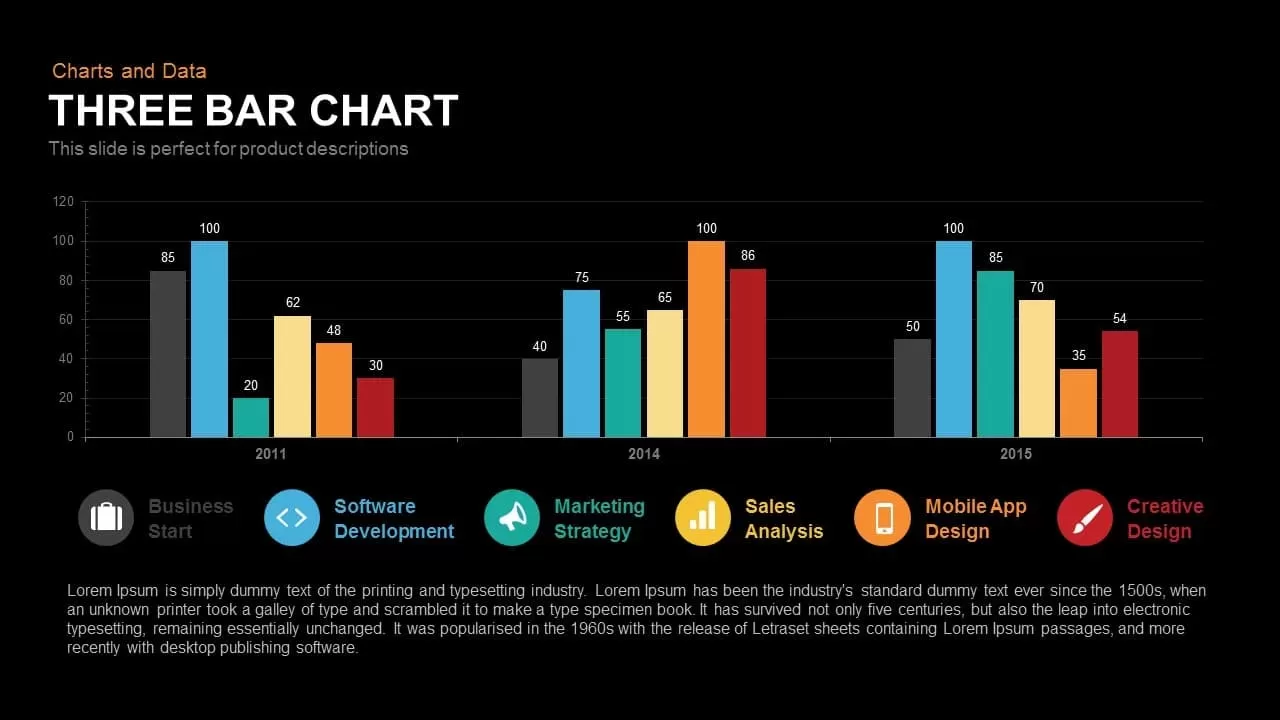
3 Bar Chart PowerPoint Template and Keynote Slide
Column and Bar chart
Premium
-

Biotechnology PowerPoint Presentation Template
PowerPoint Templates
Premium
-
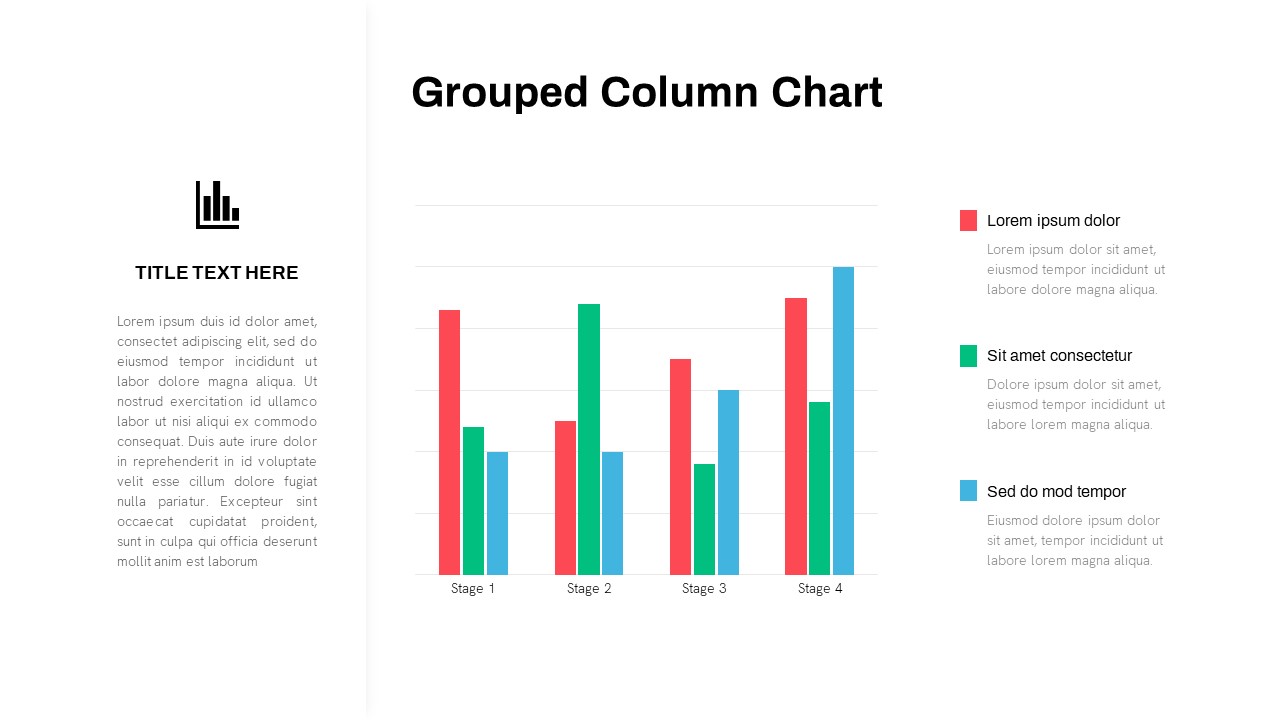
Grouped Column Chart PowerPoint Template
Column and Bar chart
Premium
-

Free Charts and Graphs PowerPoint Template
PowerPoint Templates
Free
-
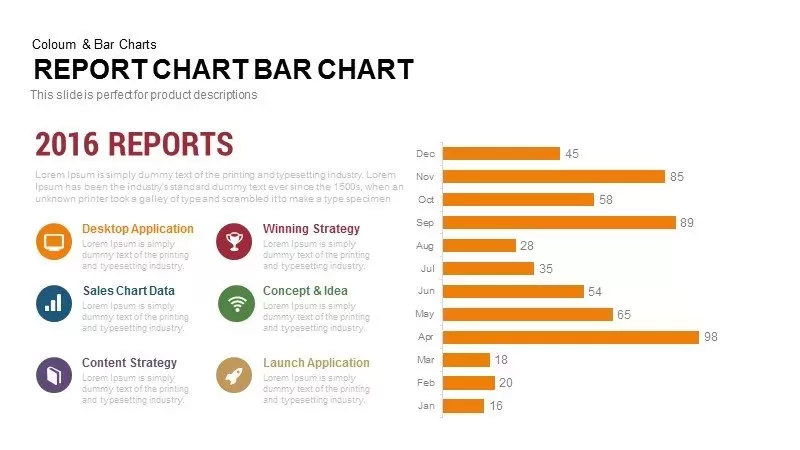
Report Bar Chart PowerPoint Template and Keynote
Column and Bar chart
Premium
-
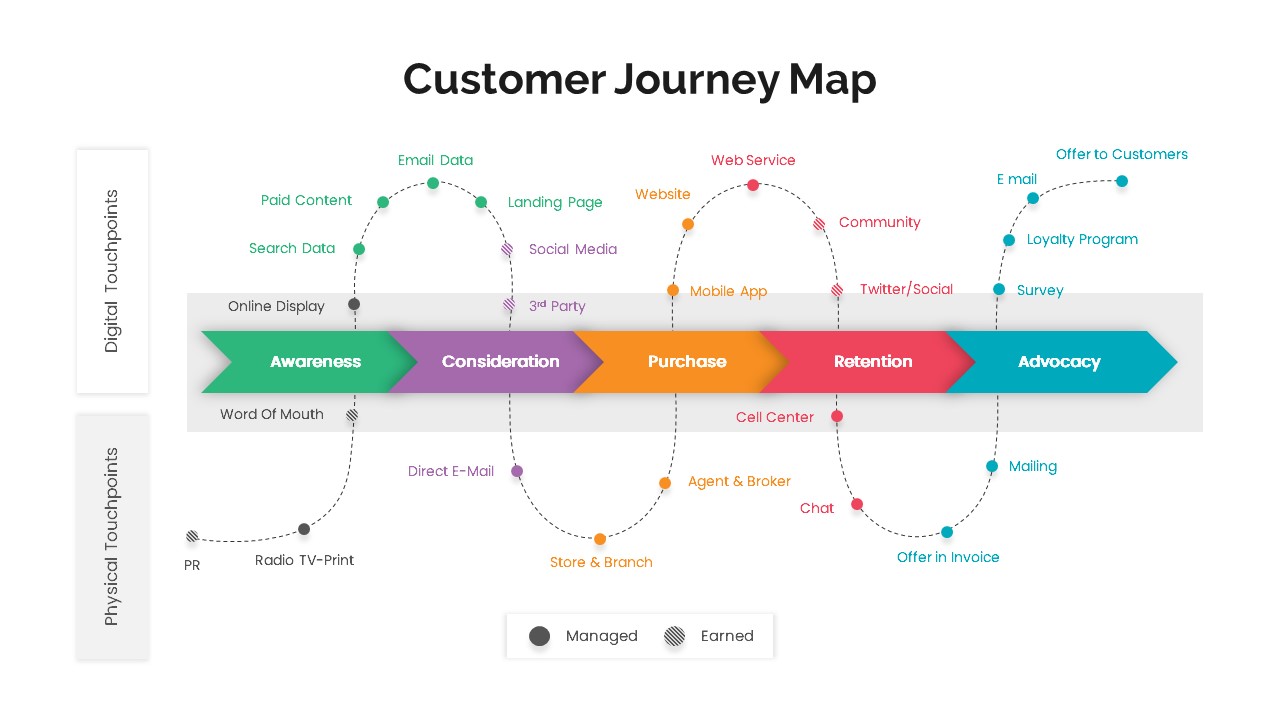
Customer Journey Map PowerPoint
PowerPoint Templates
Premium
-

Free Teacher’s Week Plan PowerPoint Template
PowerPoint Templates
Free
-

Power Analogy Metaphor PowerPoint Template
Metaphor, Simile & Analogy
Premium
-

Open Door Policy PowerPoint Template
PowerPoint Templates
Premium
-
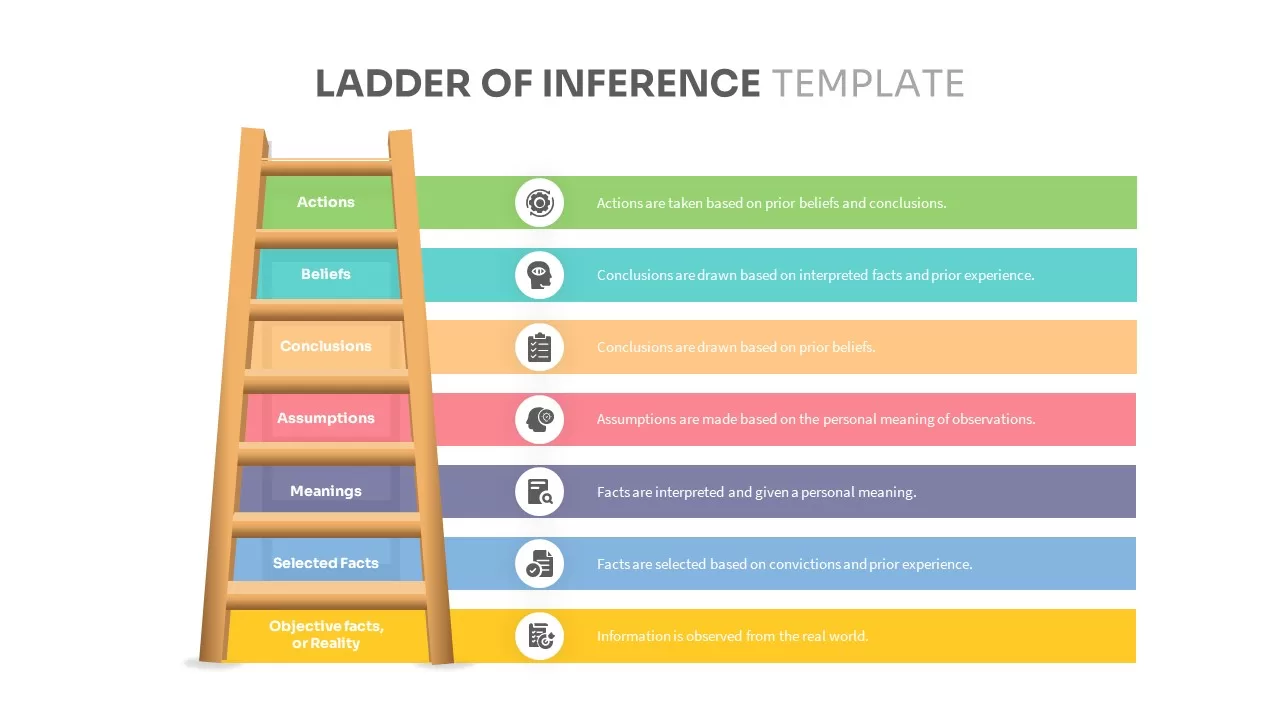
Ladder Of Inference Template
Metaphor, Simile & Analogy
Premium
-

Business Case PowerPoint Presentation Template
PowerPoint Business Templates
Premium
-

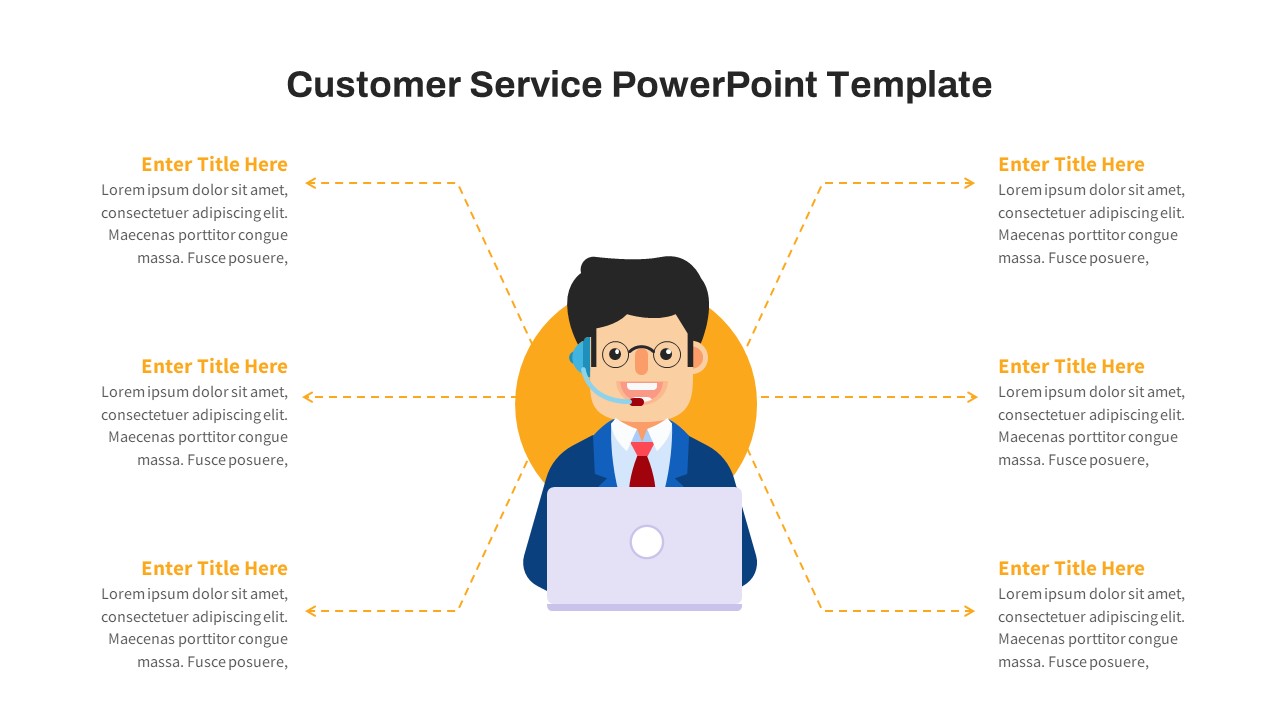
Customer Service PowerPoint Template
PowerPoint Templates
Premium
-

Area Chart PowerPoint Template
PowerPoint Charts
Premium
-
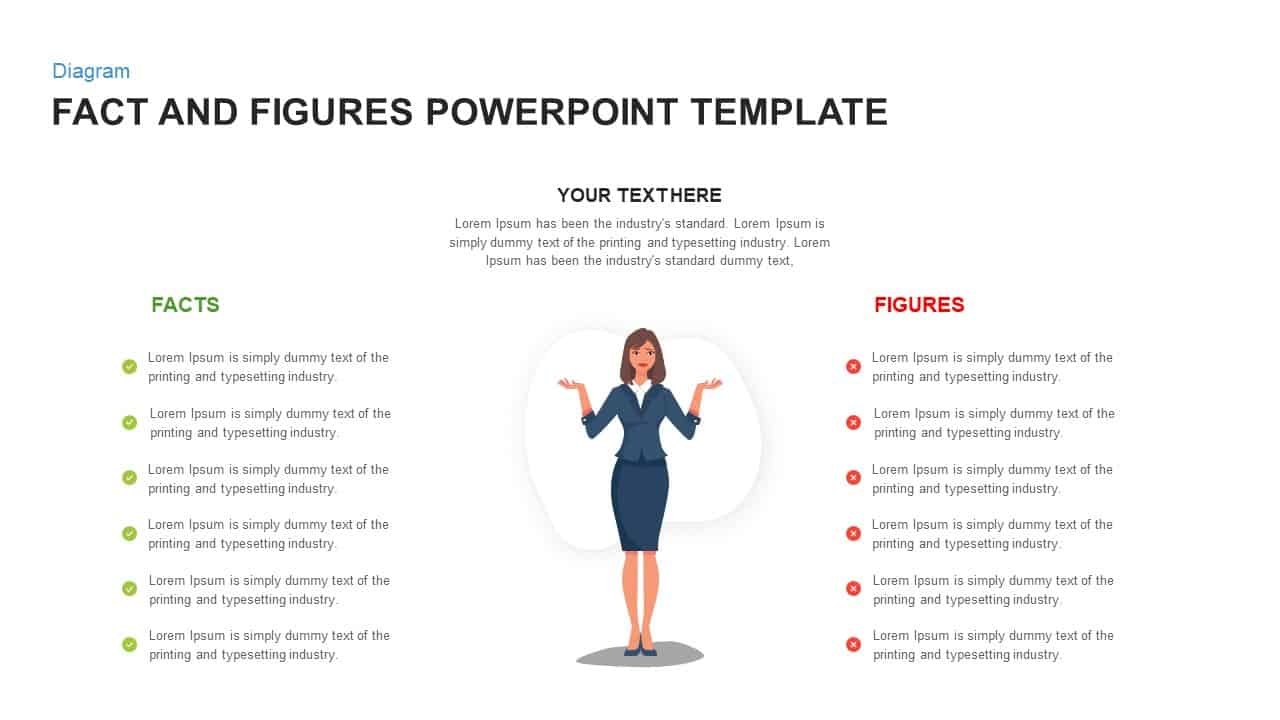
Facts and Figures PowerPoint Template
Business Models
Premium
-
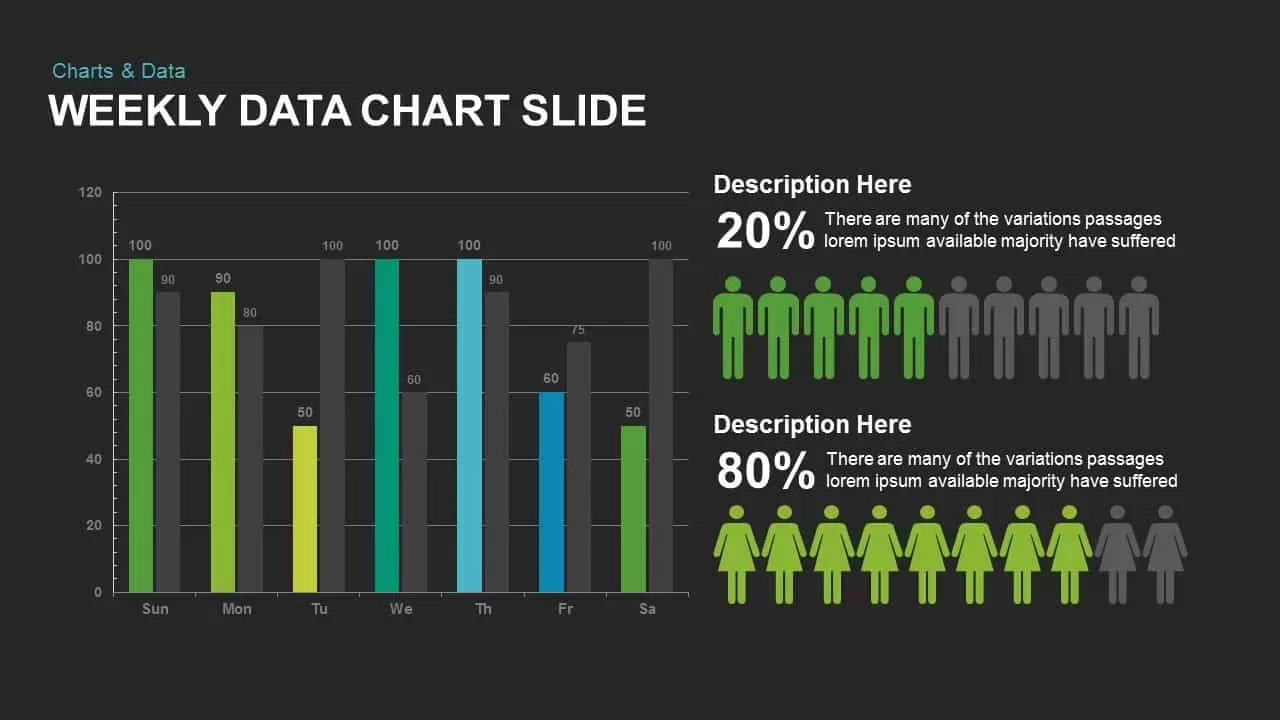
Weekly Data Charts PowerPoint Presentation Template and Keynote Slide
Infographic
Premium
-

Go To Market PowerPoint Template
PowerPoint Templates
Premium
-
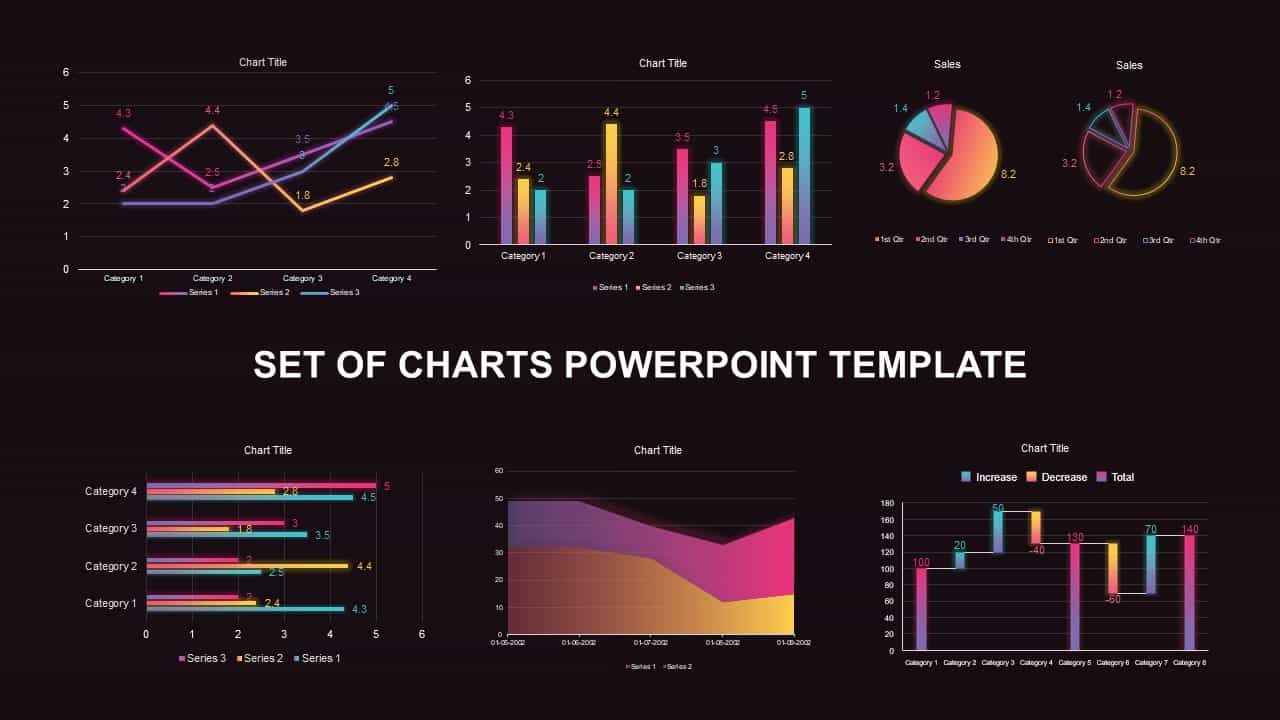
Set of Chart PowerPoint Template and Keynote Diagram
PowerPoint Charts
Premium
-
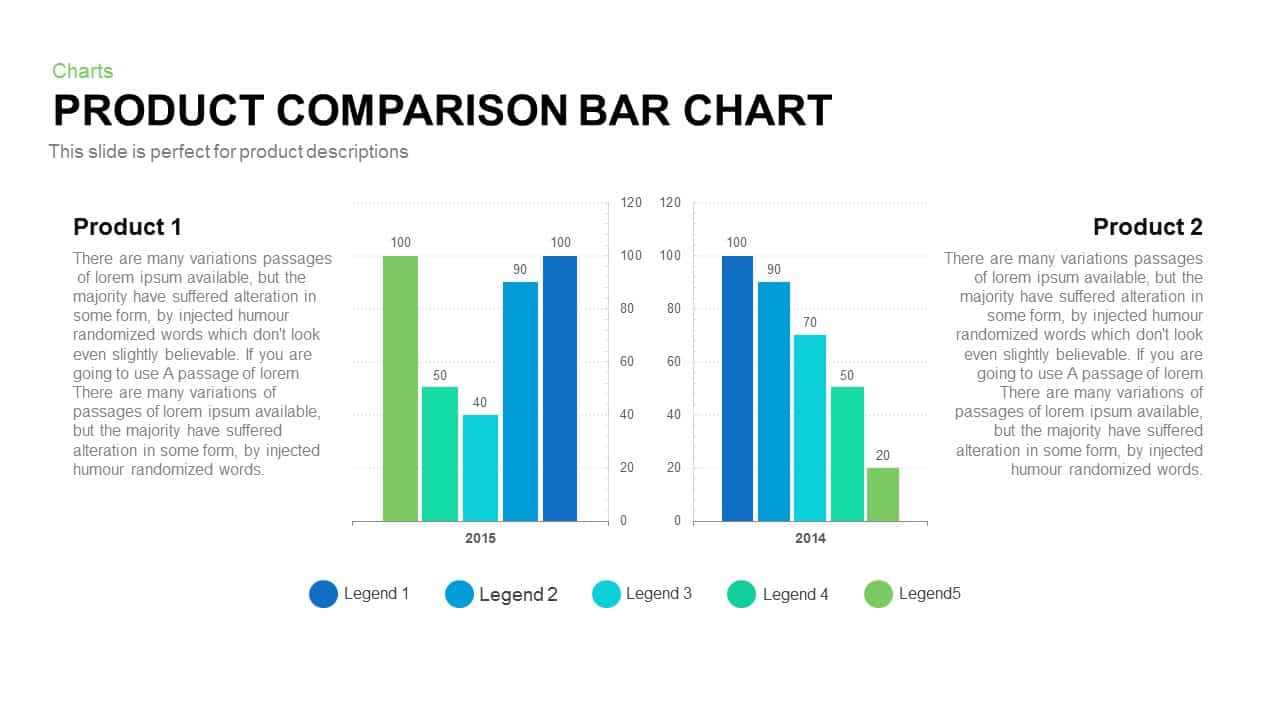
Product Comparison Bar Chart Template for PowerPoint and Keynote
PowerPoint Charts
Premium
-
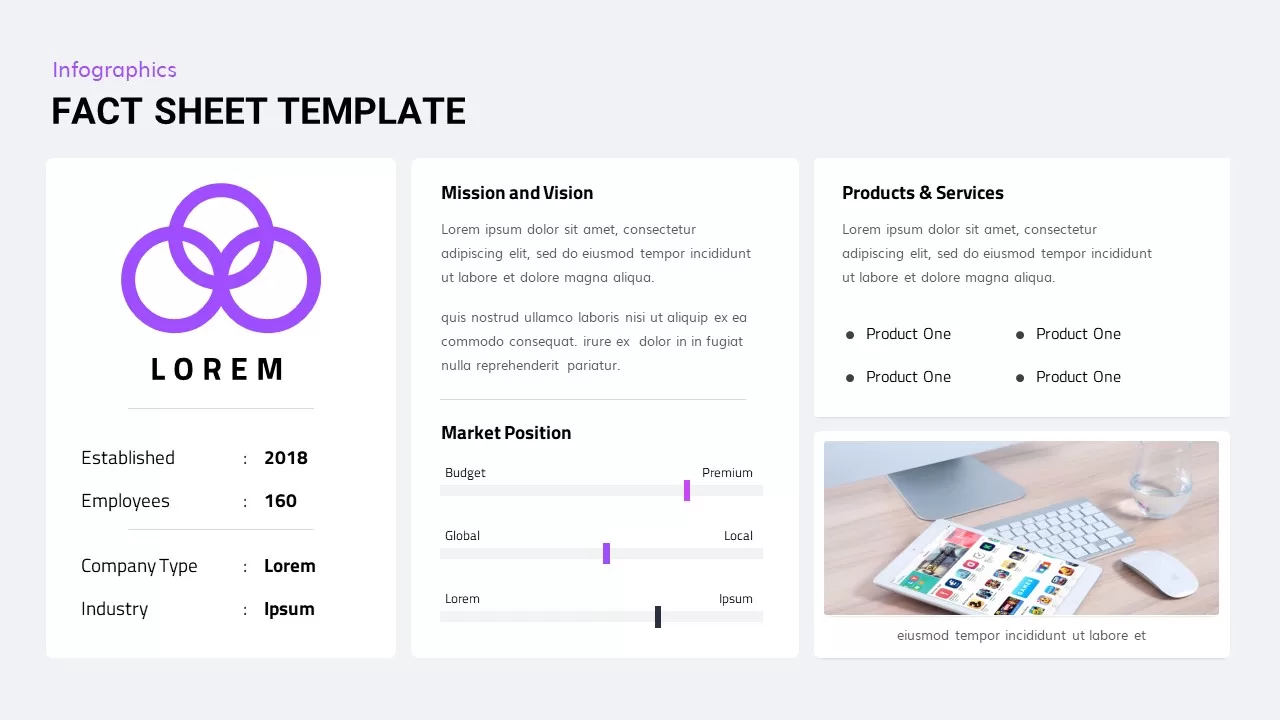
Fact Sheet PowerPoint Template
PowerPoint Business Templates
Premium
-
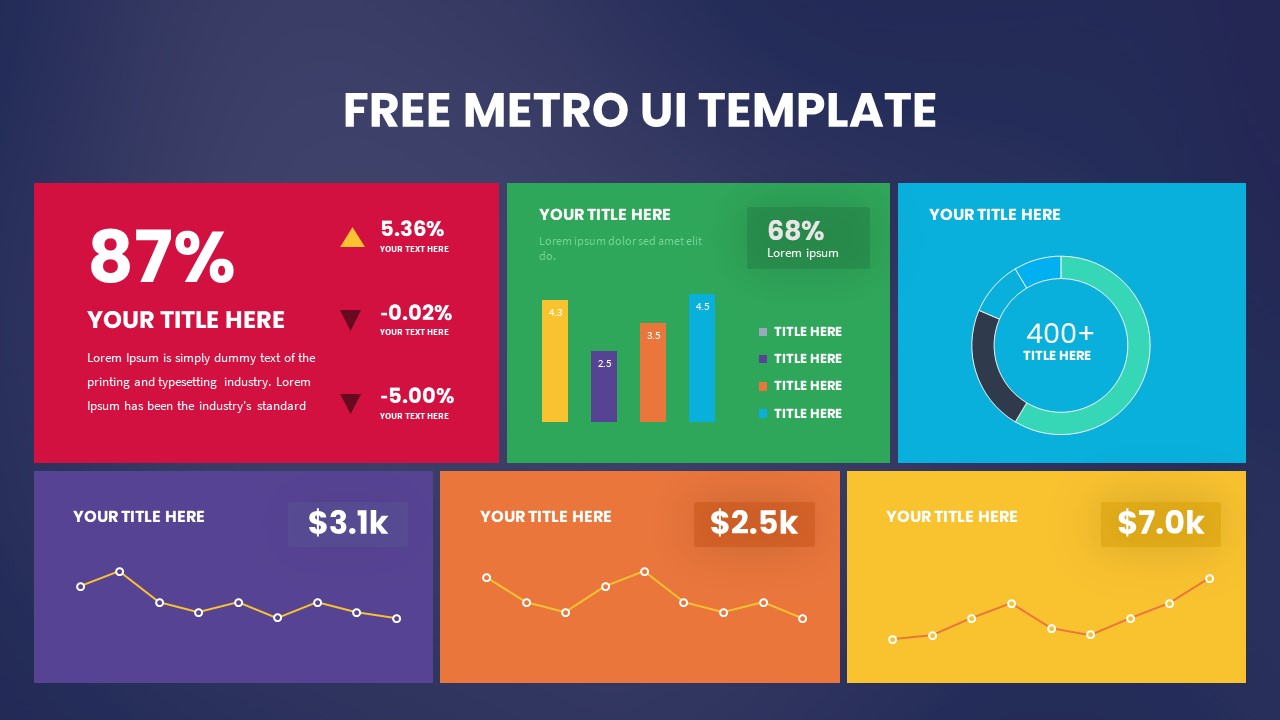
Free Metro UI Dashboard Template
PowerPoint Templates
Free
-
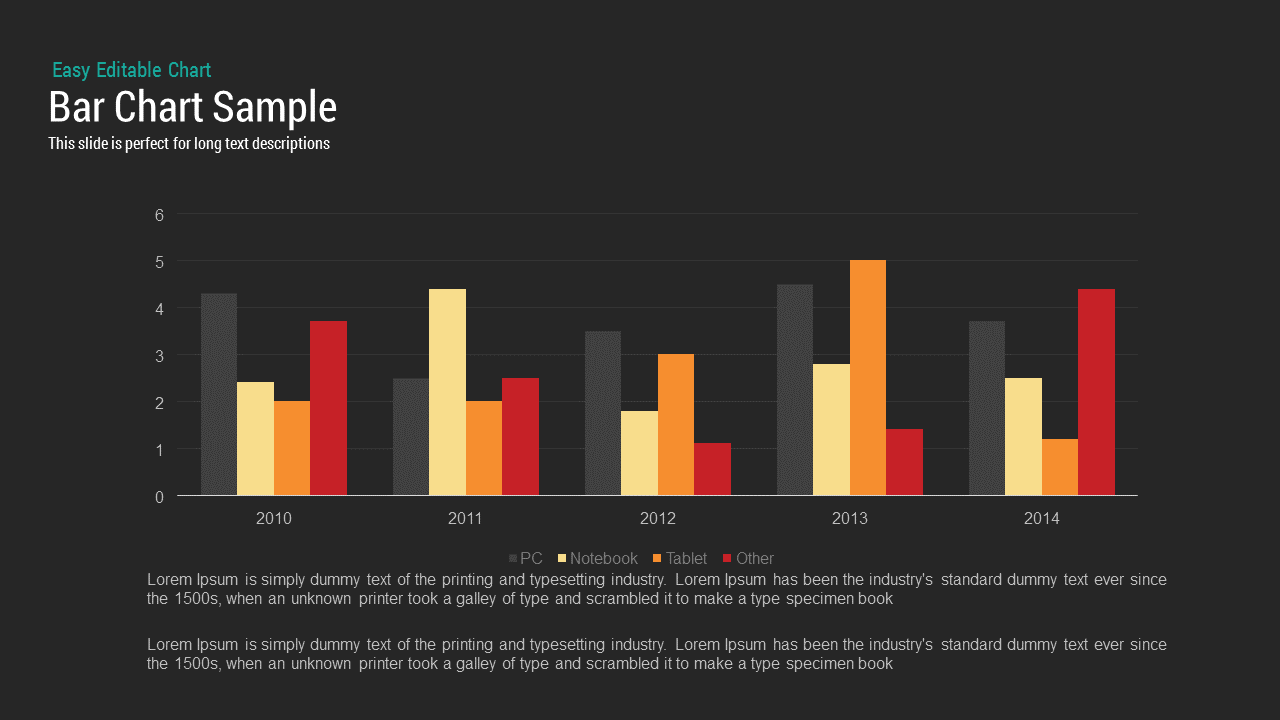
Sample Bar Chart Template for PowerPoint and Keynote Presentation
Column and Bar chart
Premium
-
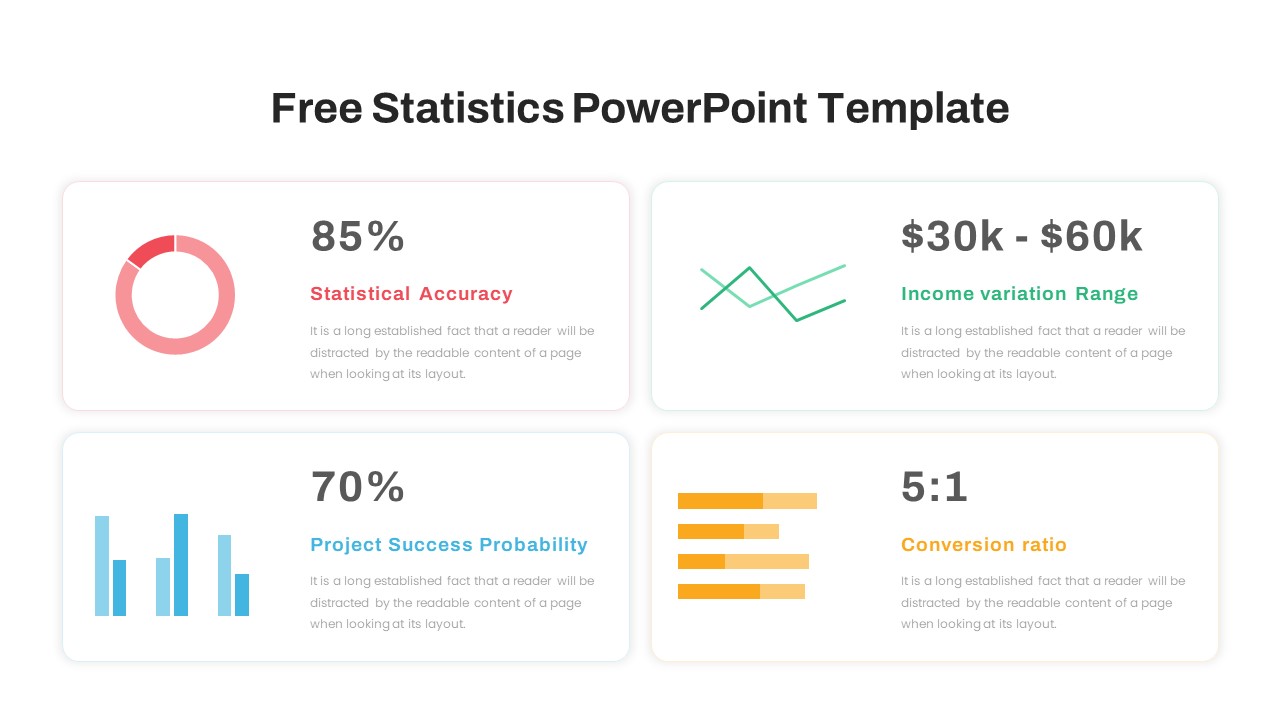
Free Statistics PowerPoint Template
Free PowerPoint Templates
Free
-

Cyber Monday PowerPoint Template
PowerPoint Business Templates
Premium
-
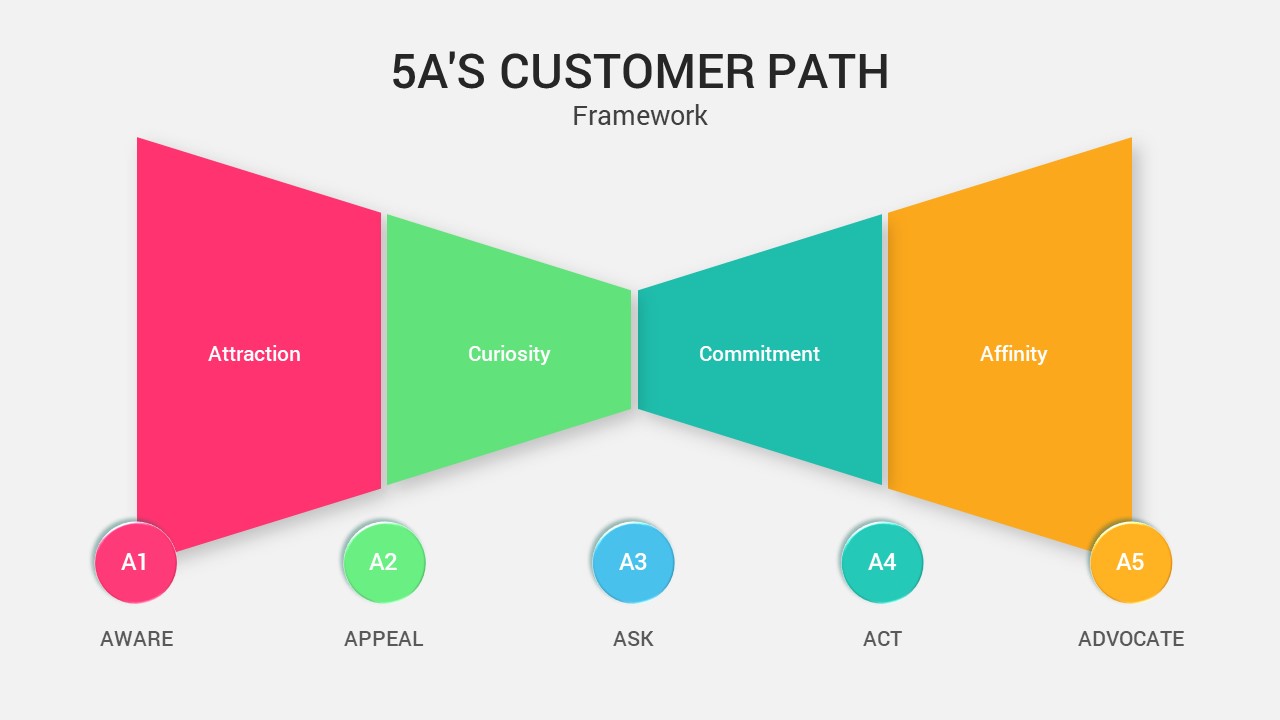
5A’s Customer Path PowerPoint Template
PowerPoint Templates
Premium
-
Free Customer Service PowerPoint Template
PowerPoint Templates
Free
-
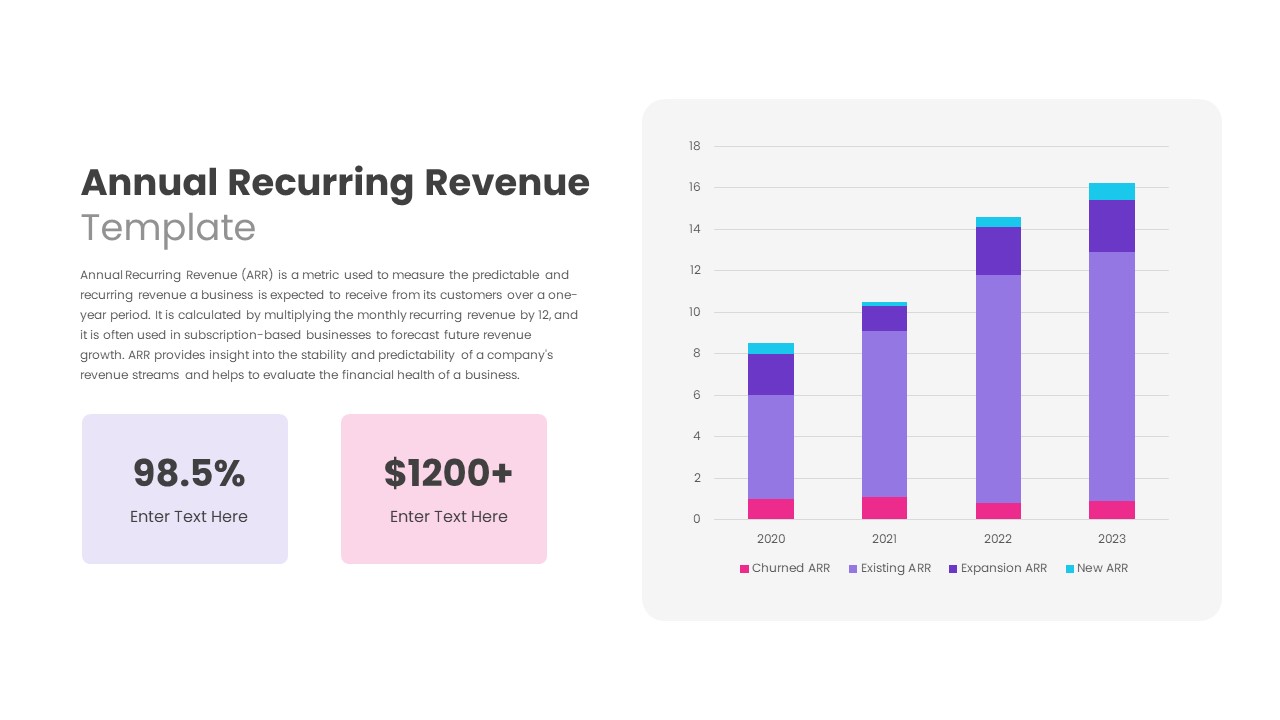
Annual Recurring Revenue PowerPoint Template
PowerPoint Templates
Premium
-
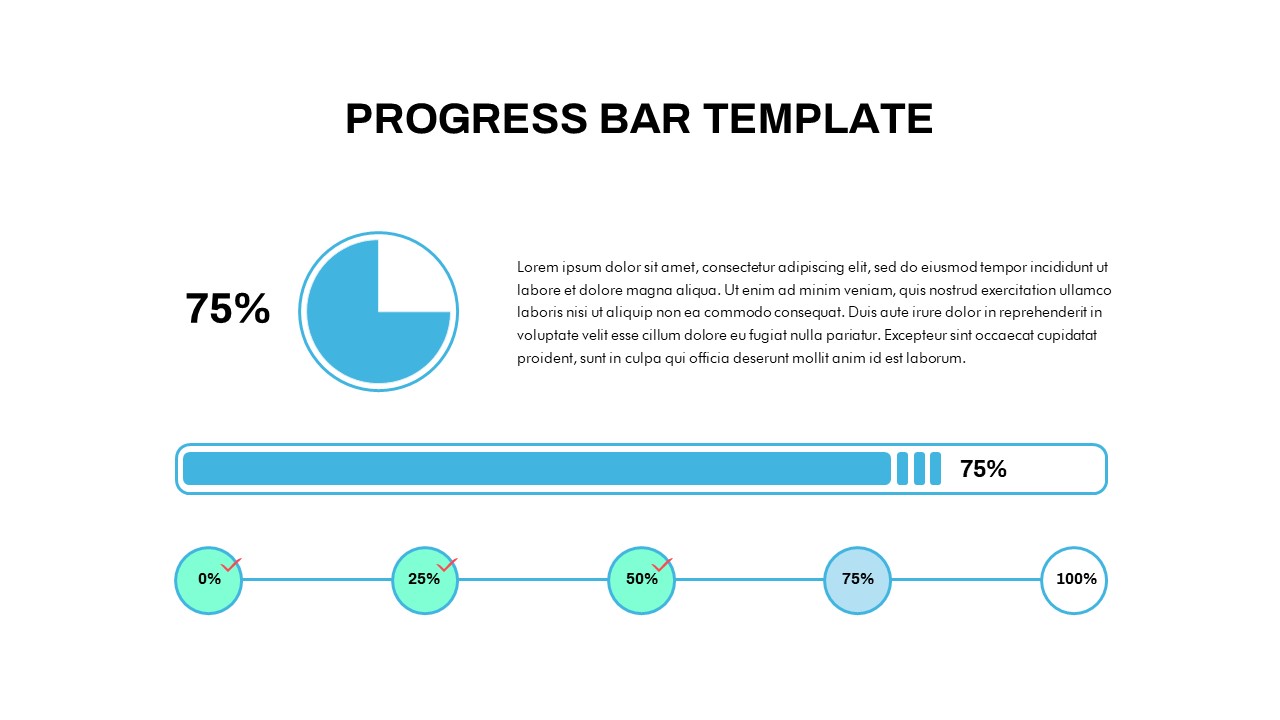
Progress Bar Chart PowerPoint Template
PowerPoint Templates
Premium
-

Proportional Area Chart PowerPoint Template
PowerPoint Templates
Premium
-

Customer Acquisition Strategy Template for PowerPoint & Keynote
PowerPoint Business Templates
Premium
-
Free PowerPoint Book Template
Free slides
Free
-

Creative Studio PowerPoint Template
PowerPoint Business Templates
Premium
-
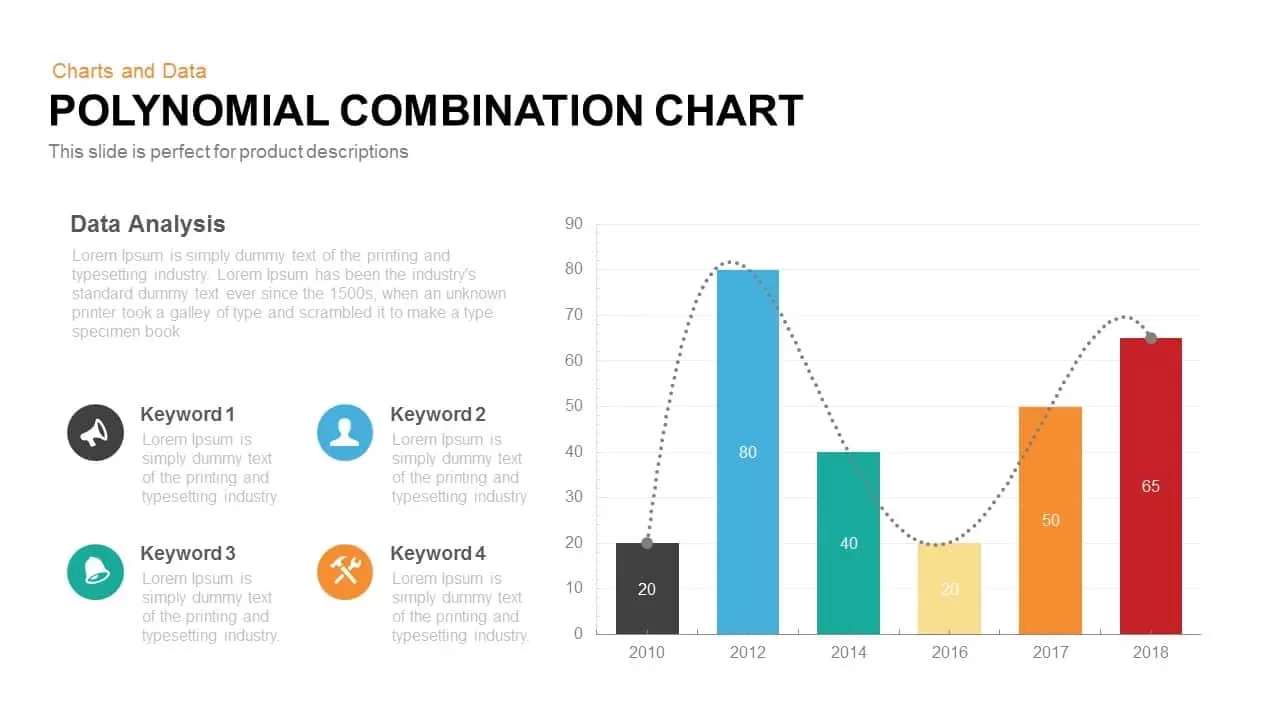
Polynomial Combination Chart PowerPoint Template and Keynote Slide
Column and Bar chart
Premium
-
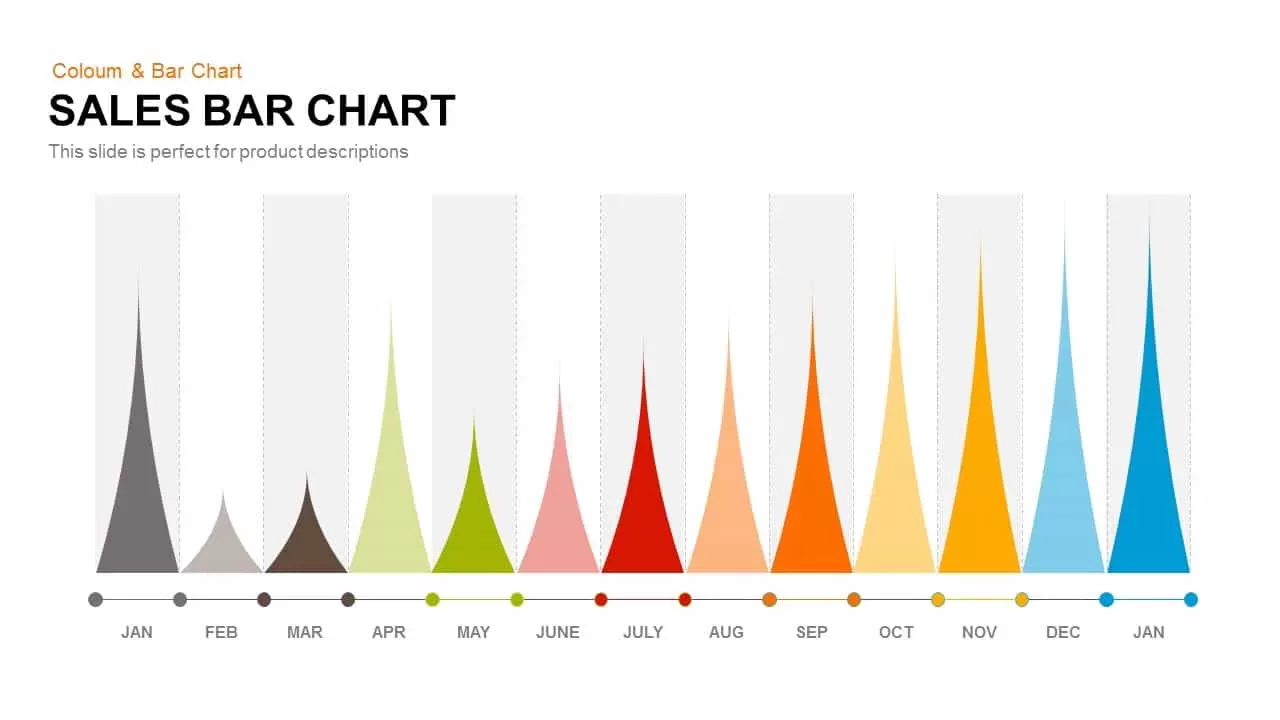
Sales Bar Chart Template for PowerPoint and Keynote
Column and Bar chart
Premium
-
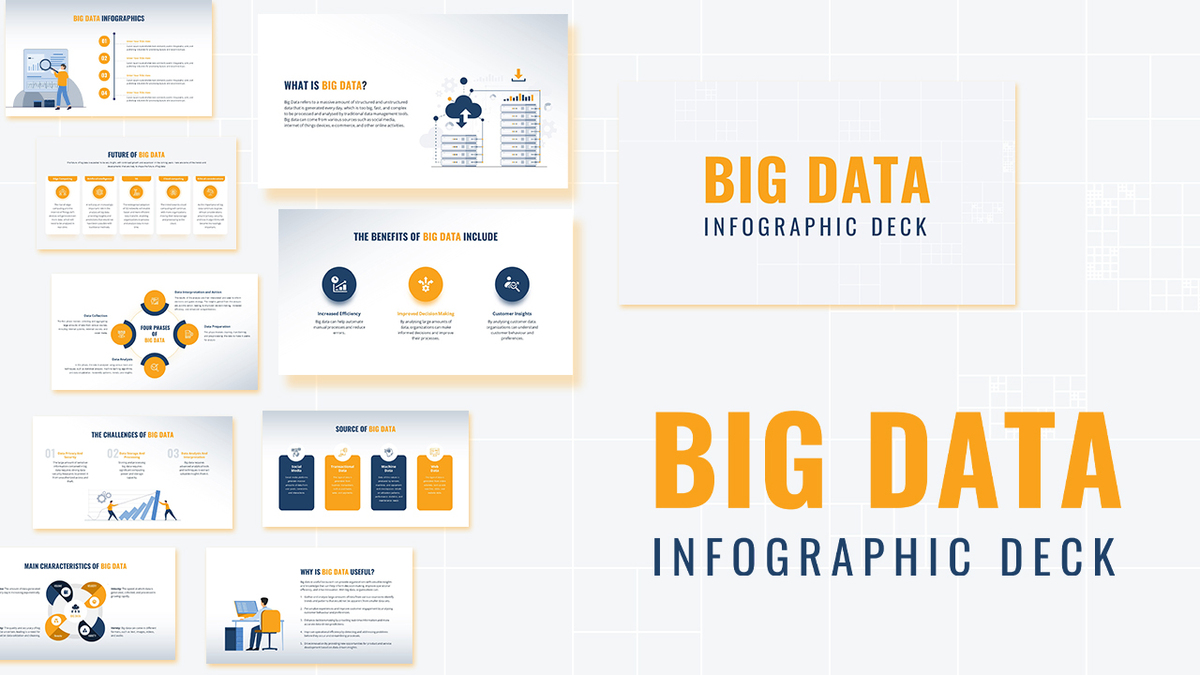
Big Data Infographic Deck For PowerPoint
PowerPoint Business Templates
Premium
-
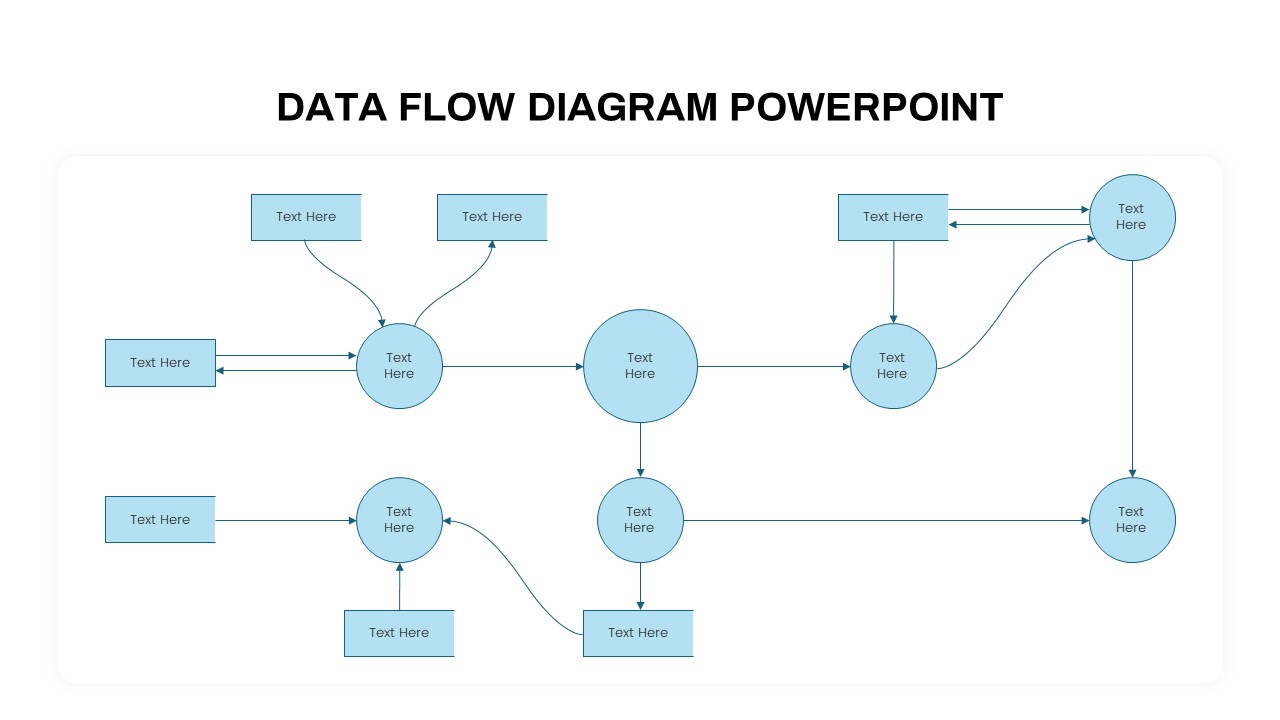
Data Flow PowerPoint Presentation Template
PowerPoint Templates
Premium
-
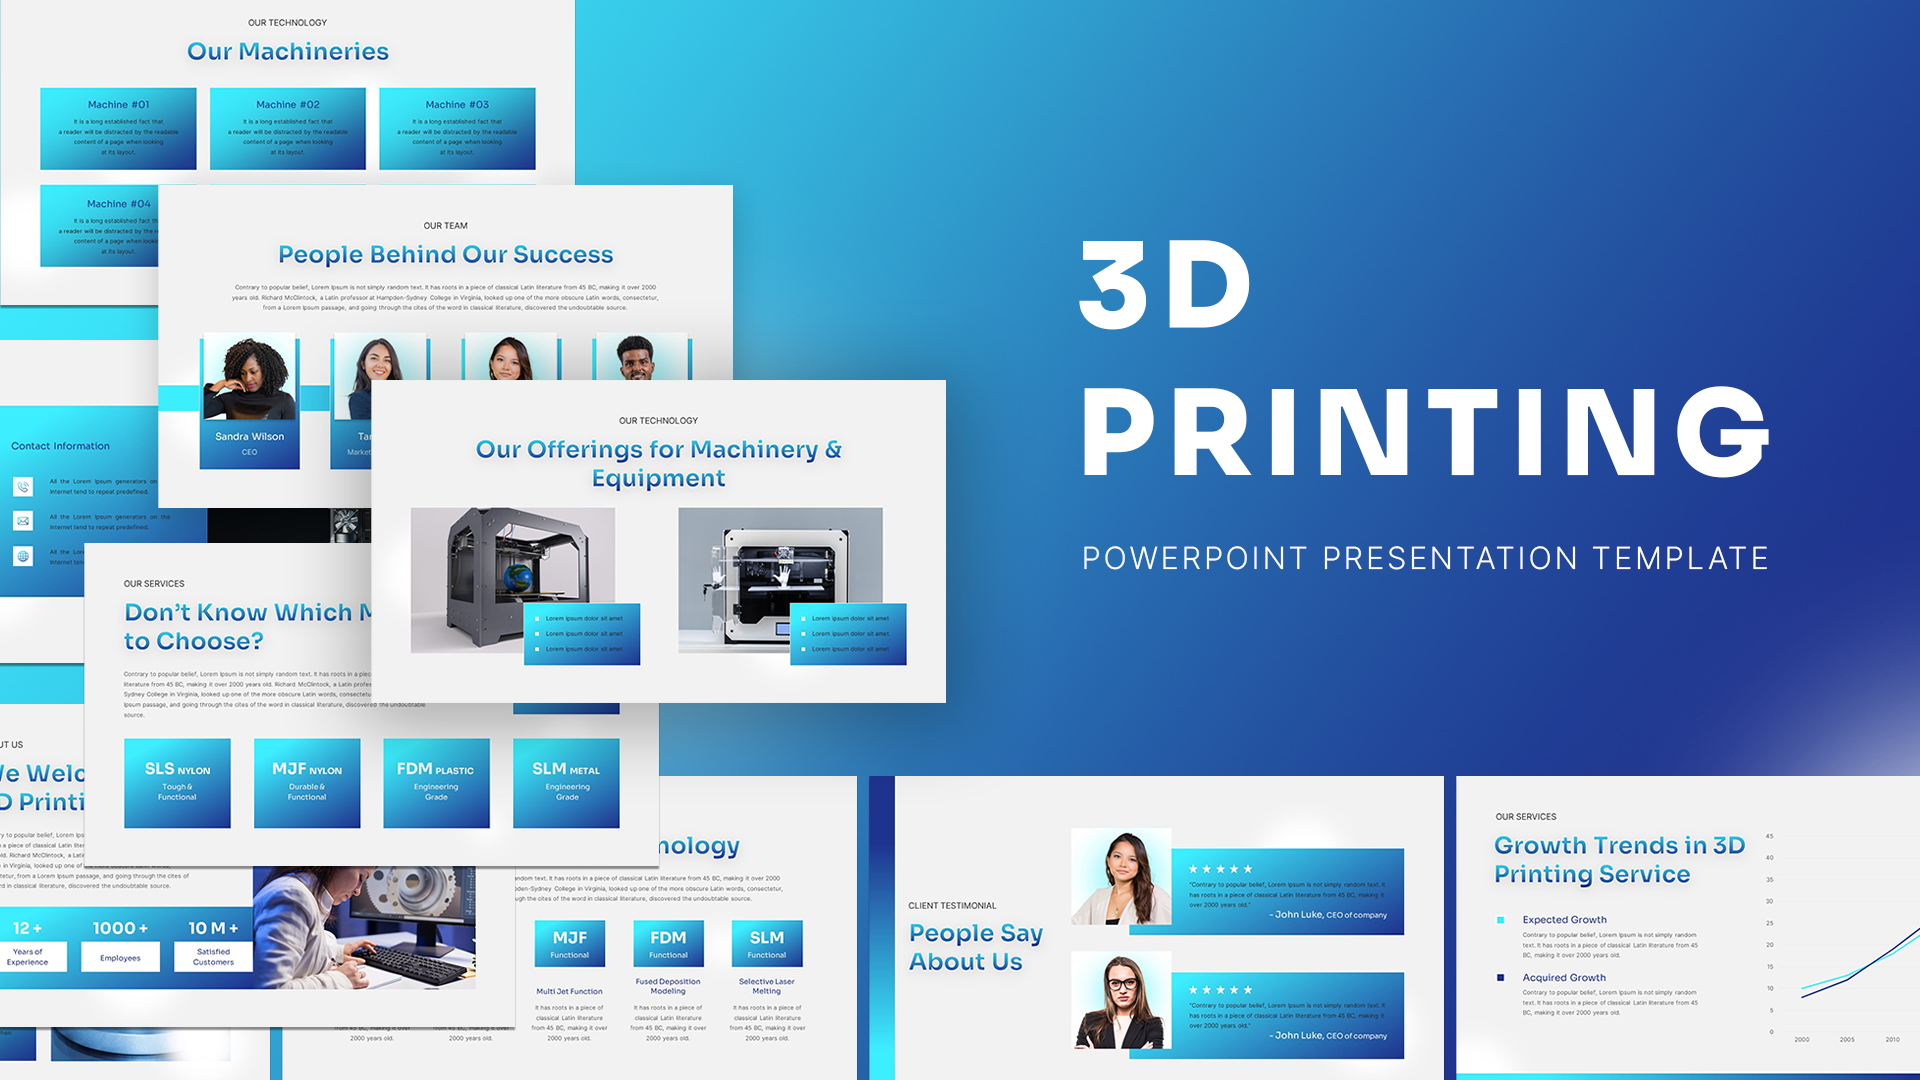
3D Printing Deck PowerPoint Template
PowerPoint Templates
Premium
-

Corporate PowerPoint Presentation Template
PowerPoint Business Templates
Premium
-
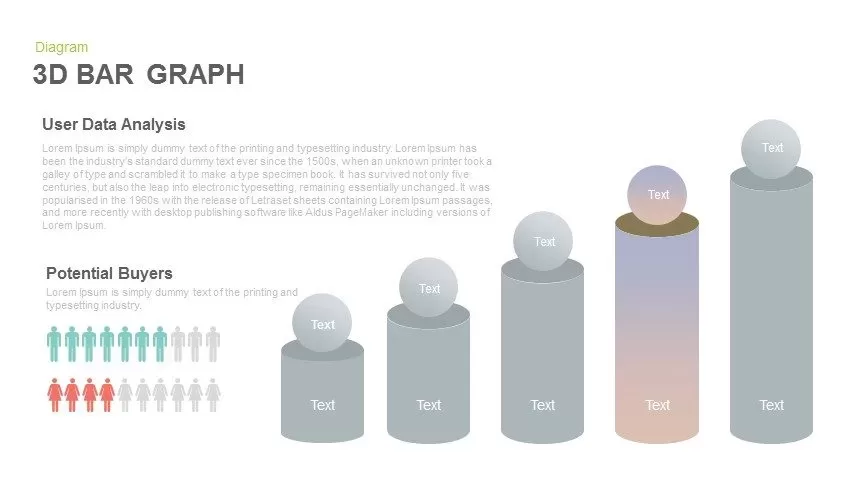
3d Bar Graph PowerPoint Template and Keynote Slide
Diagrams
Premium
-
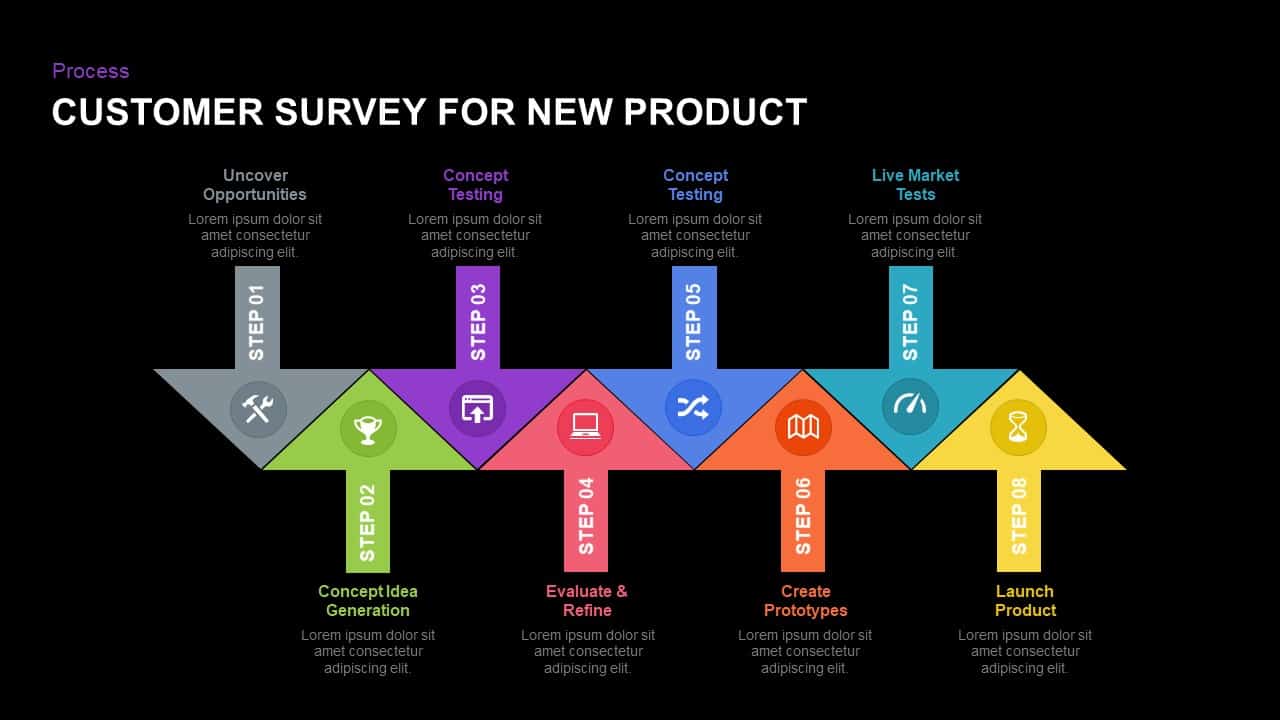
Customer Survey For New Product PowerPoint Template and Keynote Slide
Arrow Diagrams
Premium
-

Multipurpose Business PowerPoint Template
PowerPoint Business Templates
Premium
-
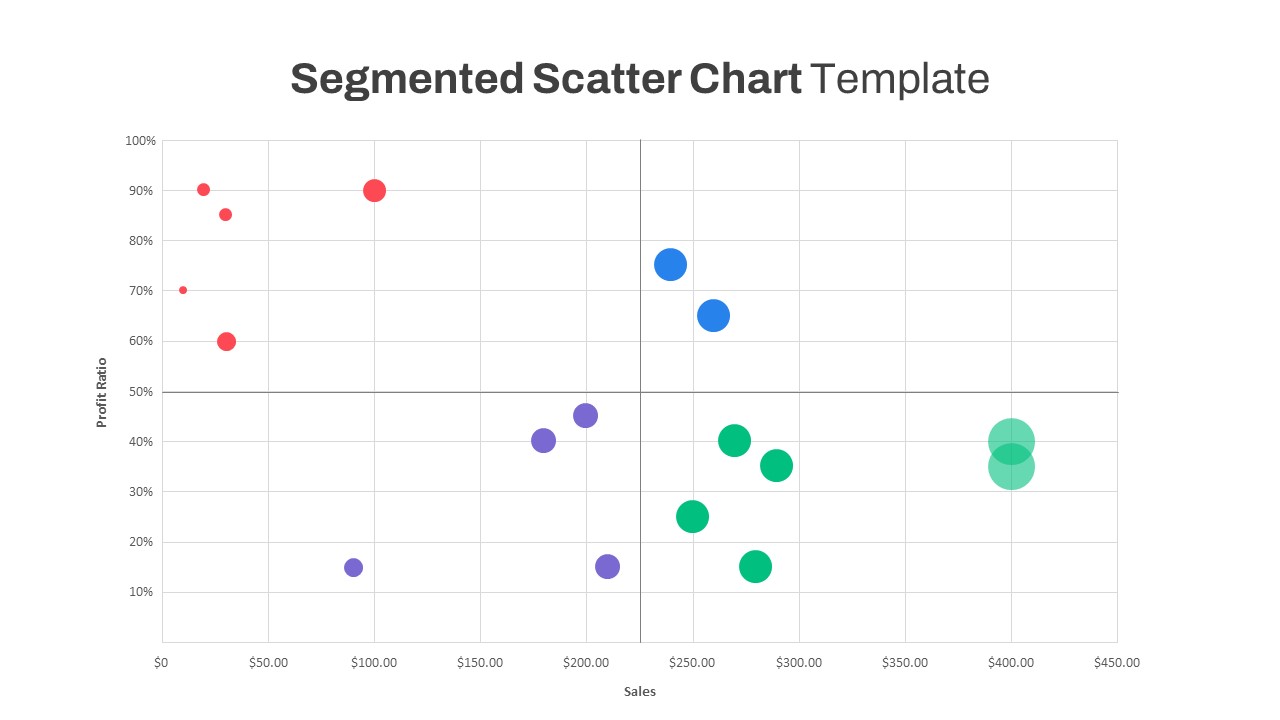
Segmented Scatter Chart PowerPoint Template
PowerPoint Charts
Premium
-
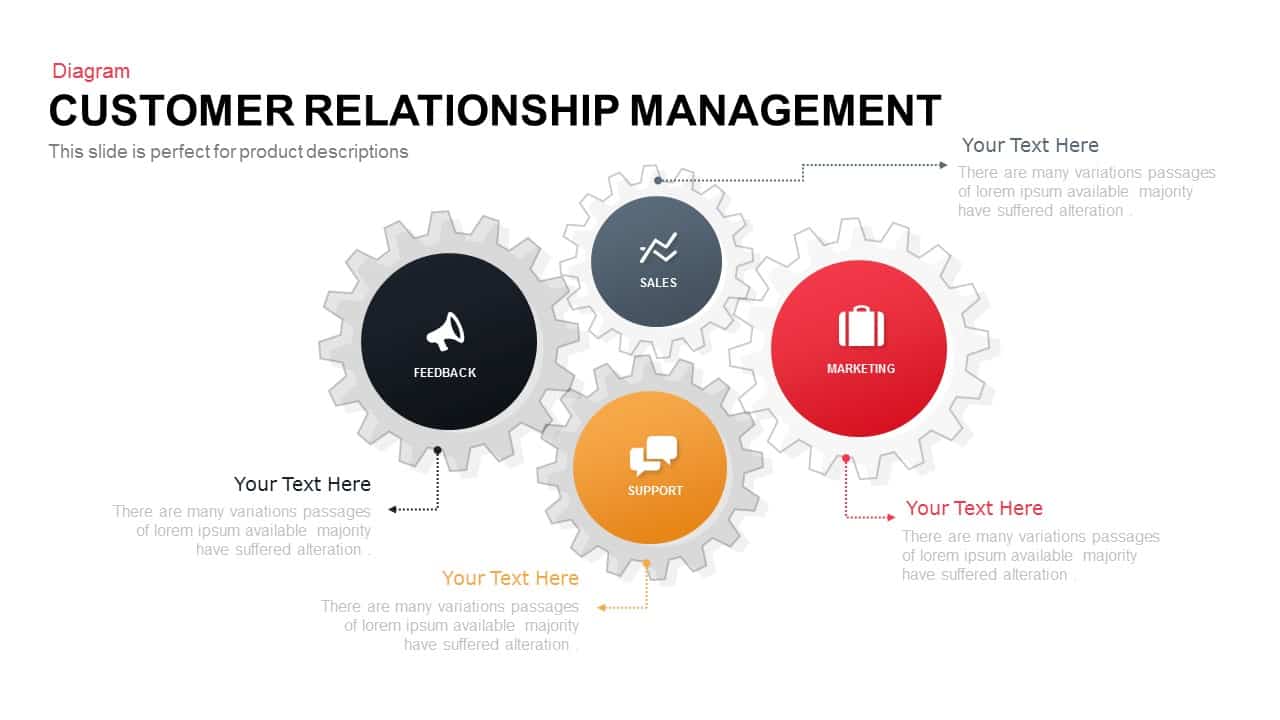
Customer Relationship Management PowerPoint Template
Business Models
Premium
-
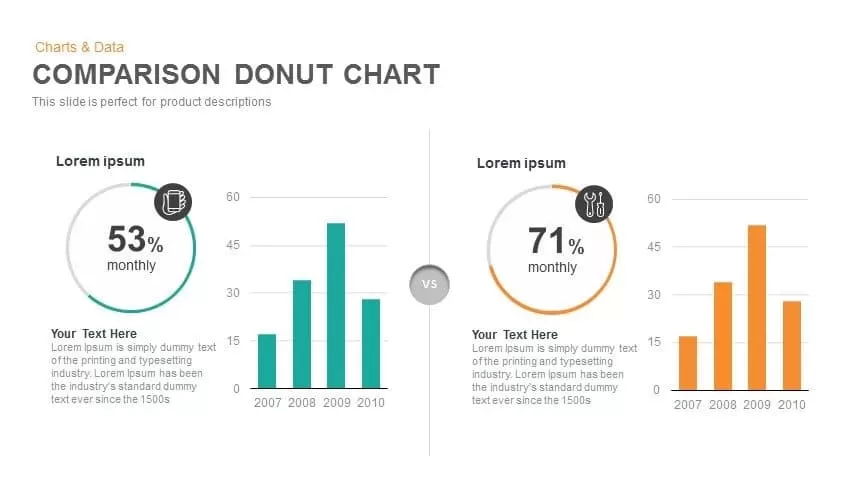
Comparison Donut Chart PowerPoint Template and Keynote
Keynote Templates
Premium
-
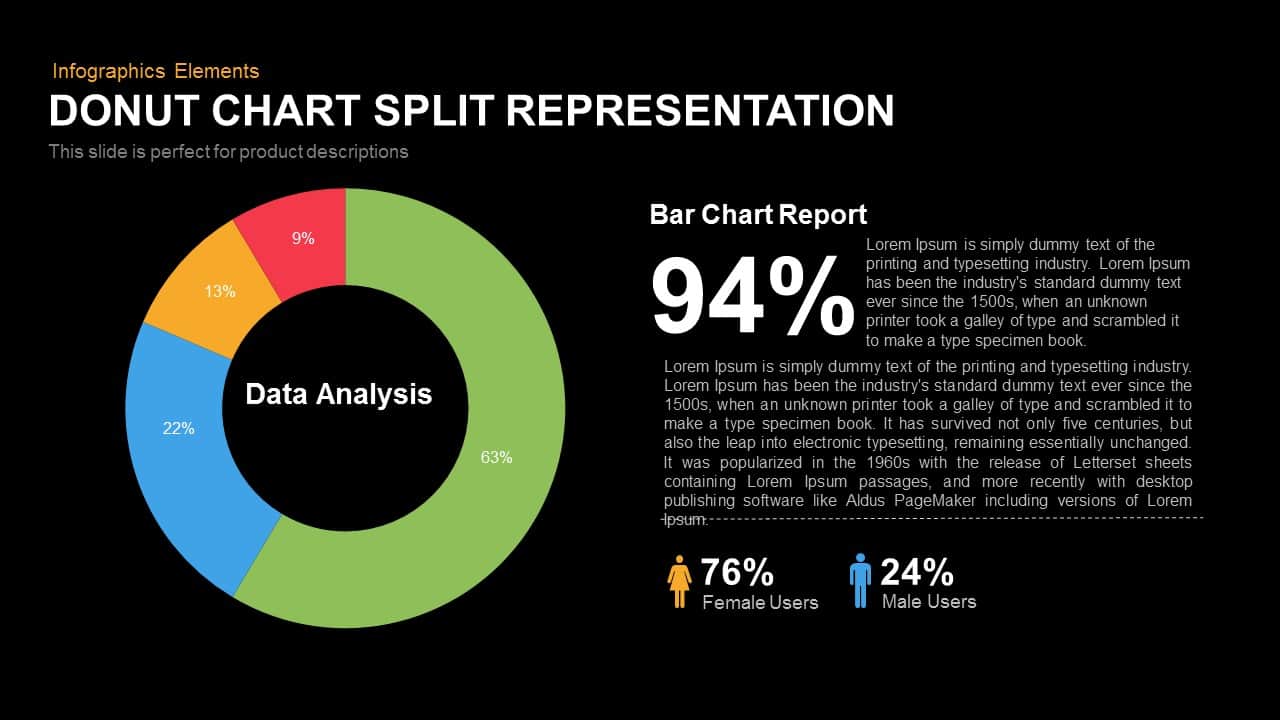
Split Representation Donut Chart Template for PowerPoint and Keynote
Keynote Templates
Premium