


Stacked Waterfall Chart PowerPoint Template
- Version
- Download 22
- File Size 0.00 KB
- File Count 1
- Create Date October 13, 2023
- Last Updated October 5, 2023
Stacked Waterfall Chart PowerPoint Template
Stacked Waterfall Chart for PowerPoint
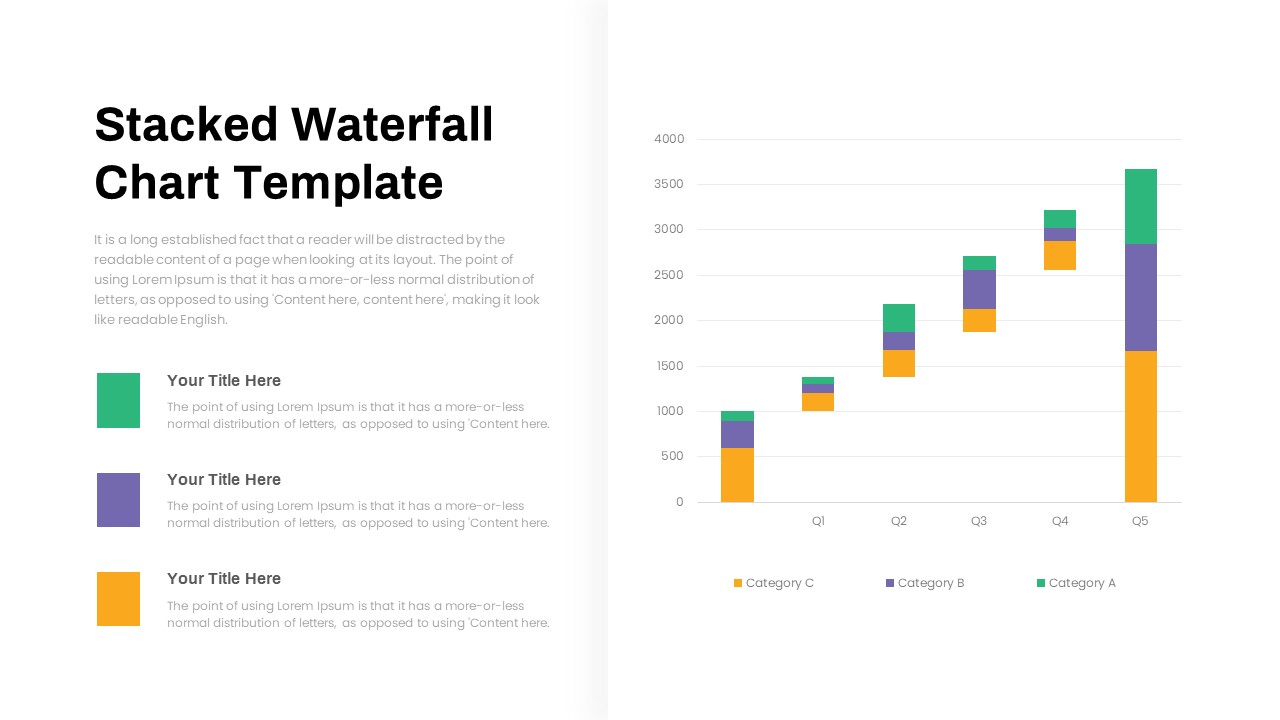
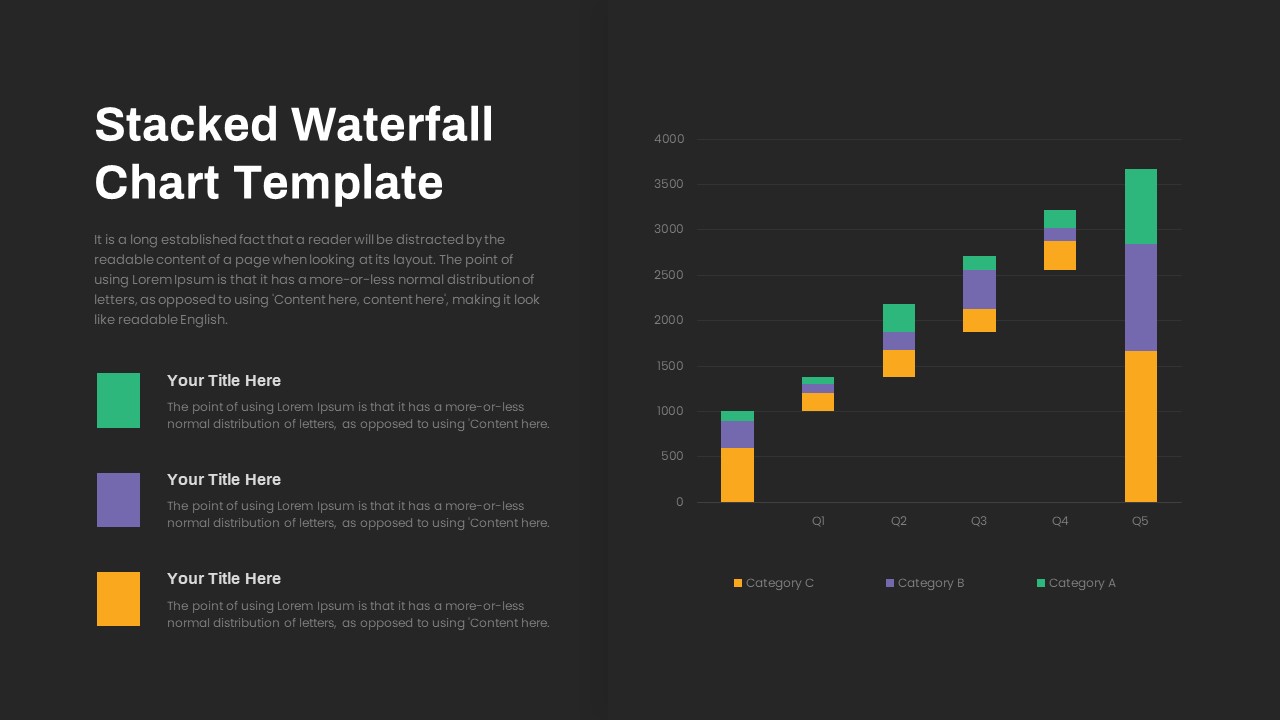
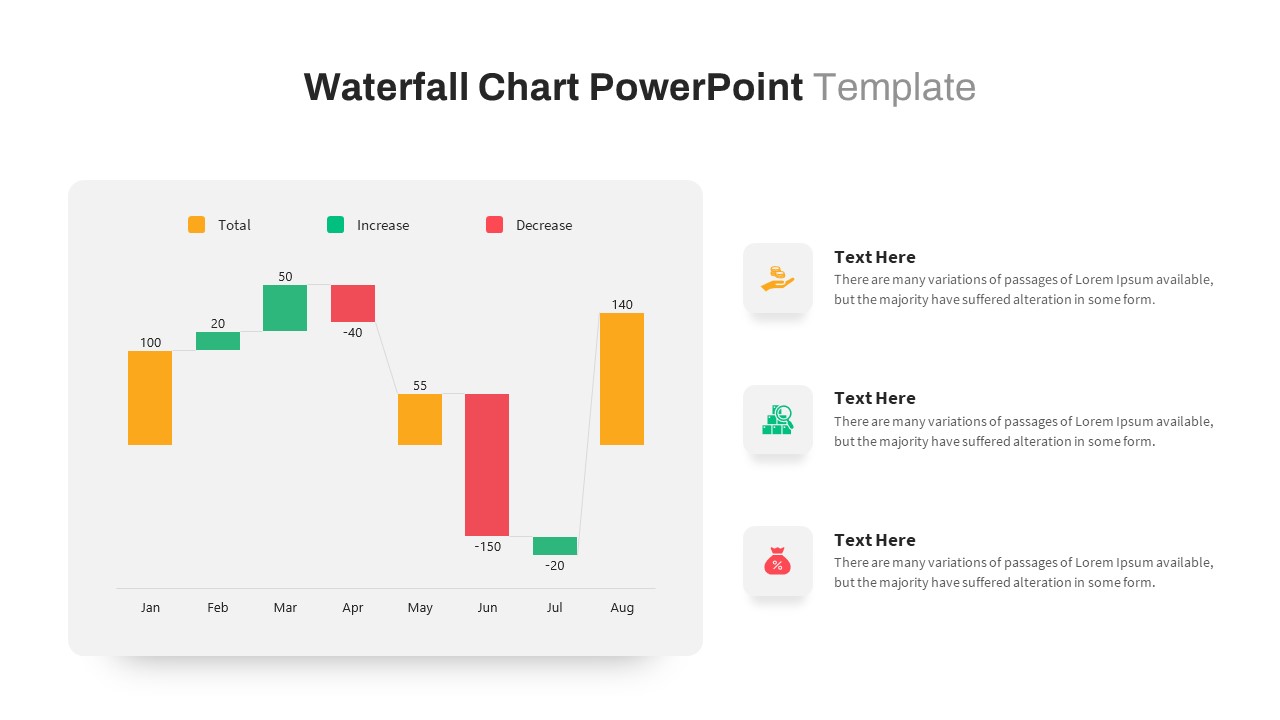
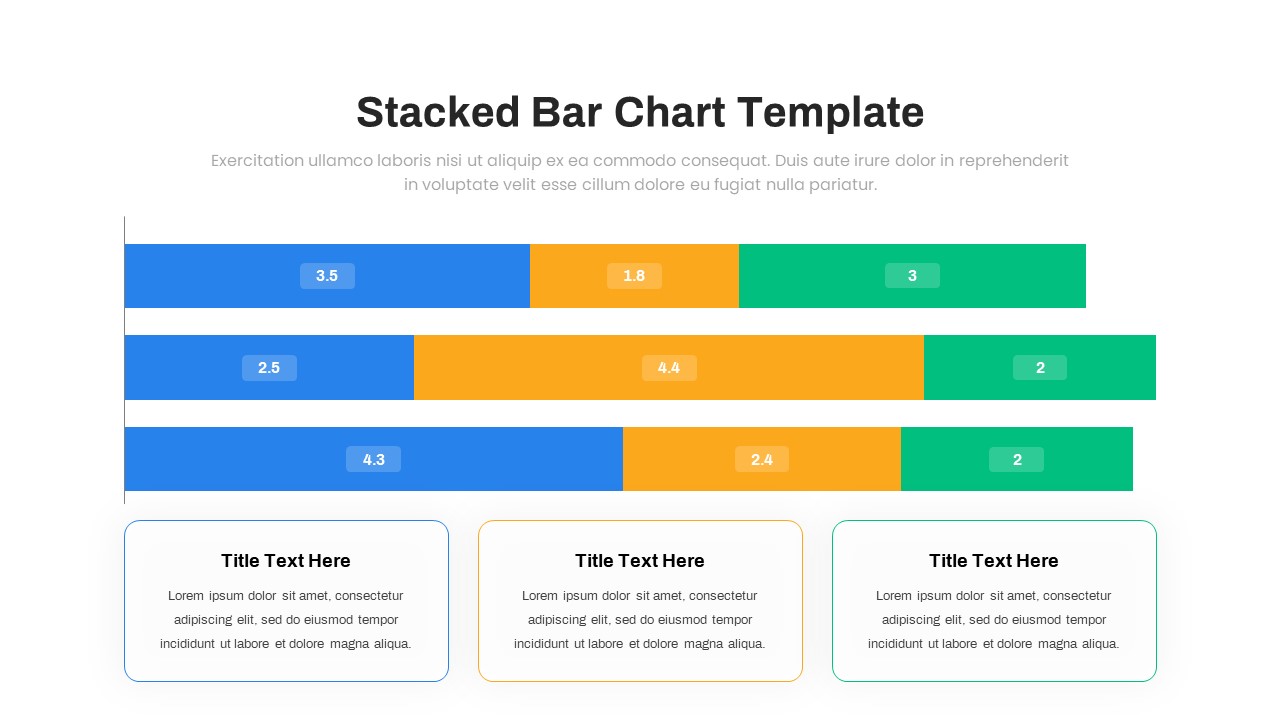
Stacked Waterfall Chart PowerPoint Template is commonly used to display the cumulative effect of sequentially introduced negative and positive values. However, our stacked waterfall chart presents a bar with three categories that enables the user to create a neutral value using the three color effects. The presenters can show three sets of data within a single bar. This is a financial data visualization so it can be used for multiple presentations.
Stacked waterfall charts are useful for showing how various factors or components contribute to a result. They help in understanding the breakdown of values and identifying which elements have the most significant impact.
Where do we see waterfall charts used?
The waterfall chart finds frequent application in the realm of human resources, where it illustrates changes in recruitment growth. Additionally, it is a prevalent tool within the financial sector, depicting credits, debits, gains, and losses throughout a specific time frame. Furthermore, industries heavily reliant on tracking ongoing account or subscription numbers, as well as the associated revenue, commonly employ this chart format as a fundamental aspect of their operations.
Stacked Waterfall Chart for PowerPoint has multiple uses across different sectors. It can be used for financial reporting to visualize revenue streams, expenses, and net income. It is generally used in project management to highlight project costs and budget breakdowns. Besides, the stacked waterfall PowerPoint chart helps to display sales performance, marketing ROI, and customer acquisition cost. Besides, business analysis and investor presentation could be managed by a narrative stacked waterfall chart.
So, financial analysts, business consultants, executives and managers, and sales and marketing teams can use it according to their specific needs.
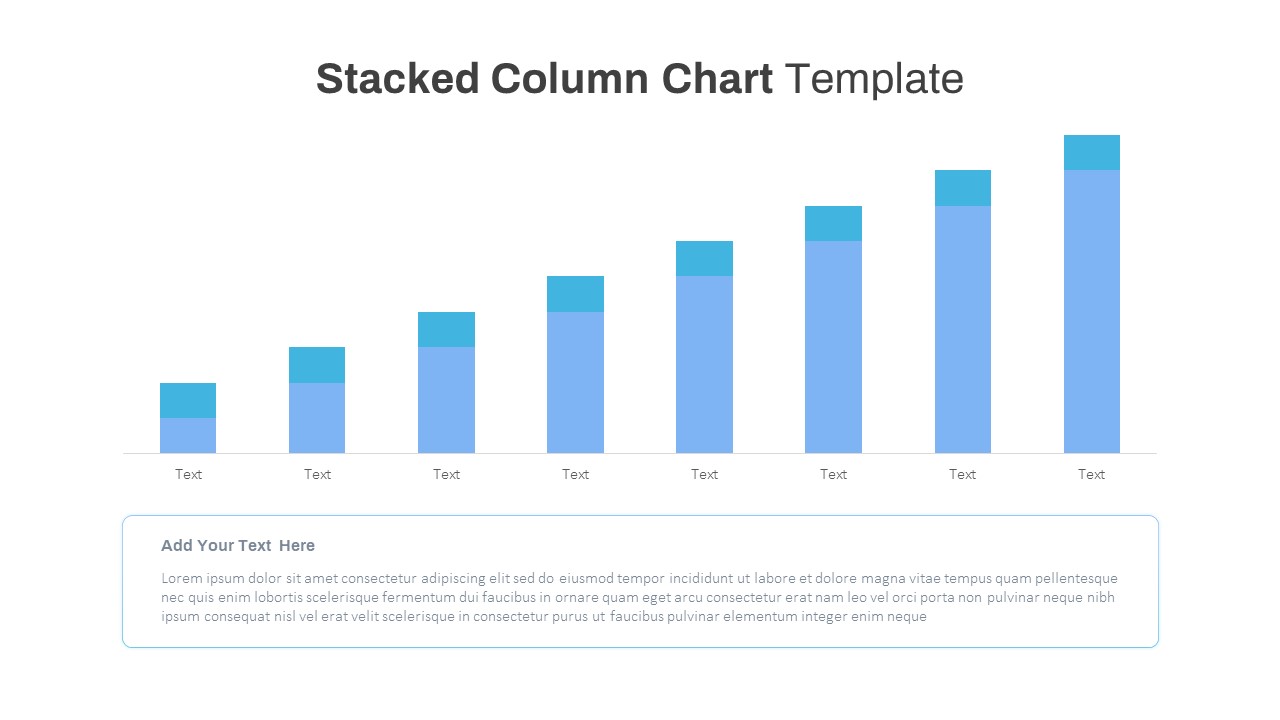
The stacked waterfall chart PowerPoint slide shows differently sized bars in three divisions. Each division of the bar has been colored green on the top, violet in the middle, and yellow on the bottom. The presenters can use this colorful bar to show the individual values of the data. The top of each column (green part) represents the running total of all the previous values in that category.
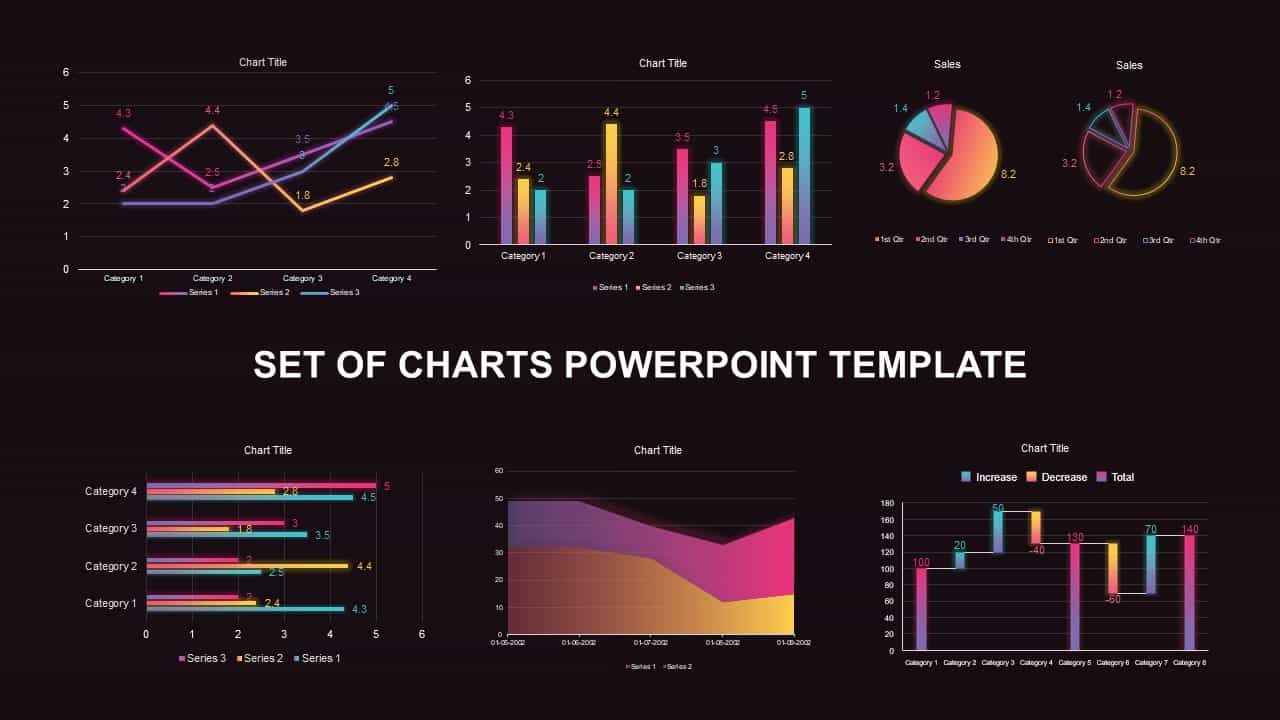
Alternatively, go with our category of PowerPoint graphs & charts!
Attached Files
| File | Action |
|---|---|
| https://premiumdownloads.s3.amazonaws.com/SB03772-Stacked Waterfall Chart PowerPoint Template.ZIP | Download |
Login to download this file
Add to favorites
Add to collection
-

Item ID
SB03772 -

Related Templates
-

Free Nursing Capstone PowerPoint Deck
PowerPoint Templates
Free
-

Nature PowerPoint Presentation Template
PowerPoint Business Templates
Premium
-

Sales Deck Free PowerPoint Template
PowerPoint Templates
Free
-

Cab Service PowerPoint Template
PowerPoint Templates
Premium
-

Research Proposal PowerPoint Template
PowerPoint Templates
Premium
-

Gym PowerPoint Template
PowerPoint Templates
Premium
-

Free Vertical PowerPoint Template
PowerPoint Business Templates
Free
-

Free Physical Education PowerPoint Template Deck
Free PowerPoint Templates
Free
-

Free Space Minimal Deck Template
PowerPoint Templates
Free
-

VET Clinic PowerPoint Template
PowerPoint Templates
Premium
-

Travel Agency PowerPoint Template
PowerPoint Templates
Premium
-

IoT Presentation Template
PowerPoint Templates
Premium
-

Effective Communication PowerPoint Template
PowerPoint Templates
Premium
-

PowerPoint Quiz With Timer
PowerPoint Templates
Premium
-
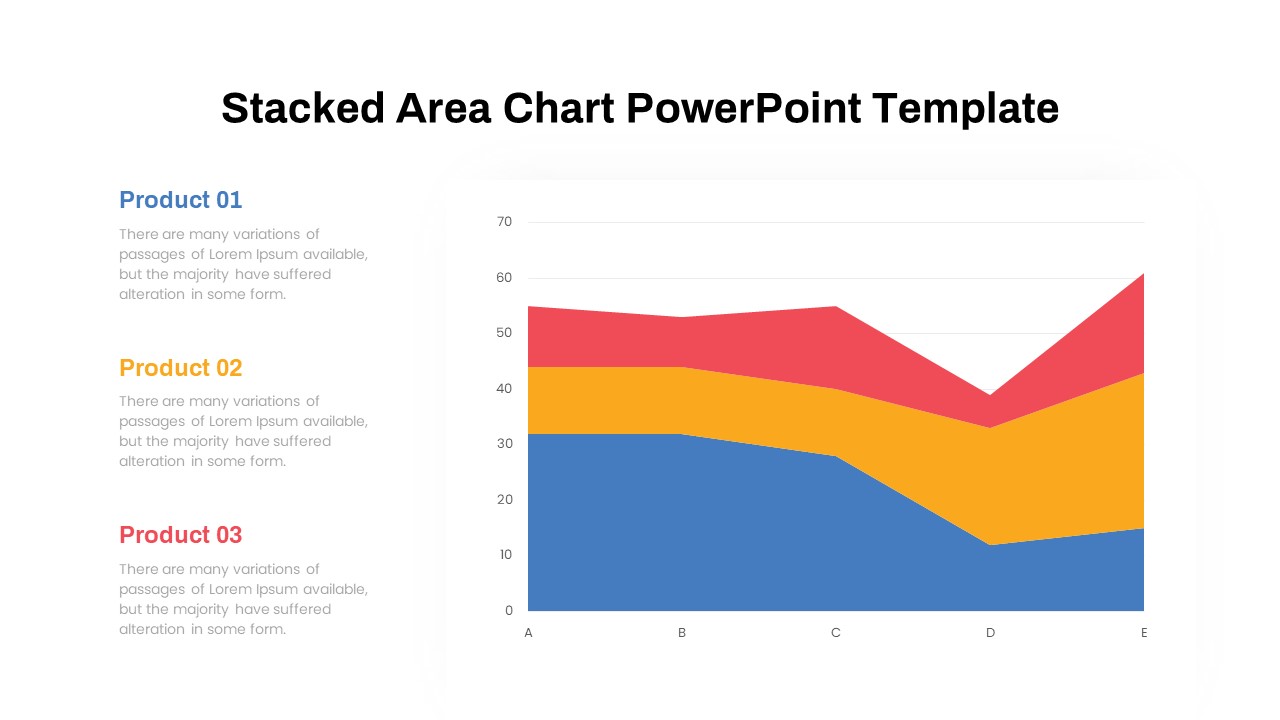
Stacked Area Chart PowerPoint Template
PowerPoint Charts
Premium
-
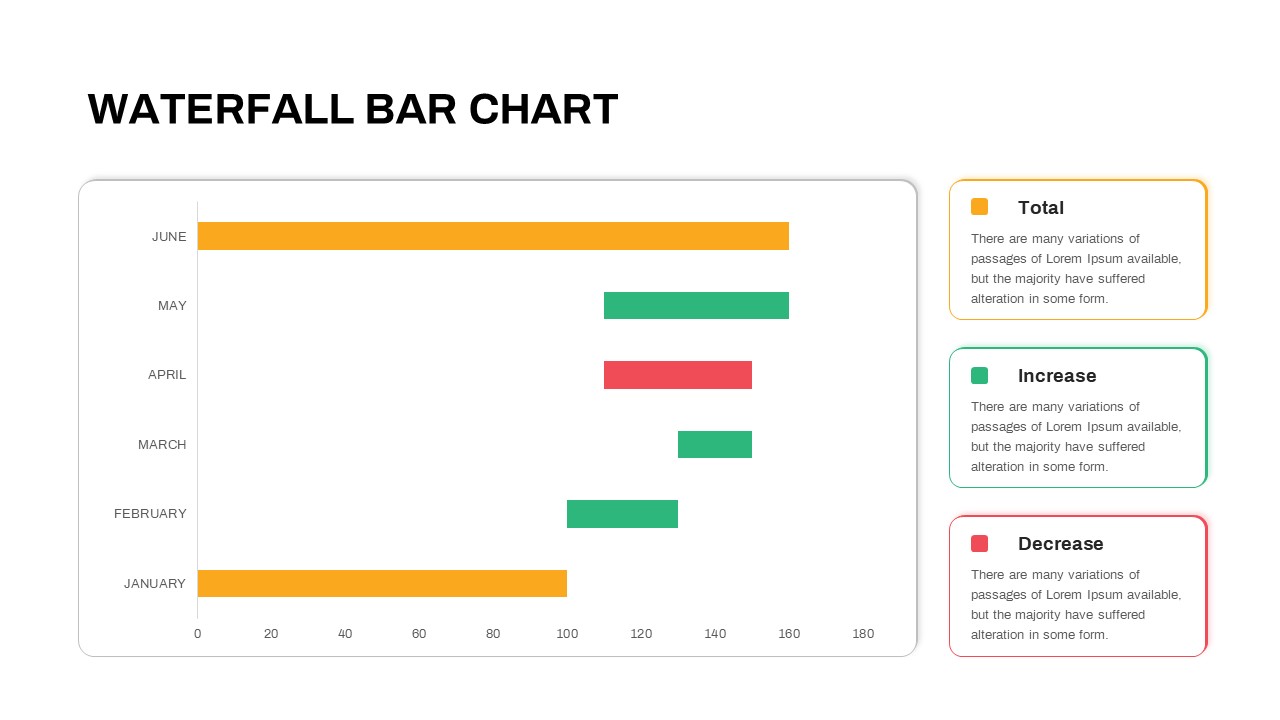
Waterfall Bar Chart PowerPoint Template
PowerPoint Charts
Premium
-

Graph Paper PowerPoint Template Deck
PowerPoint Templates
Premium
-
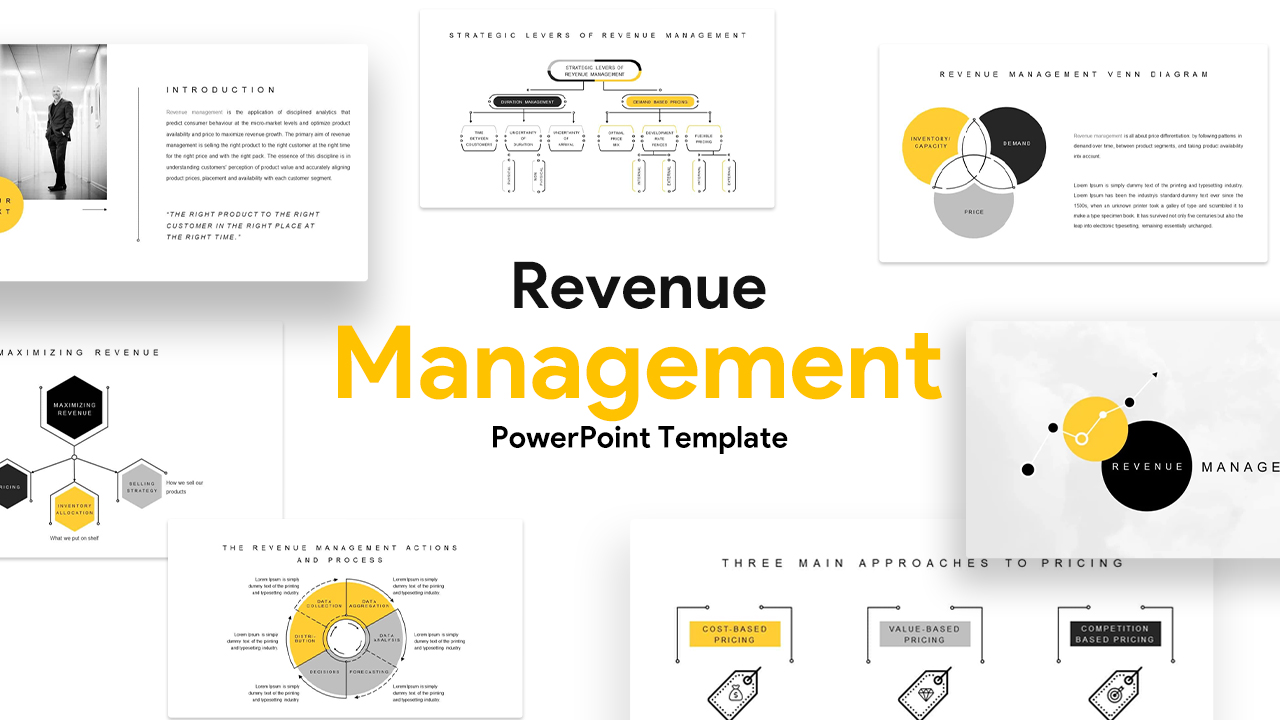
Revenue Management Templates for PowerPoint & Keynote
Business Models
Premium
-

Annual Report PowerPoint Template and Keynote
PowerPoint Templates
Premium
-

Free Economics PowerPoint Template
Free PowerPoint Templates
Free
-

Free Charity PowerPoint Template Deck
PowerPoint Templates
Free
-

Macroeconomics PowerPoint Template
PowerPoint Templates
Premium
-

Free Aviation PowerPoint Template
Free PowerPoint Templates
Free
-
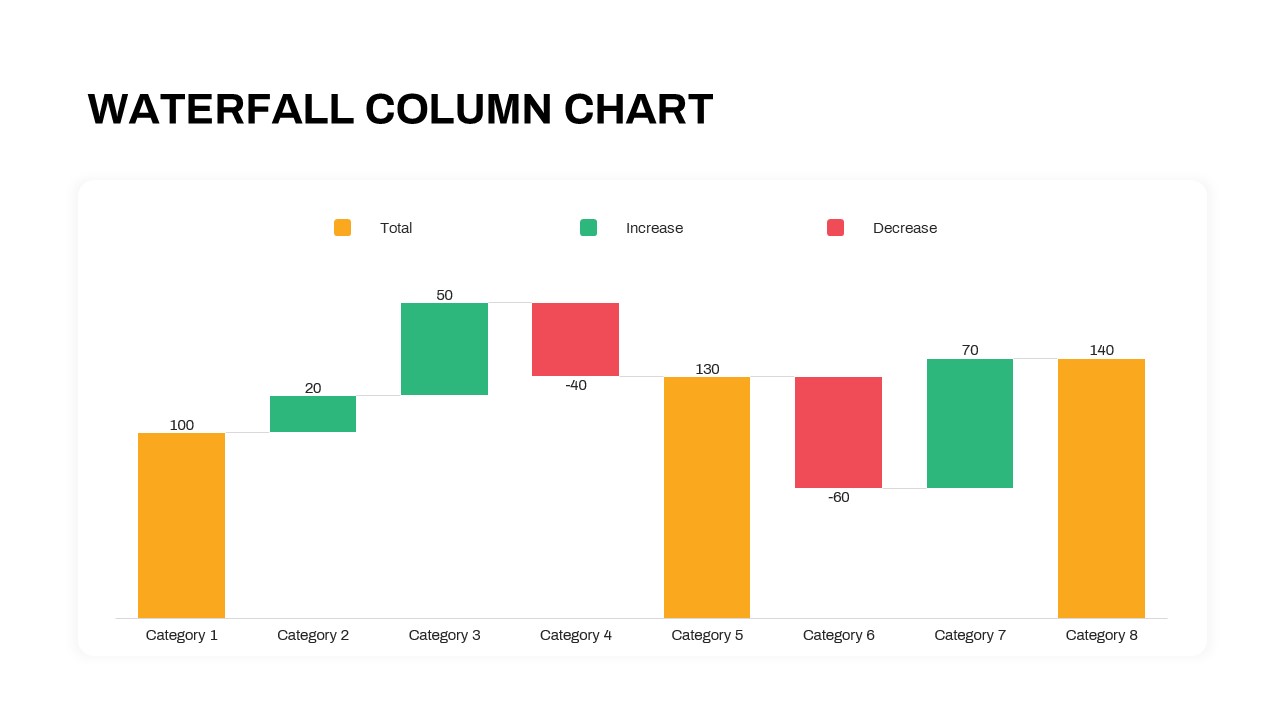
Waterfall Column Chart PowerPoint Template
Column and Bar chart
Premium
-

Creative Bar Chart Data Analysis PowerPoint Template and Keynote
Infographic
Premium
-

Customer Experience Loyalty PowerPoint Deck Template
PowerPoint Templates
Premium
-
Waterfall Chart PowerPoint Template
PowerPoint Charts
Premium
-

Mekko Chart Template
PowerPoint Templates
Premium
-

Free Army PowerPoint Template
PowerPoint Templates
Free
-

Free Real Estate Listing PowerPoint Template
Free PowerPoint Templates
Free
-

Free Cartoon PowerPoint Template
Free PowerPoint Templates
Free
-

Animated Agriculture PowerPoint Deck Template
PowerPoint Templates
Premium
-
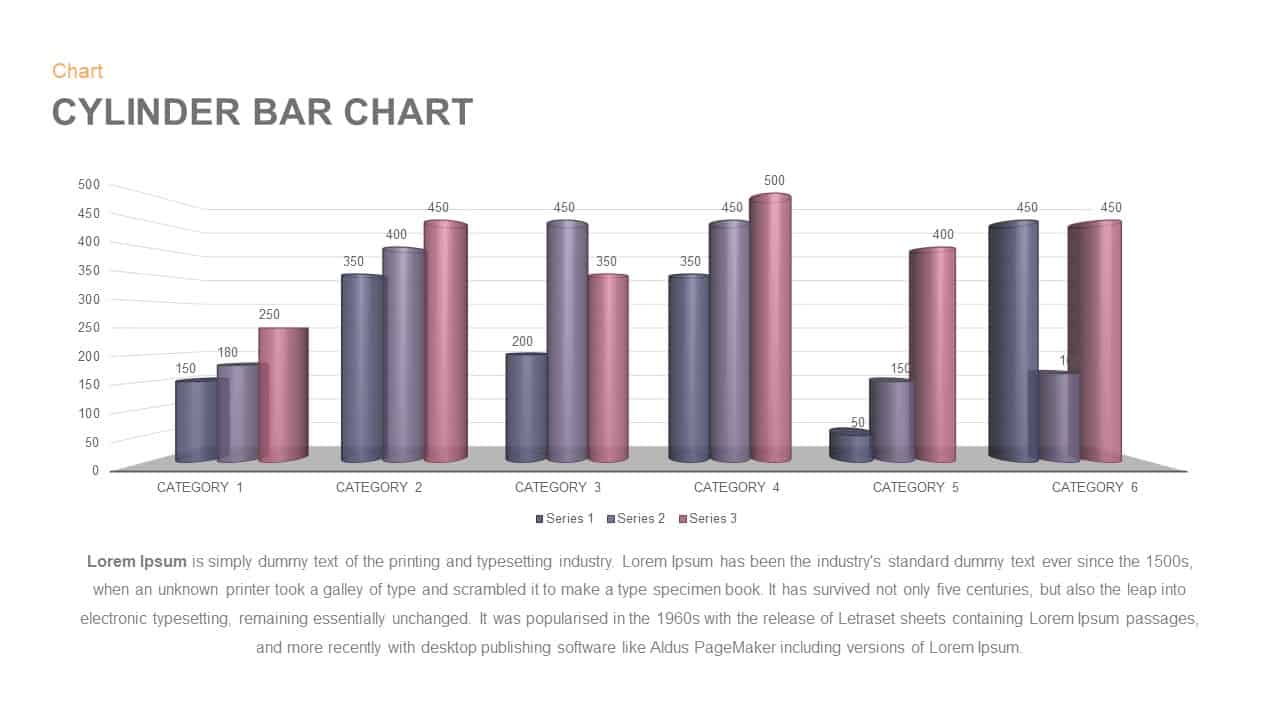
Cylinder Bar Chart PowerPoint Template and Keynote Slide
Column and Bar chart
Premium
-

Free University Presentation PowerPoint Template
PowerPoint Templates
Free
-

Free Event Planning PowerPoint Template
Free PowerPoint Templates
Free
-

Stakeholder Register PowerPoint Template
PowerPoint Templates
Premium
-
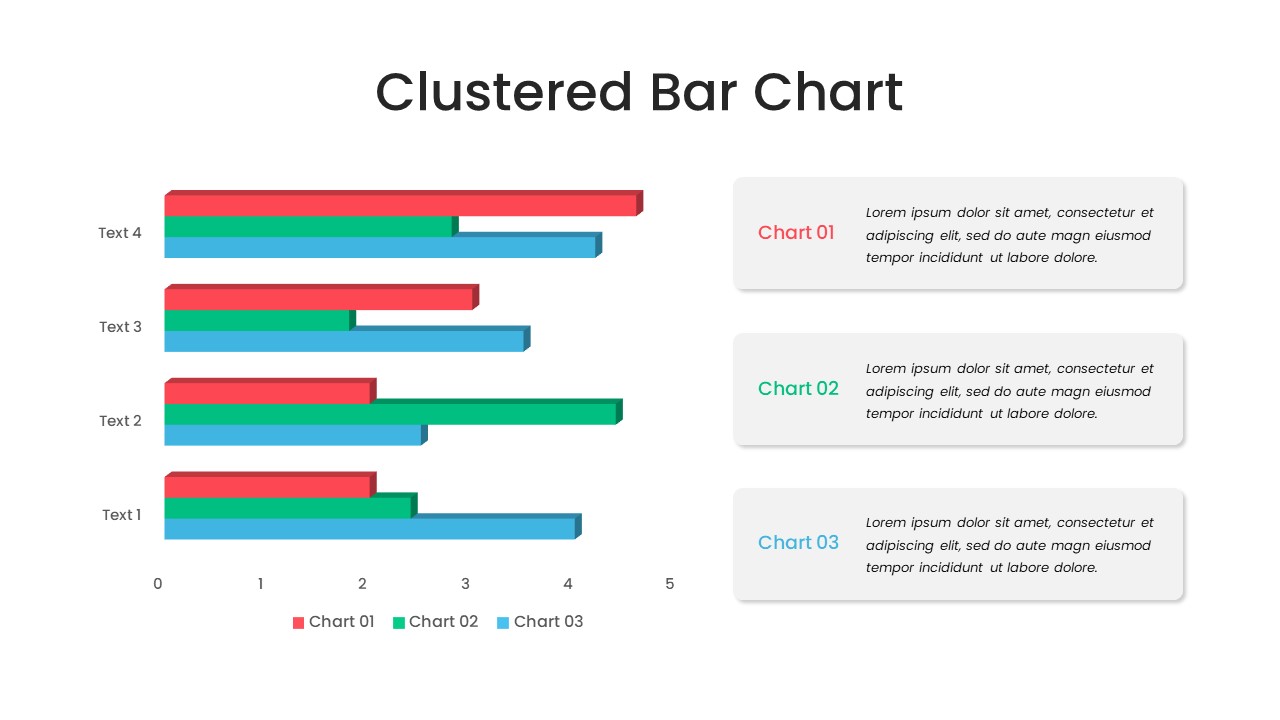
Clustered Bar Chart PowerPoint Template
Column and Bar chart
Premium
-
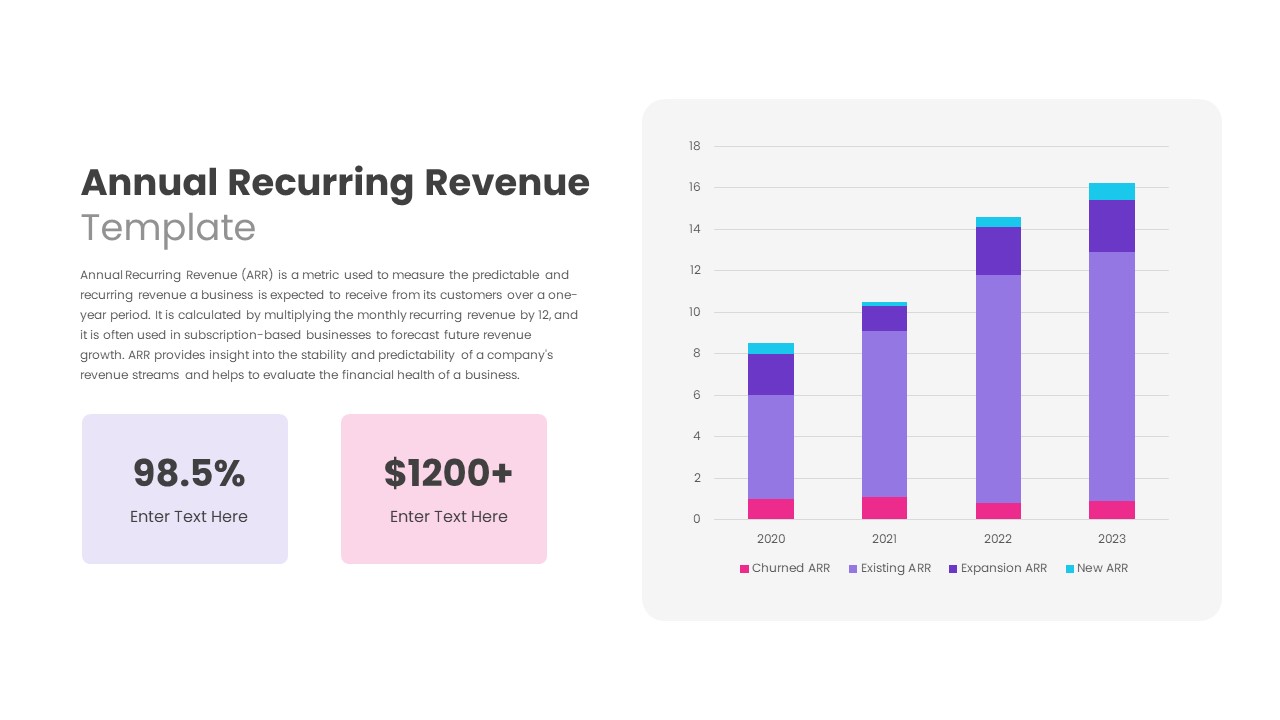
Annual Recurring Revenue PowerPoint Template
PowerPoint Templates
Premium
-

Free Book Review PowerPoint Template
Free PowerPoint Templates
Free
-
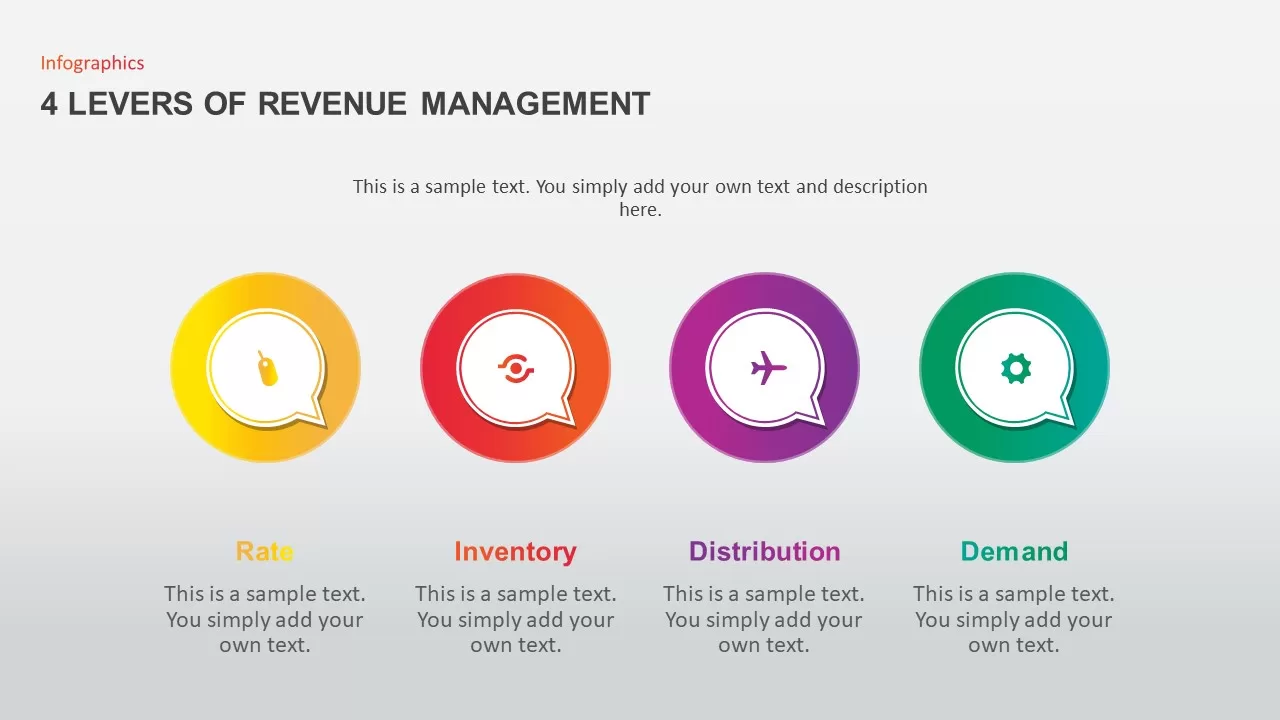
4 levers of Revenue Management PowerPoint Template
Infographic
Premium
-
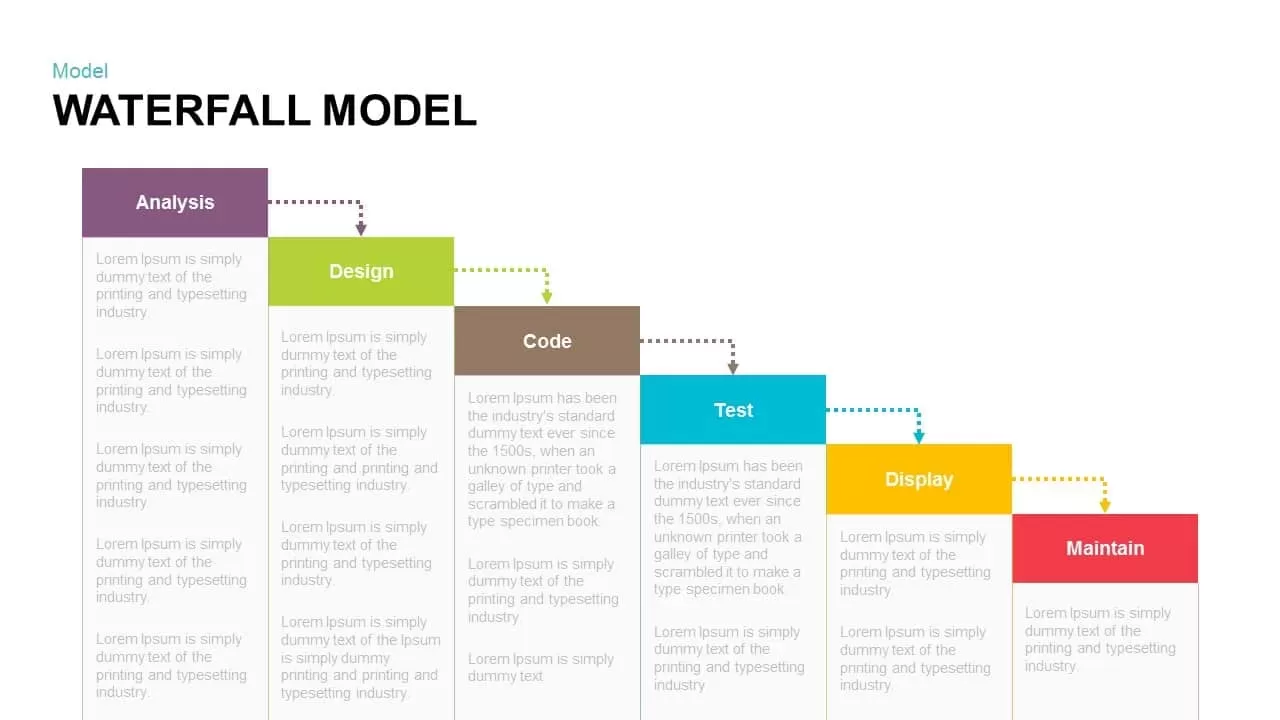
Waterfall Model PowerPoint Template and Keynote Slide
Business Models
Premium
-

Global Warming Infographic PowerPoint Template Deck
PowerPoint Templates
Premium
-

Radial Bar Chart PowerPoint Templates and Keynote Slides
PowerPoint Charts
Premium
-

Pencil Bar Chart PowerPoint Template and Keynote Slide
Column and Bar chart
Premium
-

Animated Clustered Bar Chart PowerPoint Template
PowerPoint Charts
Premium
-

Clustered Column Chart PowerPoint Template
PowerPoint Charts
Premium
-

Data Science PowerPoint Template
PowerPoint Templates
Premium
-
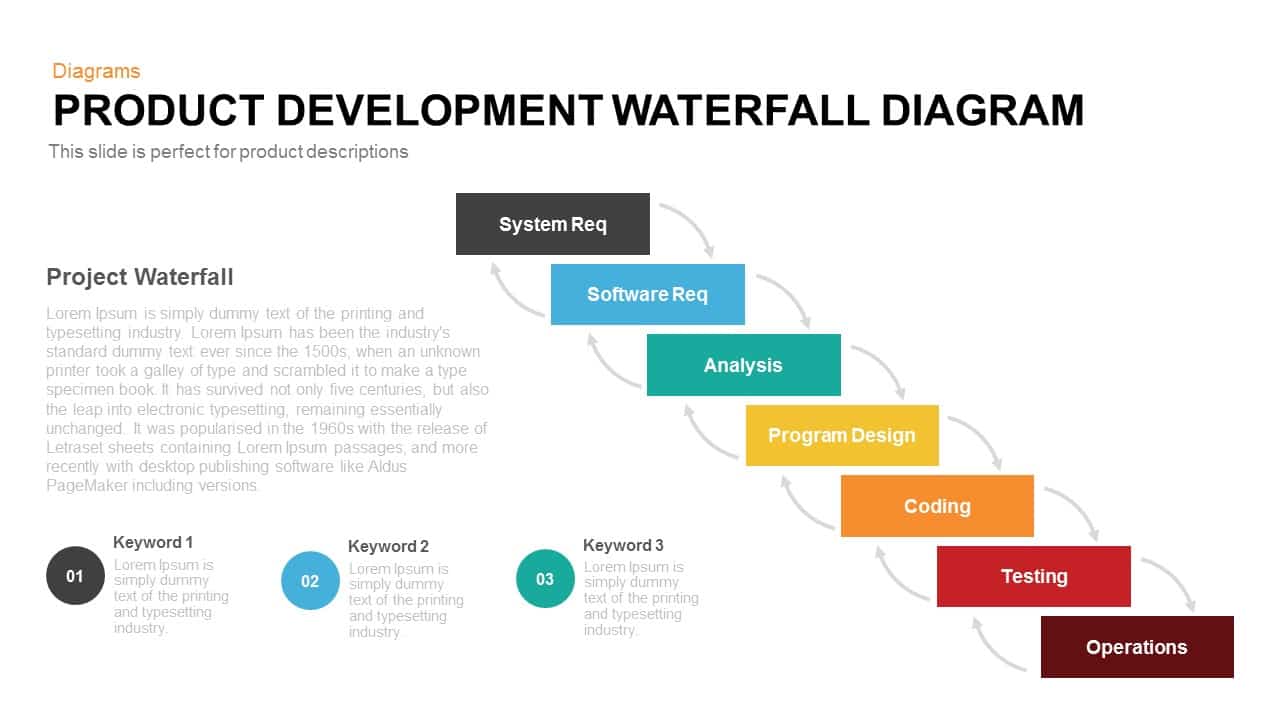
Product Development Waterfall Model Diagram for PowerPoint and Keynote
Diagrams
Premium
-
Animated Stacked Bar Chart PowerPoint Template
Column and Bar chart
Premium
-
Free Charts & Graphs Deck PowerPoint Template
PowerPoint Templates
Free
-
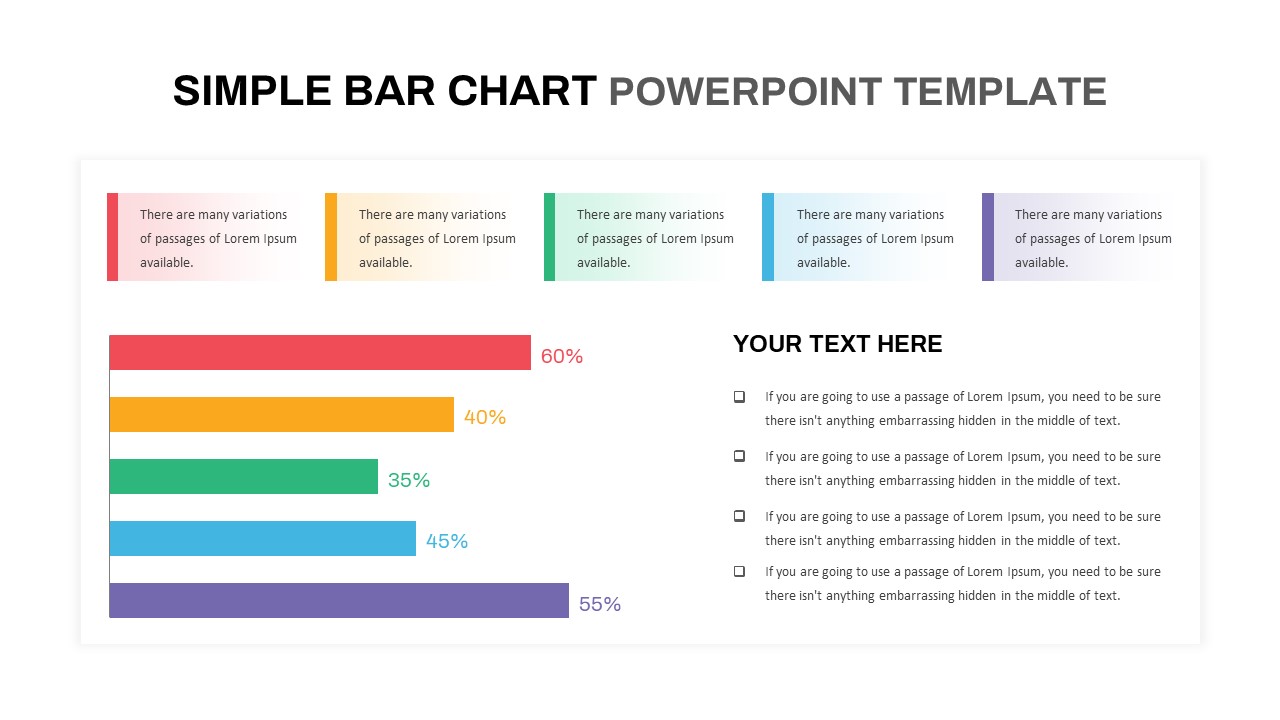
Simple Bar Chart PowerPoint Template
Column and Bar chart
Premium
-
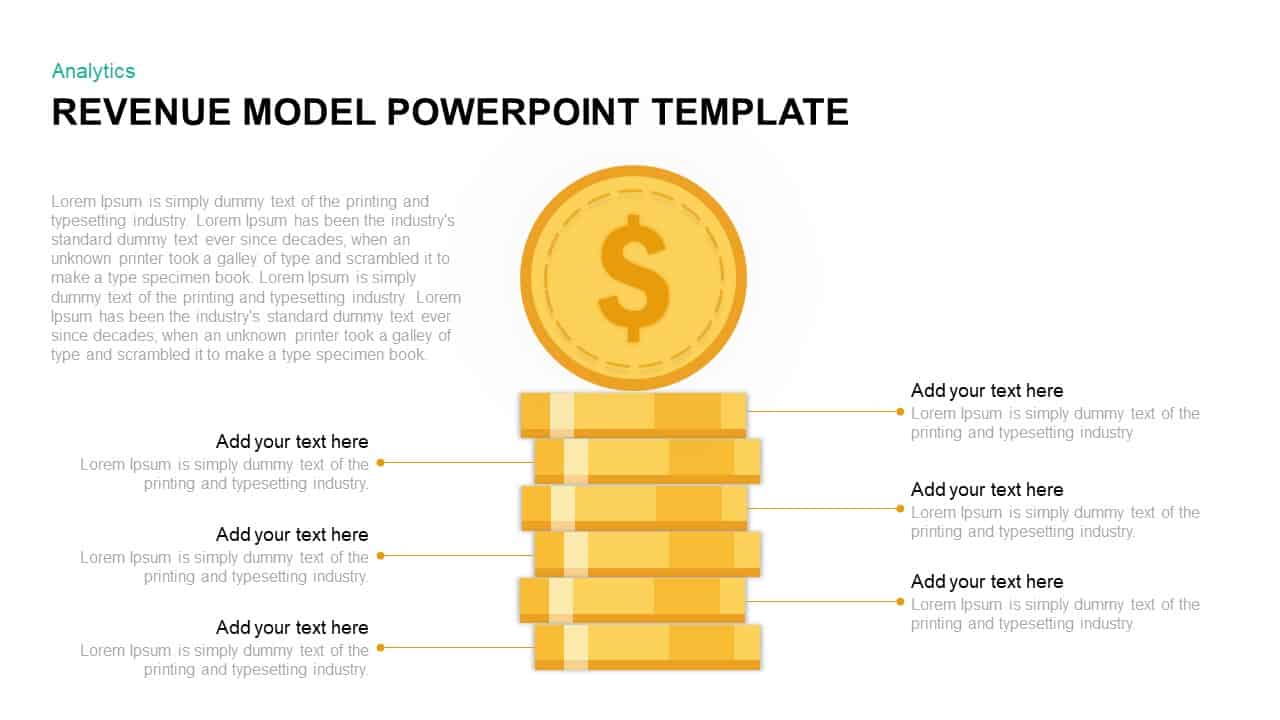
Revenue Model Template for PowerPoint & Keynote
Business Models
Premium
-

Free Dunder Mifflin Paper Company Pitch Deck
Free PowerPoint Templates
Free
-

EFQM Model PowerPoint Template
PowerPoint Templates
Premium
-

Area Chart PowerPoint Template
PowerPoint Charts
Premium
-

Real Estate PowerPoint Theme
PowerPoint Themes
Premium
-
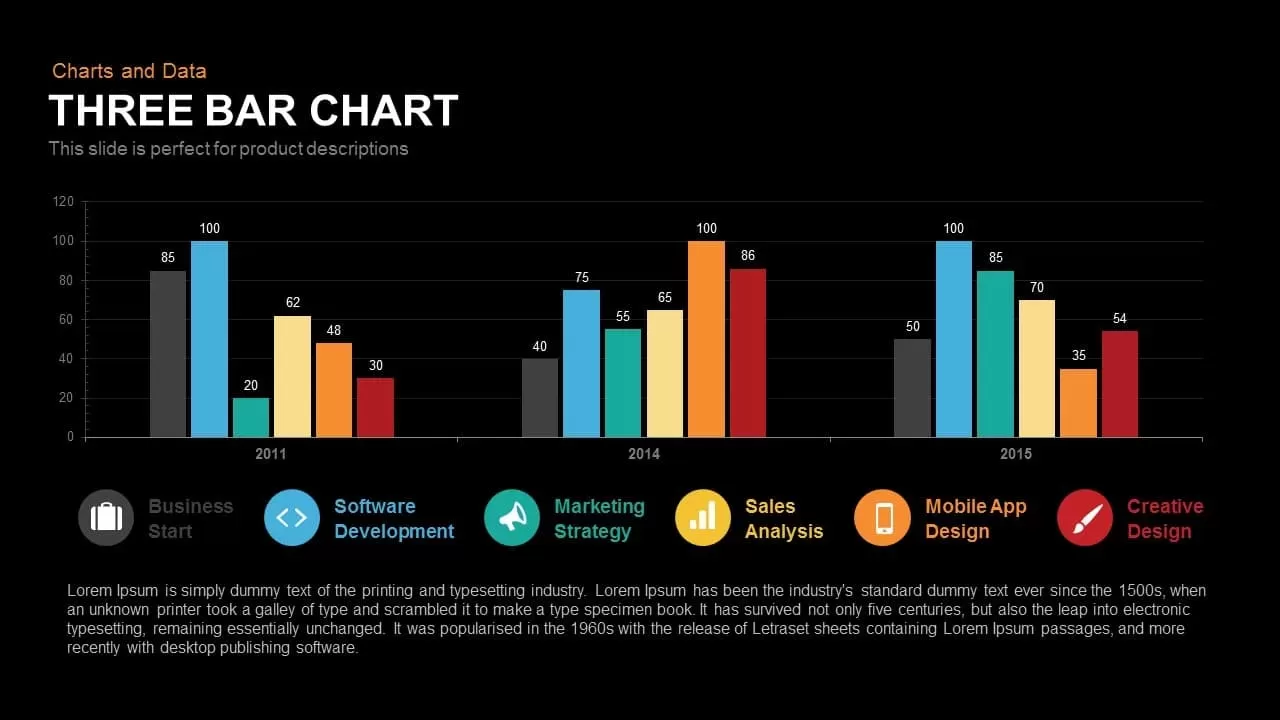
3 Bar Chart PowerPoint Template and Keynote Slide
Column and Bar chart
Premium
-
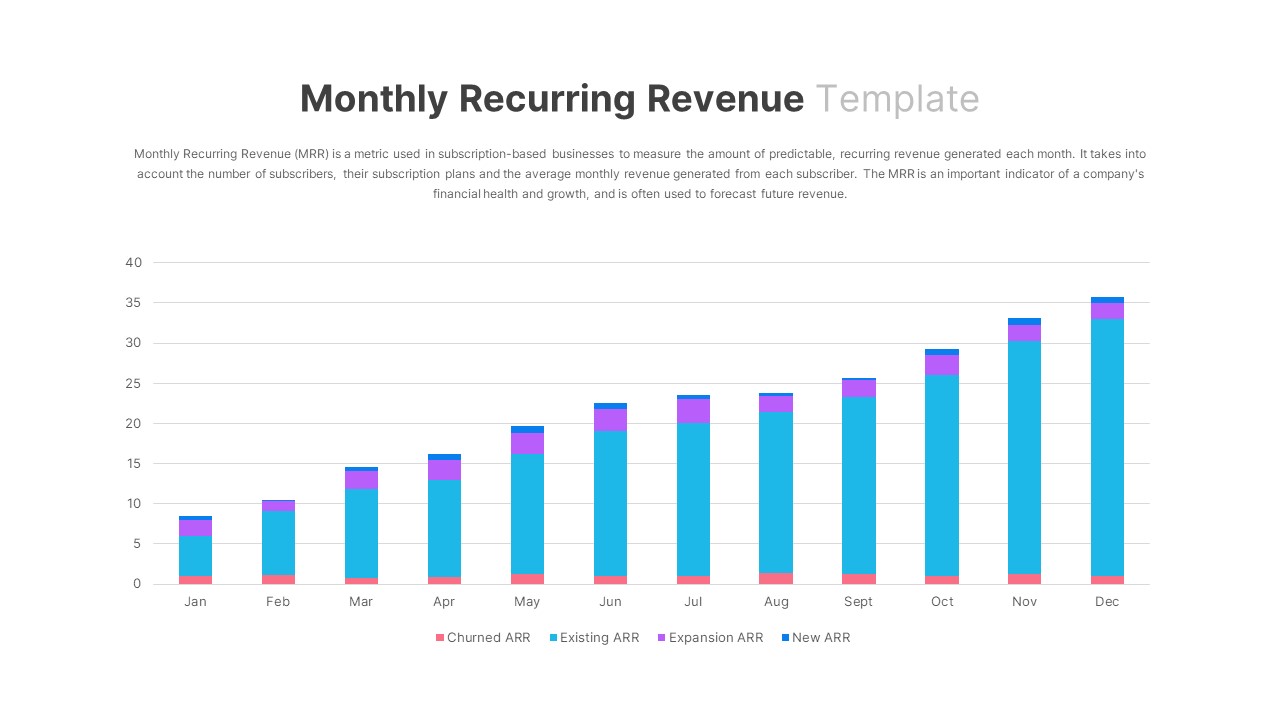
Monthly Recurring Revenue PowerPoint Template
PowerPoint Templates
Premium
-

Free Charts and Graphs PowerPoint Template
PowerPoint Templates
Free
-
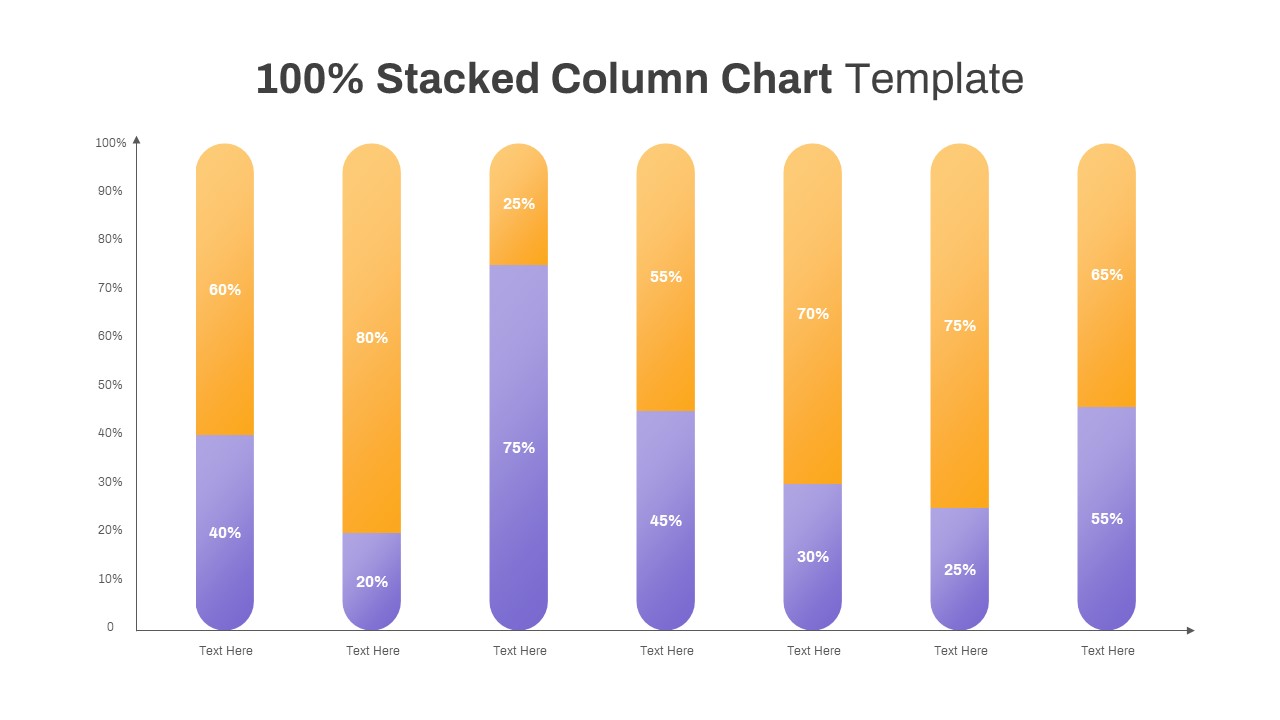
100% Stacked Column Chart PowerPoint Template
Column and Bar chart
Premium
-
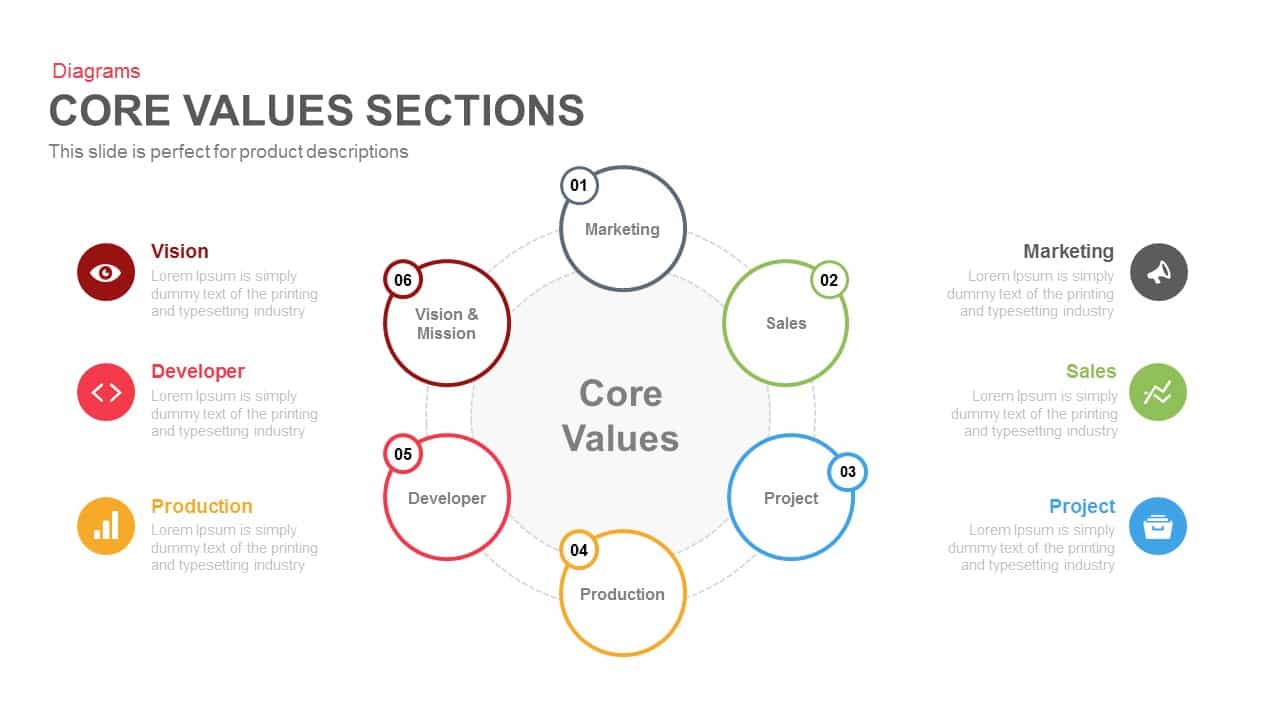
Core Values Sections PowerPoint Template and Keynote
Business Models
Premium
-
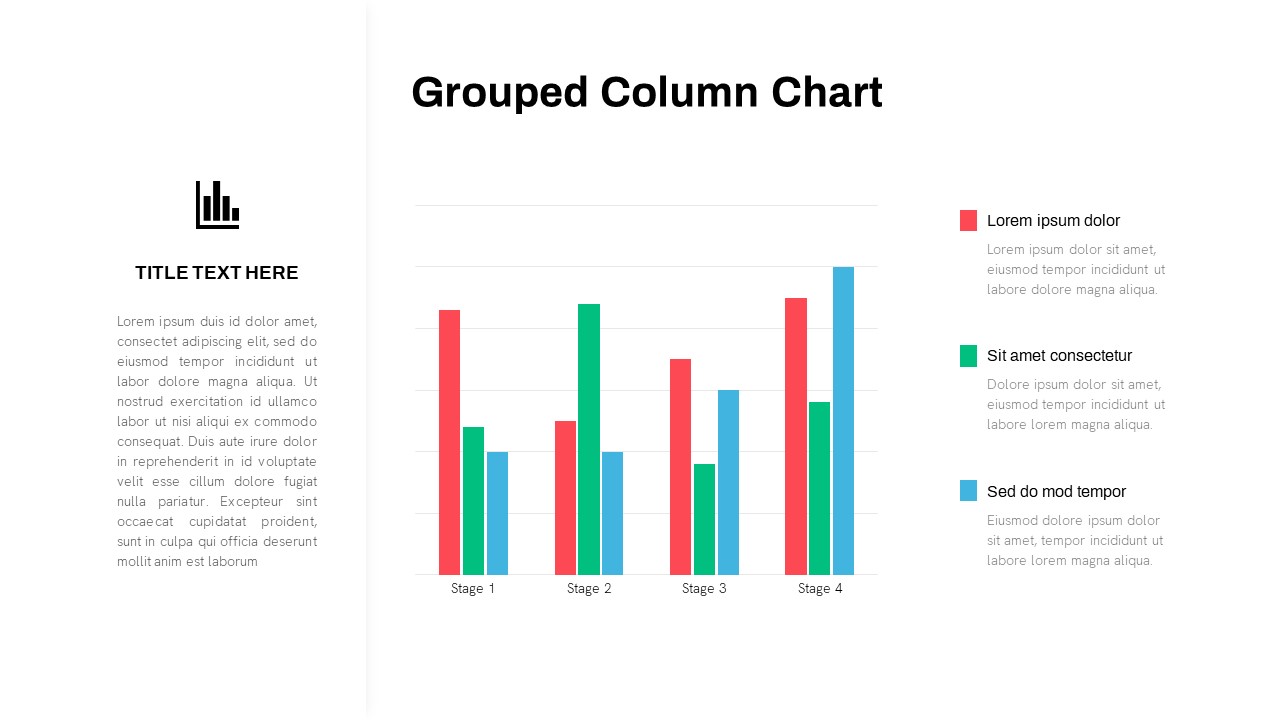
Grouped Column Chart PowerPoint Template
Column and Bar chart
Premium
-
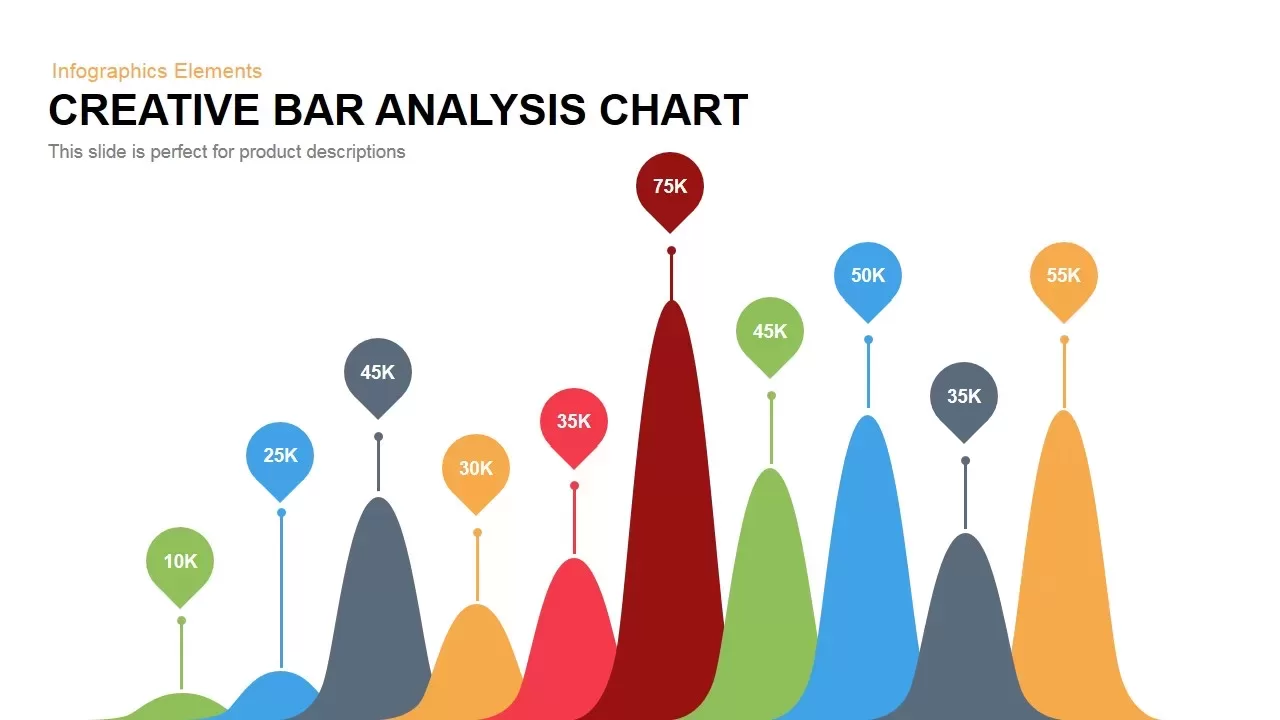
Creative Bar Chart Analysis PowerPoint Template and Keynote
Column and Bar chart
Premium
-
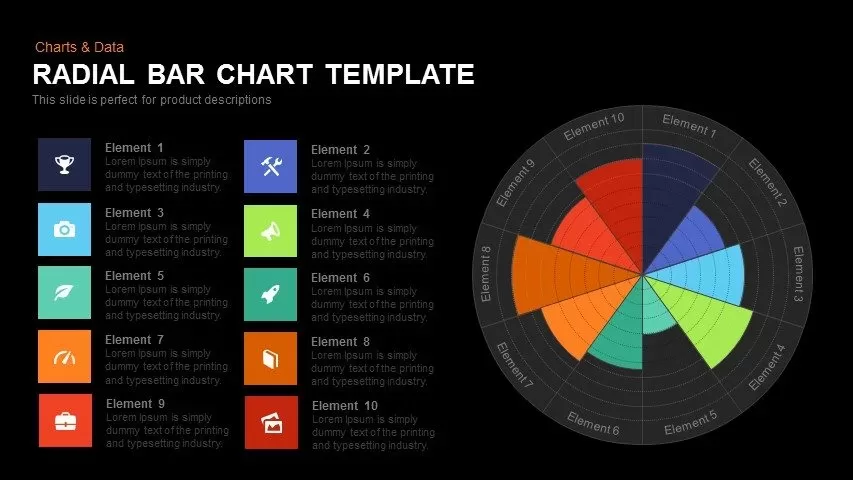
Radial Bar Chart Template for PowerPoint and Keynote
Circular Diagrams
Premium
-
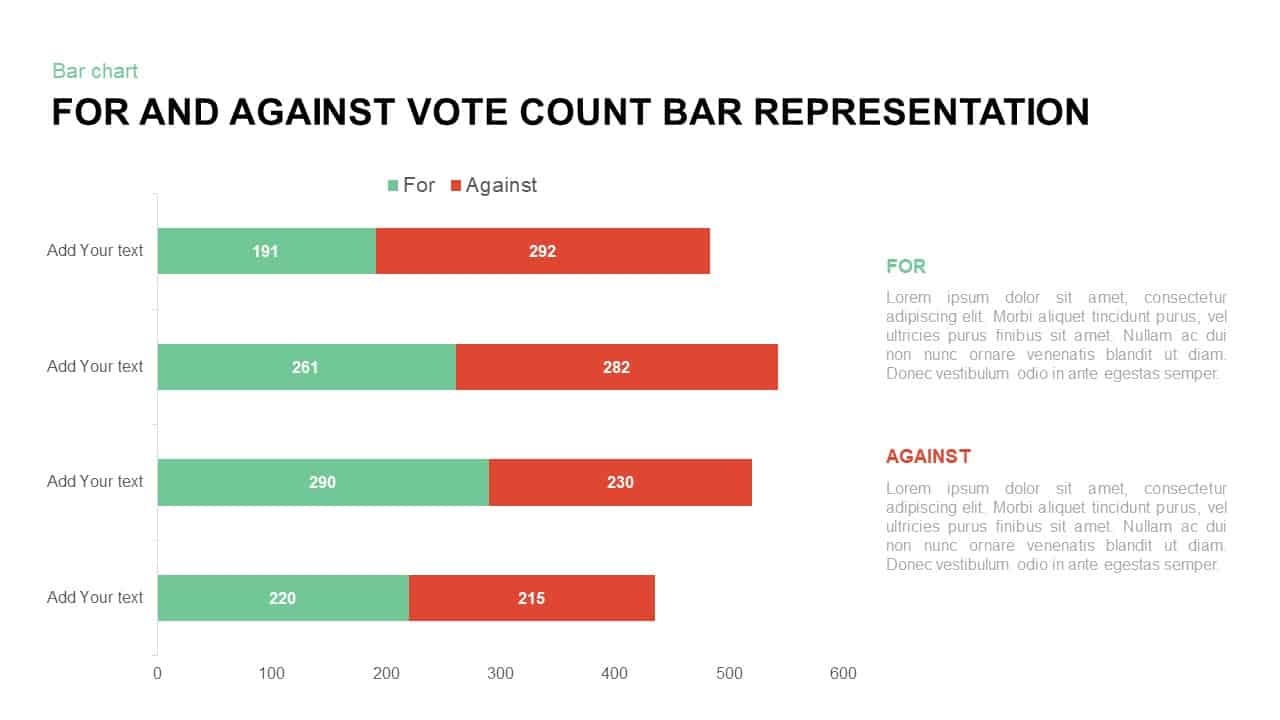
For and Against Vote Count Bar Chart for PowerPoint Presentation
Column and Bar chart
Premium
-
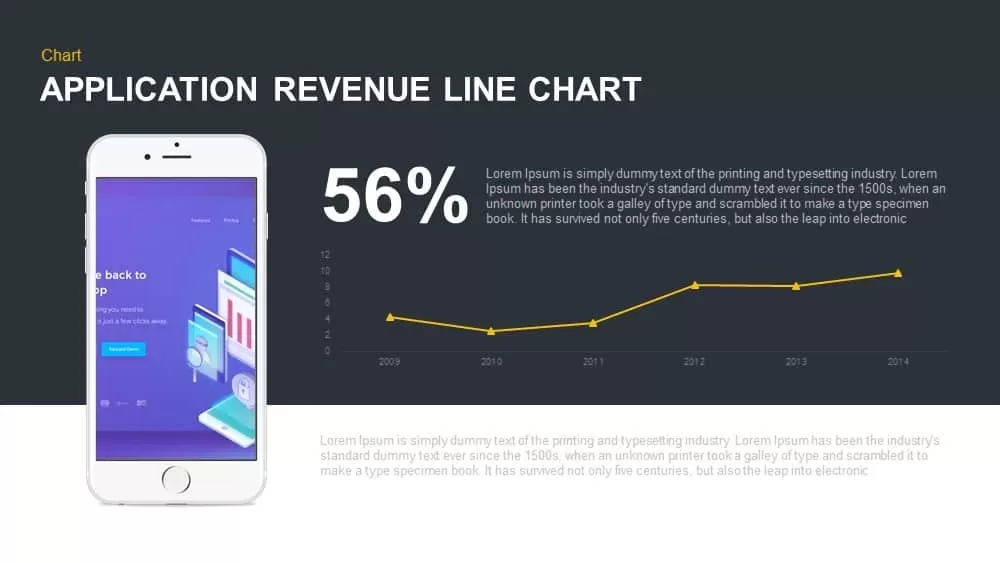
Application Revenue Line Chart PowerPoint Template and Keynote
Keynote Templates
Premium
-
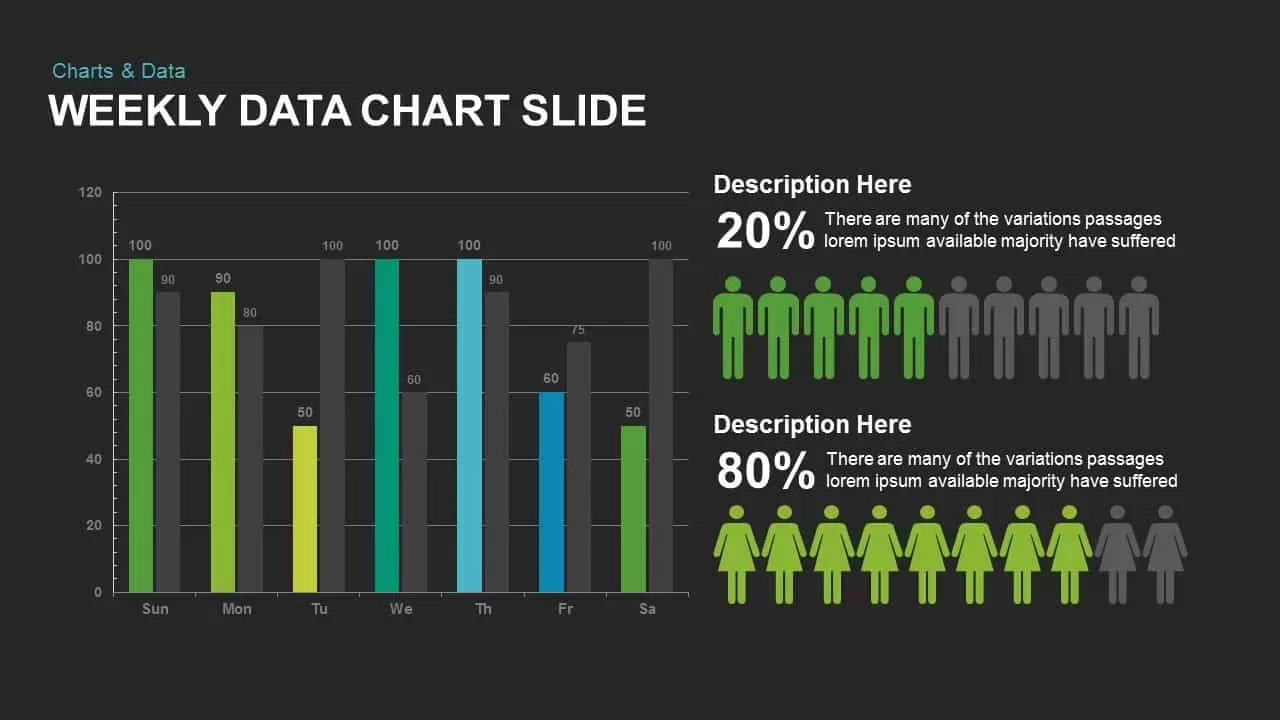
Weekly Data Charts PowerPoint Presentation Template and Keynote Slide
Infographic
Premium
-
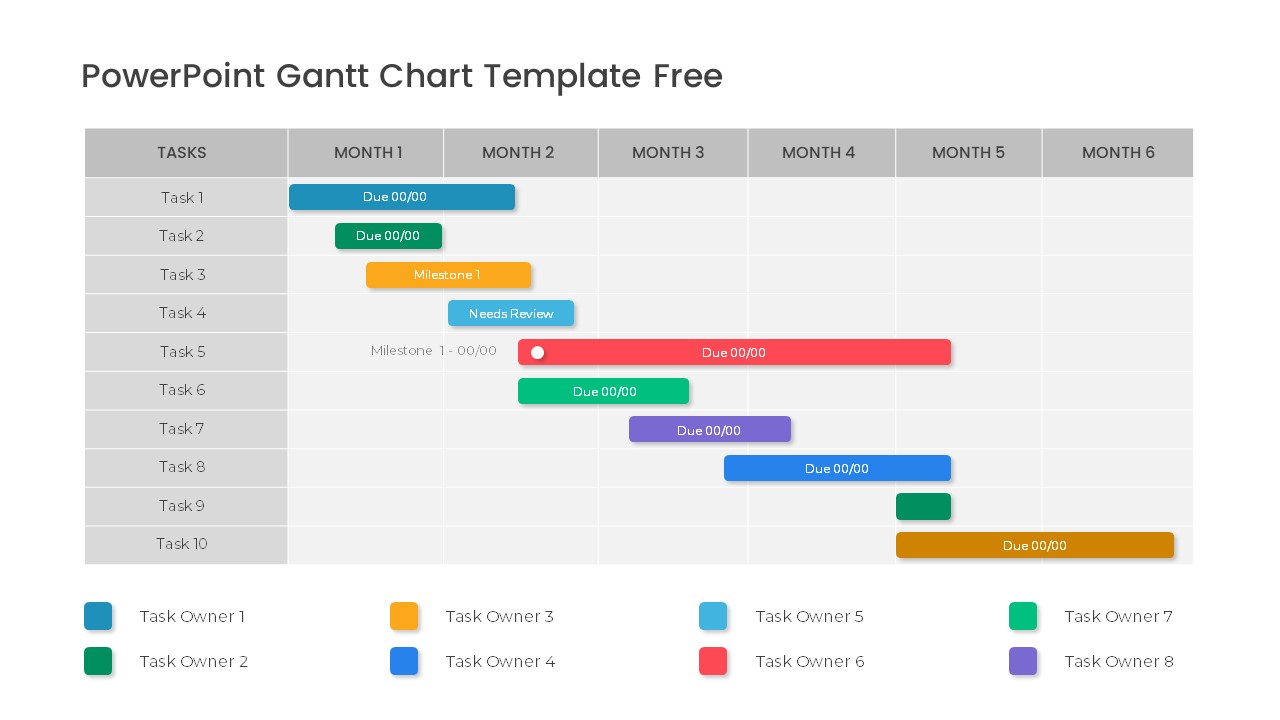
Free PowerPoint Gantt Chart Template
PowerPoint Charts
Free
-
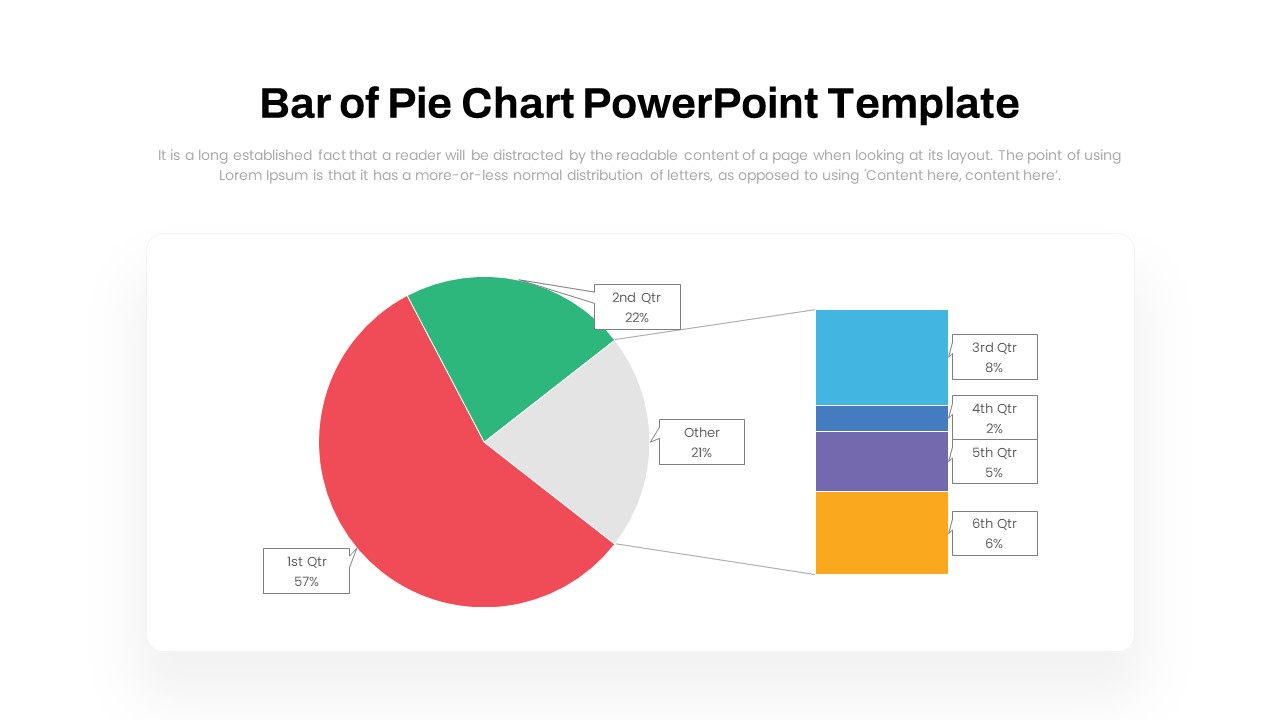
Bar of Pie Chart PowerPoint Template
PowerPoint Templates
Premium
-

Combination Chart PowerPoint Template
PowerPoint Charts
Premium
-
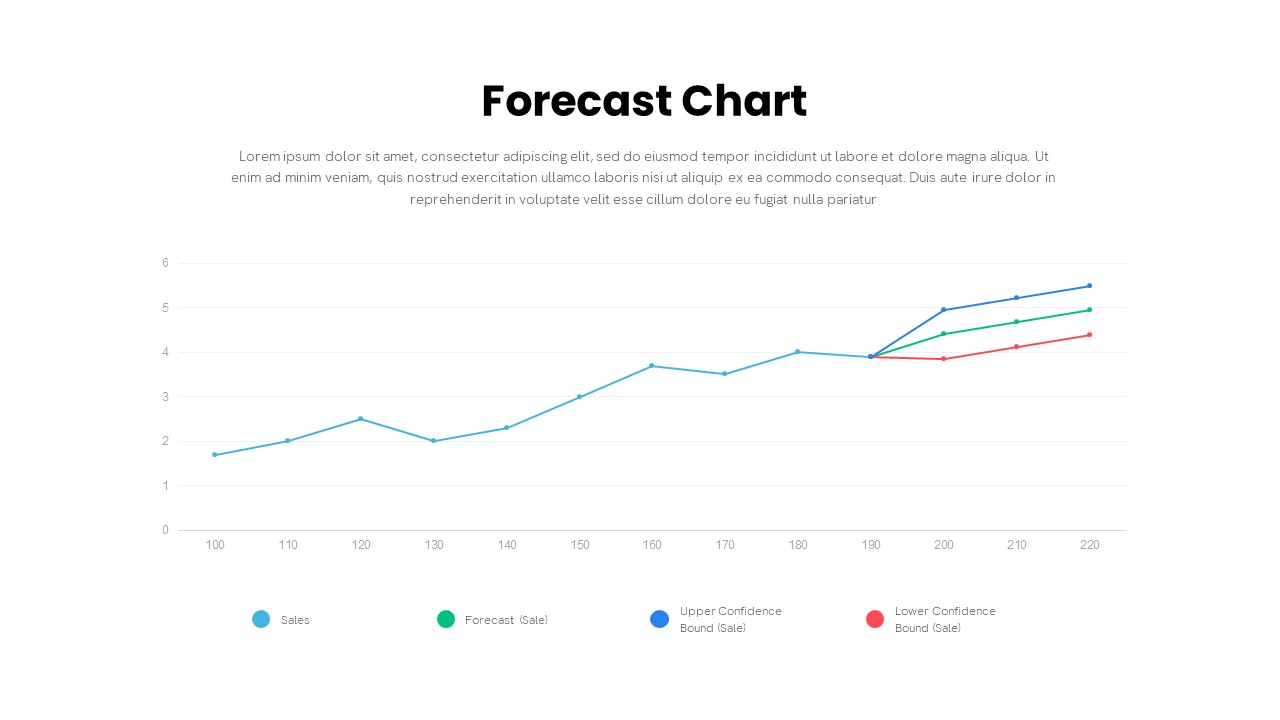
Forecast Chart PowerPoint Template
PowerPoint Charts
Premium
-
Set of Chart PowerPoint Template and Keynote Diagram
PowerPoint Charts
Premium
-

Free AI Artificial Intelligence PowerPoint Template
PowerPoint Templates
Free
-
Sun Burst Chart PowerPoint Template
Circular Diagrams
Premium
-

Business Process Reengineering Template
PowerPoint Templates
Premium
-
Free Stacked Column Chart Template
Column and Bar chart
Free
-

Finance Consulting PowerPoint Template
PowerPoint Templates
Premium
-
Progress Chart PowerPoint Template
PowerPoint Templates
Premium
-

Animated Upcoming Event Poster PowerPoint Template
PowerPoint Templates
Premium
-
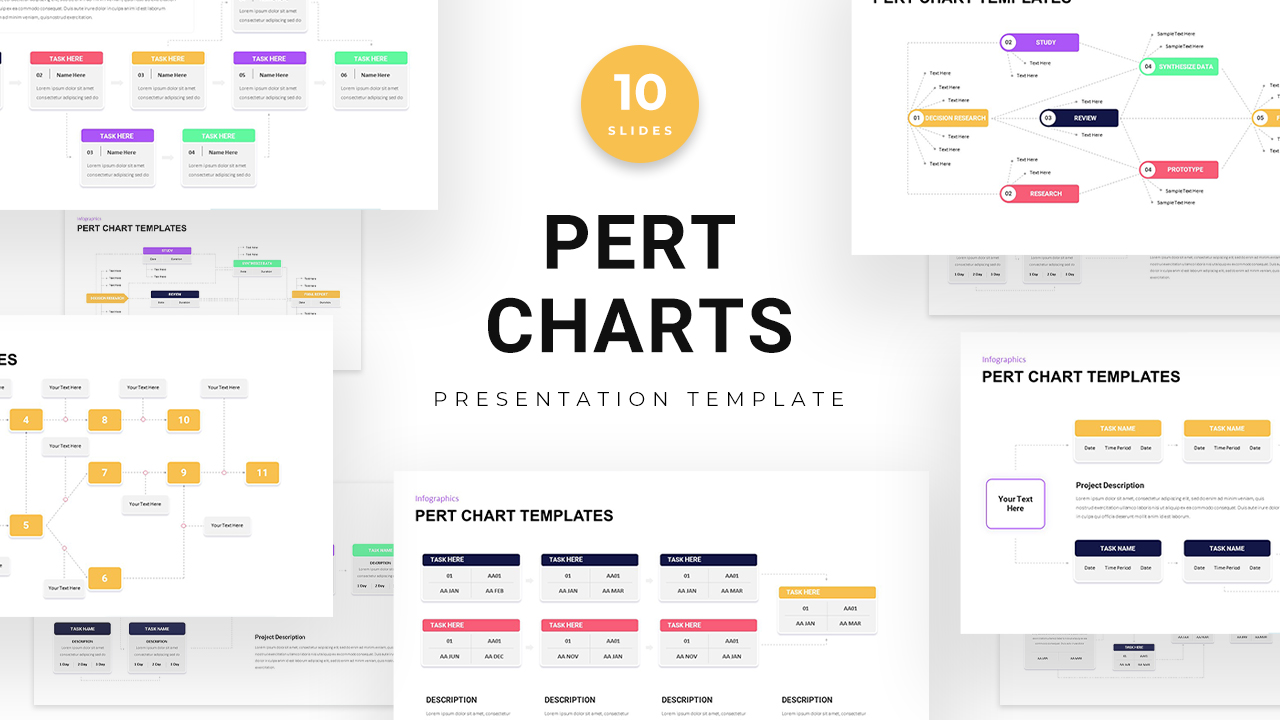
Pert Chart PowerPoint Templates
Diagrams
Premium
-
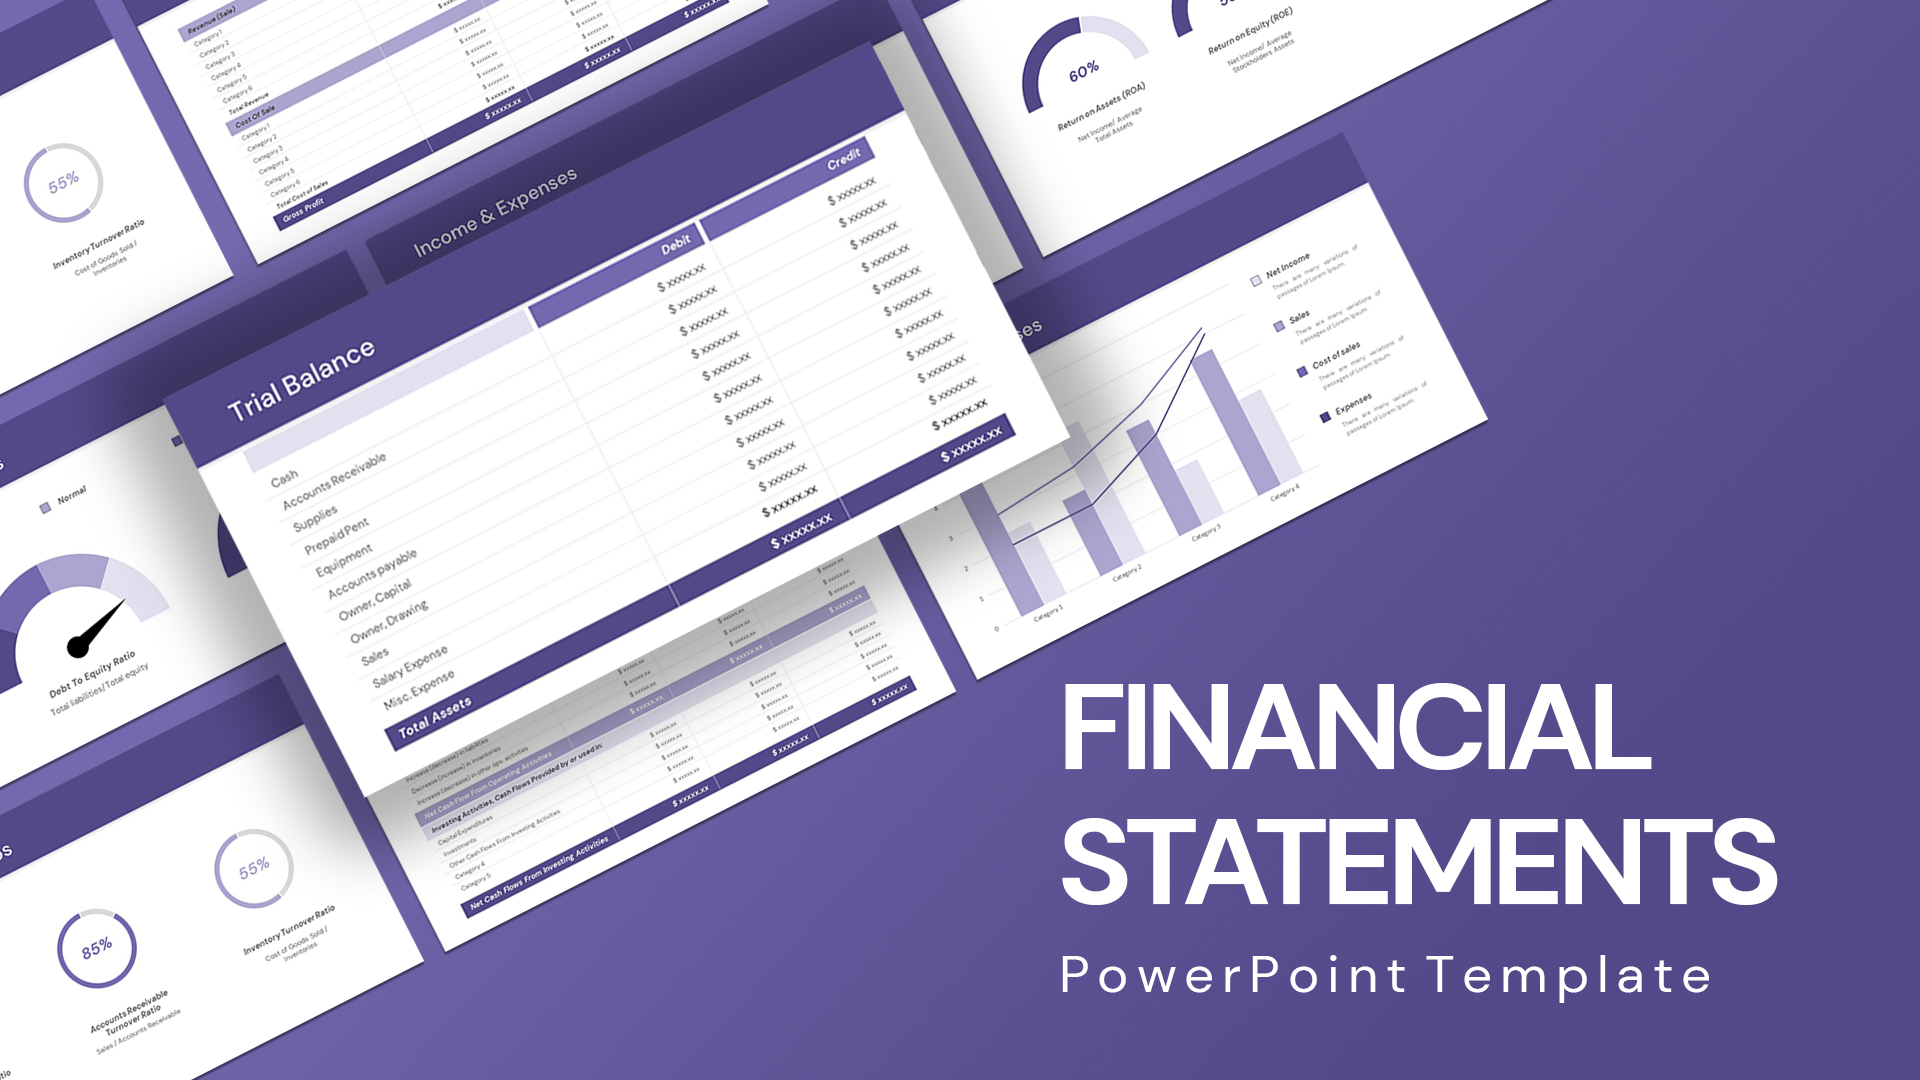
Financial Statement PowerPoint Template
PowerPoint Templates
Premium
-

Open Door Policy PowerPoint Template
PowerPoint Templates
Premium
-

Proportional Area Chart PowerPoint Template
PowerPoint Templates
Premium
-
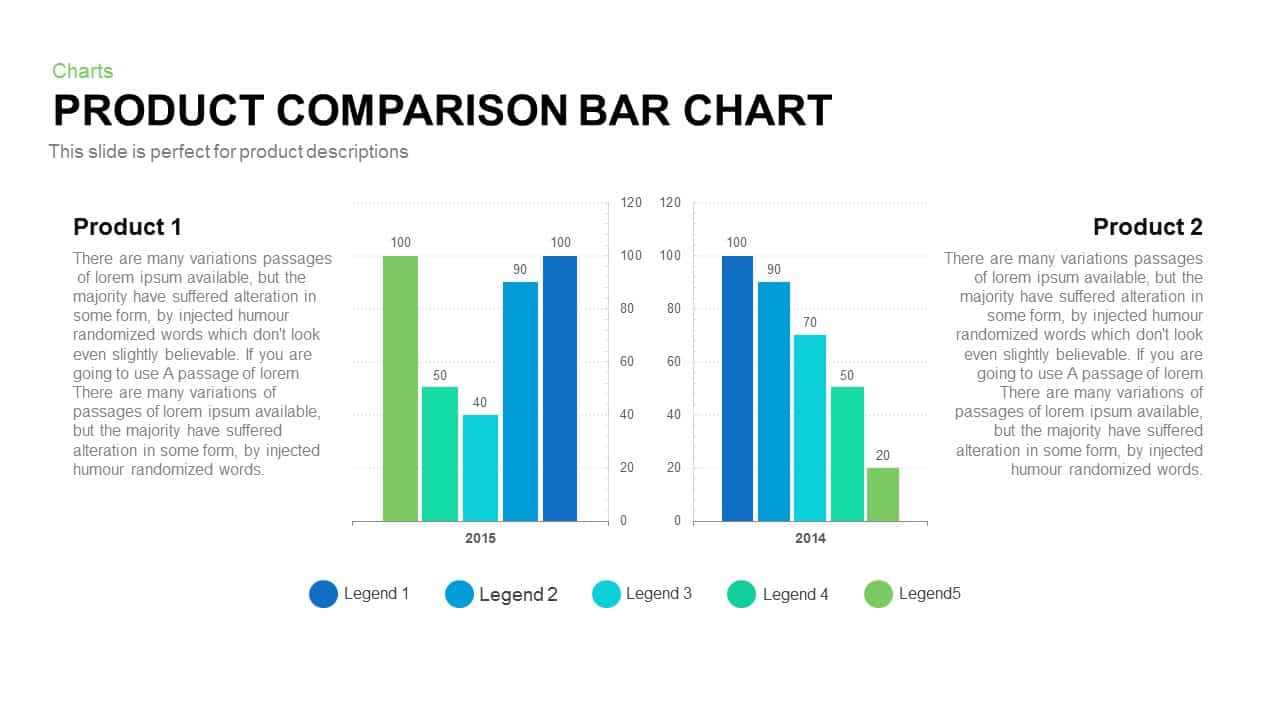
Product Comparison Bar Chart Template for PowerPoint and Keynote
PowerPoint Charts
Premium
-
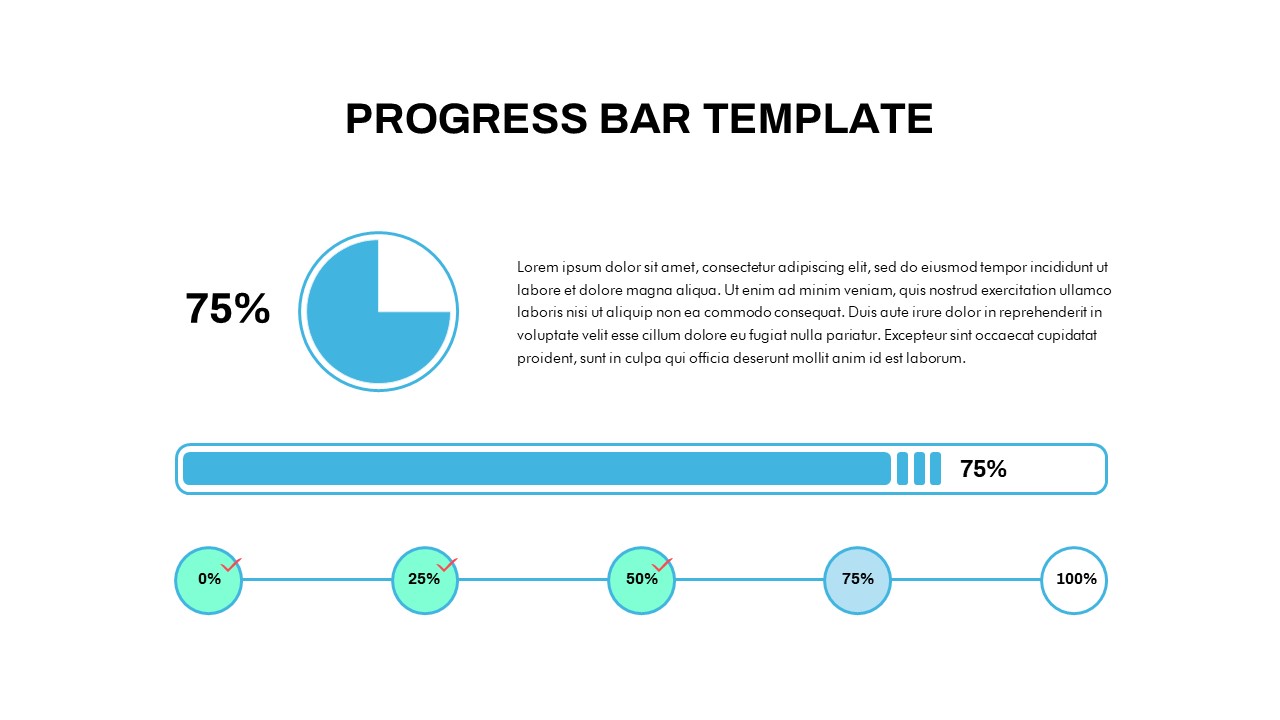
Progress Bar Chart PowerPoint Template
PowerPoint Templates
Premium
-
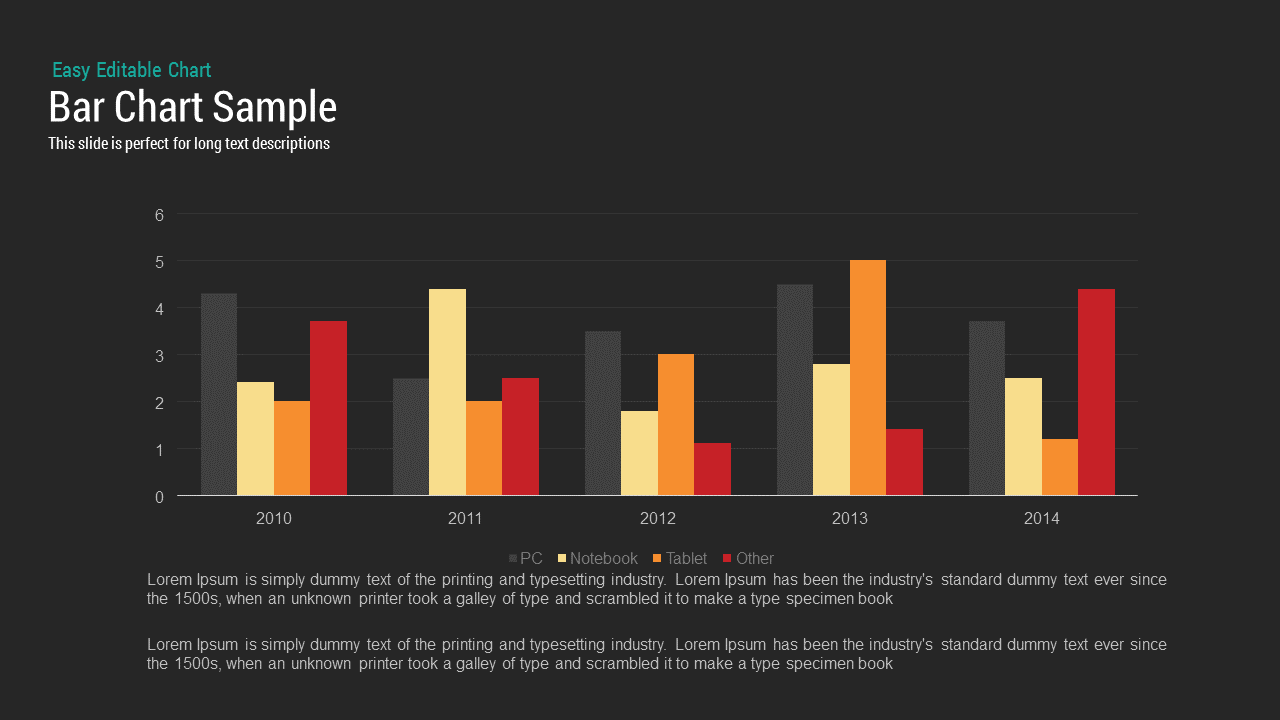
Sample Bar Chart Template for PowerPoint and Keynote Presentation
Column and Bar chart
Premium
-
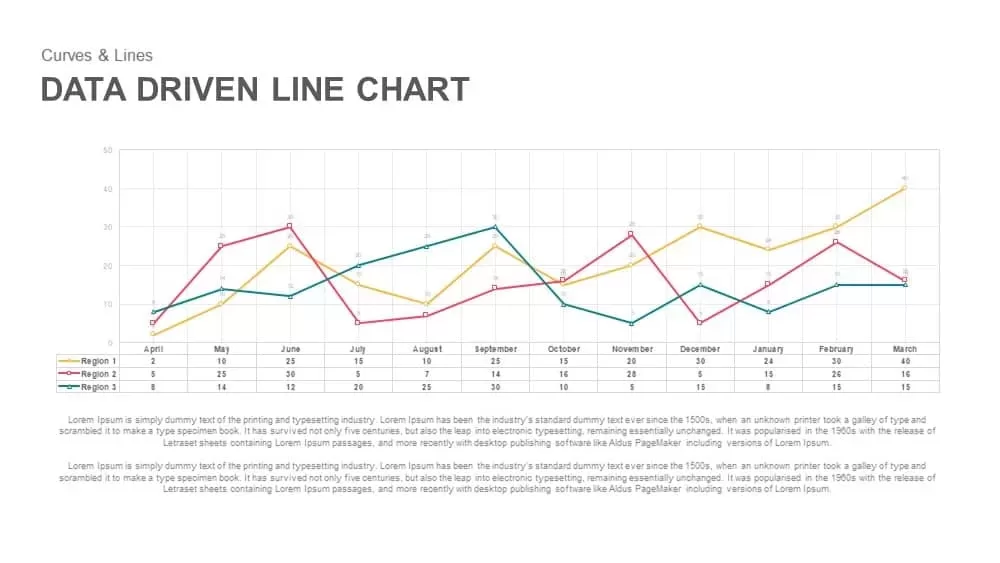
Data Driven Line Chart Template for PowerPoint & Keynote
Curves and Lines
Premium
-
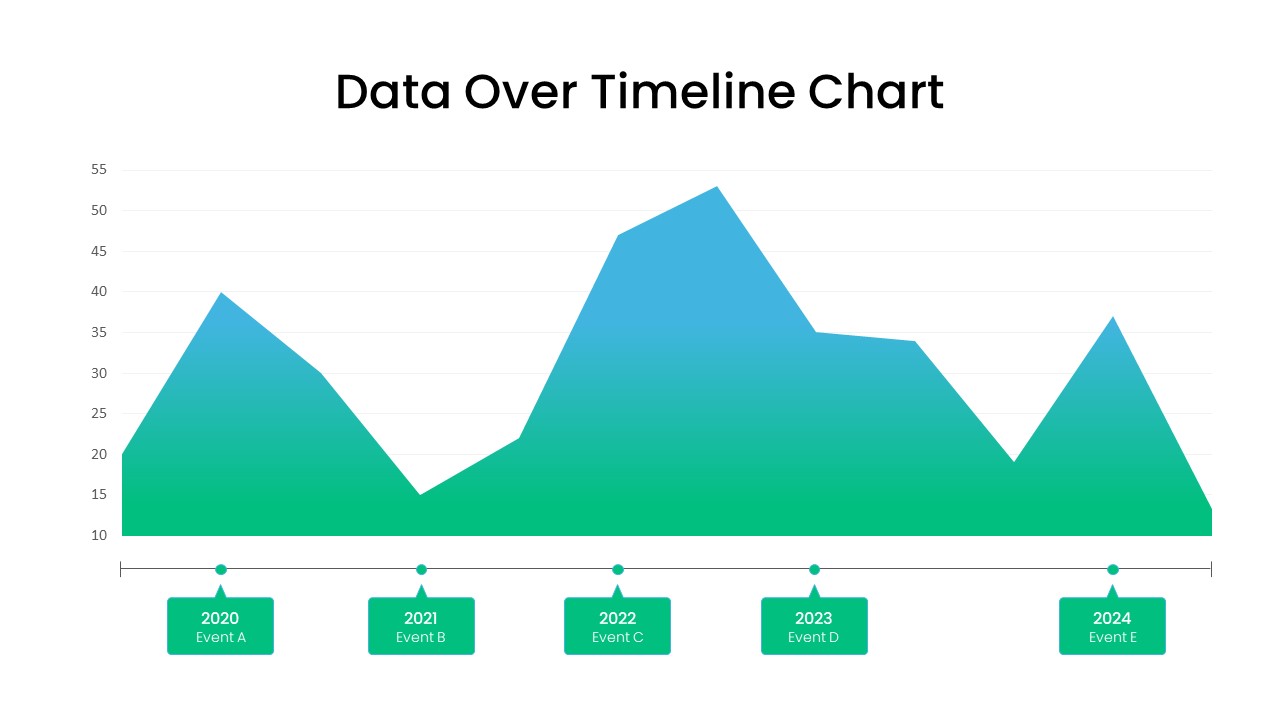
Data Over Time Line Chart PowerPoint Template
PowerPoint Charts
Premium
-
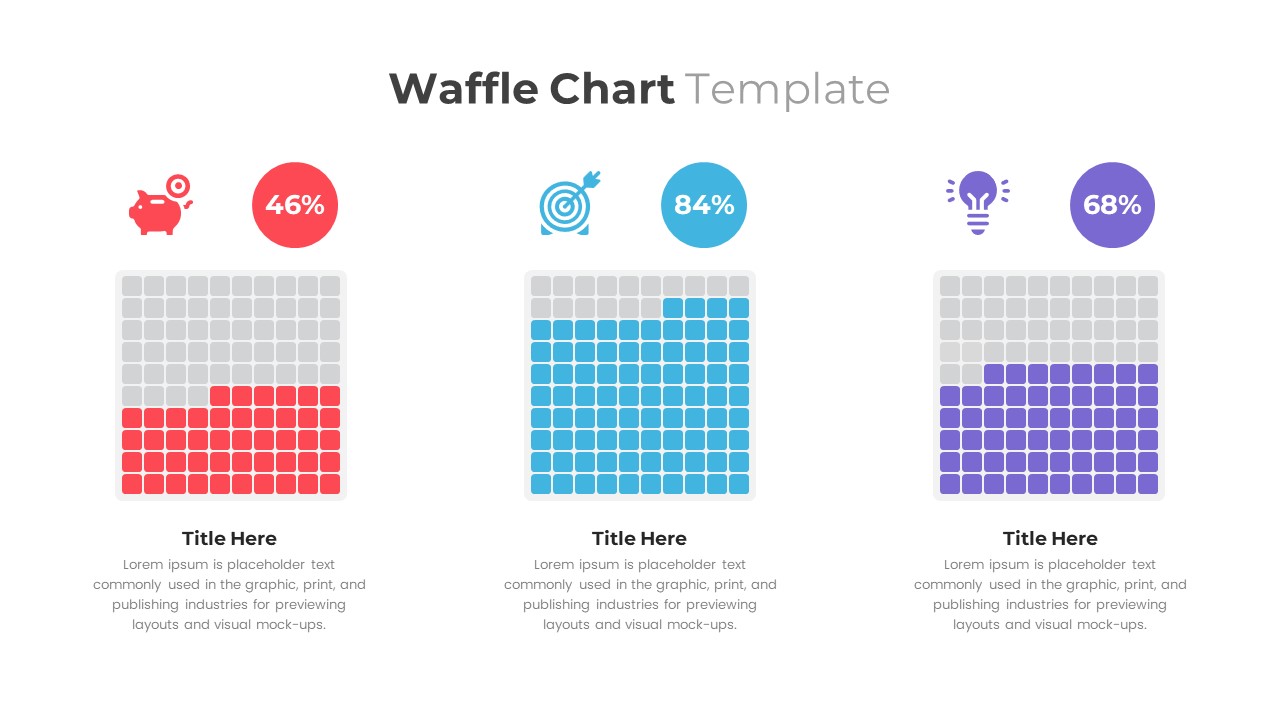
Waffle Chart PowerPoint Template
PowerPoint Templates
Premium
-
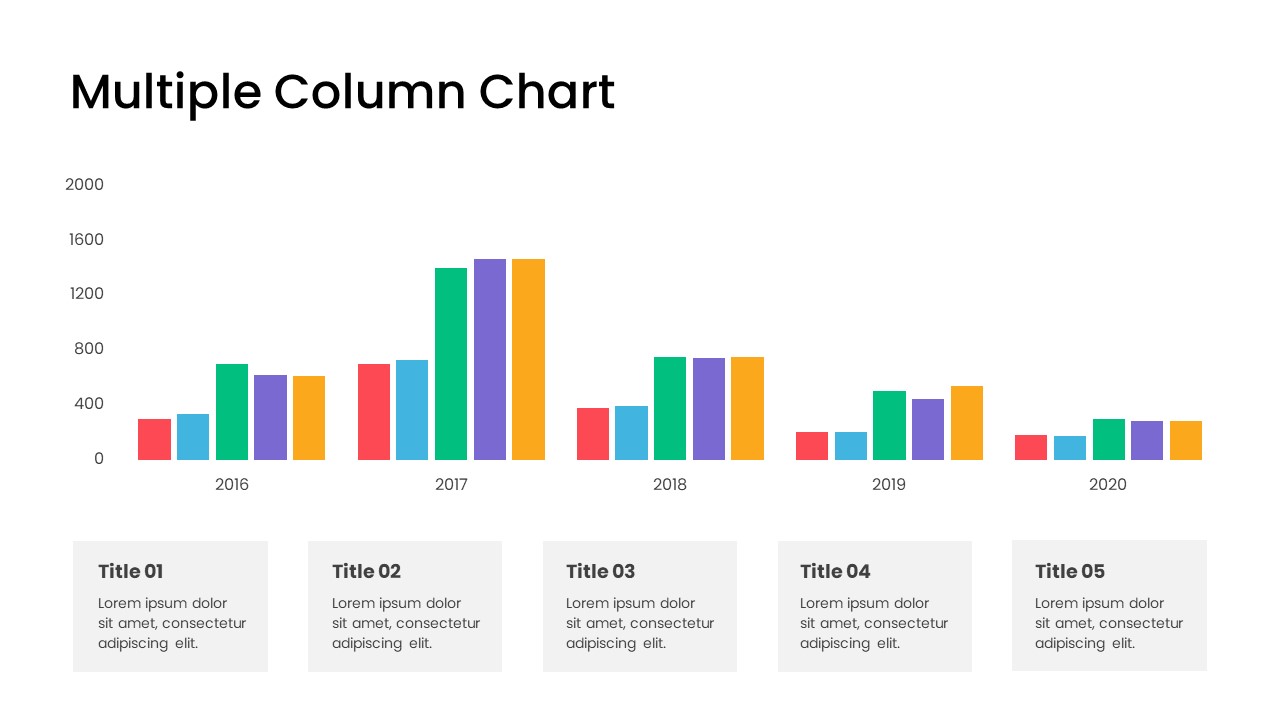
Multiple Column Chart PowerPoint Template
Column and Bar chart
Premium
-

Biotechnology PowerPoint Presentation Template
PowerPoint Templates
Premium
-
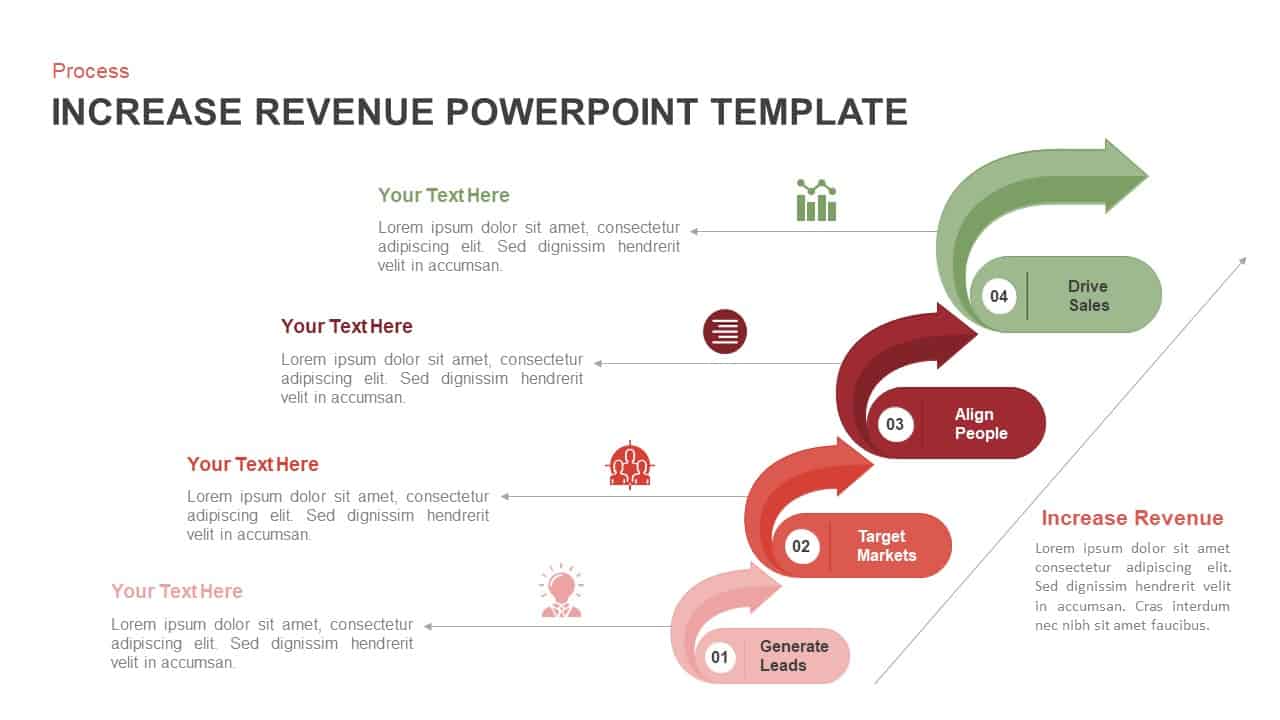
Increase Revenue PowerPoint Template and Keynote Slide
Arrow Diagrams
Premium
-
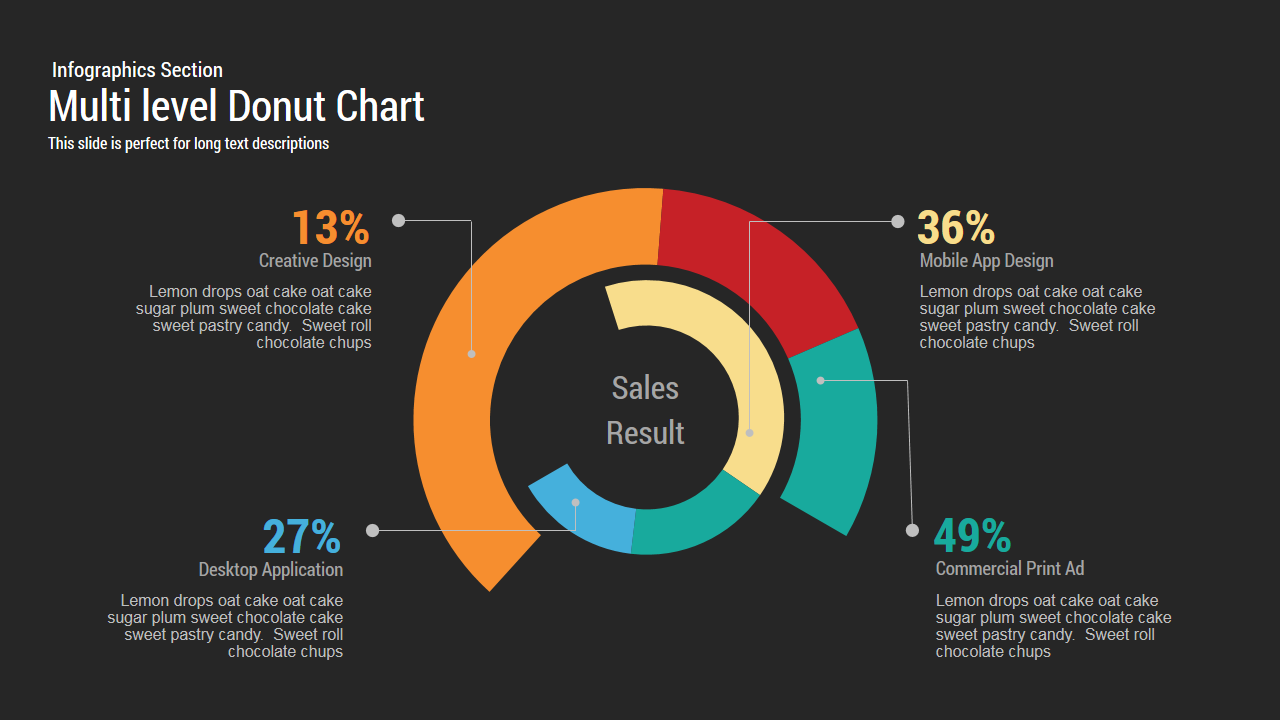
Multi level Donut Chart Template for PowerPoint and Keynote
PowerPoint Charts
Premium
-
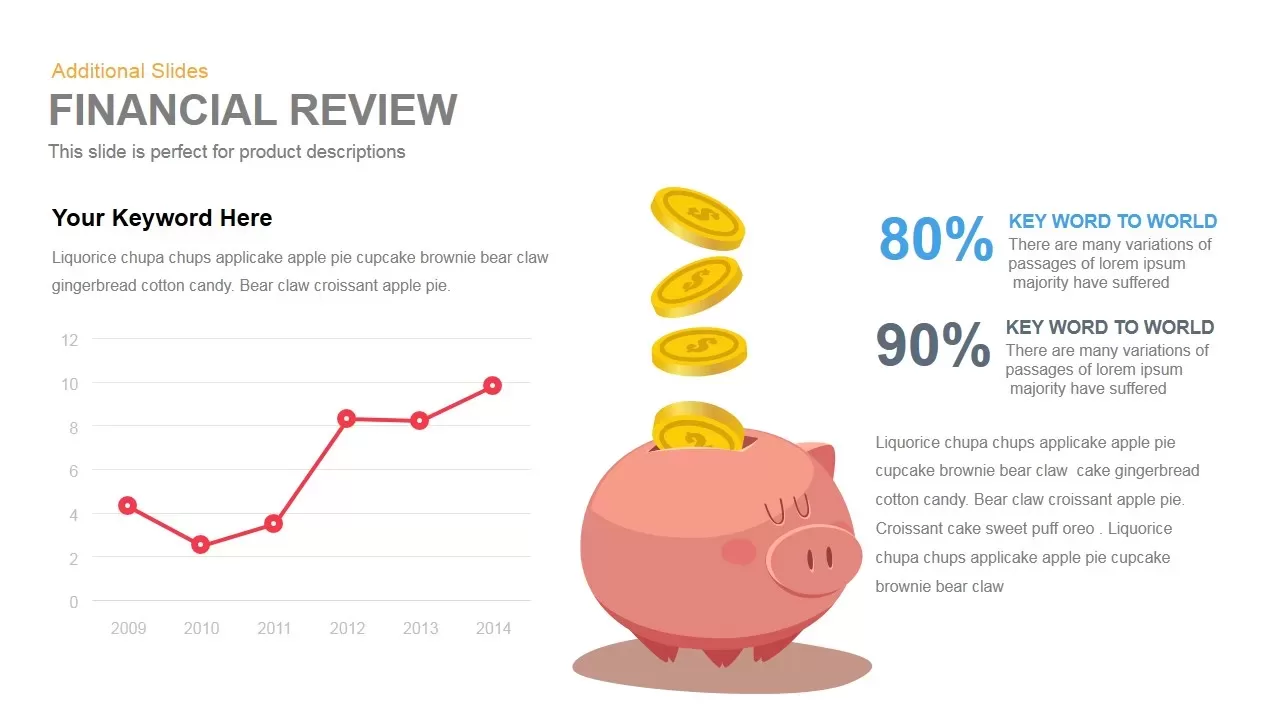
Financial Review Template for PowerPoint and Keynote
Infographic
Premium
-
Data Bar Chart Template for PowerPoint and Keynote
Column and Bar chart
Premium
-
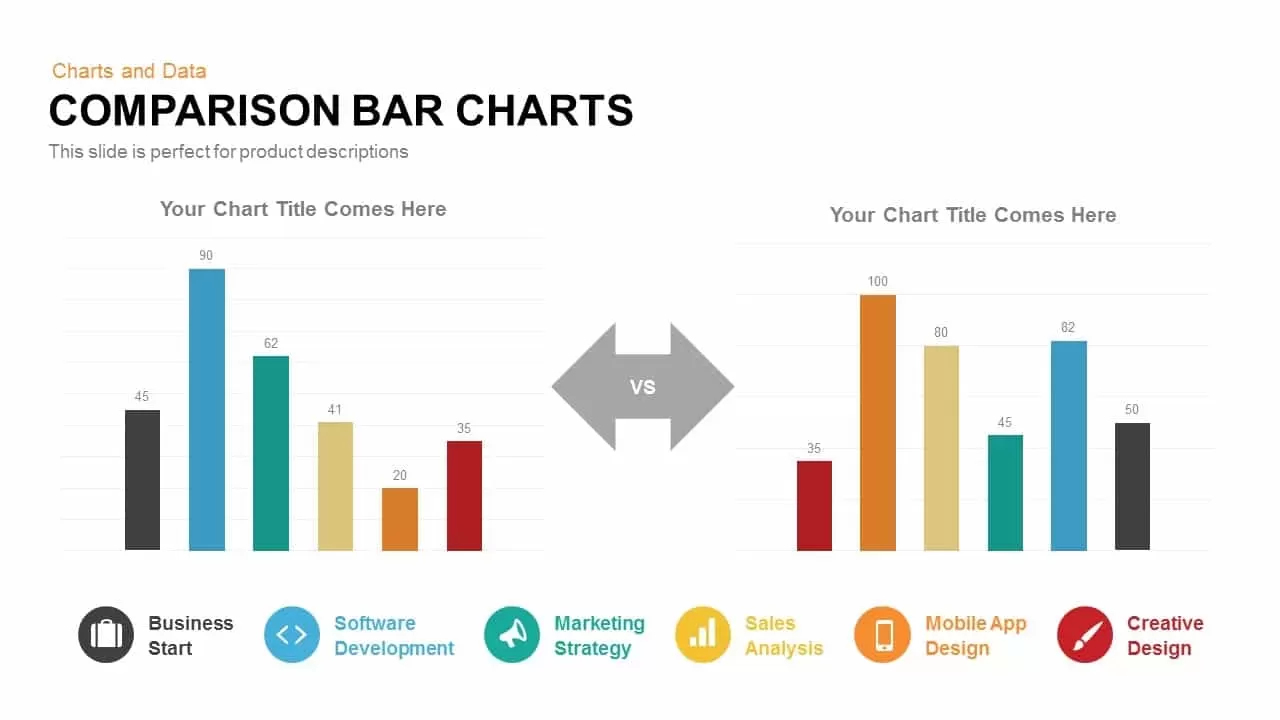
Comparison Bar Charts PowerPoint Template and Keynote Slide
Column and Bar chart
Premium
-
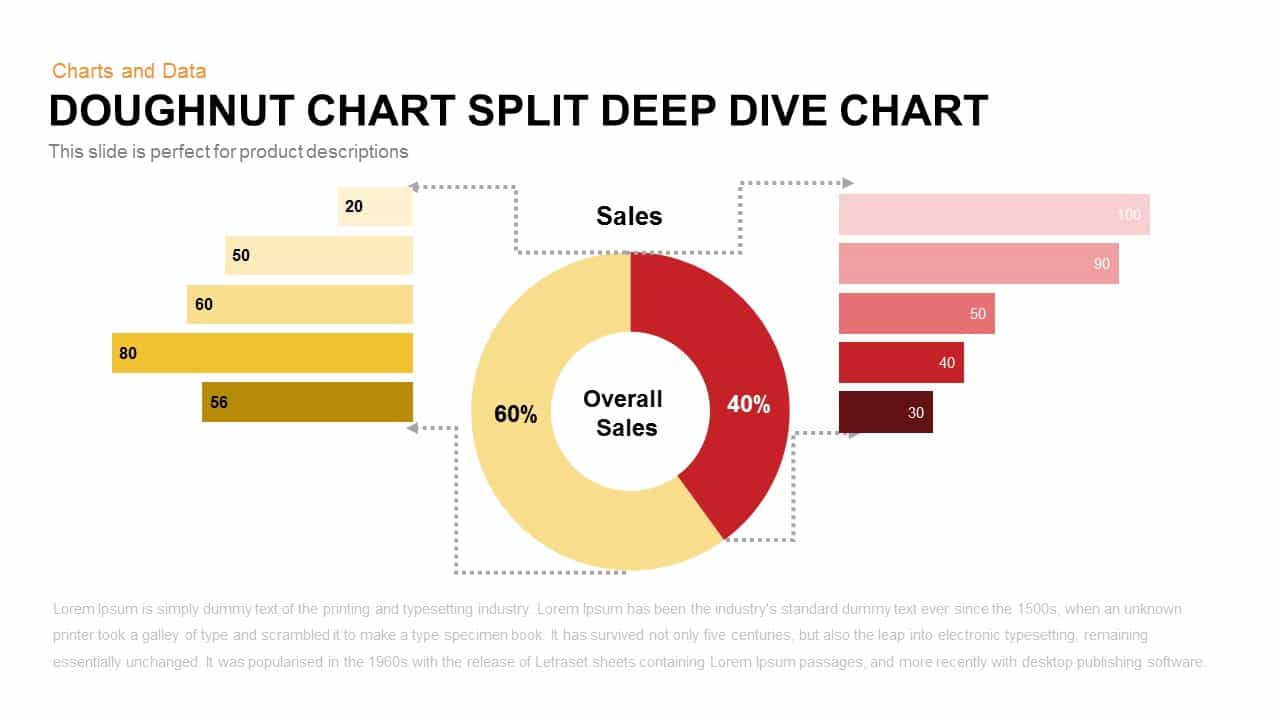
Donut Chart Split Deep Dive Chart Template For PowerPoint and Keynote
Keynote Templates
Premium
-
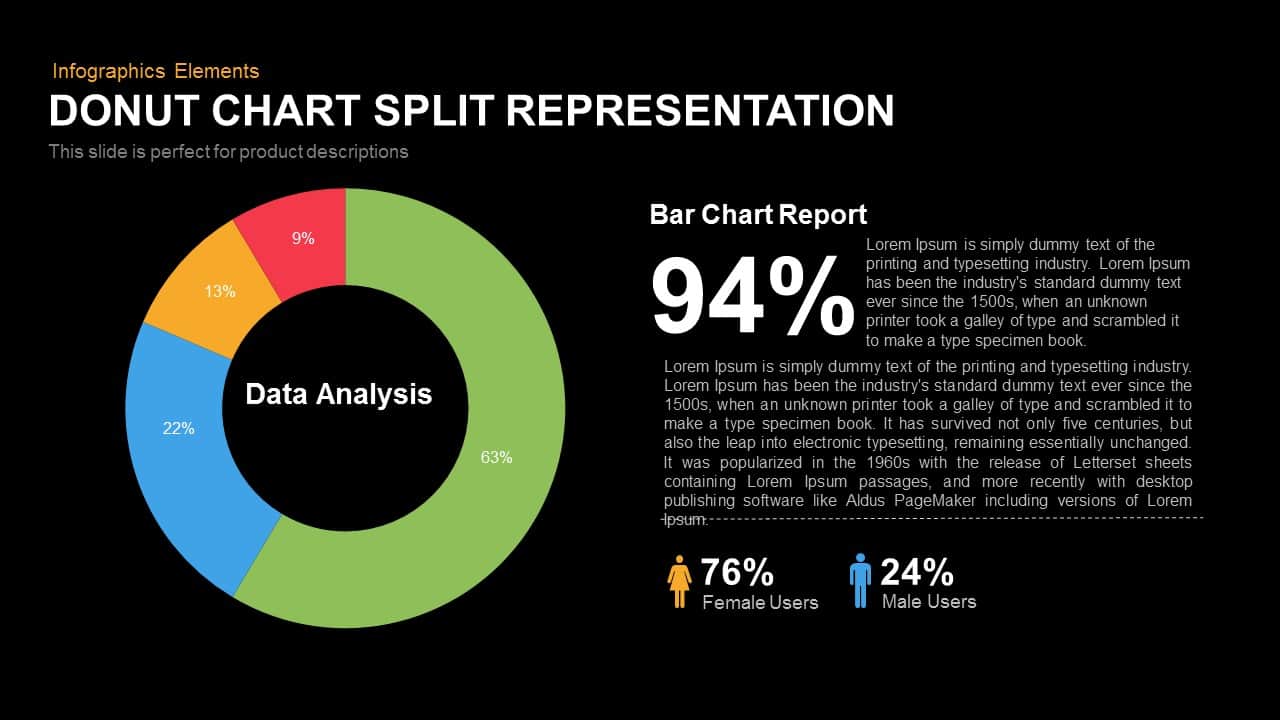
Split Representation Donut Chart Template for PowerPoint and Keynote
Keynote Templates
Premium
-
Bubble Chart PowerPoint Template
PowerPoint Templates
Premium
-
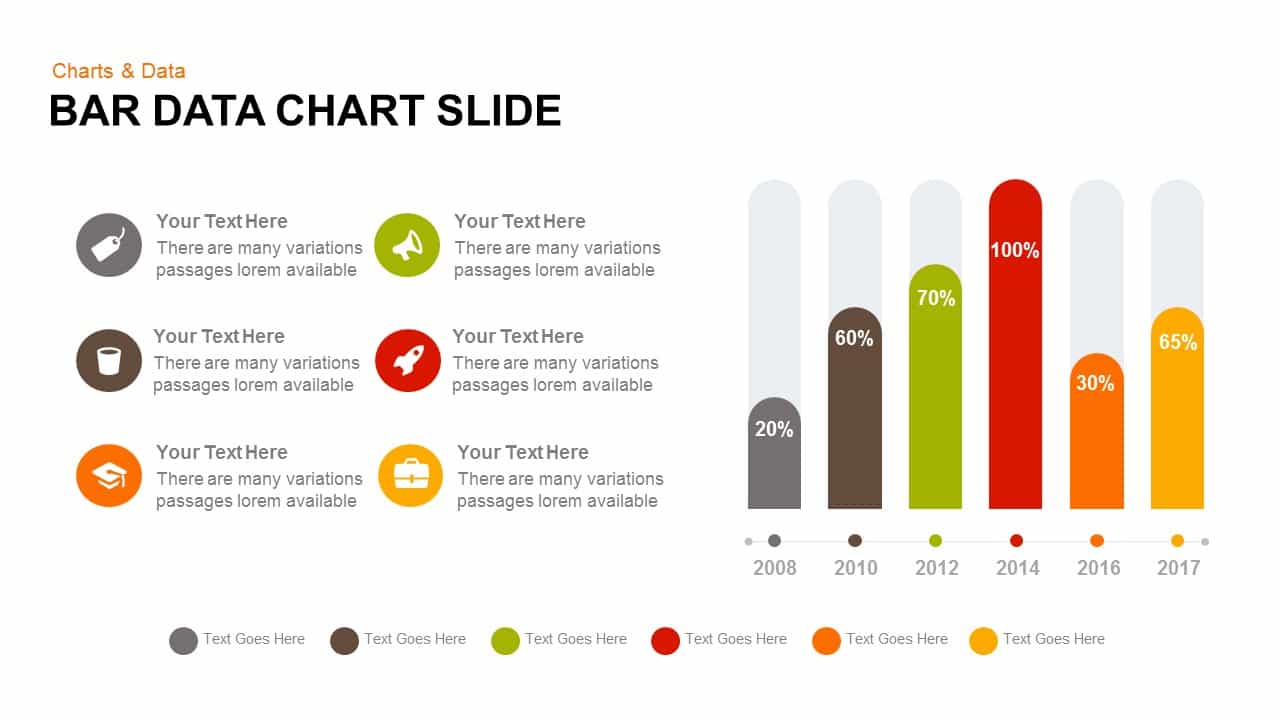
Timeline Bar Chart PowerPoint
Column and Bar chart
Premium