Home » Flow Charts » Situational Leadership Chart
Situational Leadership Chart
- Version 1.0.0
- Download 44
- File Size 0.00 KB
- File Count 1
- Create Date August 30, 2022
- Last Updated August 30, 2022
Situational Leadership Chart
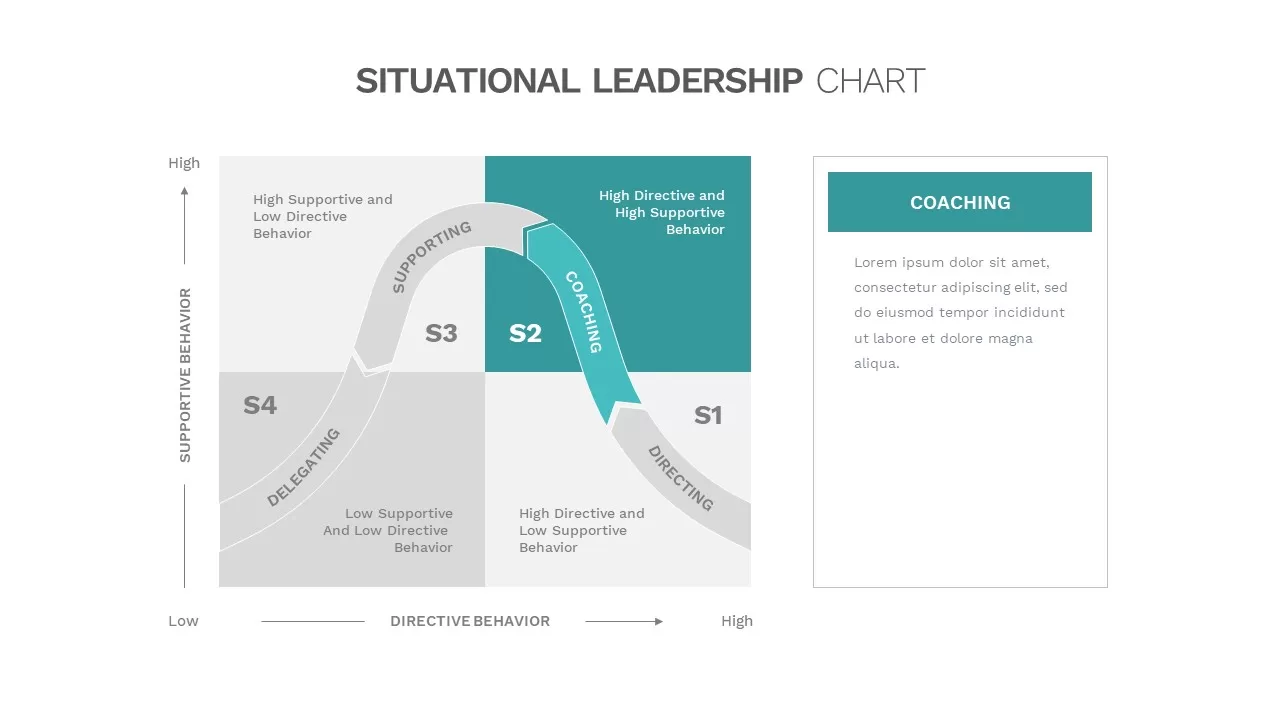
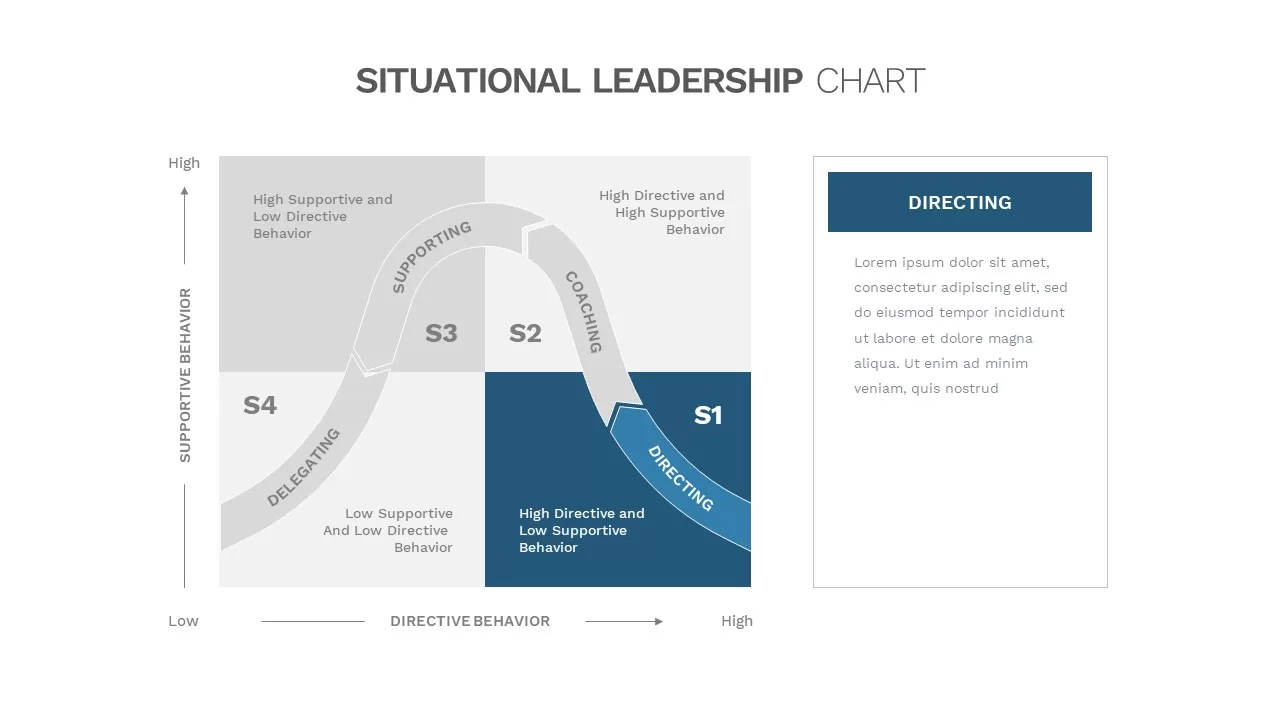
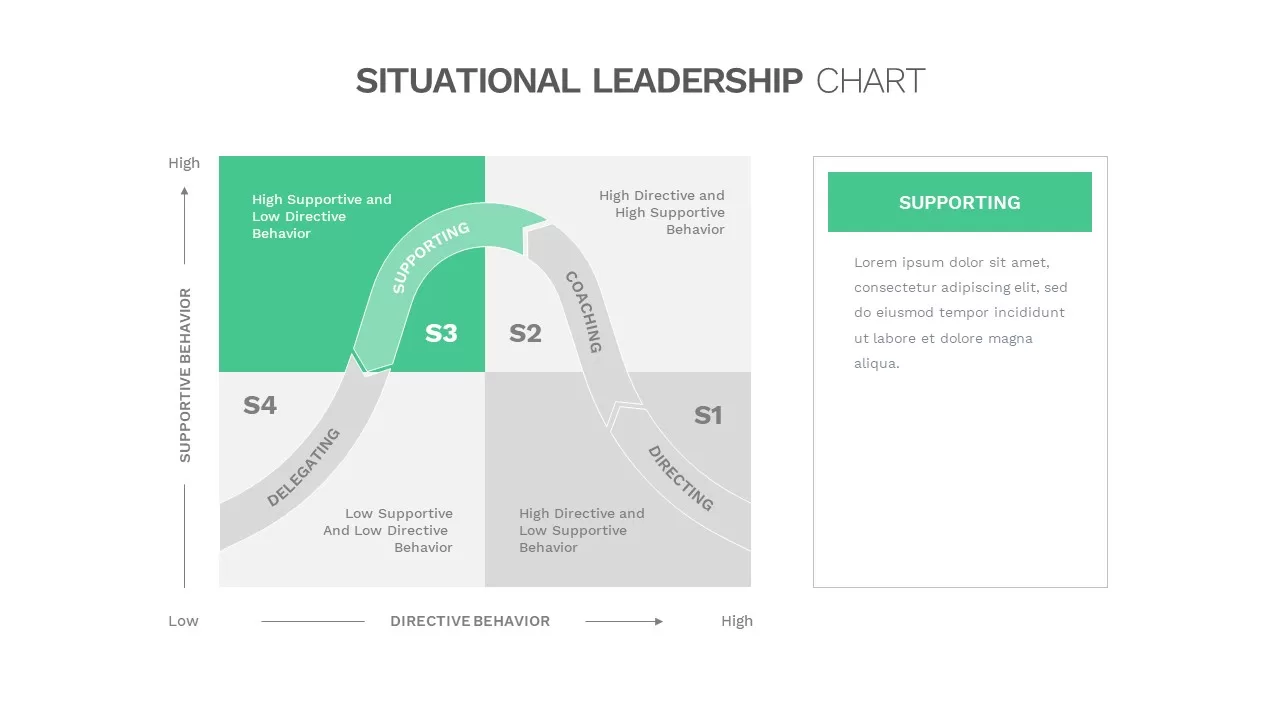
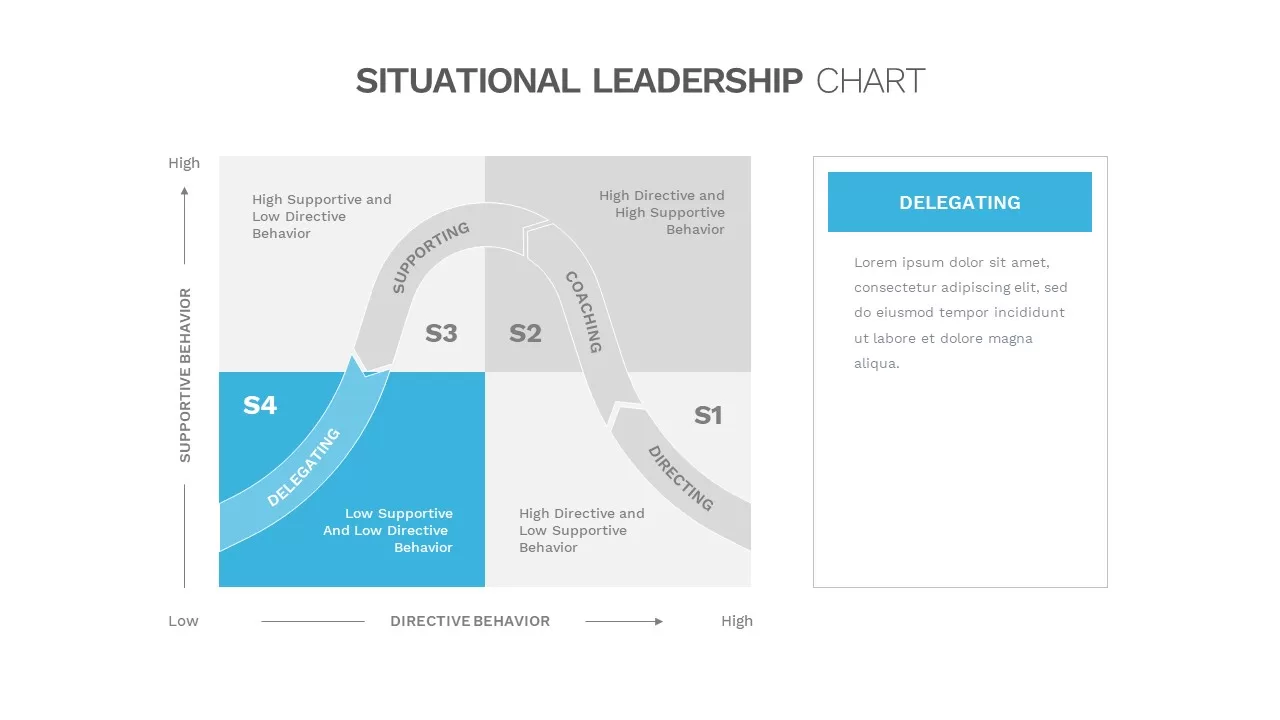
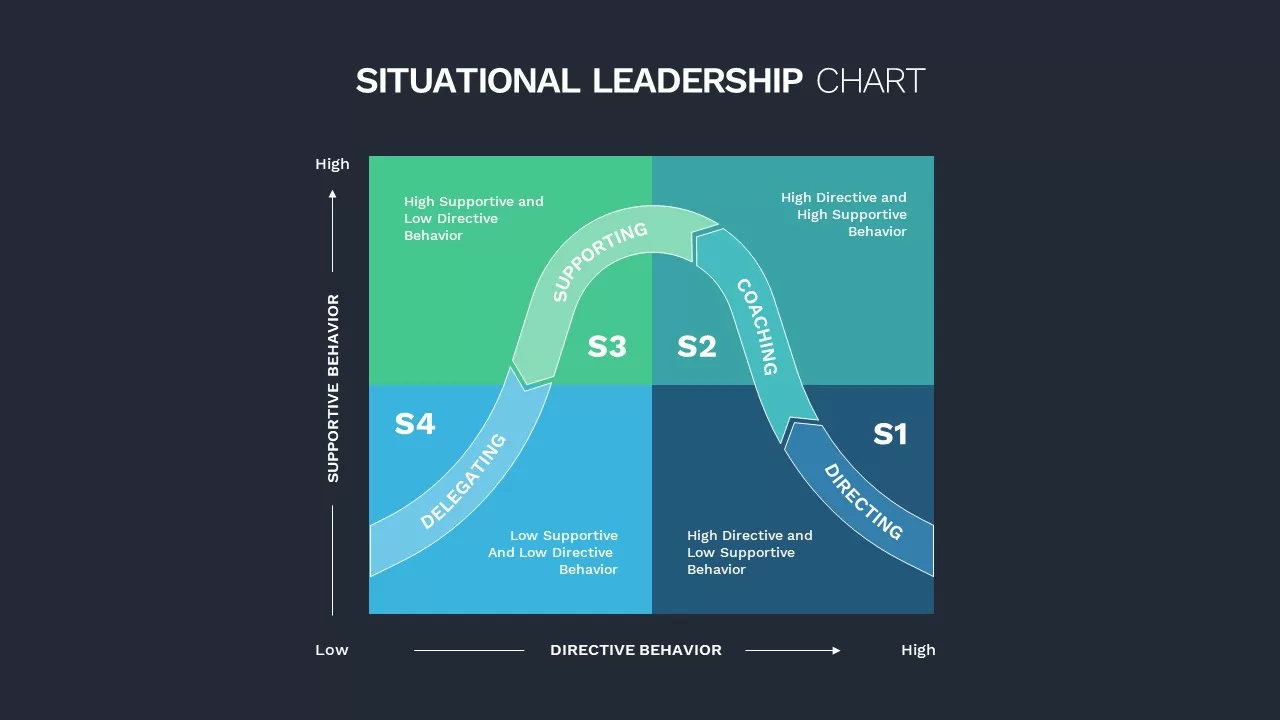
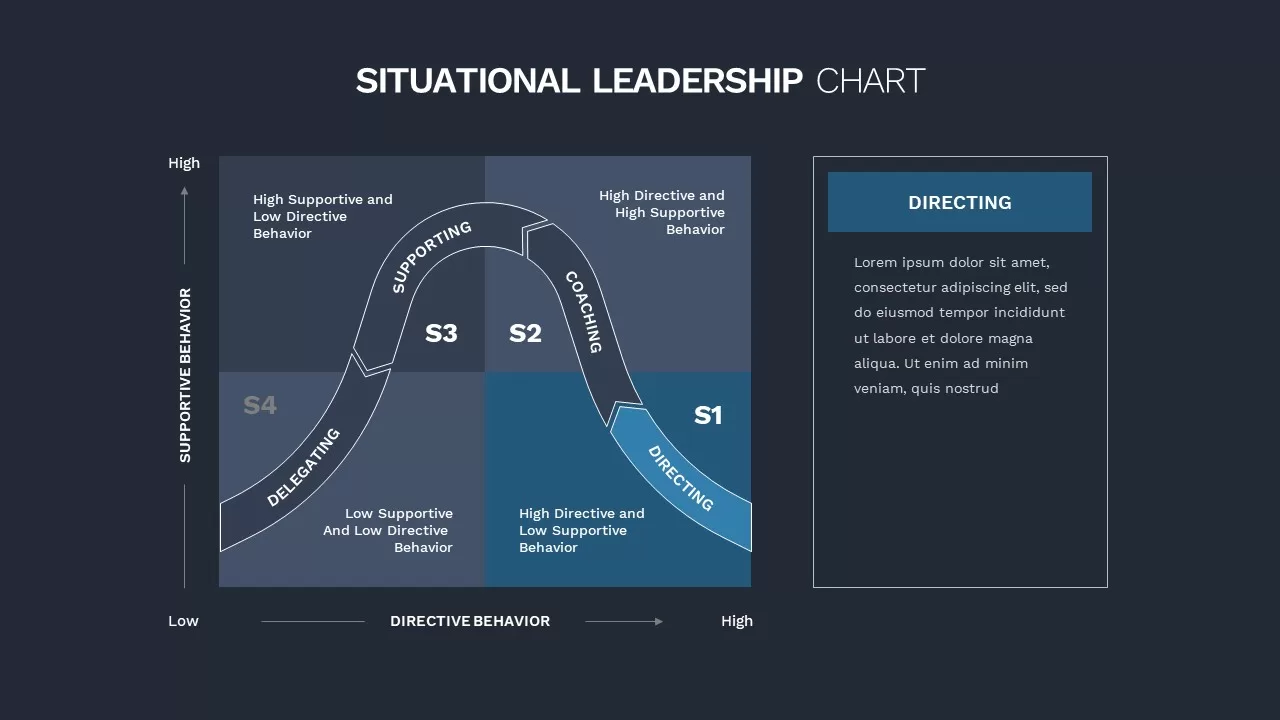
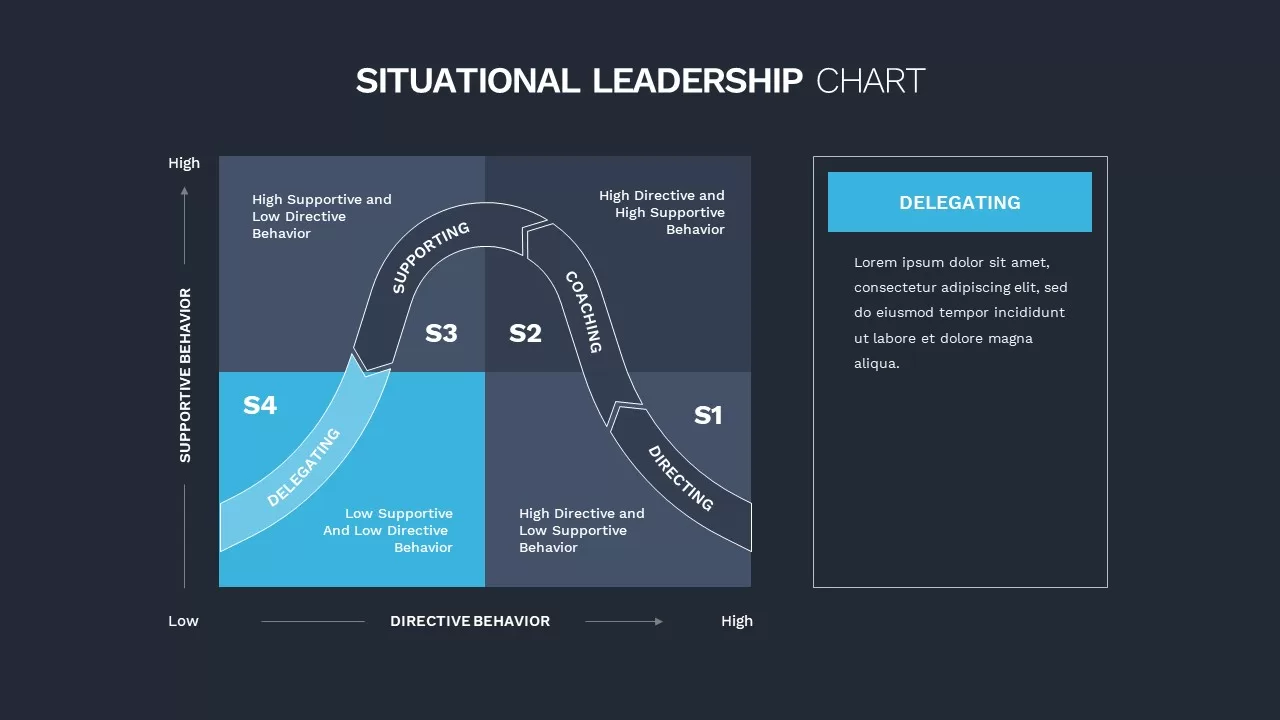
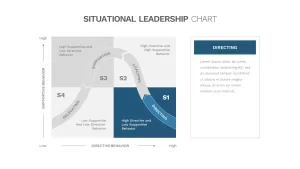
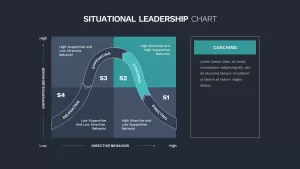
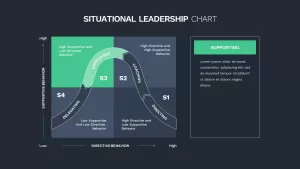
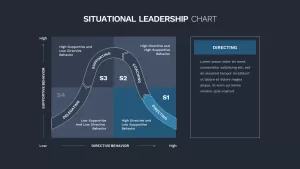
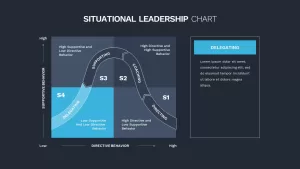
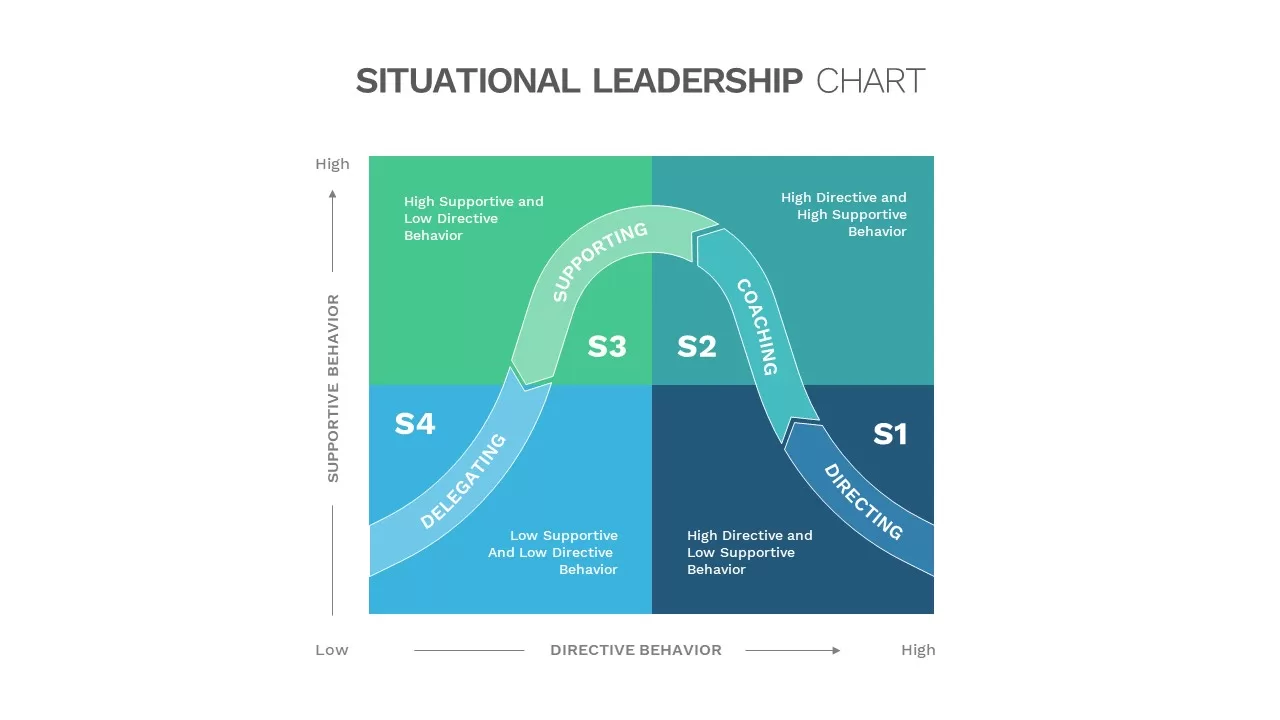
The situational Leadership Chart is a quadrant diagram that shows the four directive principal suits to lead your team. In contrast to trait theory and great man theory, situational leadership believes that leadership quality is not innate and the leadership changes according to the situation. Leadership theory undoubtedly says that the same leadership style cannot be applicable in all situations; depending upon the action situation or the context, the leadership style should be changed to meet group goals. Kenneth Blanchard and Paul Hersey developed this theory. The situational leadership diagram emphasizes the deep study of the situations and decisions regarding “how to act most appropriately.”
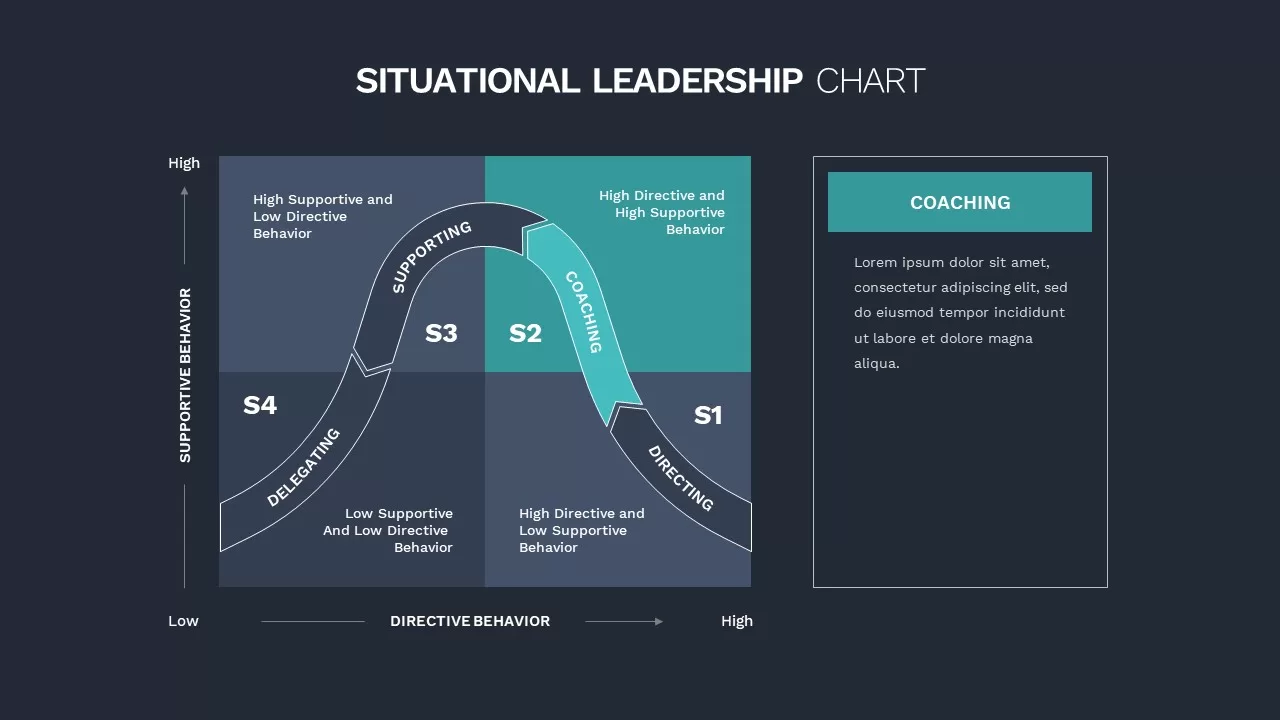
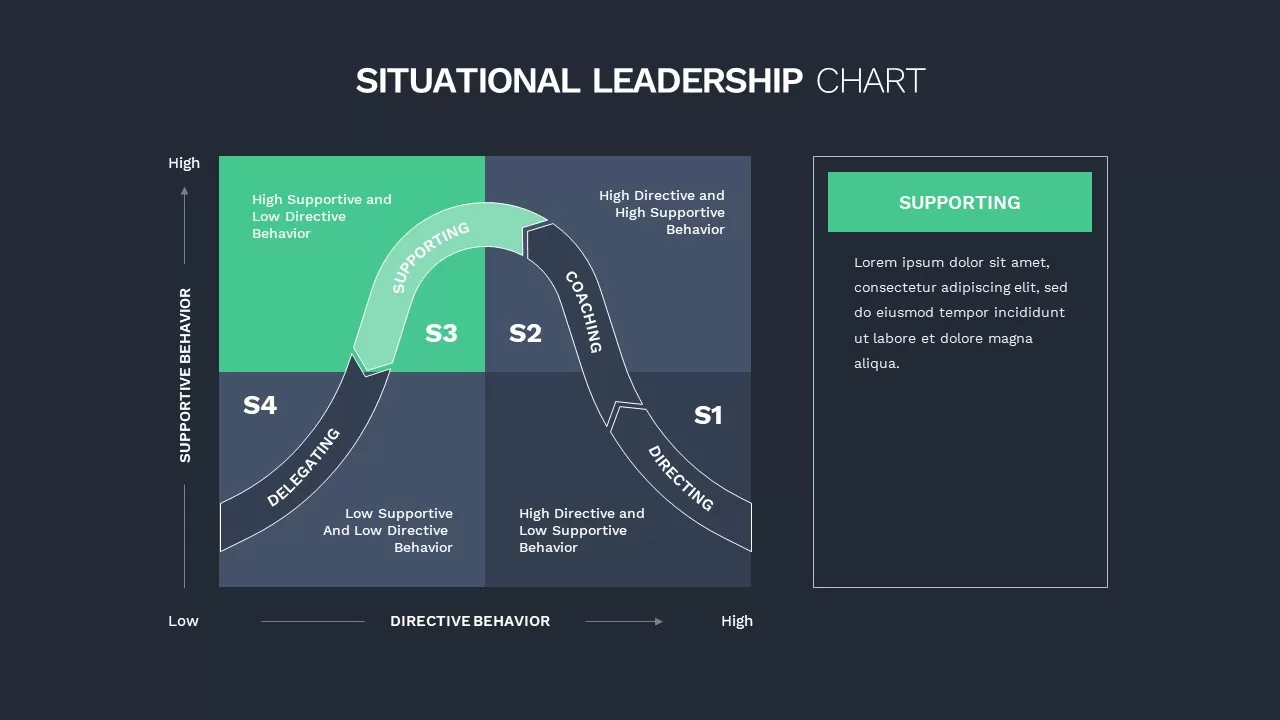
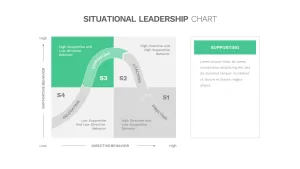
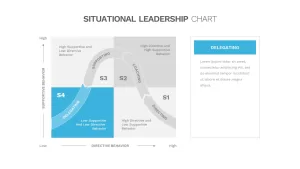
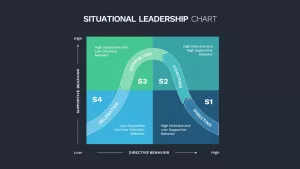
The multi-colored PowerPoint situational leadership diagram shows the XY axis of the diagram. This axis indicates that situational leadership’s foundations rely on levels of directive behavior and supportive behavior—the four types of leadership shown on the arrow ppt arch diagram. Directing, Coaching, Supporting, and Delegating are the four styles that the leaders should adopt according to the situation.
- S1: Based on Directions. after leaders’ observation on their followers, telling why, how, and when of the task should be completed. Directions follows high directive behavior and low supportive behavior.
- S2: Based on Coaching. It is controlled direction, here leaders are open and let communication with one another to meet the goals. The chart shows high directive behavior and high supportive behavior.
- S3: Based on Supporting. Leaders actively participating for opinion formation to meet project goals. Charts shows low behavior and high supportive behavior.
- Based on Delegations. Leaders monitors and reviews the process. Chart shows low directive behavior and low supportive behavior.
The situational leadership chart for PowerPoint presentation is an editable diagram, so it allows any changes in features. However, a standardized diagram doesn't need to alter the content when you use situational leadership presentation. You can change the square ppt template's color, size, and background PowerPoint themes using customization options. You can also try out our leadership success profile template.
Attached Files
| File |
|---|
| https://premiumdownloads.s3.amazonaws.com/SB02358-Situational Leadership Chart.zip |
Login to download this file
Add to favorites
Add to collection
-
Item ID
SB02358 -
Rating
0.0
(0 reviews)
Related Templates
-

Leadership Development Coaching Deck PowerPoint Template
PowerPoint Templates
Premium
-

Goleman Leadership Styles Template
Circular Diagrams
Premium
-

Leadership Training PowerPoint Template Deck
PowerPoint Business Templates
Premium
-

Four Exchanges of Transactional Leadership PowerPoint Template
Circular Diagrams
Premium
-
Leadership Matrix PowerPoint Template and Keynote
Diagrams
Premium
-
Fielders Contingency Model Template
PowerPoint Charts
Premium
-
Skinner’s Reinforcement Theory
PowerPoint Templates
Premium
-

Leadership Success Profile PowerPoint Template
PowerPoint Templates
Premium
-
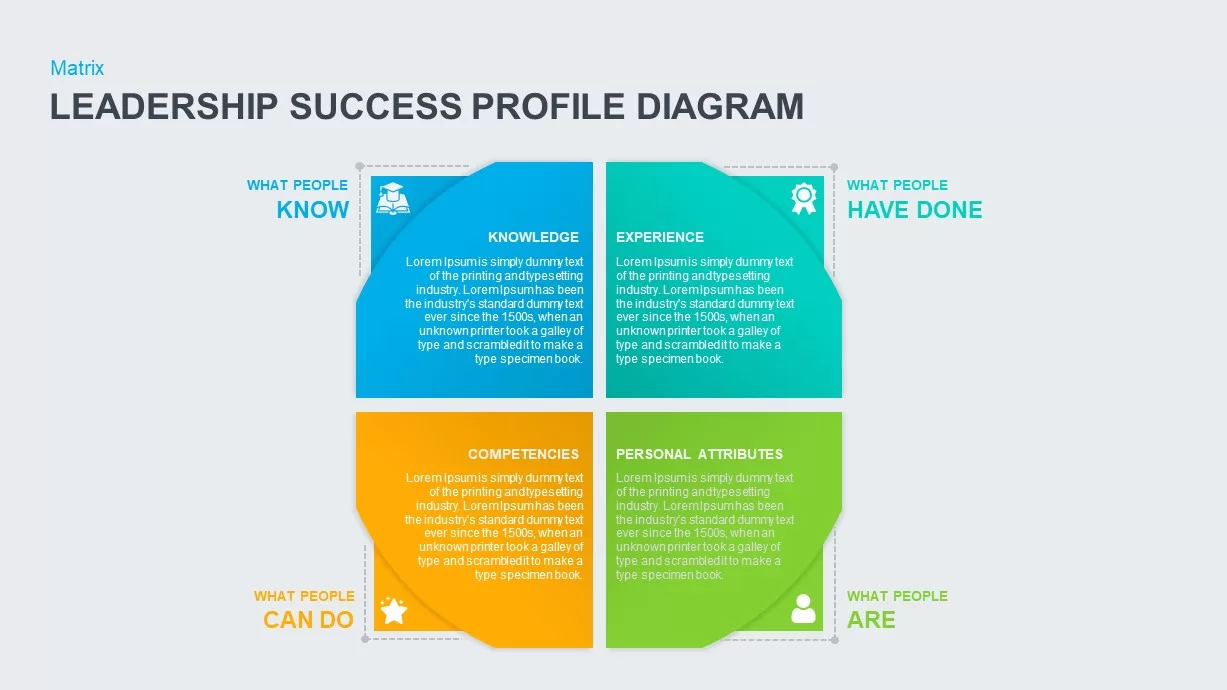
Leadership Success Profile Diagram PowerPoint Template
Business Models
Premium
-
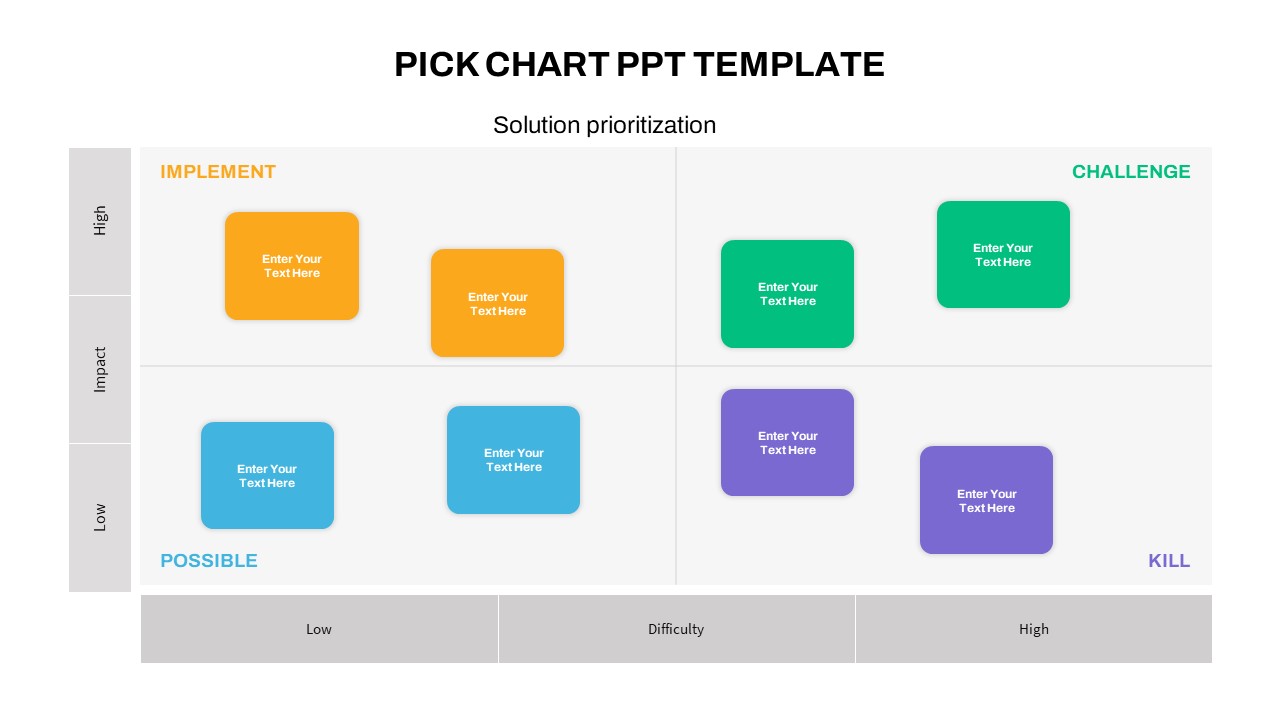
Kaizen Pick Chart PowerPoint Template
PowerPoint Templates
Premium
-

Demographic Transition PowerPoint Template
PowerPoint Templates
Premium
-
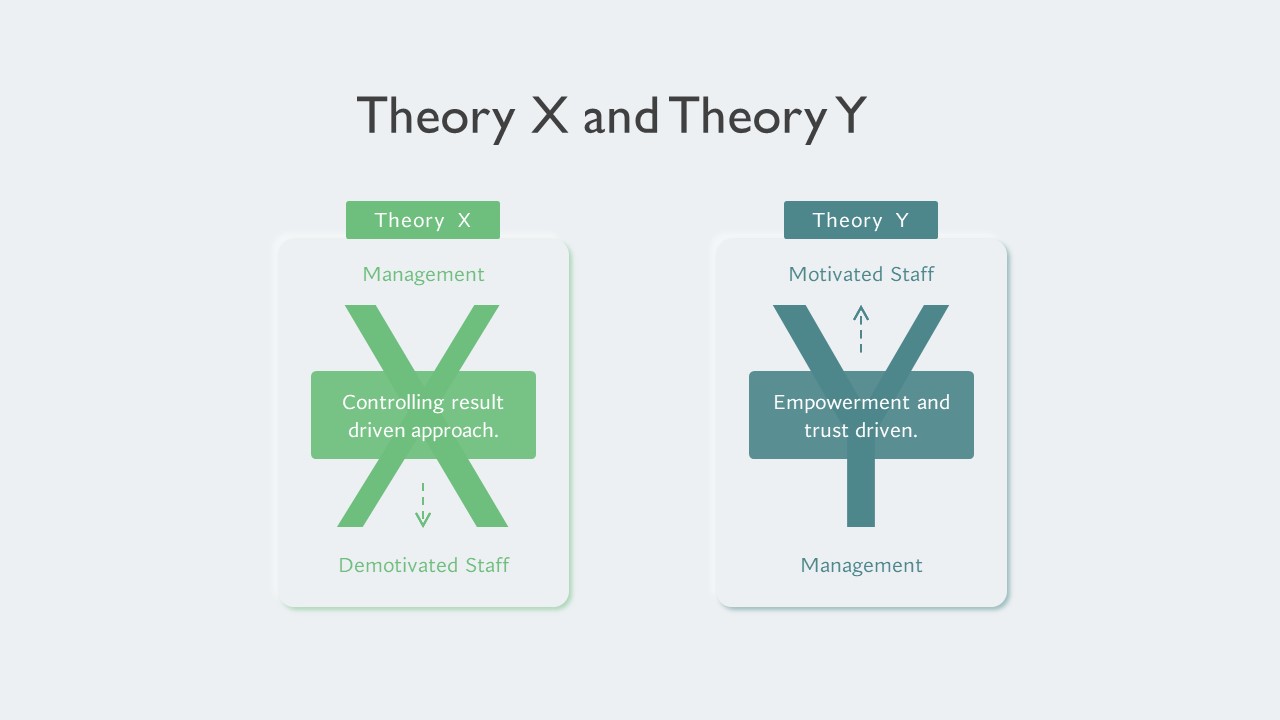
McGregor’s Theory X and Theory Y Template
Diagrams
Premium
-
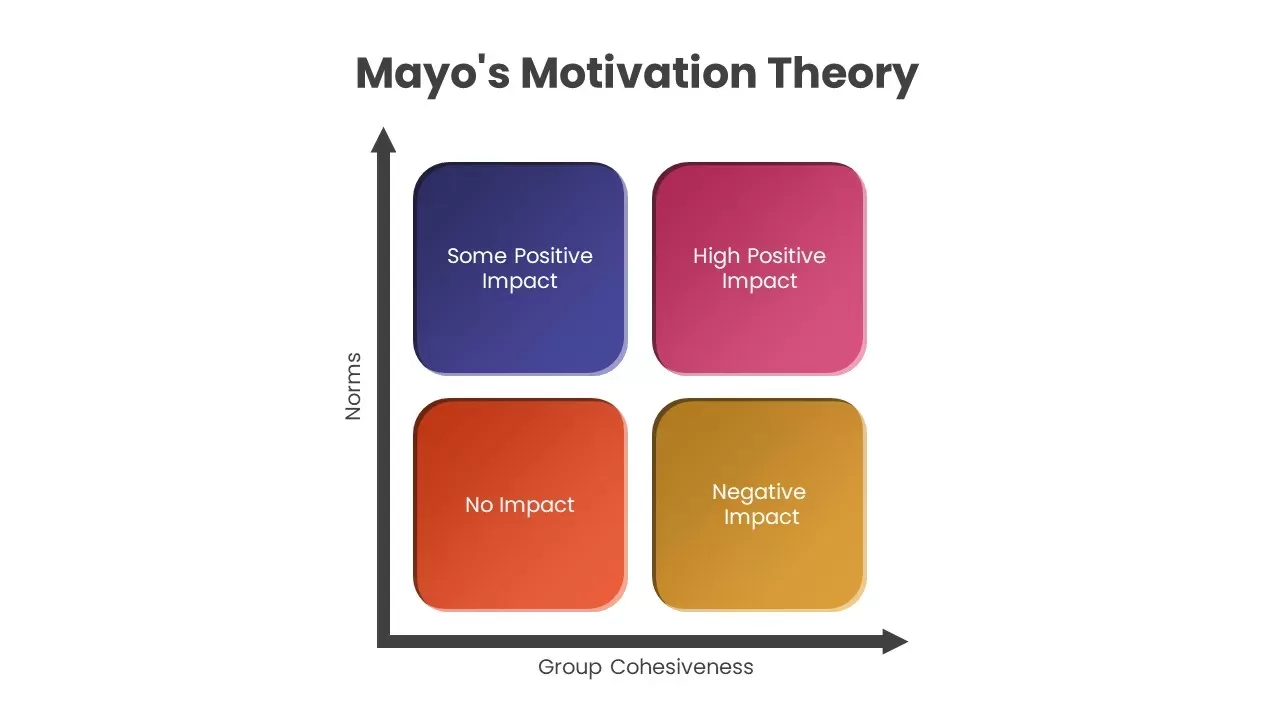
Mayo’s Motivation Theory
Business Models
Premium
-

Metaphor Leadership PowerPoint Templates and Keynote template
Keynote Templates
Premium
-
Leadership Pipeline Template
Flow Charts
Premium
-
Level 5 Leadership Pyramid Template
3D Shapes
Premium
-
SBI Feedback PowerPoint Template
PowerPoint Templates
Premium
-
Four Quadrant Scatter Chart PowerPoint Template
PowerPoint Charts
Premium
-
4 Important Organizational Elements PowerPoint and Keynote Slides
Diagrams
Premium
-

Ego states template
Metaphor, Simile & Analogy
Premium
-
Maslow’s Hierarchy of Needs Theory of Motivation
Pyramid
Premium
-
Theory X & Theory Y Template for PowerPoint and Keynote
PowerPoint Business Templates
Premium
-
Locke’s Goal-Setting Theory
PowerPoint Templates
Premium
-
Bandura’s Self-Efficacy Theory
PowerPoint Templates
Premium
-
McGregor’s Theory X And Theory Y Slide
PowerPoint Templates
Premium
-
Vroom Yetton Model Template
Diagrams
Premium
-
Leader Boss Difference PowerPoint Template
PowerPoint Templates
Premium
-
Blake and Mouton Managerial Grid
Text and Table
Premium
-
Accountability Ladder PowerPoint Template
PowerPoint Templates
Premium
-
Bowman’s Strategy Clock Diagram for PowerPoint
Business Models
Premium
-

Incentive Theory of Motivation
PowerPoint Templates
Premium
-
Cognitive Behavioral Therapy PowerPoint Template
Keynote Templates
Premium
-
Wheel Of Change PowerPoint Template
Circular Diagrams
Premium
-
Ladder Of Inference Template
Metaphor, Simile & Analogy
Premium
-
Six Box Model template
Circular Diagrams
Premium
-
The Katzenbach And Smith Model Effective Teamwork PowerPoint Template
PowerPoint Templates
Premium
-
Inner Work Life Theory PowerPoint Template
PowerPoint Templates
Premium
-
Vroom’s Expectancy Theory
PowerPoint Templates
Premium
-
Power Interest Grid PowerPoint Template
PowerPoint Templates
Premium
-

Free PowerPoint Gantt Chart Template
PowerPoint Charts
Free
-
Mintzberg Managerial Roles
Tables
Premium
-
5 Step Creative Circular Diagram Design for PowerPoint and Keynote
Circular Diagrams
Premium
-

Free Management Deck Template
PowerPoint Templates
Free
-
Value Discipline Model PowerPoint Template
Diagrams
Premium
-
Smart Goals PowerPoint Template and Keynote Presentation
Business Models
Premium
-
PCI (People Centered Implementation) Diagram for PowerPoint & Keynote
Circular Diagrams
Premium
-
Pros and Cons PowerPoint Template Diagram with Arrow
Arrow Diagrams
Premium
-
DeGraff’s Competing Values Diagram for PowerPoint
PowerPoint Templates
Premium
-
Herzberg’s Hygiene and Motivational Factors PPT
Business Models
Premium
-

Gartner Magic Quadrant PowerPoint Template
Business Models
Premium
-
SCARF Model PowerPoint Template
PowerPoint Templates
Premium
-
4 and 6 Section Circle Diagram PowerPoint Template and Keynote Slide
Circular Diagrams
Premium
-
Split Representation Donut Chart Template for PowerPoint and Keynote
Keynote Templates
Premium
-
Hofstede’s Cultural Dimensions Framework
Text and Table
Premium
-
Team Based Org Structure Chart PowerPoint Template
PowerPoint Templates
Premium
-
Value Based Management Template
PowerPoint Templates
Premium
-
Car Companies Sales Pie Chart Template for PowerPoint & Keynote
Column and Bar chart
Premium
-

Waterfall Column Chart PowerPoint Template
Column and Bar chart
Premium
-

Pencil Bar Chart PowerPoint Template and Keynote Slide
Column and Bar chart
Premium
-

Motivation PowerPoint Template
PowerPoint Templates
Premium
-
Herzberg’s Two Factor Theory
Diagrams
Premium
-
8 Leadership Philosophies
Diagrams
Premium
-
Bowman’s Strategy Clock PowerPoint Template & Keynote Diagram
Business Models
Premium
-
Org Chart PowerPoint Presentation Template
PowerPoint Charts
Premium
-
Adam’s Equity Theory
PowerPoint Templates
Premium
-
McClelland Theory of Motivation PPT
PowerPoint Templates
Premium
-
Business Goals PowerPoint Template and Keynote Slide
Business Models
Premium
-
4 Stage Process Cycle PowerPoint Template & Keynote Diagram
Circular Diagrams
Premium
-
Value Discipline Model PowerPoint Template
Business Models
Premium
-

Data Over Time Line Chart PowerPoint Template
PowerPoint Charts
Premium
-
Creative Organization Chart PowerPoint Template
Org Charts
Premium
-

Cone Chart PowerPoint Template
Column and Bar chart
Premium
-

Tuckman’s Team Development Model PowerPoint
Business Models
Premium
-
Horizontal Hierarchy Chart Template for PowerPoint and Keynote
Keynote Templates
Premium
-
Four Keys Hierarchy Chart PowerPoint Template and Keynote Slide
Flow Charts
Premium
-
Lencioni Trust Pyramid PowerPoint Template
Pyramid
Premium
-
Gantt Chart PowerPoint Template & Keynote Slide
Agenda
Premium
-
Distribution of Employees into Personality Classification PPT
Business Models
Premium
-
Maslow’s Hierarchy of Needs PowerPoint Template & Keynote Slide
Pyramid
Premium
-
Donut Chart Split Deep Dive Chart Template For PowerPoint and Keynote
Keynote Templates
Premium
-
Maslow’s Hierarchy of Needs
PowerPoint Templates
Premium
-
Free User Buyer PowerPoint Persona Template
Mock Up
Free
-
Combination Chart PowerPoint Template
PowerPoint Charts
Premium
-

Product Comparison Bar Chart Template for PowerPoint and Keynote
PowerPoint Charts
Premium
-
Activity Based Costing Template for PowerPoint and Keynote
PowerPoint Templates
Premium
-
Target Goals PowerPoint Template
Business Models
Premium
-
Progress Chart PowerPoint Template
PowerPoint Templates
Premium
-
Enneagram Diagram PowerPoint Template
Circular Diagrams
Premium
-
Four Way Diagram PowerPoint Template & Keynote
Diagrams
Premium
-

Waffle Chart PowerPoint Template
PowerPoint Templates
Premium
-
Goals Infographic PowerPoint Template
Business Models
Premium
-
Horizontal Org Chart PowerPoint Template
Org Charts
Premium
-
VUCA World PowerPoint Template
Business Models
Premium
-
Set of Chart PowerPoint Template and Keynote Diagram
PowerPoint Charts
Premium
-
Structured Layer Diagram Template for PowerPoint and Keynote
Diagrams
Premium
-
HR Org Chart PowerPoint Template
PowerPoint Templates
Premium
-
Radial Bar Chart PowerPoint Templates and Keynote Slides
PowerPoint Charts
Premium
-
Porter’s Generic Strategy PowerPoint Template
Business Models
Premium
-
Flip Chart PowerPoint Template
PowerPoint Templates
Premium
-
PowerPoint Thermometer Chart Template
PowerPoint Templates
Premium


