Home » PowerPoint Charts » Simple Scatter Chart PowerPoint Template
Simple Scatter Chart PowerPoint Template
- Version
- Download 5
- File Size 0.00 KB
- File Count 1
- Create Date July 2, 2023
- Last Updated June 28, 2023
Simple Scatter Chart PowerPoint Template
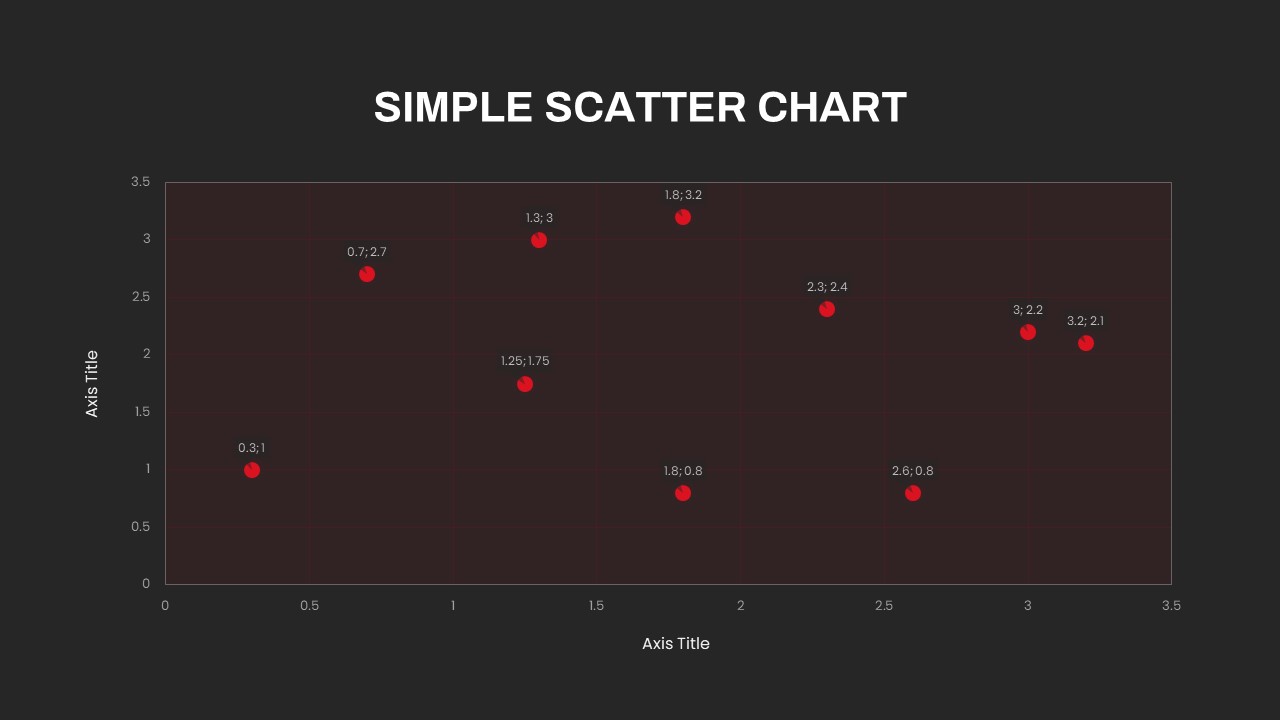
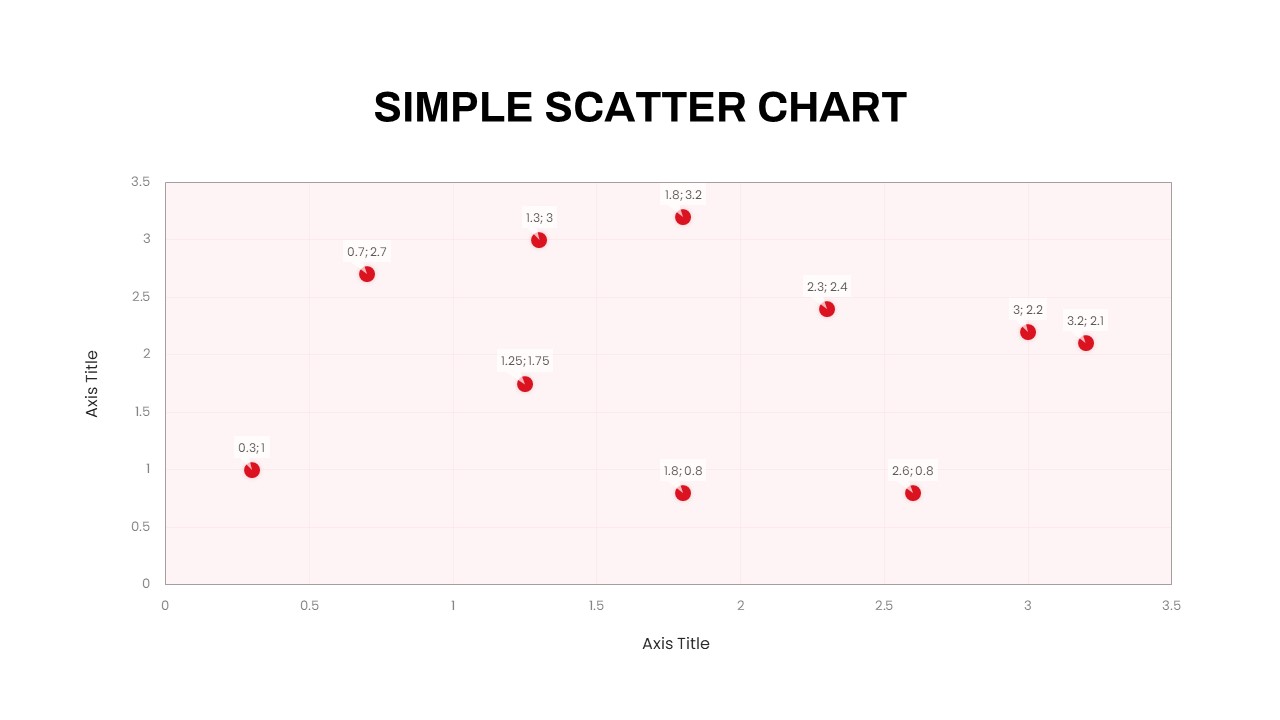
The scatter chart PowerPoint template offers a simple data analysis tool. This is a widely used data analysis tool for presenting statistical data. It is specifically designed for conducting statistical studies, making it suitable for users from various fields to showcase their research results. Scatter plot charts effectively analyse the relationship between two distinct sets of variables and determine the level of correlation between them. By combining numerical values from two axes, these charts display data points that visually represent the relationship between the variables. These data points allow viewers to easily grasp whether the variables have a close or no relation. With its eye-catching design and ability to convey complex statistical information, this scatter chart PowerPoint template is ideal for presenting research findings and data analysis results.
The scatter chart template for PowerPoint presentations utilizes dots to visually represent values for different numeric variables. Each dot's position on the horizontal and vertical axis corresponds to the values of an individual data point. PowerPoint scatter plots are commonly employed to analyze relationships between variables. This template allows users to customize their points within the PowerPoint graph. For instance, presenters can add axis titles at the bottom and left side of the template. Additionally, users can input specific values directly onto the scatter plot, enabling clear and precise data representation. By offering flexibility and customization options, this template provides an effective means for presenting and exploring data relationships visually appealingly.
The scatter chart PPT template is created in two background colors. The black and white background ppt looks very different from one another. The presenter can choose background options according to their aesthetics. Besides, if they want a diverse color background, they can use edit options to fill with. The scatter plot PowerPoint is ideal for performance assessment and progress report presentation. Download PowerPoint data charts for statistics.
Attached Files
| File |
|---|
| https://premiumdownloads.s3.amazonaws.com/SB03612-Simple Scatter Chart PowerPoint Template.ZIP |
Login to download this file
Add to favorites
Add to collection
-
Item ID
SB03612 -
Rating
0.0
(0 reviews)
Tags
Related Templates
-

Research Proposal PowerPoint Template
PowerPoint Templates
Premium
-

Segmented Scatter Chart PowerPoint Template
PowerPoint Charts
Premium
-

Free Nursing Capstone PowerPoint Deck
PowerPoint Templates
Free
-

Nature PowerPoint Presentation Template
PowerPoint Business Templates
Premium
-

Free Vertical PowerPoint Template
PowerPoint Business Templates
Free
-

Cab Service PowerPoint Template
PowerPoint Templates
Premium
-

Sales Deck Free PowerPoint Template
PowerPoint Templates
Free
-

Free Space Minimal Deck Template
PowerPoint Templates
Free
-

VET Clinic PowerPoint Template
PowerPoint Templates
Premium
-

Gym PowerPoint Template
PowerPoint Templates
Premium
-

Free Physical Education PowerPoint Template Deck
Free PowerPoint Templates
Free
-

Travel Agency PowerPoint Template
PowerPoint Templates
Premium
-

IoT Presentation Template
PowerPoint Templates
Premium
-
Four Quadrant Scatter Chart PowerPoint Template
PowerPoint Charts
Premium
-

Effective Communication PowerPoint Template
PowerPoint Templates
Premium
-

PowerPoint Quiz With Timer
PowerPoint Templates
Premium
-
Graph Paper PowerPoint Template Deck
PowerPoint Templates
Premium
-
Macroeconomics PowerPoint Template
PowerPoint Templates
Premium
-

Free Book Review PowerPoint Template
Free PowerPoint Templates
Free
-

Free Economics PowerPoint Template
Free PowerPoint Templates
Free
-
Free Charity PowerPoint Template Deck
PowerPoint Templates
Free
-

Free Army PowerPoint Template
PowerPoint Templates
Free
-
Customer Experience Loyalty PowerPoint Deck Template
PowerPoint Templates
Premium
-

Free Aviation PowerPoint Template
Free PowerPoint Templates
Free
-
Free Charts & Graphs Deck PowerPoint Template
PowerPoint Templates
Free
-

Free University Presentation PowerPoint Template
PowerPoint Templates
Free
-

Animated Agriculture PowerPoint Deck Template
PowerPoint Templates
Premium
-

Free Real Estate Listing PowerPoint Template
Free PowerPoint Templates
Free
-

Free Cartoon PowerPoint Template
Free PowerPoint Templates
Free
-

Free Event Planning PowerPoint Template
Free PowerPoint Templates
Free
-
Bubble Chart PowerPoint Template
PowerPoint Templates
Premium
-

Data Science PowerPoint Template
PowerPoint Templates
Premium
-

X Y Bubble Chart PowerPoint Template
PowerPoint Charts
Premium
-

Global Warming Infographic PowerPoint Template Deck
PowerPoint Templates
Premium
-
Annual Report PowerPoint Template and Keynote
PowerPoint Templates
Premium
-

Spline Chart PowerPoint Template
PowerPoint Charts
Premium
-
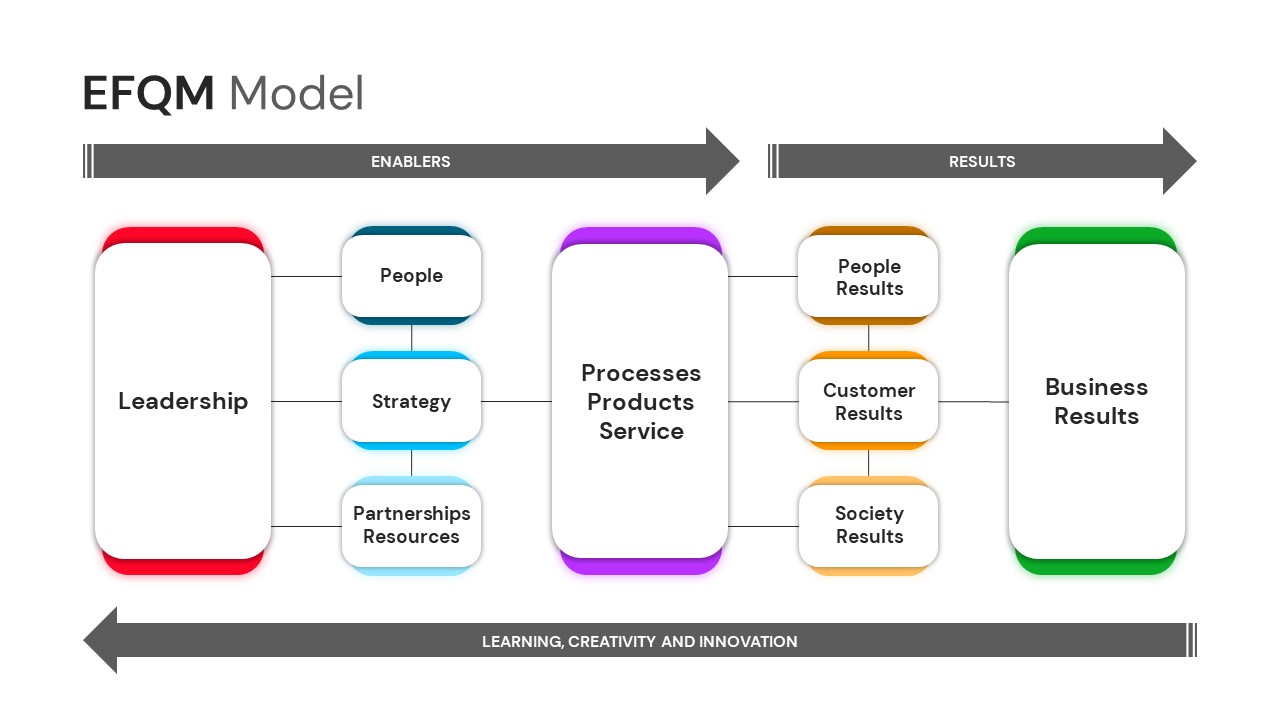
EFQM Model PowerPoint Template
PowerPoint Templates
Premium
-

Real Estate PowerPoint Theme
PowerPoint Themes
Premium
-
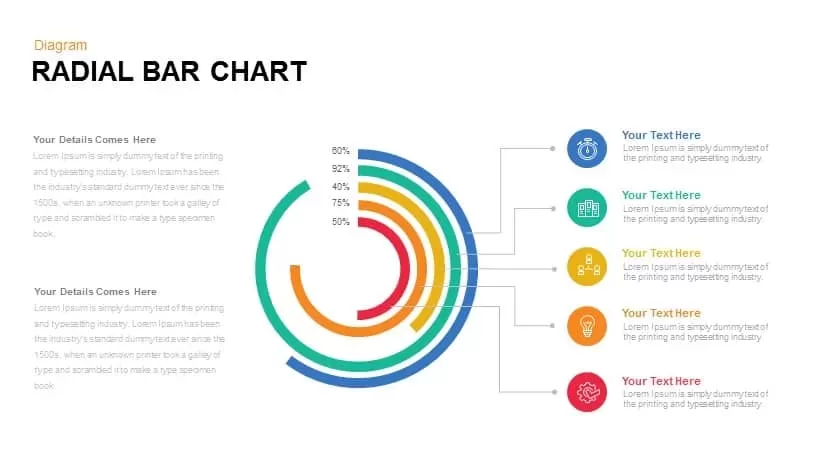
Radial Bar Chart PowerPoint Templates and Keynote Slides
PowerPoint Charts
Premium
-
Free Charts and Graphs PowerPoint Template
PowerPoint Templates
Free
-
QC Tools PowerPoint Template
Infographic
Premium
-

Area Chart PowerPoint Template
PowerPoint Charts
Premium
-
Combination Chart PowerPoint Template
PowerPoint Charts
Premium
-

Free Dunder Mifflin Paper Company Pitch Deck
Free PowerPoint Templates
Free
-
Core Values Sections PowerPoint Template and Keynote
Business Models
Premium
-
Grouped Column Chart PowerPoint Template
Column and Bar chart
Premium
-
Mekko Chart Template
PowerPoint Templates
Premium
-

Free AI Artificial Intelligence PowerPoint Template
PowerPoint Templates
Free
-
Research Roadmap PowerPoint Template
PowerPoint Templates
Premium
-

Tornado Chart PowerPoint template and keynote Slide
Diagrams
Premium
-
Waterfall Bar Chart PowerPoint Template
PowerPoint Charts
Premium
-

Research Presentation PowerPoint Template Free
PowerPoint Templates
Free
-
Proportional Area Chart PowerPoint Template
PowerPoint Templates
Premium
-
Arrow Line Chart PowerPoint Template
Arrow Diagrams
Premium
-
Stakeholder Register PowerPoint Template
PowerPoint Templates
Premium
-

Clustered Column Chart PowerPoint Template
PowerPoint Charts
Premium
-
Multiple Line Chart PowerPoint Template
PowerPoint Charts
Premium
-
Set of Chart PowerPoint Template and Keynote Diagram
PowerPoint Charts
Premium
-

Biotechnology PowerPoint Presentation Template
PowerPoint Templates
Premium
-

Data Driven Line Chart Template for PowerPoint & Keynote
Curves and Lines
Premium
-
Clustered Bar Chart PowerPoint Template
Column and Bar chart
Premium
-
Radar Chart Product Comparison PowerPoint Template
Business Models
Premium
-
Vertical Dot Chart PowerPoint Template
PowerPoint Charts
Premium
-

Data Over Time Line Chart PowerPoint Template
PowerPoint Charts
Premium
-
Business Process Reengineering Template
PowerPoint Templates
Premium
-

Animated Upcoming Event Poster PowerPoint Template
PowerPoint Templates
Premium
-

Research PowerPoint Template and Metaphor Keynote Template
Keynote Templates
Premium
-

Case Study PowerPoint and Keynote Template
PowerPoint Templates
Premium
-
Creative Bar Chart Analysis PowerPoint Template and Keynote
Column and Bar chart
Premium
-

Waterfall Column Chart PowerPoint Template
Column and Bar chart
Premium
-

Creative Bar Chart Data Analysis PowerPoint Template and Keynote
Infographic
Premium
-

Open Door Policy PowerPoint Template
PowerPoint Templates
Premium
-

Waterfall Chart PowerPoint Template
PowerPoint Charts
Premium
-
Progress Chart PowerPoint Template
PowerPoint Templates
Premium
-
Weekly Data Charts PowerPoint Presentation Template and Keynote Slide
Infographic
Premium
-

3 Bar Chart PowerPoint Template and Keynote Slide
Column and Bar chart
Premium
-
Bar of Pie Chart PowerPoint Template
PowerPoint Templates
Premium
-
Survey Results PowerPoint Template Free
Free PowerPoint Templates
Free
-
Root Cause Analysis PowerPoint Template
Arrow Diagrams
Premium
-
Donut Split Analysis Chart PowerPoint Template and Keynote Slide
Infographic
Premium
-
Free 3d Pie Chart PowerPoint Template & Keynote slide
Pie & Donut
Free
-

Power Analogy Metaphor PowerPoint Template
Metaphor, Simile & Analogy
Premium
-
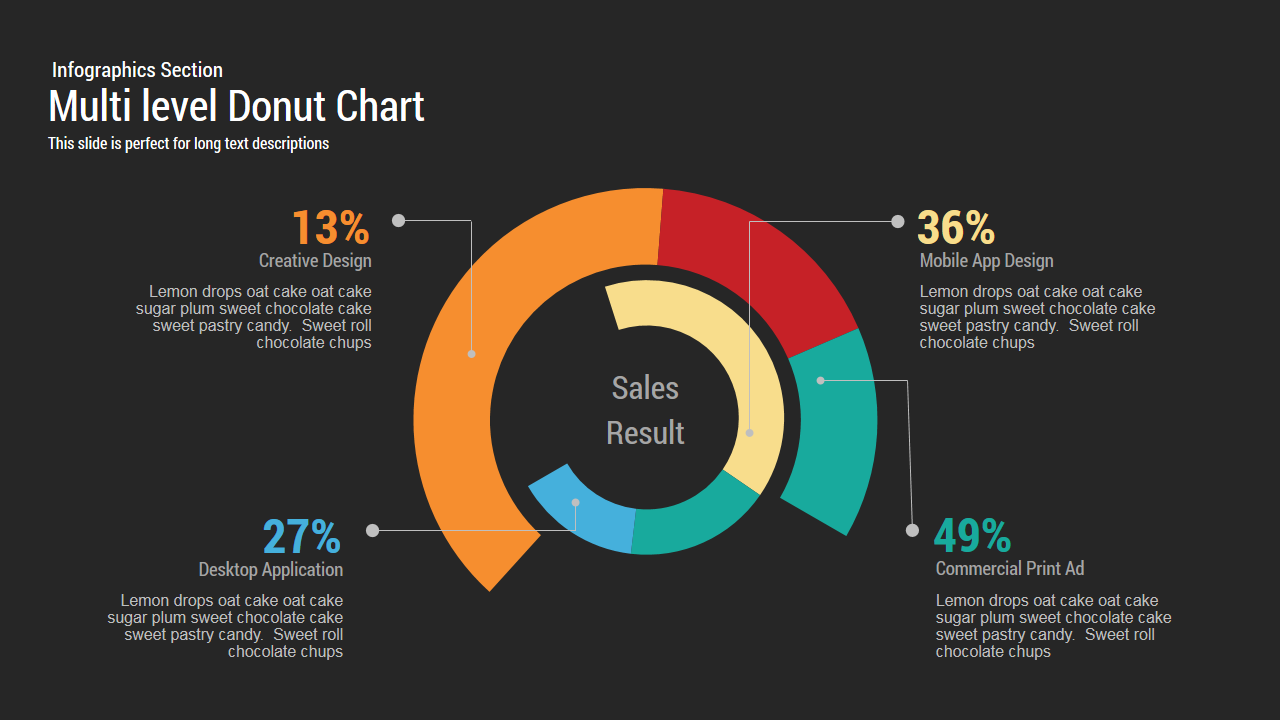
Multi level Donut Chart Template for PowerPoint and Keynote
PowerPoint Charts
Premium
-
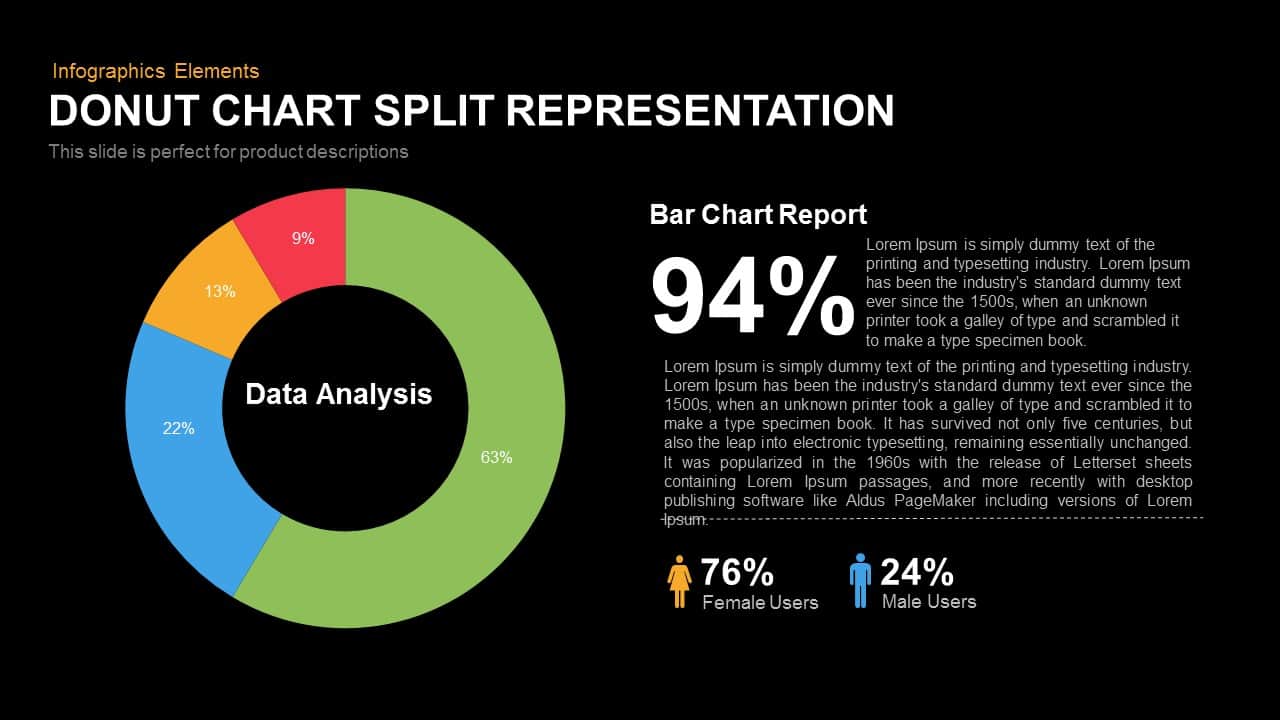
Split Representation Donut Chart Template for PowerPoint and Keynote
Keynote Templates
Premium
-
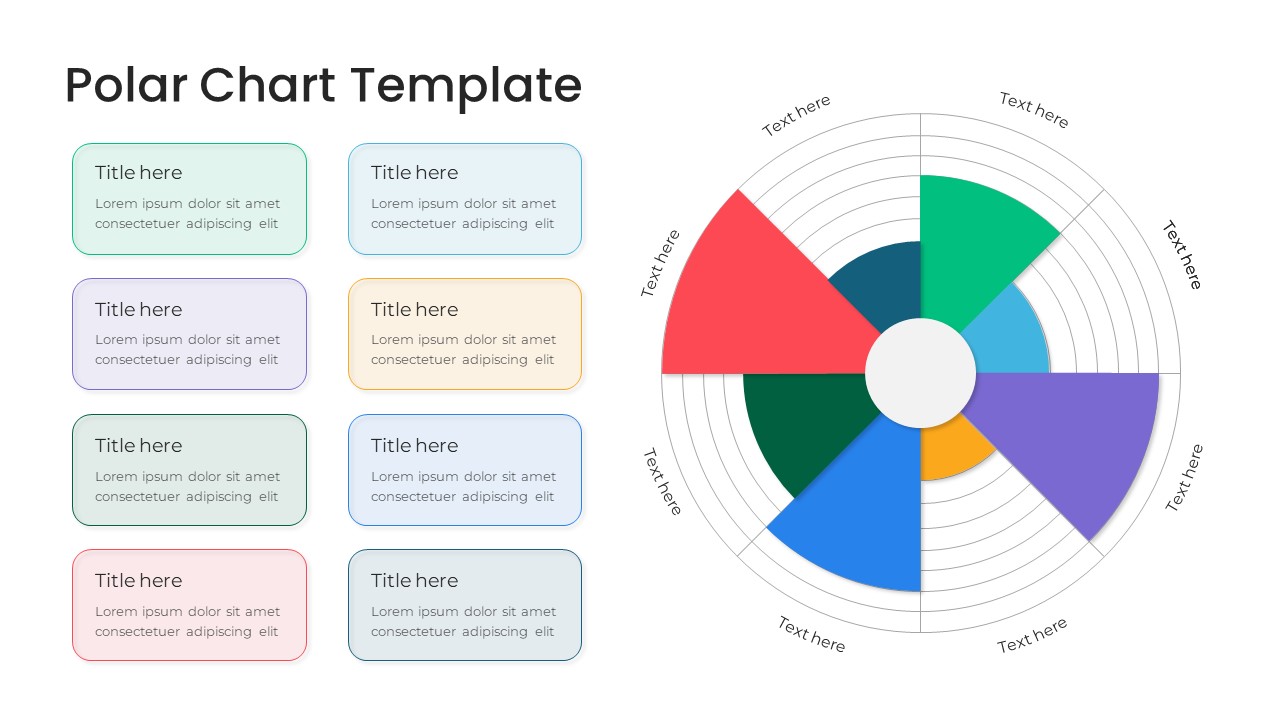
Polar Chart PowerPoint Template
PowerPoint Templates
Premium
-

Cylinder Bar Chart PowerPoint Template and Keynote Slide
Column and Bar chart
Premium
-
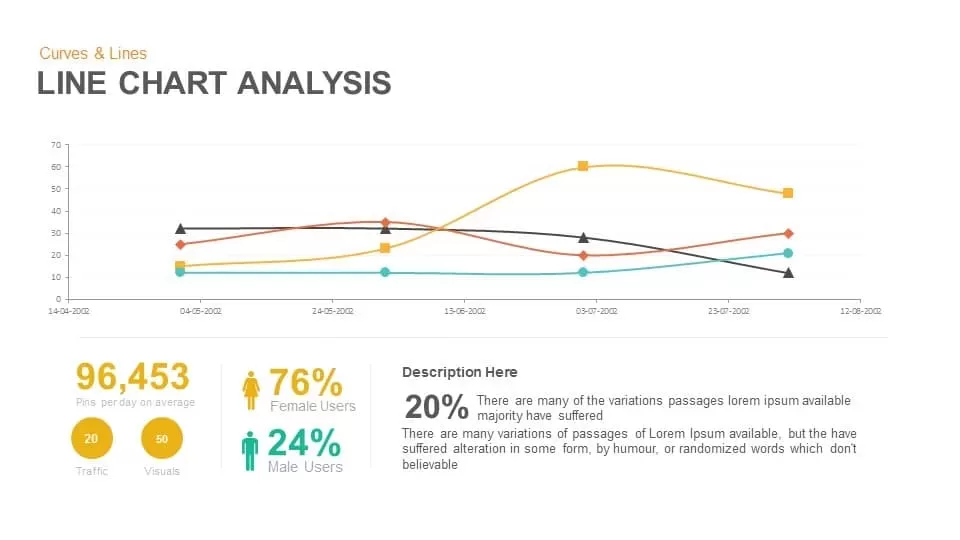
Line Chart Analysis PowerPoint Template and Keynote Slide
Curves and Lines
Premium
-
Free Simple Column Chart PowerPoint Template
Column and Bar chart
Free
-
4 Step Core Values PowerPoint Template
Business Models
Premium
-
Pie Chart PowerPoint Template
Infographic
Premium
-
Evolution Line Chart PowerPoint Template
PowerPoint Templates
Premium
-
Animated Clustered Bar Chart PowerPoint Template
PowerPoint Charts
Premium
-

Sun Burst Chart PowerPoint Template
Circular Diagrams
Premium
-
Comparison Donut Chart PowerPoint Template and Keynote
Keynote Templates
Premium
-

Line Chart Representation PowerPoint Templates and Keynote Slides
PowerPoint Charts
Premium
-

Waffle Chart PowerPoint Template
PowerPoint Templates
Premium
-

Jump Line Chart PowerPoint Template
Column and Bar chart
Premium
-

Simple Bar Chart PowerPoint Template
Column and Bar chart
Premium
-
Timeline Bar Chart PowerPoint
Column and Bar chart
Premium
-
Radial Bar Chart Template for PowerPoint and Keynote
Circular Diagrams
Premium


