


Segmented Scatter Chart PowerPoint Template
- Version
- Download 10
- File Size 0.00 KB
- File Count 1
- Create Date May 4, 2024
- Last Updated May 23, 2024
Segmented Scatter Chart PowerPoint Template
Unlock Data Clarity: Segmented Scatter Chart PowerPoint Template for Profound Insights
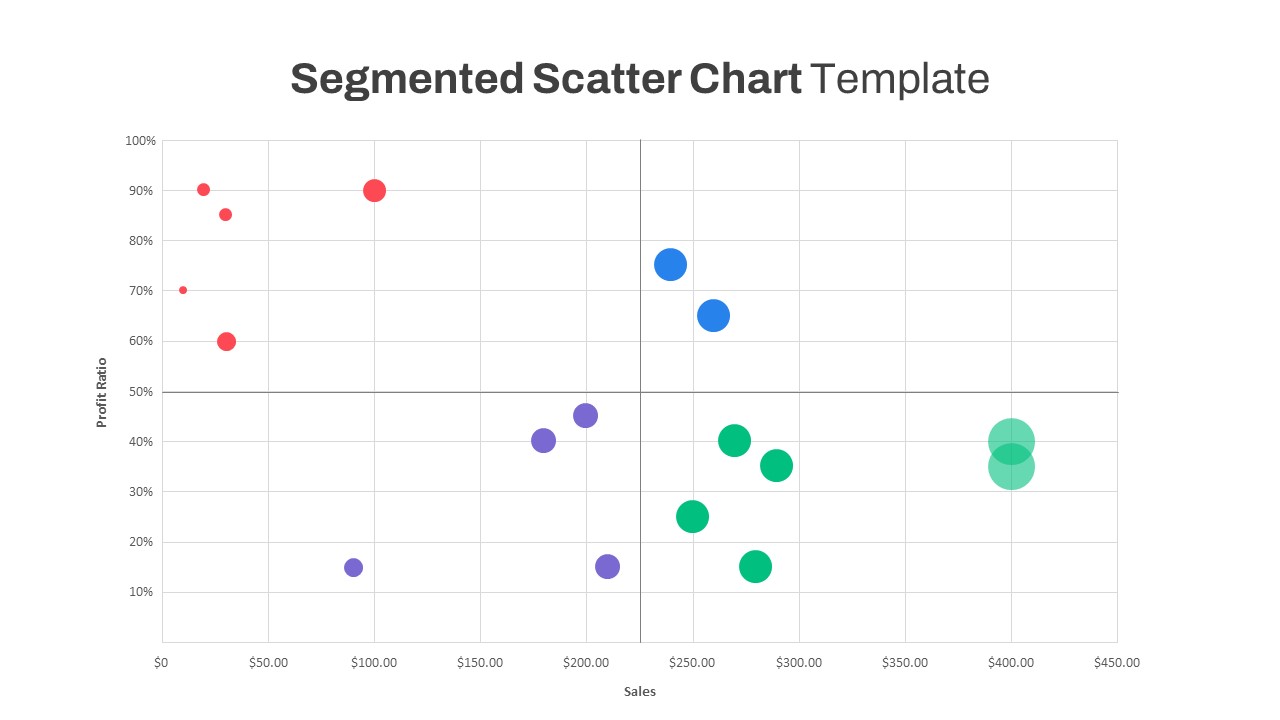
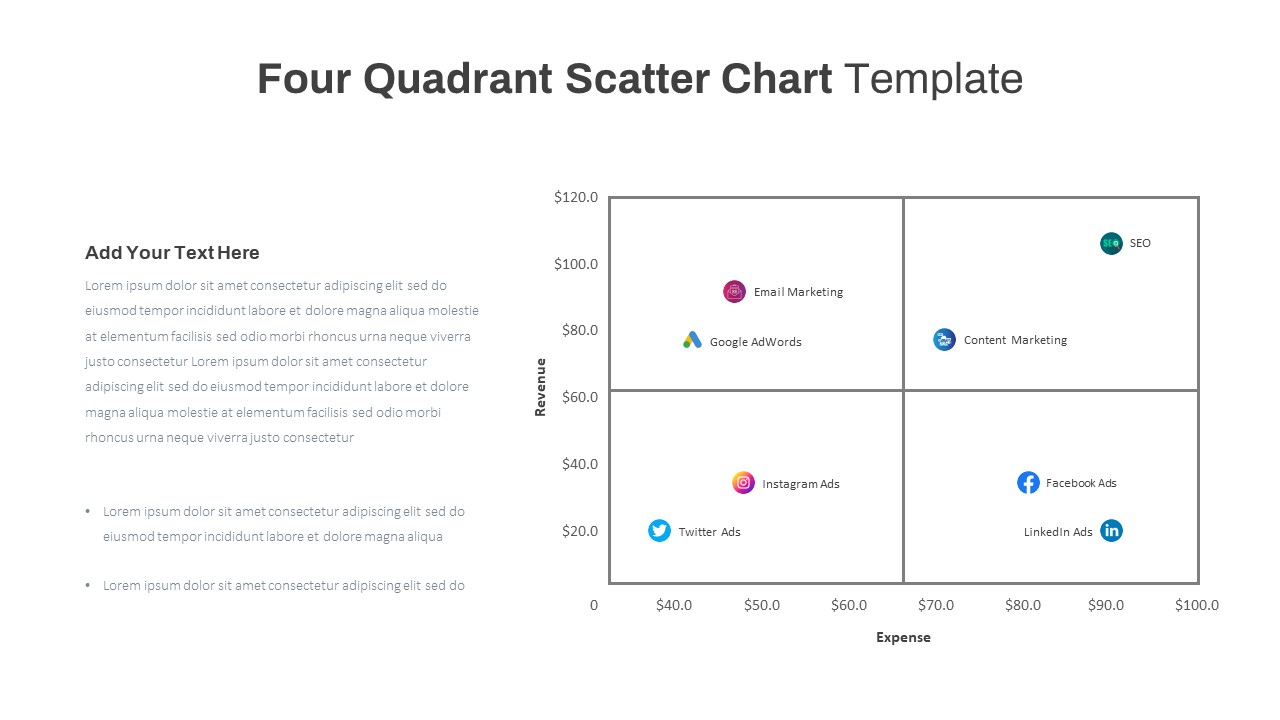
The segmented scatter chart PowerPoint template visually depicts the correlation between variables through a quadrant framework, dividing the chart into four sections. This unique presentation tool enables the clear plotting of data points on a scatter plot, facilitating the analysis of relationships between two variable dimensions. Widely utilized for its effectiveness in highlighting data patterns, the scatter chart in PowerPoint serves as a concise and powerful means of understanding and conveying complex information. Its segmented nature enhances the clarity of information, making it an indispensable visual aid for data-driven presentations and insightful analysis of variable relationships.
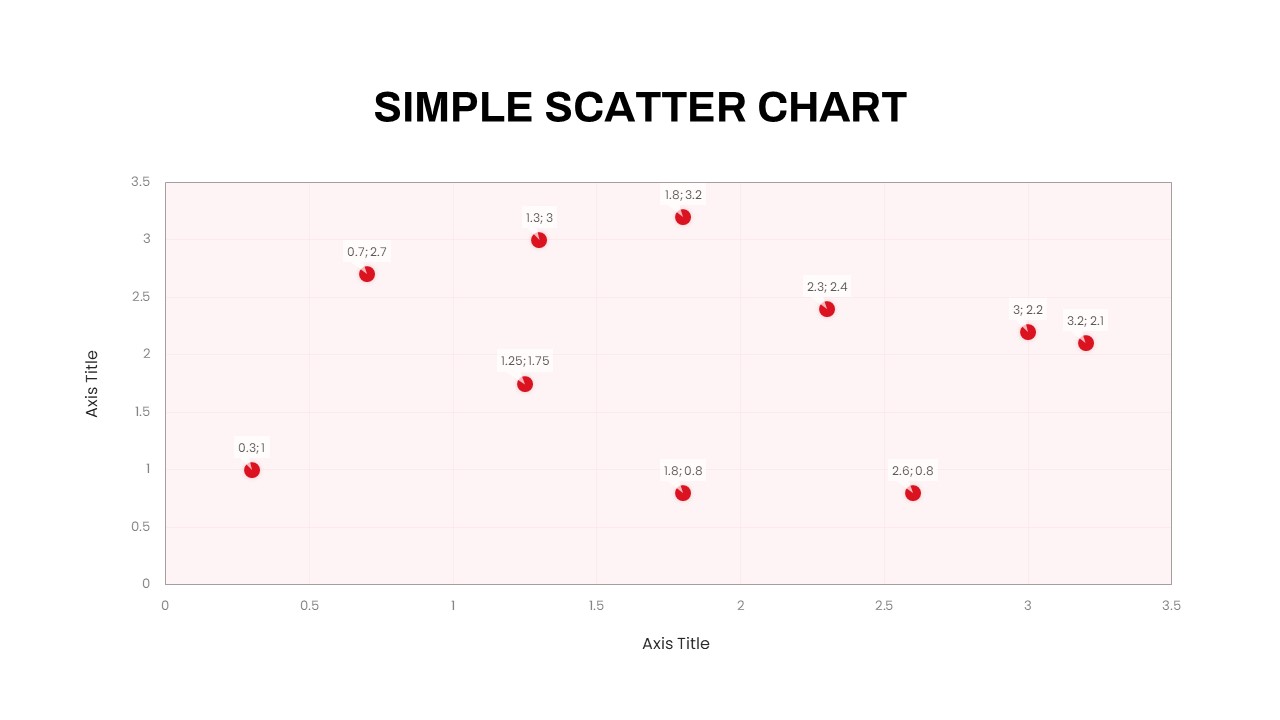
What is a scatter chart?
A scatter chart, or scatter plot is a visual tool depicting the correlation between two variables. Renowned for its analytical ability, this chart type facilitates a swift understanding of relationships or trends that might elude detection in alternative formats. By presenting data points on a two-dimensional plane, it offers a natural snapshot of the interplay between factors. Its inherent ability to unveil patterns and associations makes it an invaluable asset for conveying complex information efficiently, enabling viewers to grasp connections that might be elusive through other means of representation. In essence, a scatter chart is a dynamic visual aid for revealing intricate data relationships.
The scatter chart template for PowerPoint presentations is ideal for showcasing sales figures, market trends, or project milestones to make your data easily readable. It is best for revealing patterns, trends, and the correlation between the variables. Each marker will correspond to a value associated with that data point. This segmented scatter plot for PowerPoint presentation will be divided into sections that ease the understanding of the readers. You can show multiple data sets in a single PowerPoint chart slideshow.
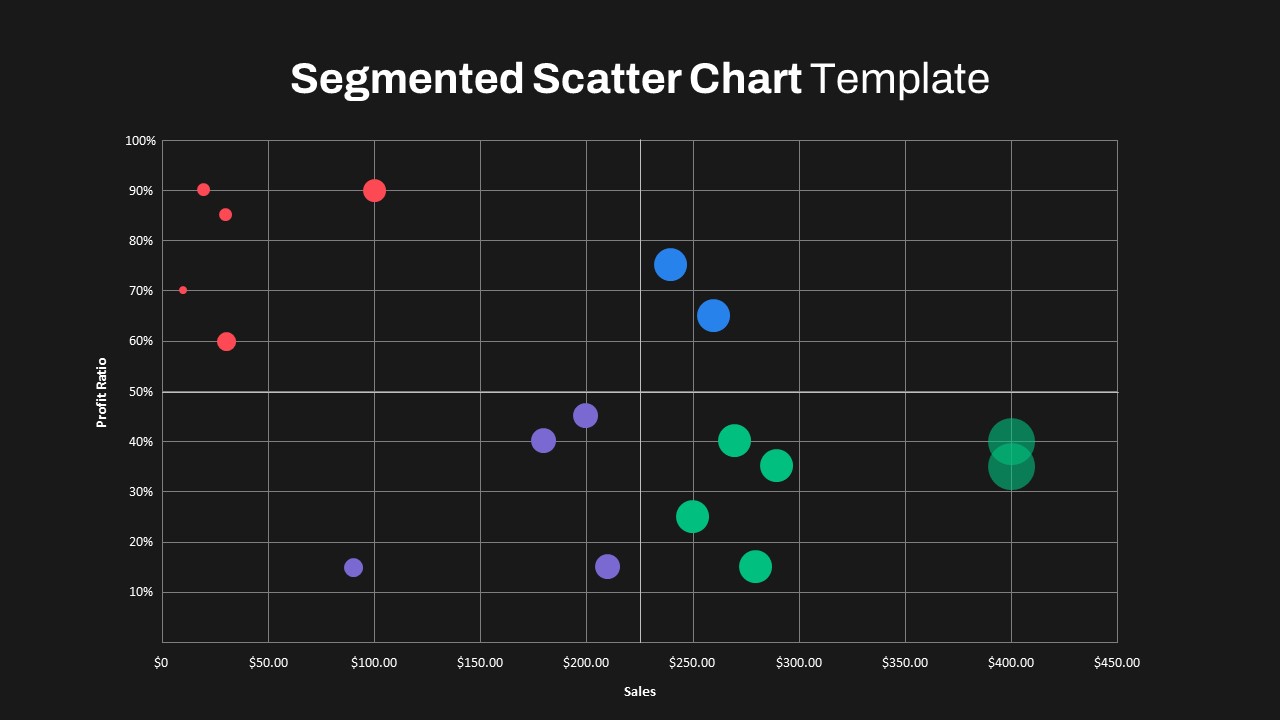
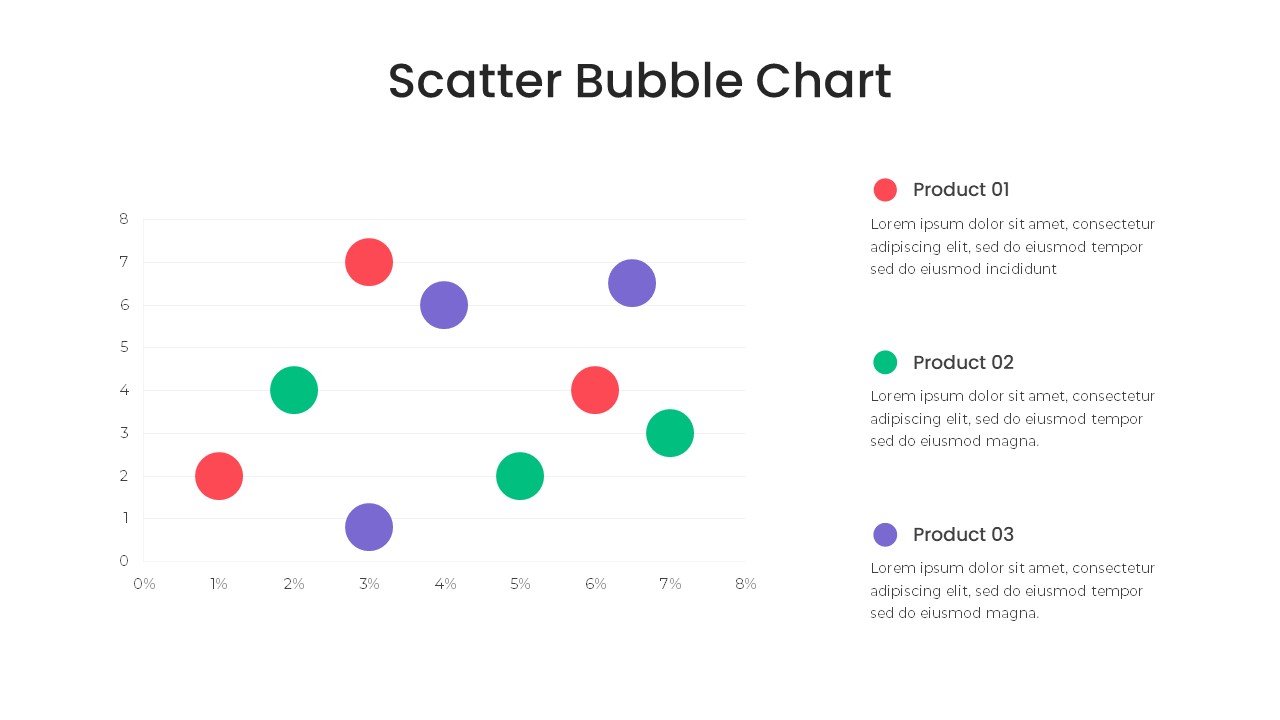
The segmented scatter chart template for PowerPoint helps business analysts, project managers, researchers, and educators show the trends and correlations in style. This slide has two backgrounds with graphical trends shown on bubble sets. Each bubble in four sections is colored in red, violet, green, and blue schemes. That will tell the story of your research outcomes. Download the Segmented Scatter Chart PowerPoint Template for business presentations.
Attached Files
| File |
|---|
| https://premiumdownloads.s3.amazonaws.com/SB03990-Segmented Scatter Chart PowerPoint Template.zip |
Login to download this file
Add to favorites
Add to collection
-

Item ID
SB03990 -

Related Templates
-
Simple Scatter Chart PowerPoint Template
PowerPoint Charts
Premium
-

Nature PowerPoint Presentation Template
PowerPoint Business Templates
Premium
-

Free Vertical PowerPoint Template
PowerPoint Business Templates
Free
-

Cab Service PowerPoint Template
PowerPoint Templates
Premium
-

Sales Deck Free PowerPoint Template
PowerPoint Templates
Free
-

Research Proposal PowerPoint Template
PowerPoint Templates
Premium
-

Free Space Minimal Deck Template
PowerPoint Templates
Free
-

Free Nursing Capstone PowerPoint Deck
PowerPoint Templates
Free
-

Travel Agency PowerPoint Template
PowerPoint Templates
Premium
-

VET Clinic PowerPoint Template
PowerPoint Templates
Premium
-

Gym PowerPoint Template
PowerPoint Templates
Premium
-

Effective Communication PowerPoint Template
PowerPoint Templates
Premium
-

Free Physical Education PowerPoint Template Deck
Free PowerPoint Templates
Free
-

IoT Presentation Template
PowerPoint Templates
Premium
-

PowerPoint Quiz With Timer
PowerPoint Templates
Premium
-
Four Quadrant Scatter Chart PowerPoint Template
PowerPoint Charts
Premium
-

Free Economics PowerPoint Template
Free PowerPoint Templates
Free
-

Macroeconomics PowerPoint Template
PowerPoint Templates
Premium
-

Graph Paper PowerPoint Template Deck
PowerPoint Templates
Premium
-

Free Book Review PowerPoint Template
Free PowerPoint Templates
Free
-

Free Army PowerPoint Template
PowerPoint Templates
Free
-

Free Charity PowerPoint Template Deck
PowerPoint Templates
Free
-

Customer Experience Loyalty PowerPoint Deck Template
PowerPoint Templates
Premium
-
Bubble Chart PowerPoint Template
PowerPoint Templates
Premium
-

Free Cartoon PowerPoint Template
Free PowerPoint Templates
Free
-

Free Event Planning PowerPoint Template
Free PowerPoint Templates
Free
-

Free Real Estate Listing PowerPoint Template
Free PowerPoint Templates
Free
-

Free Aviation PowerPoint Template
Free PowerPoint Templates
Free
-

Free University Presentation PowerPoint Template
PowerPoint Templates
Free
-

Animated Agriculture PowerPoint Deck Template
PowerPoint Templates
Premium
-
Free Charts & Graphs Deck PowerPoint Template
PowerPoint Templates
Free
-

Global Warming Infographic PowerPoint Template Deck
PowerPoint Templates
Premium
-
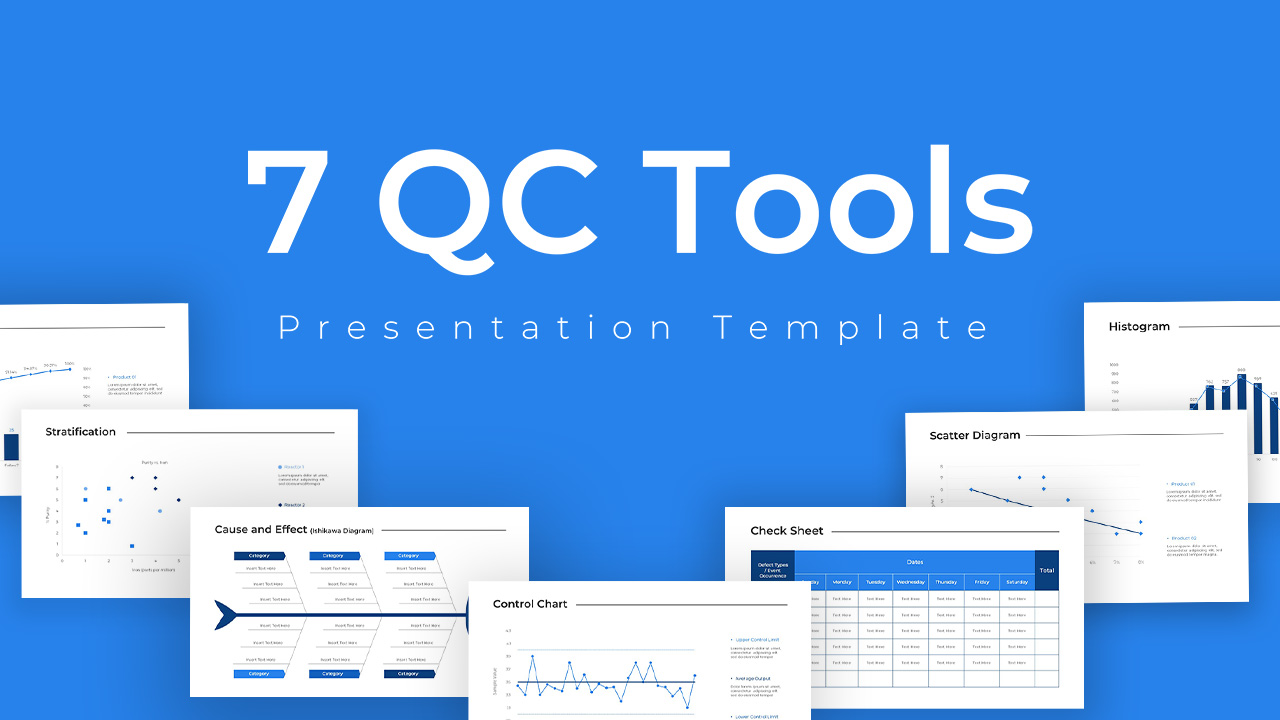
QC Tools PowerPoint Template
Infographic
Premium
-
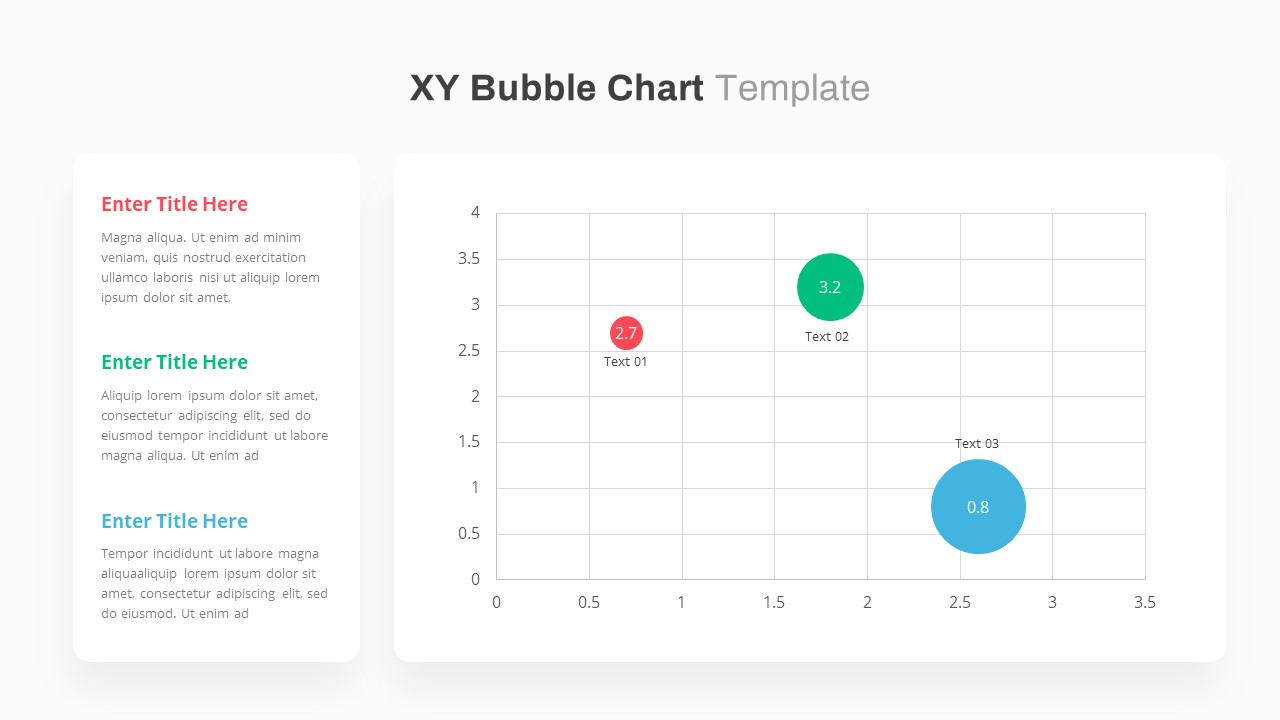
X Y Bubble Chart PowerPoint Template
PowerPoint Charts
Premium
-

Real Estate PowerPoint Theme
PowerPoint Themes
Premium
-

EFQM Model PowerPoint Template
PowerPoint Templates
Premium
-

Data Science PowerPoint Template
PowerPoint Templates
Premium
-
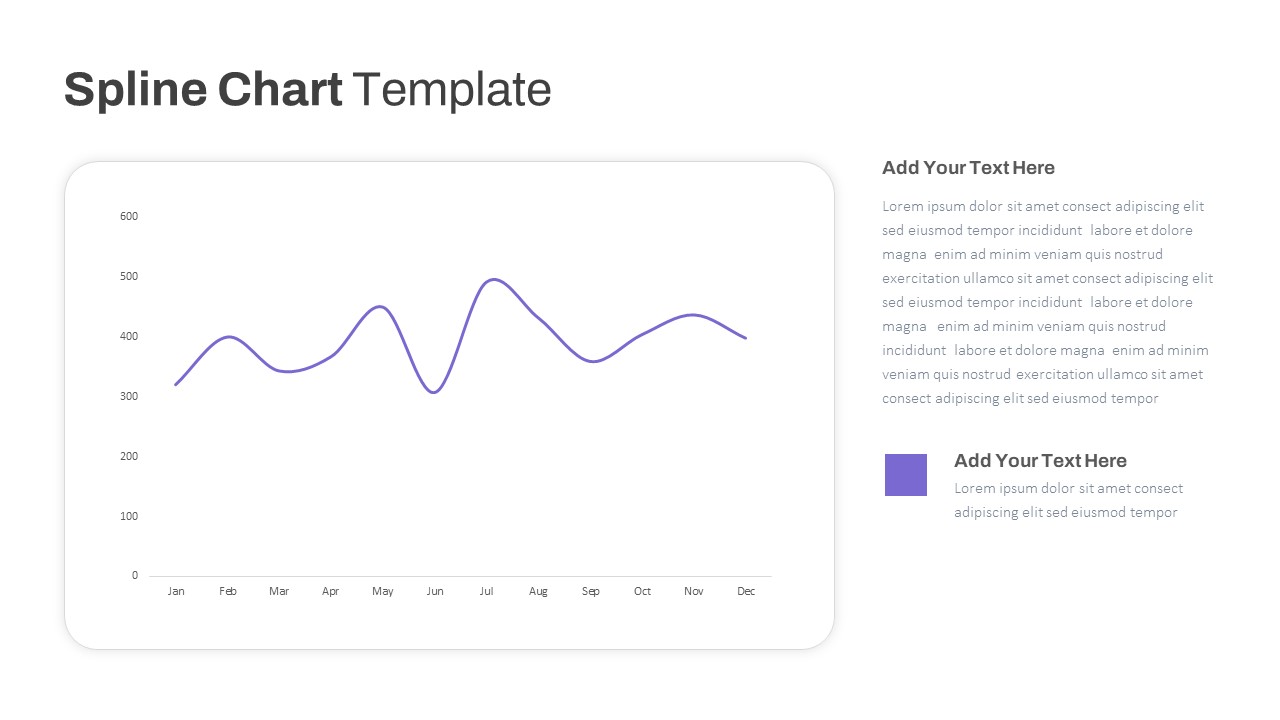
Spline Chart PowerPoint Template
PowerPoint Charts
Premium
-

Annual Report PowerPoint Template and Keynote
PowerPoint Templates
Premium
-

Free Dunder Mifflin Paper Company Pitch Deck
Free PowerPoint Templates
Free
-

Proportional Area Chart PowerPoint Template
PowerPoint Templates
Premium
-
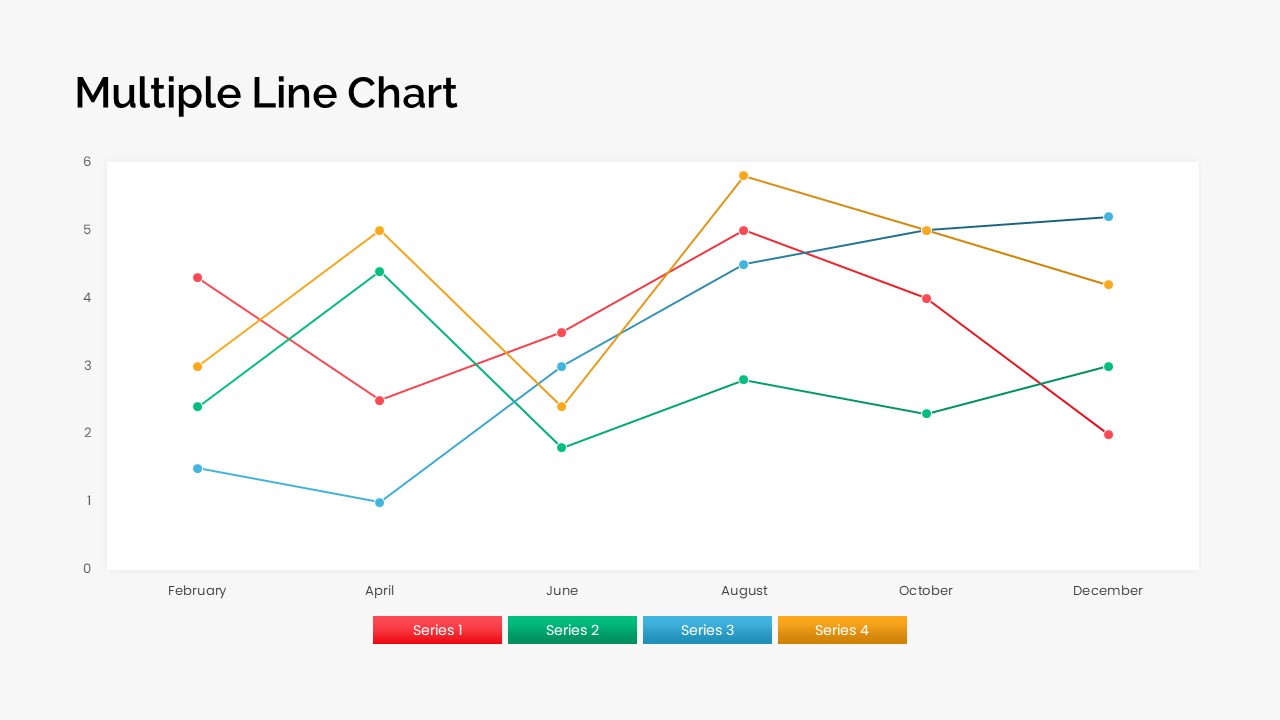
Multiple Line Chart PowerPoint Template
PowerPoint Charts
Premium
-

Free AI Artificial Intelligence PowerPoint Template
PowerPoint Templates
Free
-

Combination Chart PowerPoint Template
PowerPoint Charts
Premium
-

Mekko Chart Template
PowerPoint Templates
Premium
-

Stakeholder Register PowerPoint Template
PowerPoint Templates
Premium
-

Area Chart PowerPoint Template
PowerPoint Charts
Premium
-
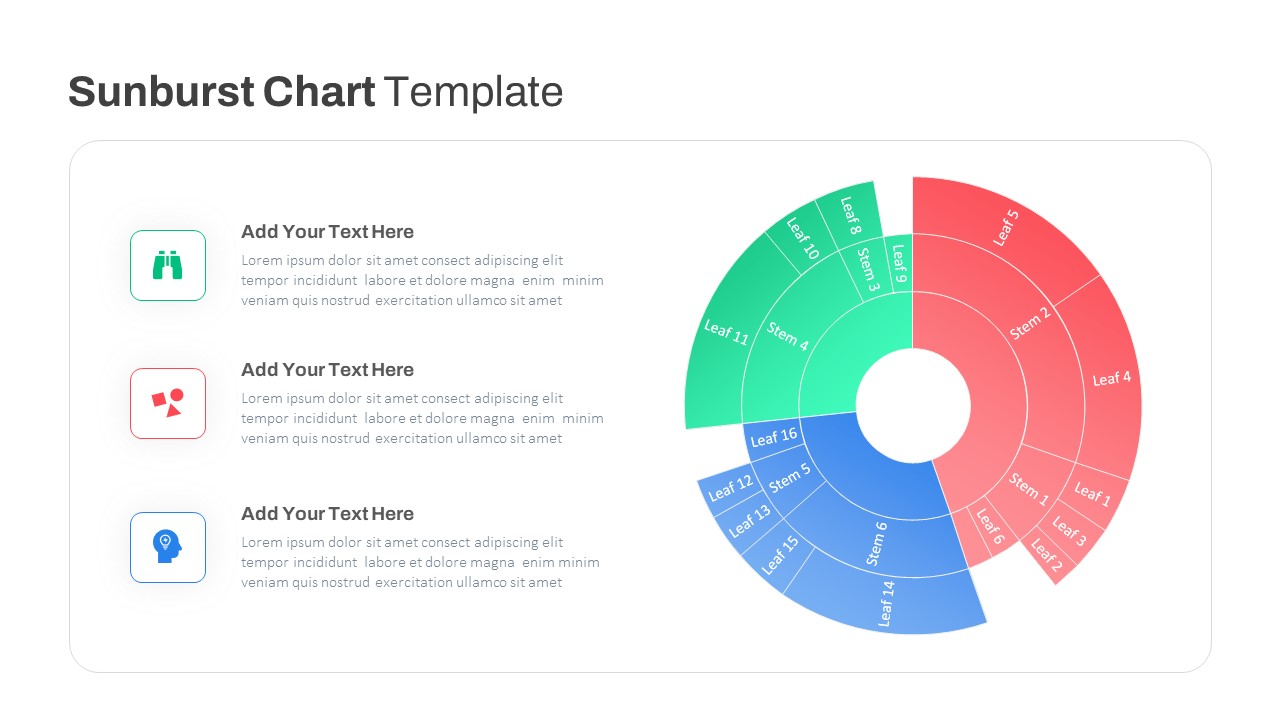
Sun Burst Chart PowerPoint Template
Circular Diagrams
Premium
-

Business Process Reengineering Template
PowerPoint Templates
Premium
-

Power Analogy Metaphor PowerPoint Template
Metaphor, Simile & Analogy
Premium
-
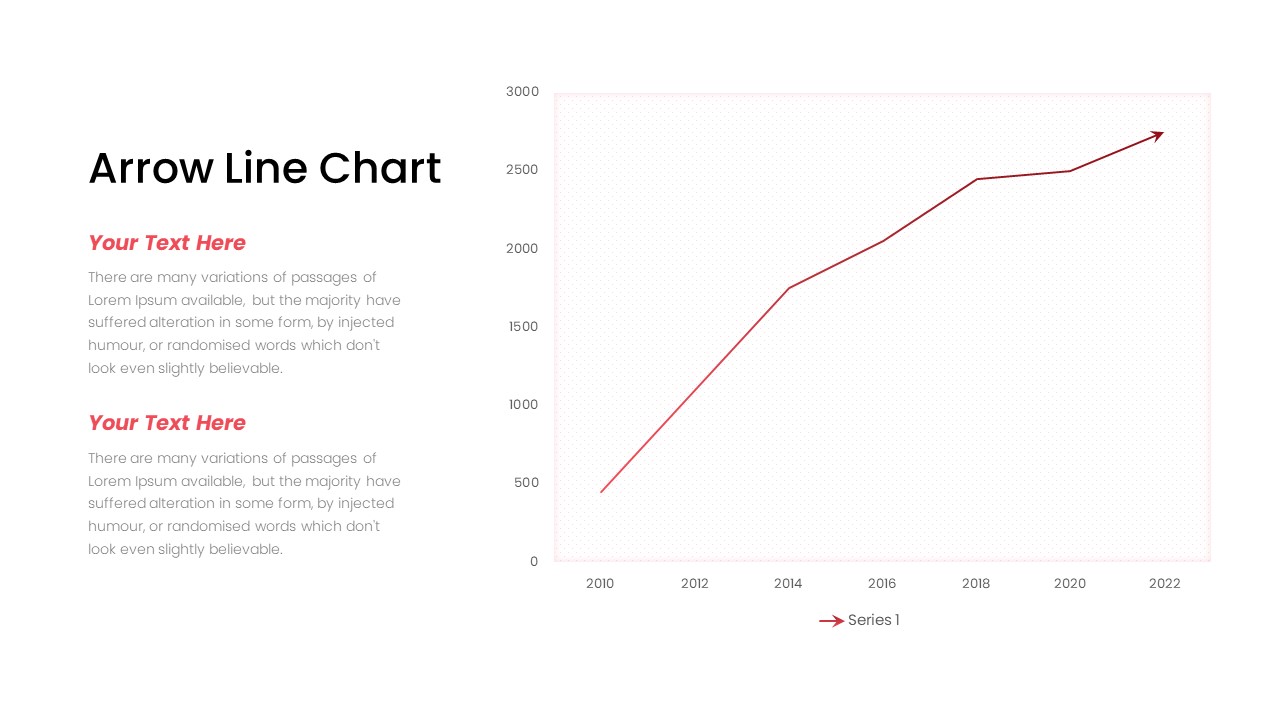
Arrow Line Chart PowerPoint Template
Arrow Diagrams
Premium
-

Animated Upcoming Event Poster PowerPoint Template
PowerPoint Templates
Premium
-
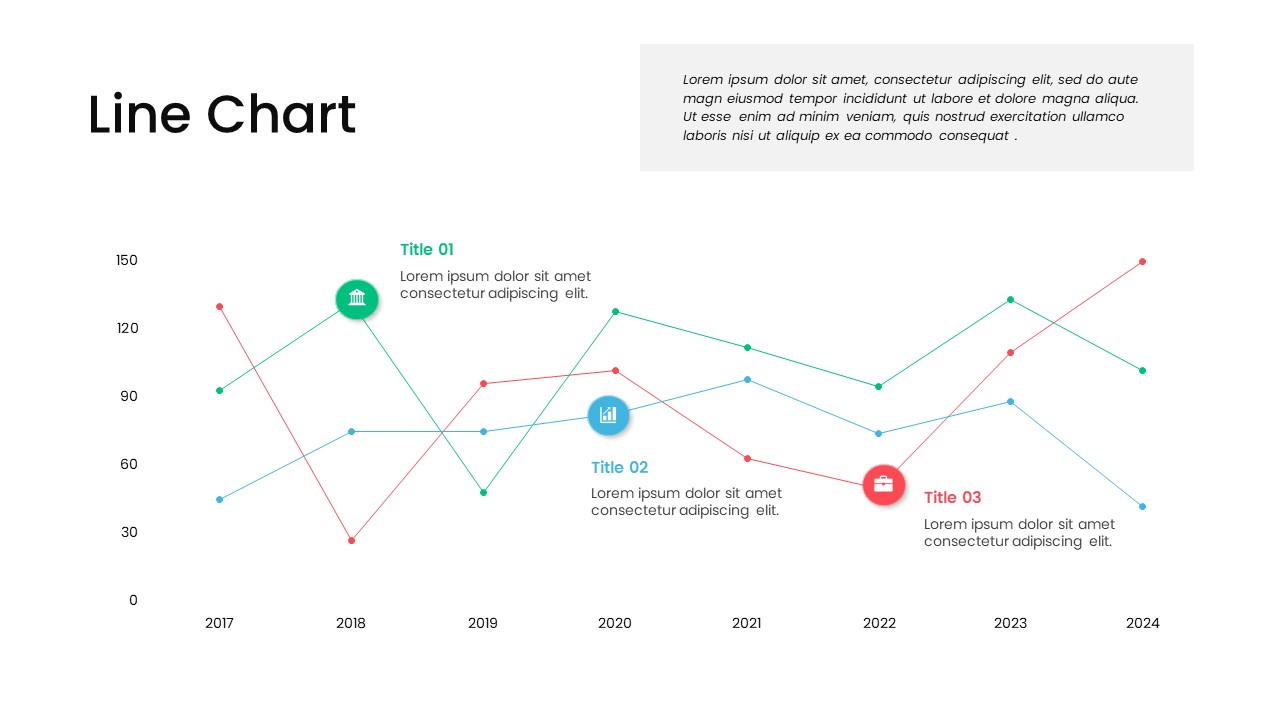
Line Chart PowerPoint Template
PowerPoint Charts
Premium
-
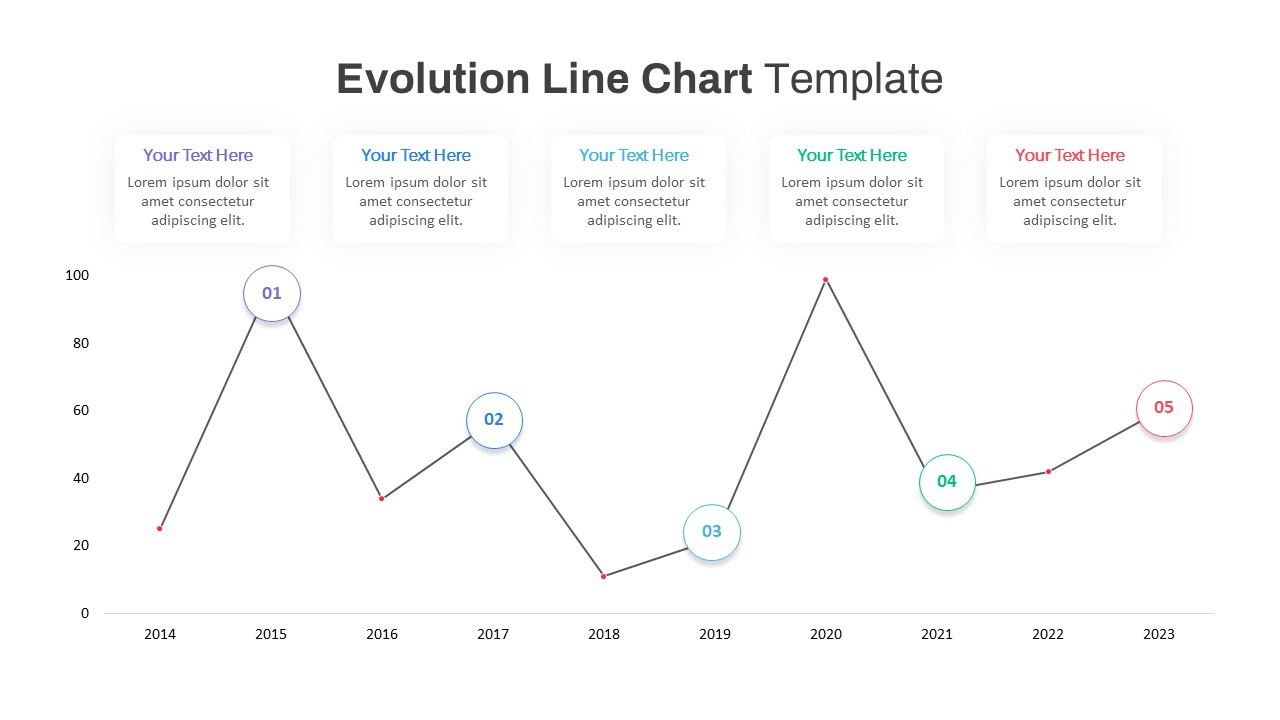
Evolution Line Chart PowerPoint Template
PowerPoint Templates
Premium
-

Open Door Policy PowerPoint Template
PowerPoint Templates
Premium
-
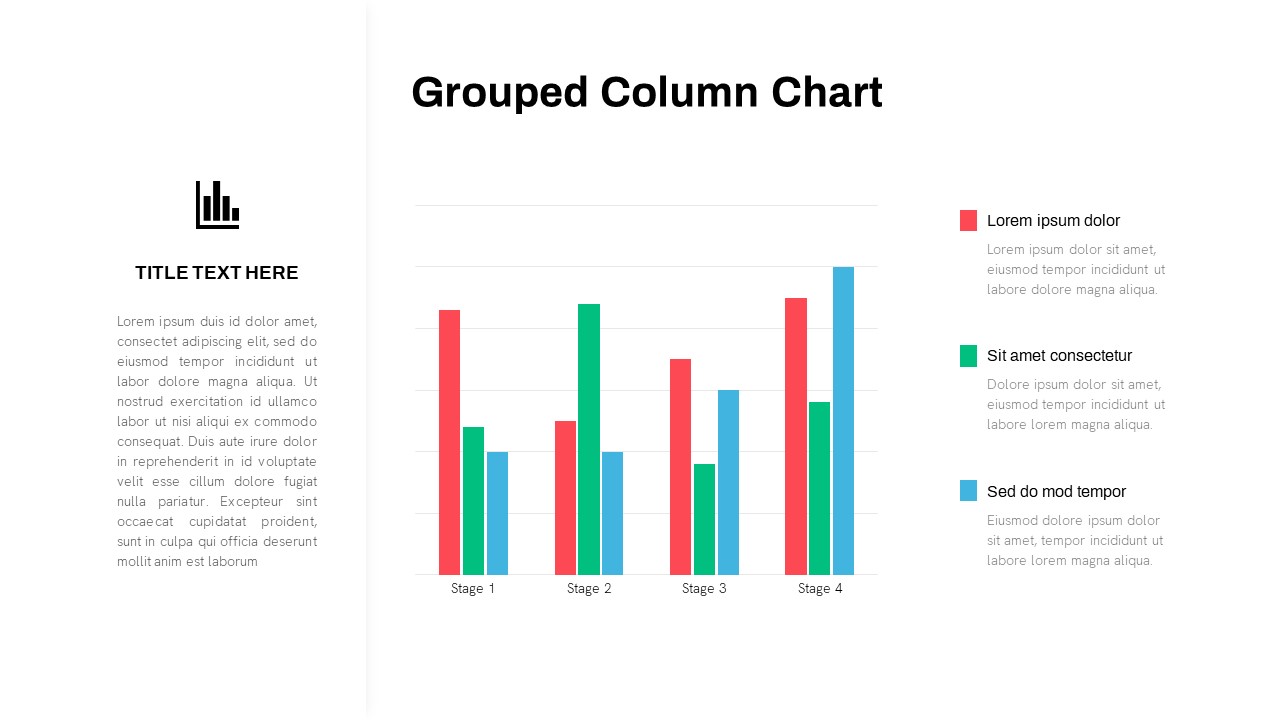
Grouped Column Chart PowerPoint Template
Column and Bar chart
Premium
-
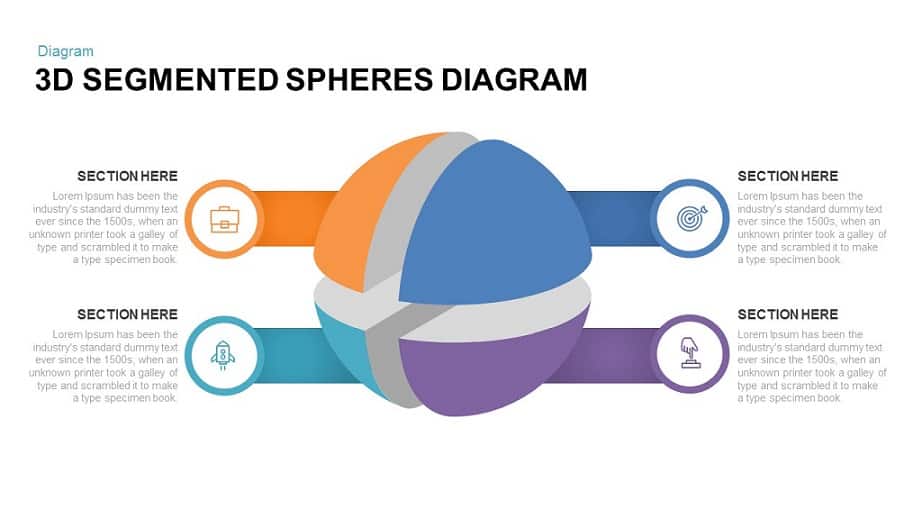
3D Animated Segmented Spheres Diagram PowerPoint Template
3D Shapes
Premium
-

Biotechnology PowerPoint Presentation Template
PowerPoint Templates
Premium
-

Free Charts and Graphs PowerPoint Template
PowerPoint Templates
Free
-
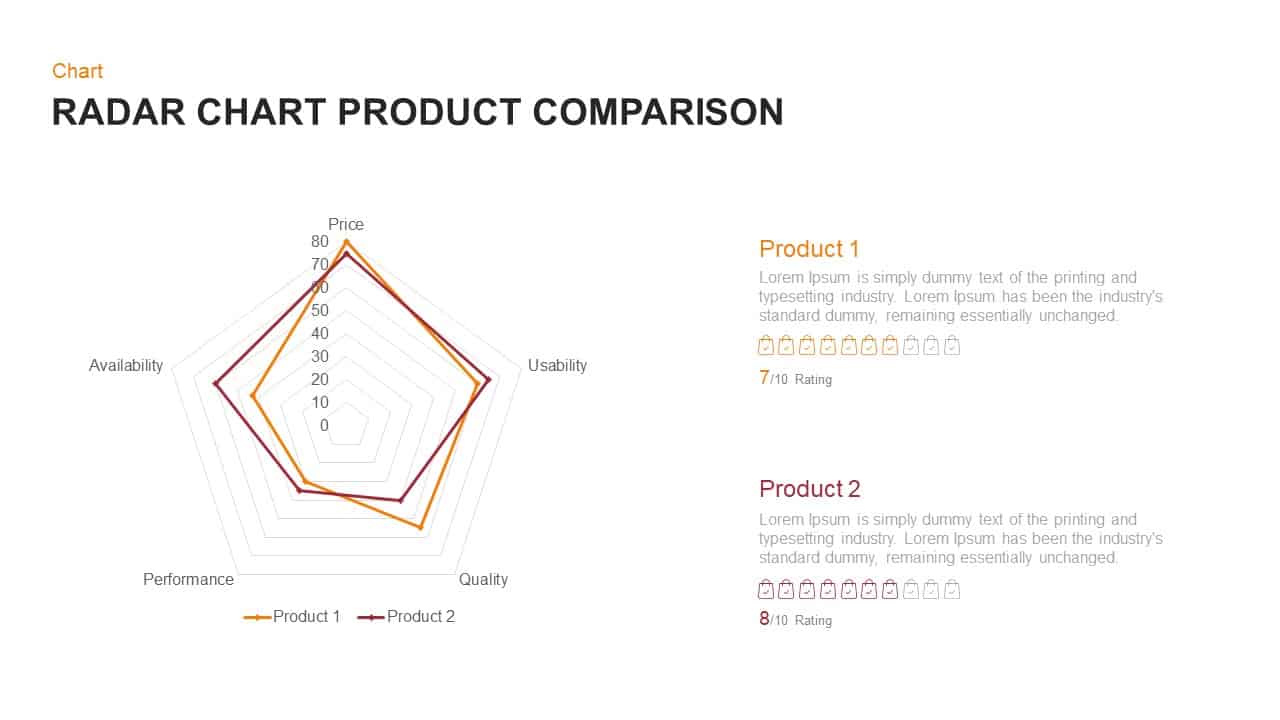
Radar Chart Product Comparison PowerPoint Template
Business Models
Premium
-
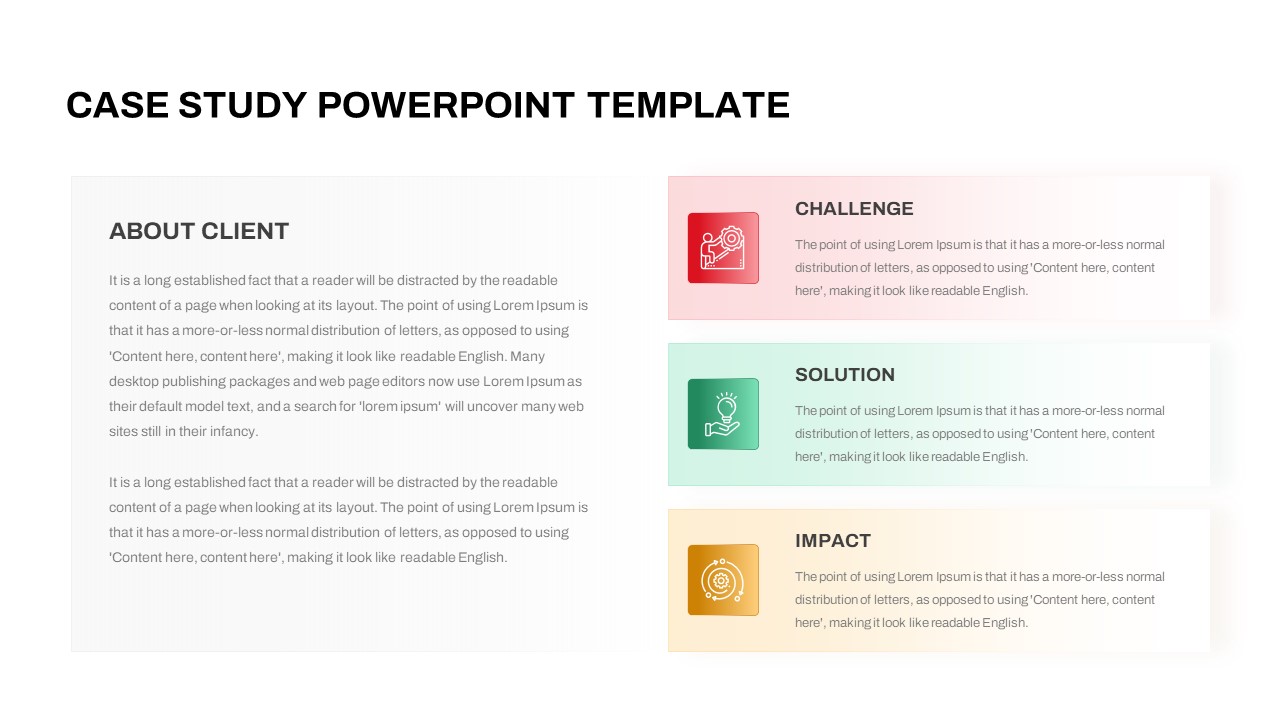
Free Case Study PowerPoint Template
PowerPoint Templates
Free
-
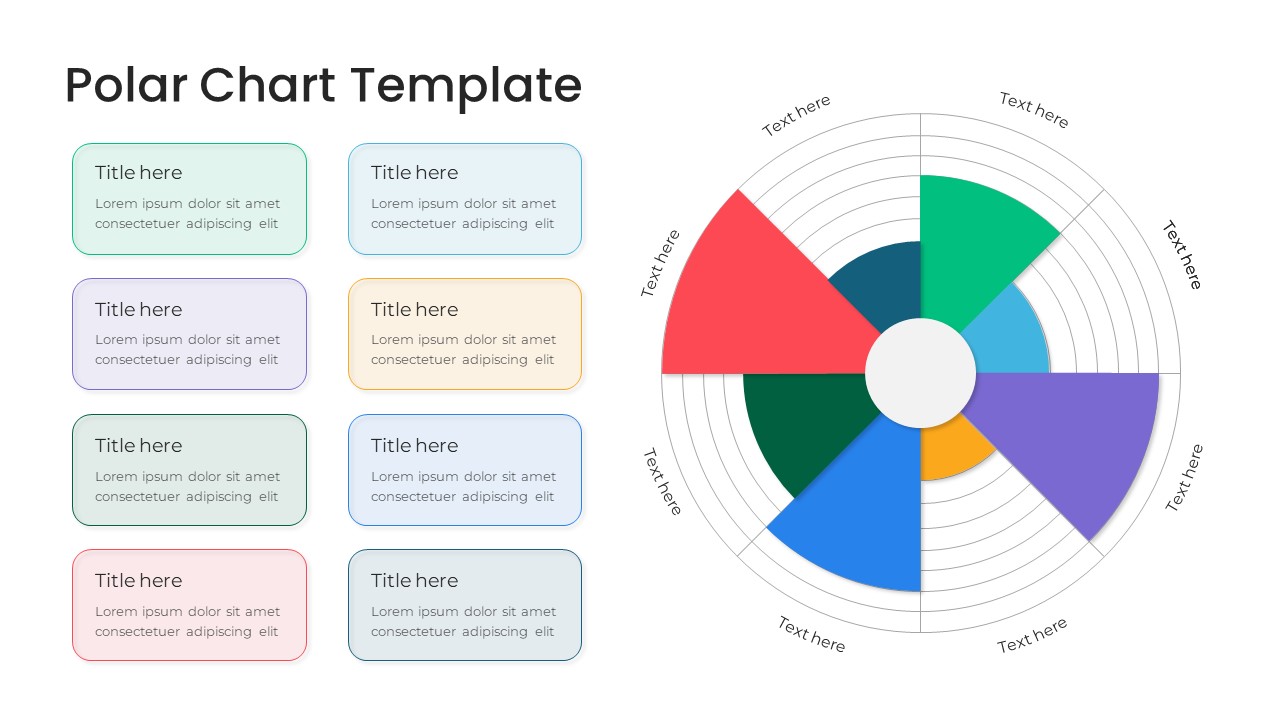
Polar Chart PowerPoint Template
PowerPoint Templates
Premium
-
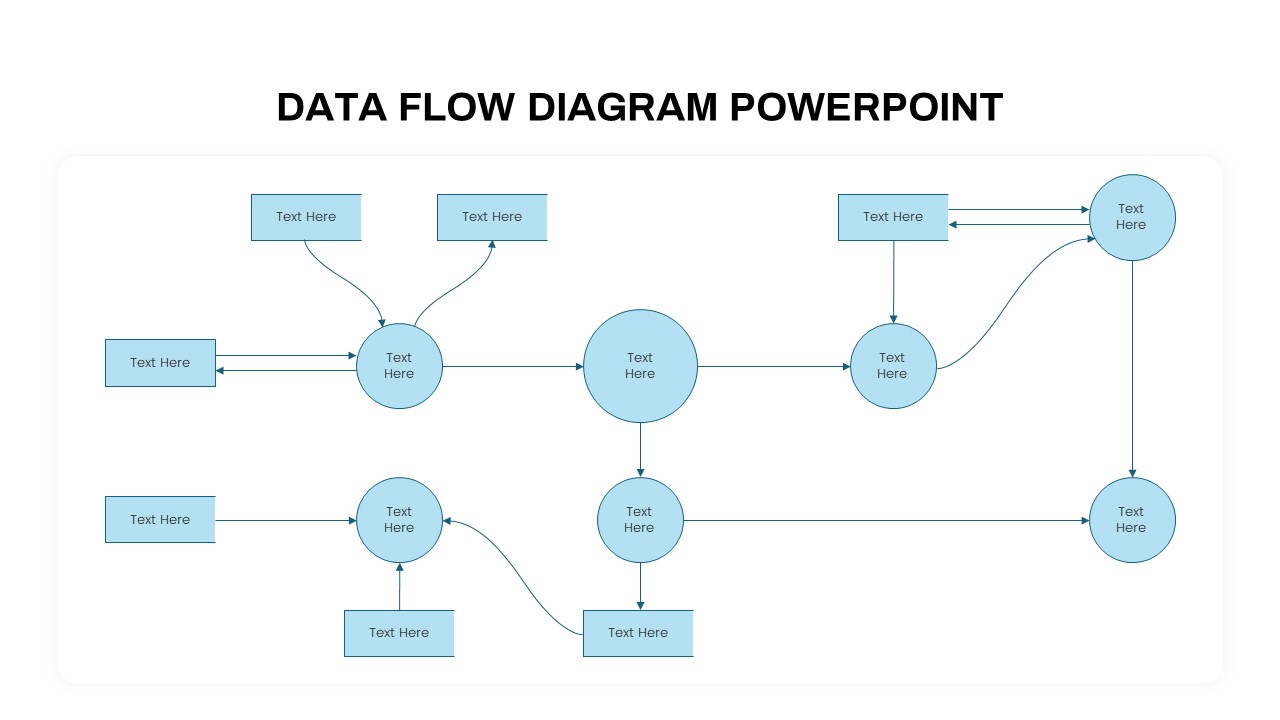
Data Flow PowerPoint Presentation Template
PowerPoint Templates
Premium
-
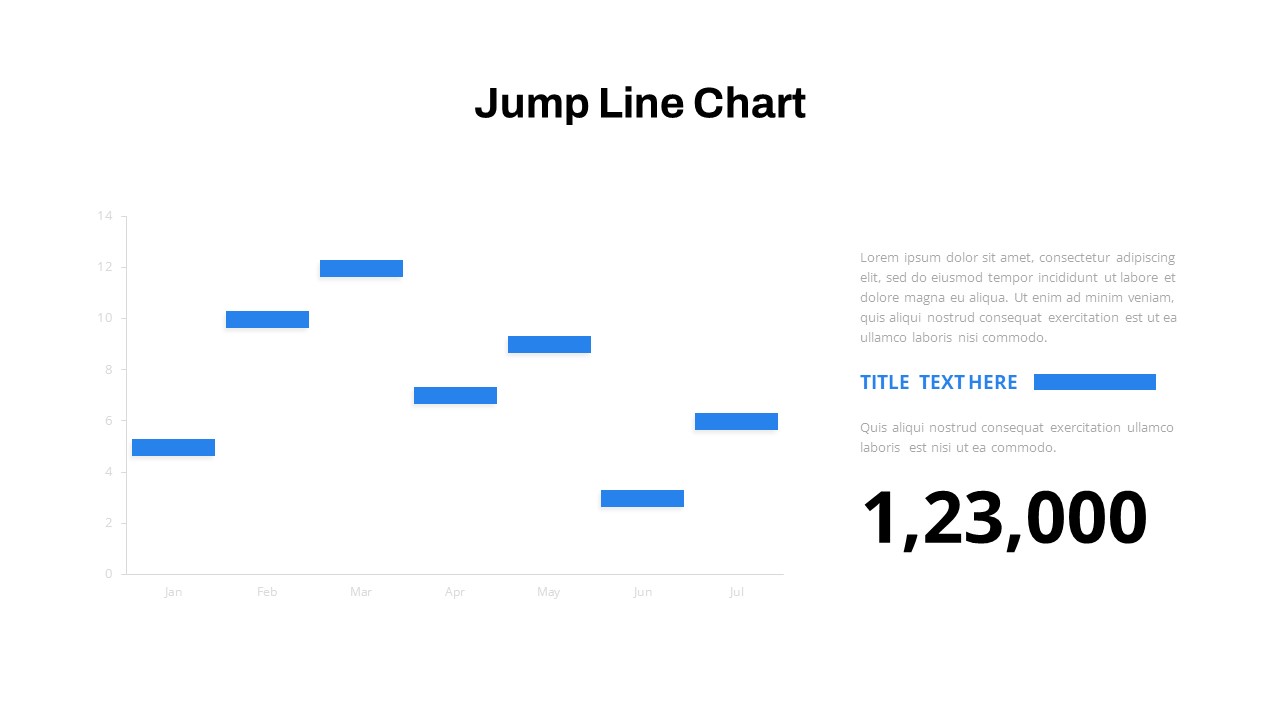
Jump Line Chart PowerPoint Template
Column and Bar chart
Premium
-
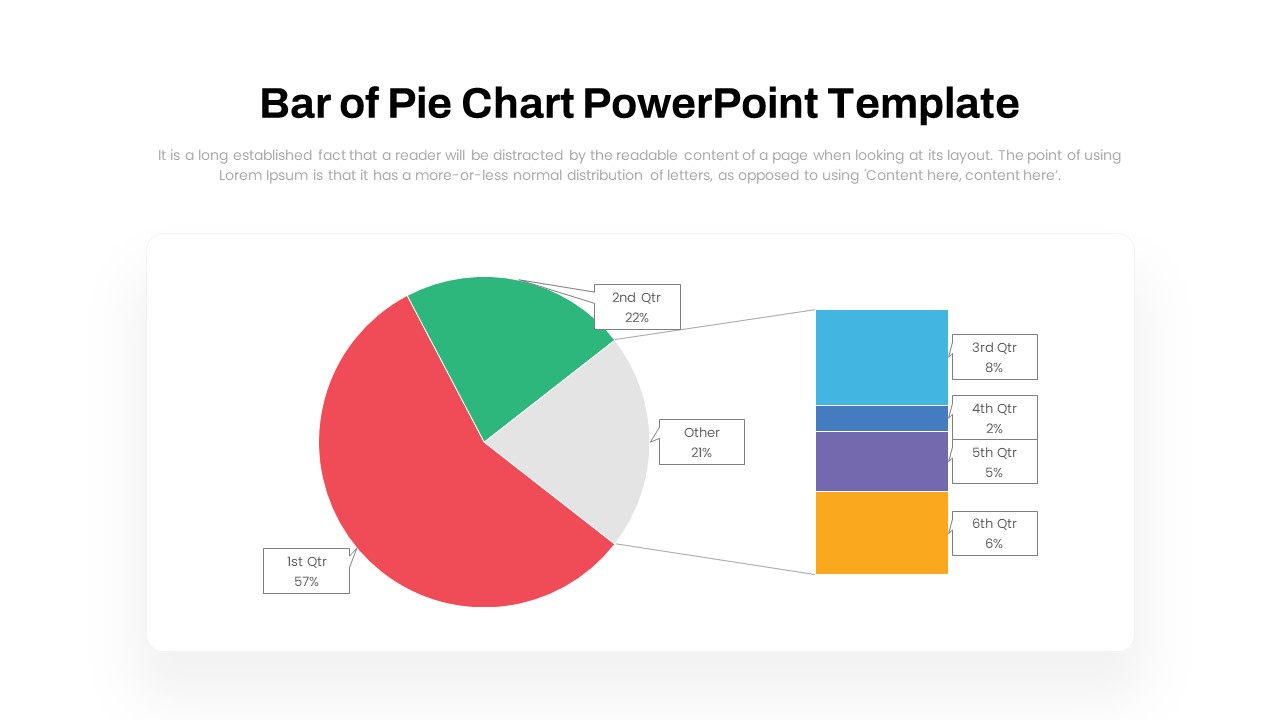
Bar of Pie Chart PowerPoint Template
PowerPoint Templates
Premium
-
Emotional Intelligence Slide
PowerPoint Templates
Premium
-
Vertical Dot Chart PowerPoint Template
PowerPoint Charts
Premium
-

Radial Bar Chart PowerPoint Templates and Keynote Slides
PowerPoint Charts
Premium
-
Stacked Area Chart PowerPoint Template
PowerPoint Charts
Premium
-
Waterfall Chart PowerPoint Template
PowerPoint Charts
Premium
-
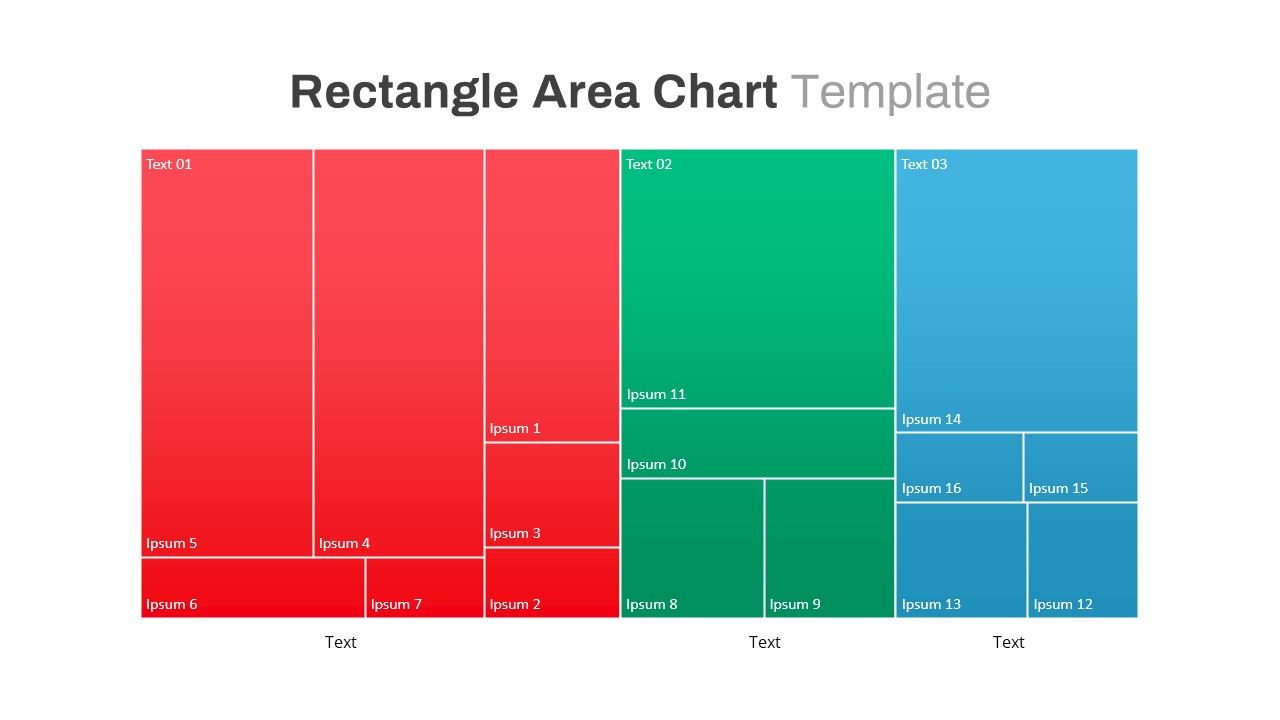
Rectangle Area Chart Template
PowerPoint Charts
Premium
-
Quality Assurance PowerPoint Deck Template
PowerPoint Business Templates
Premium
-
3D Printing Deck PowerPoint Template
PowerPoint Templates
Premium
-
Free PowerPoint Book Template
Free slides
Free
-
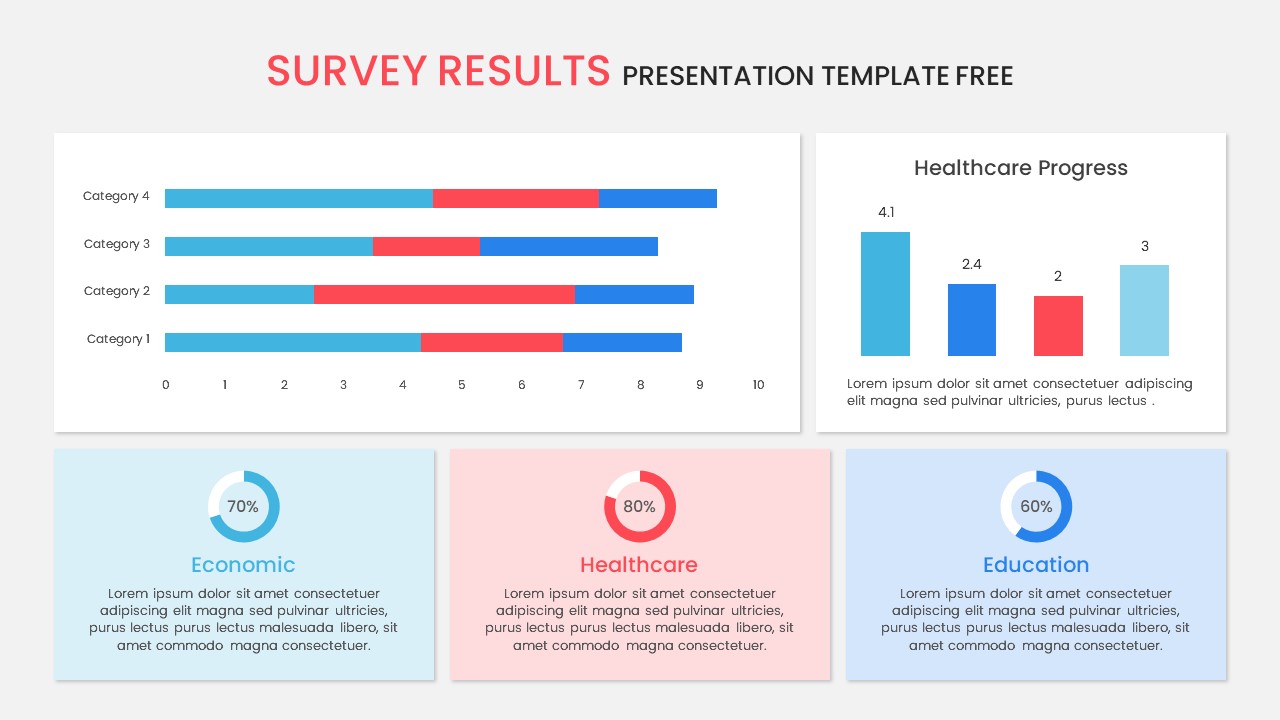
Survey Results PowerPoint Template Free
Free PowerPoint Templates
Free
-
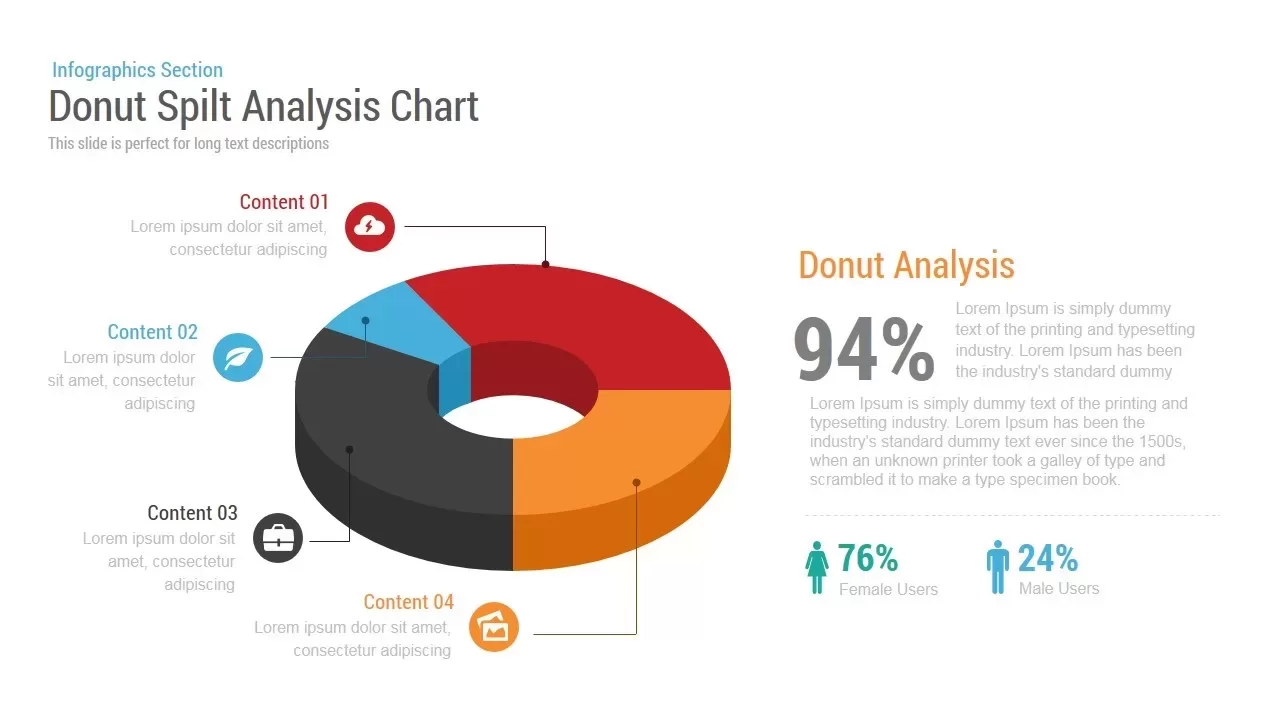
Donut Split Analysis Chart PowerPoint Template and Keynote Slide
Infographic
Premium
-
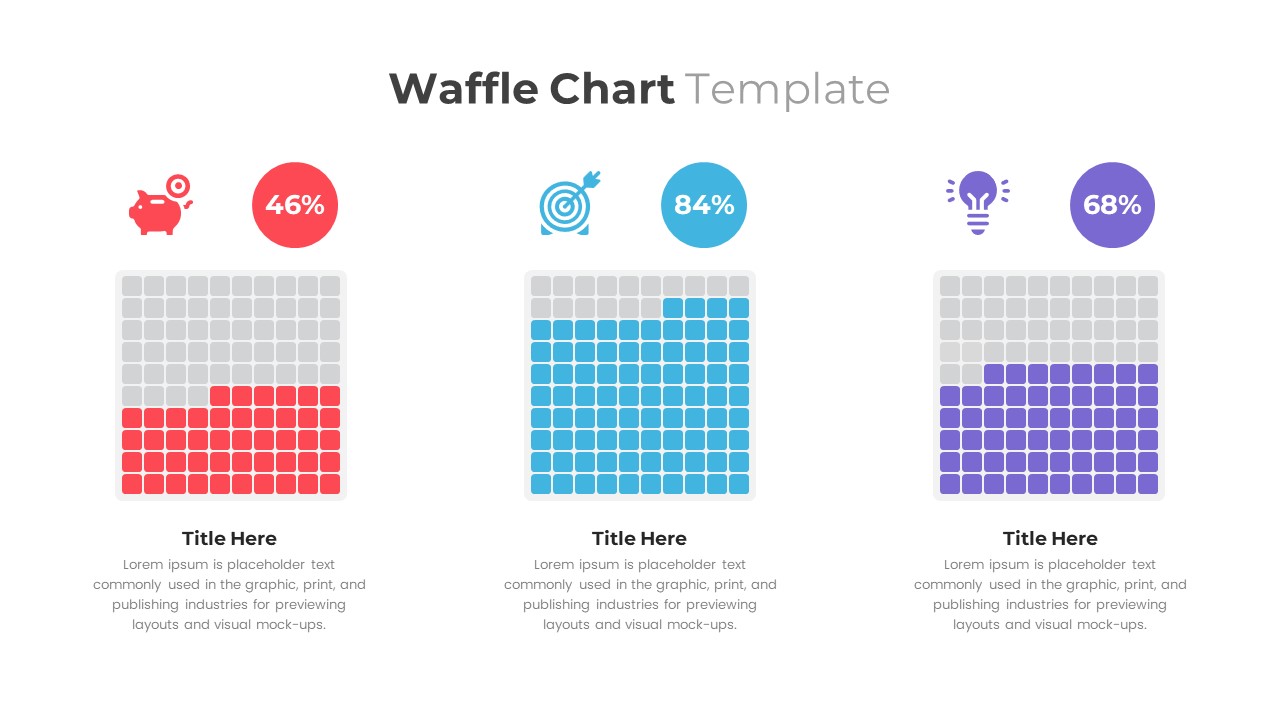
Waffle Chart PowerPoint Template
PowerPoint Templates
Premium
-
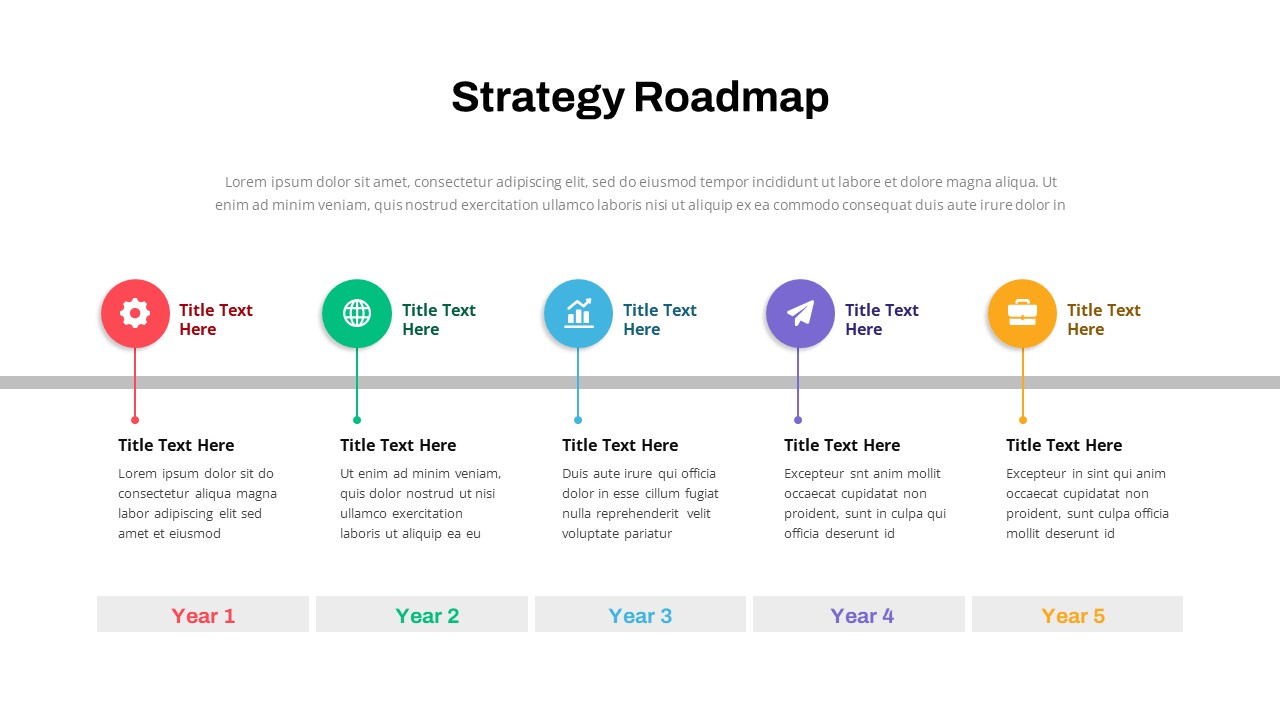
Data Strategy Roadmap PowerPoint Template
PowerPoint Templates
Premium
-
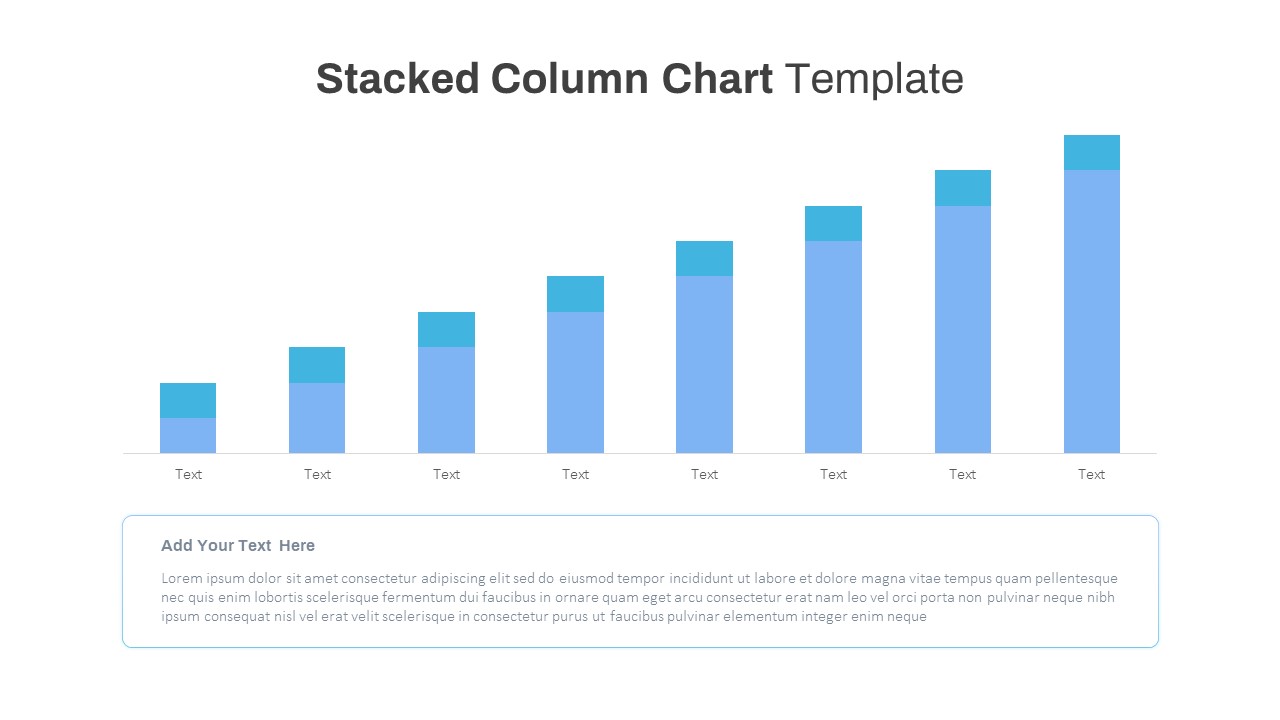
Free Stacked Column Chart Template
Column and Bar chart
Free
-
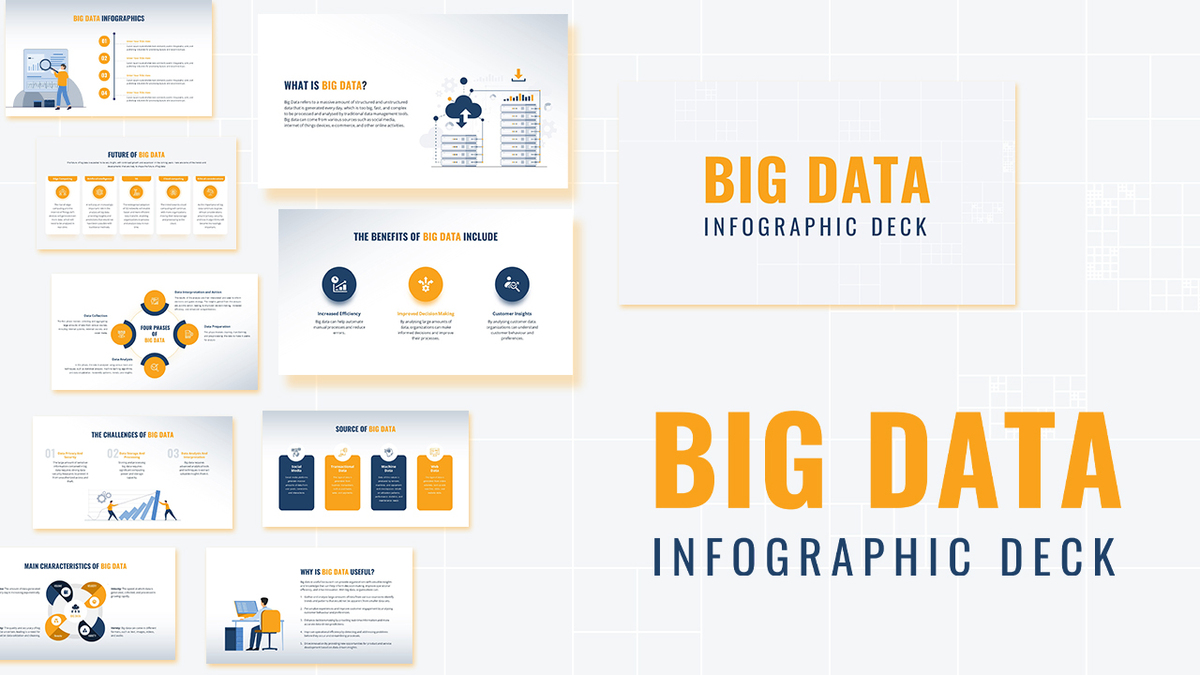
Big Data Infographic Deck For PowerPoint
PowerPoint Business Templates
Premium
-
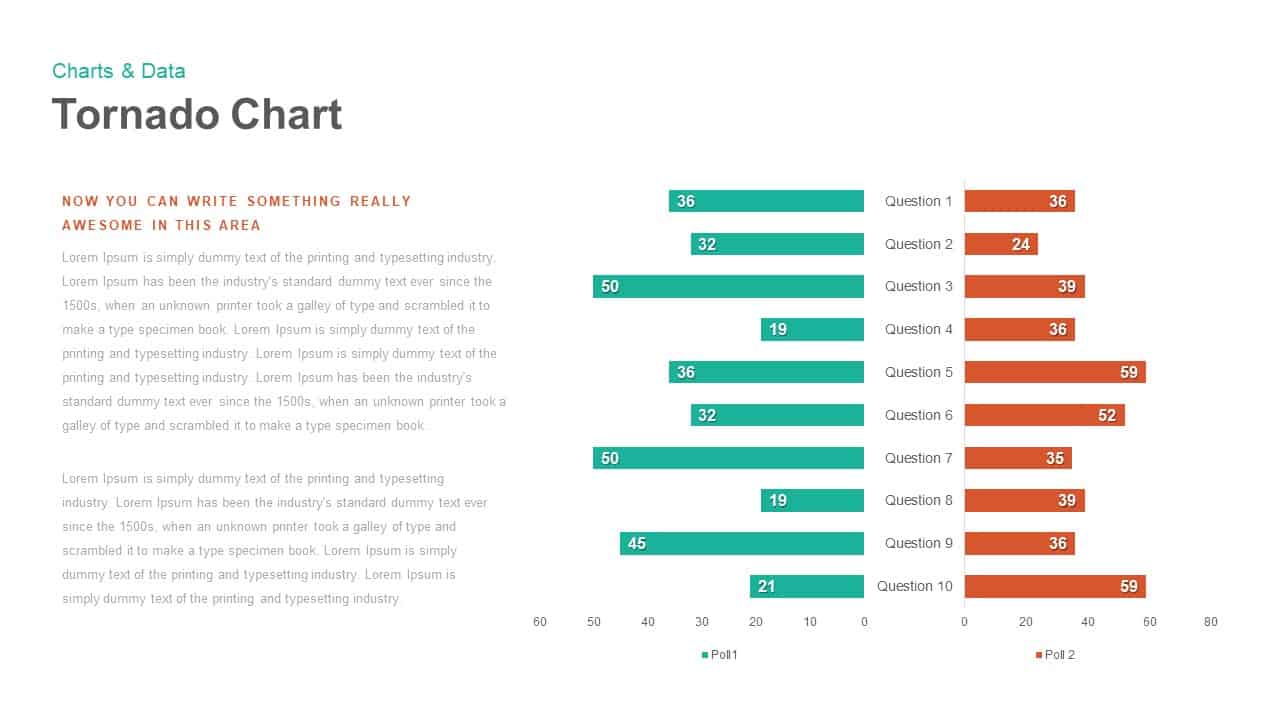
Tornado Chart PowerPoint template and keynote Slide
Diagrams
Premium
-
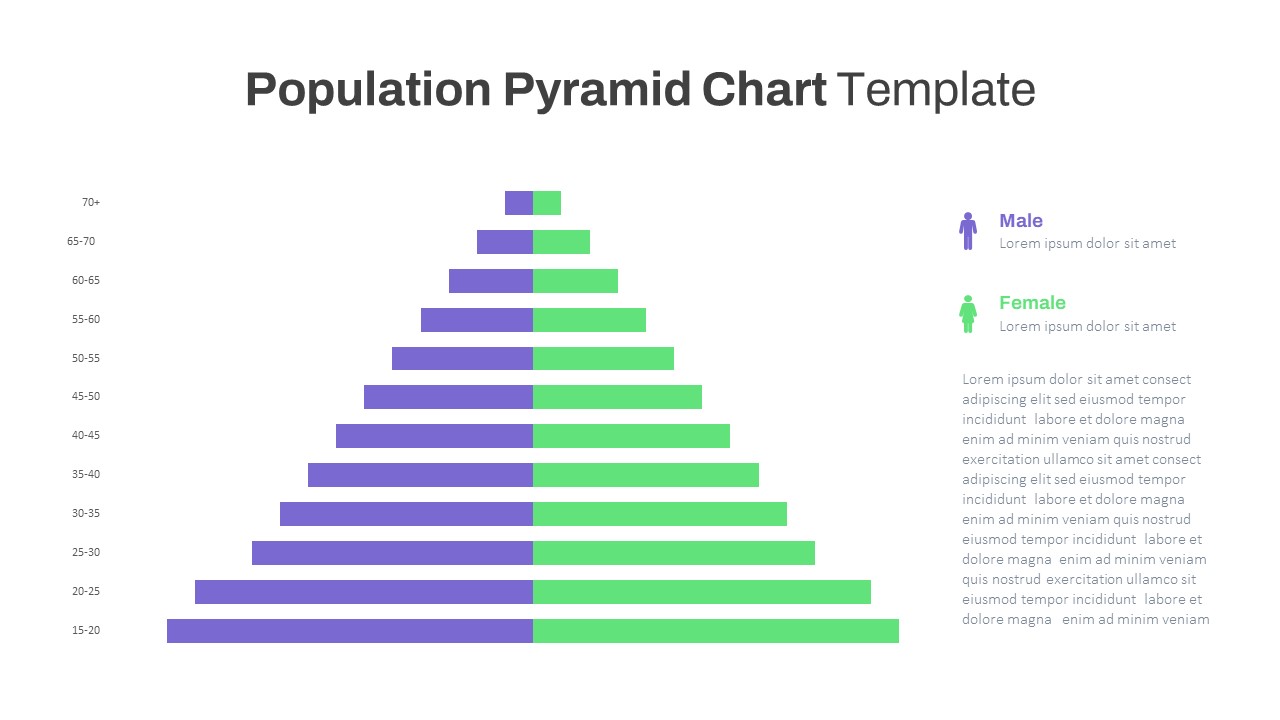
Population Pyramid Chart PowerPoint Template
PowerPoint Templates
Premium
-
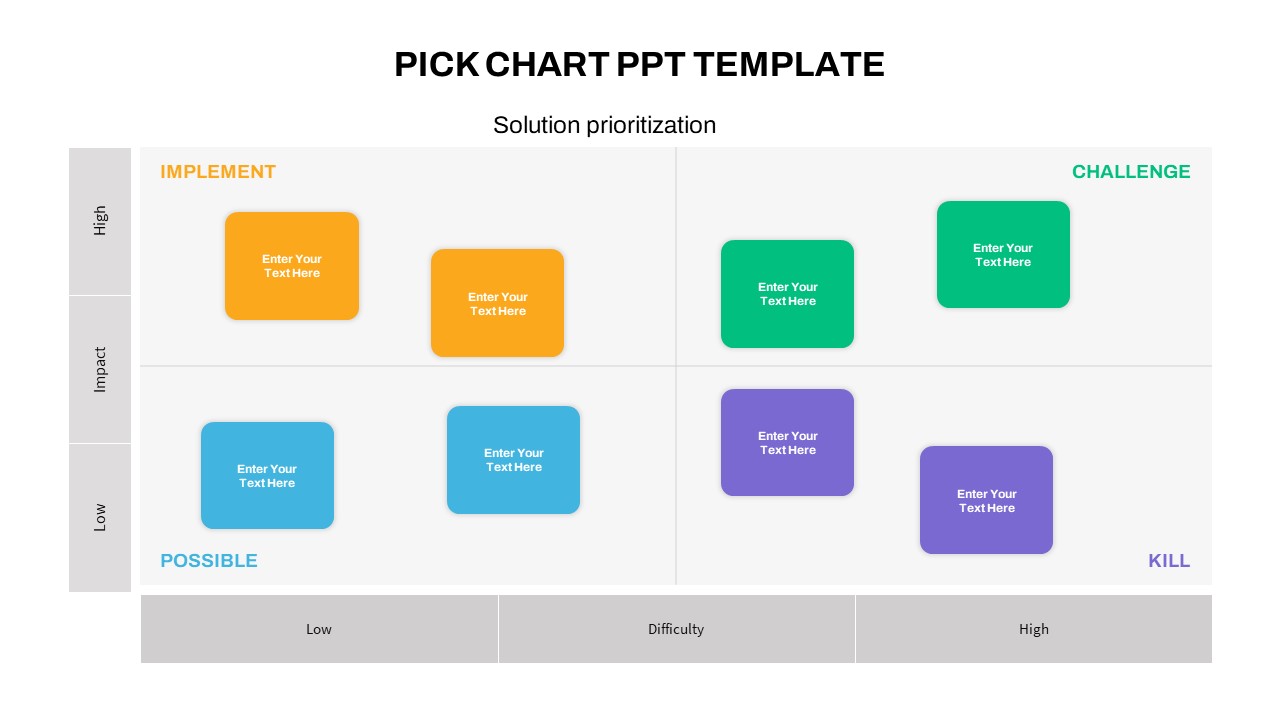
Kaizen Pick Chart PowerPoint Template
PowerPoint Templates
Premium
-
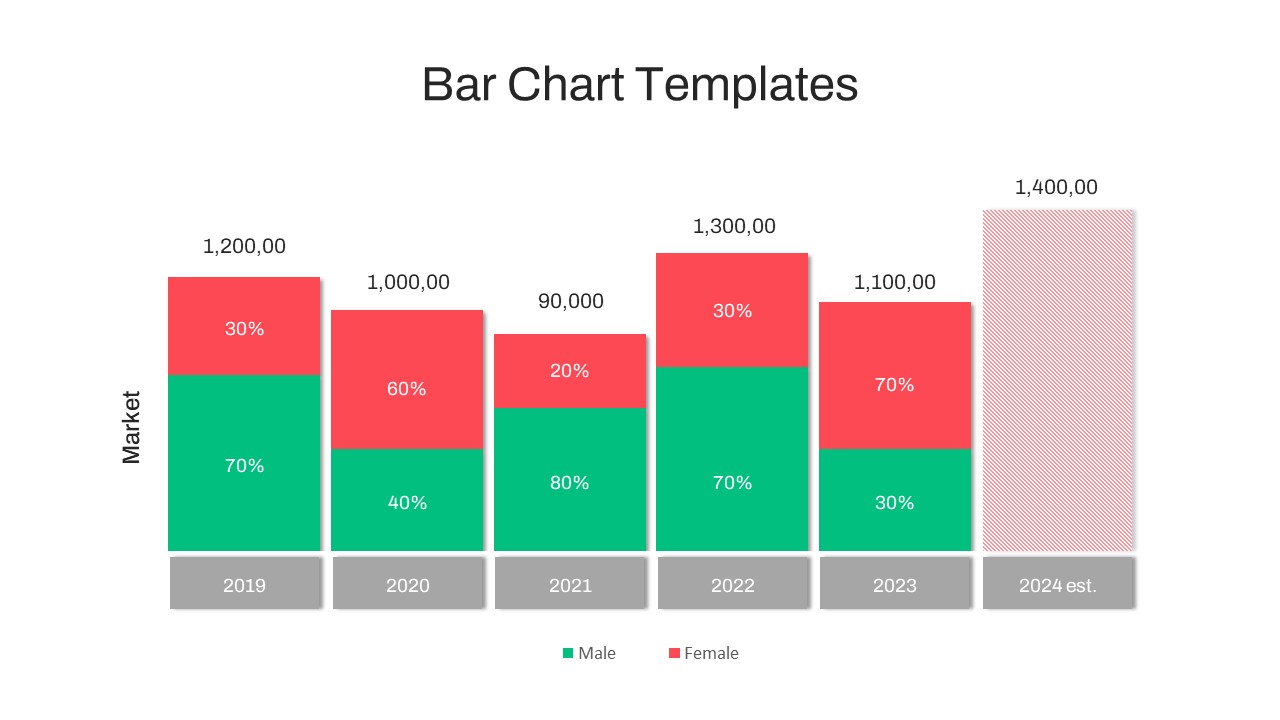
Timeline Bar Chart PowerPoint
Column and Bar chart
Premium
-
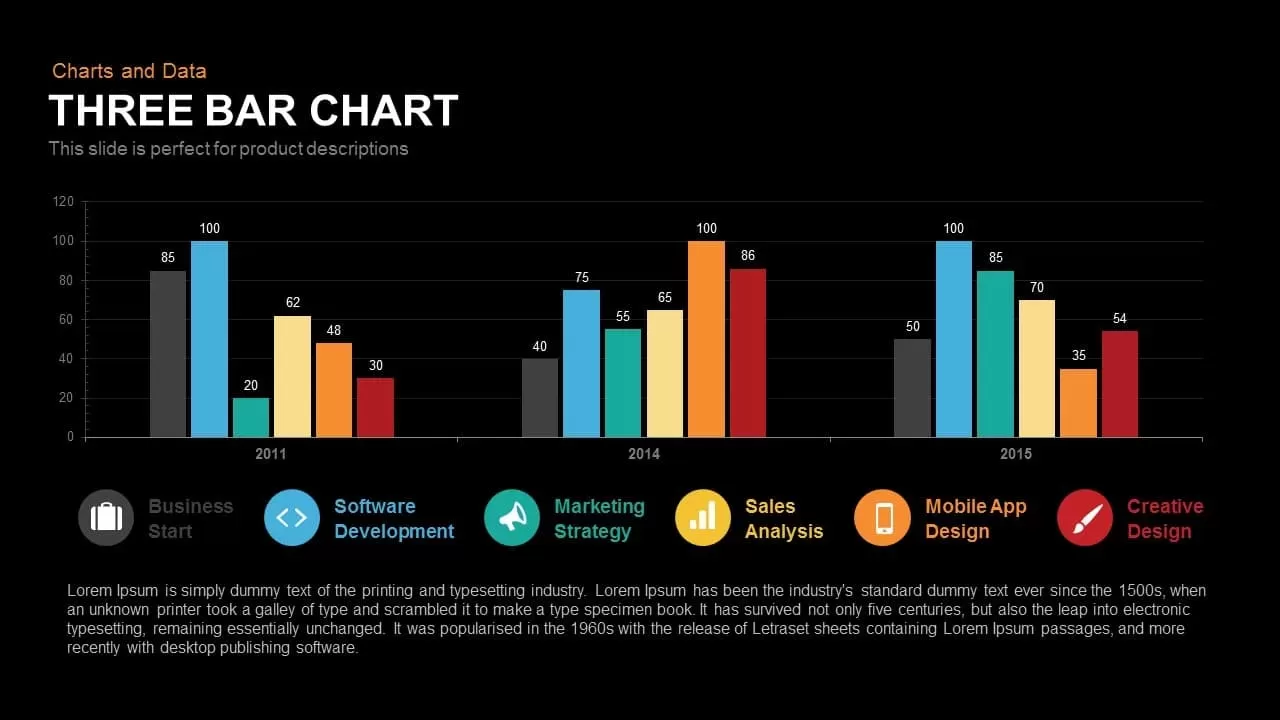
3 Bar Chart PowerPoint Template and Keynote Slide
Column and Bar chart
Premium
-
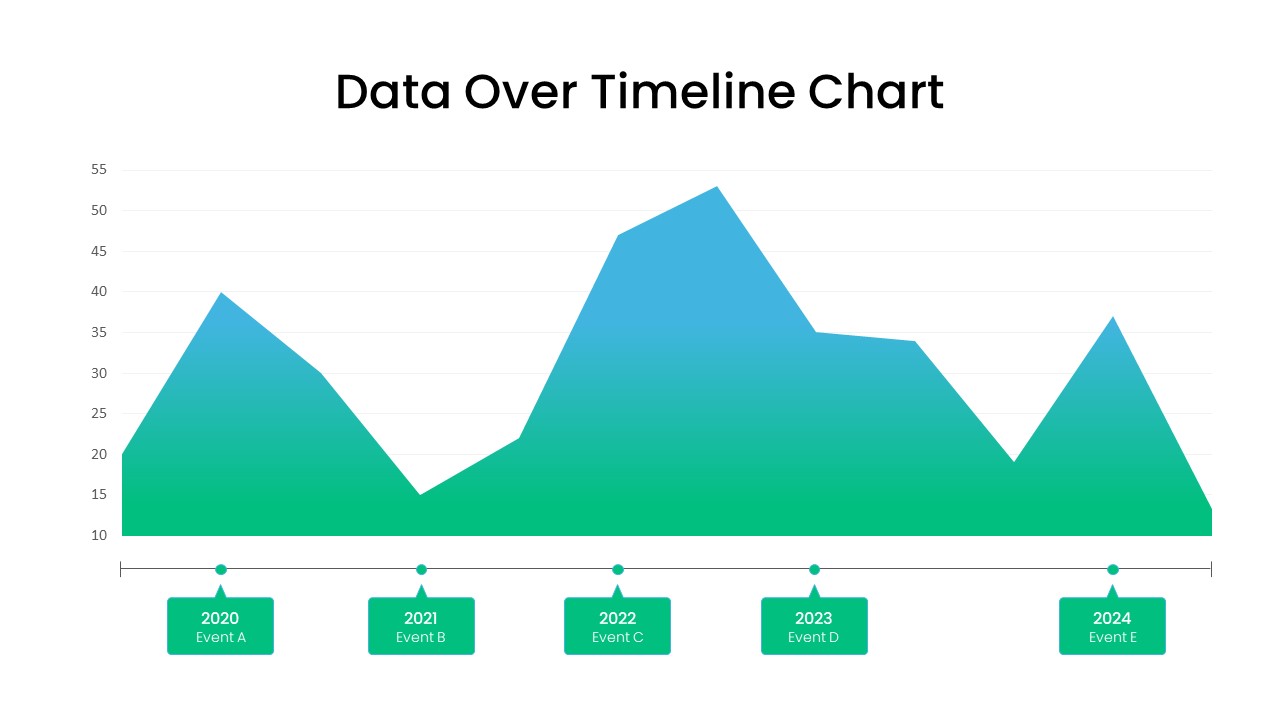
Data Over Time Line Chart PowerPoint Template
PowerPoint Charts
Premium
-
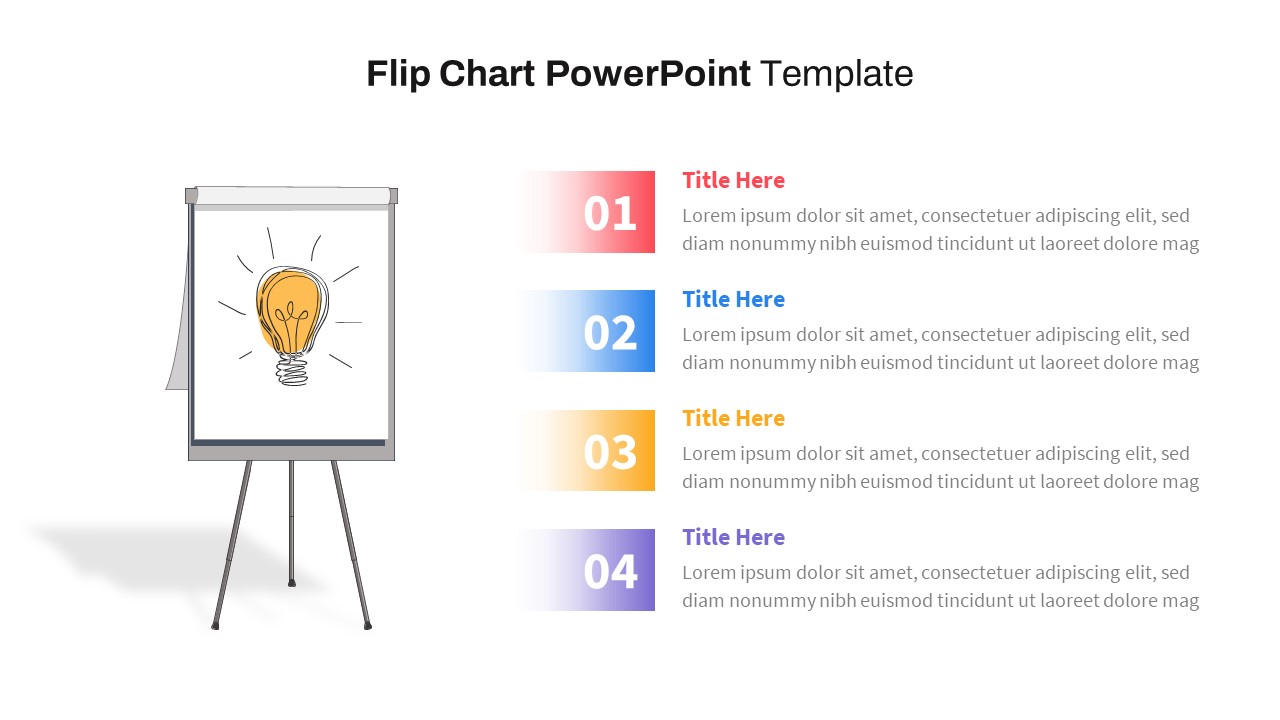
Flip Chart PowerPoint Template
PowerPoint Templates
Premium
-
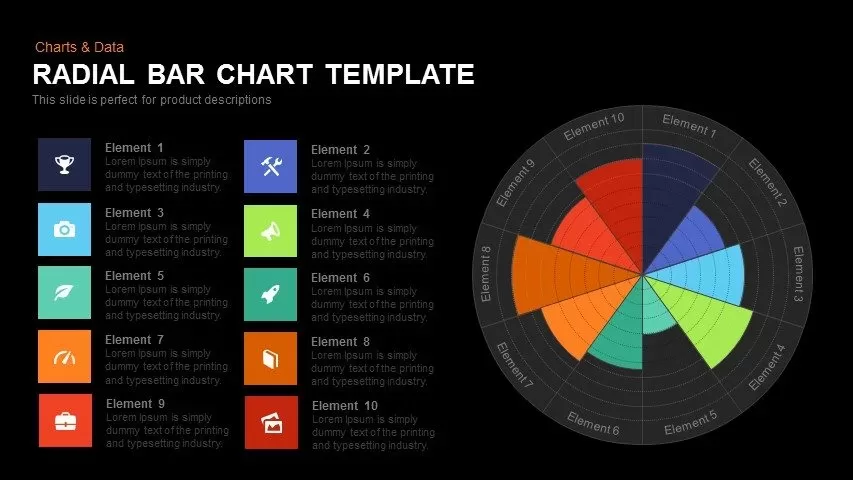
Radial Bar Chart Template for PowerPoint and Keynote
Circular Diagrams
Premium
-

Finance Consulting PowerPoint Template
PowerPoint Templates
Premium
-
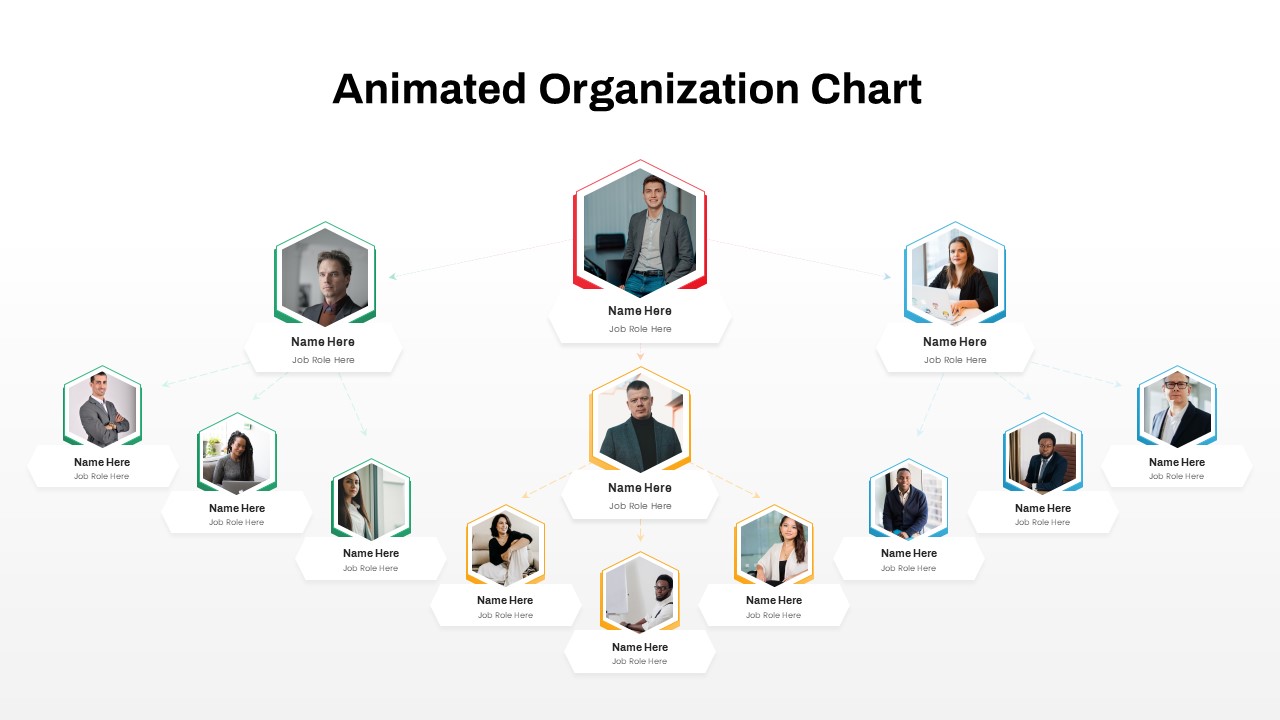
Animated Org Chart PowerPoint Template
Org Charts
Premium
-
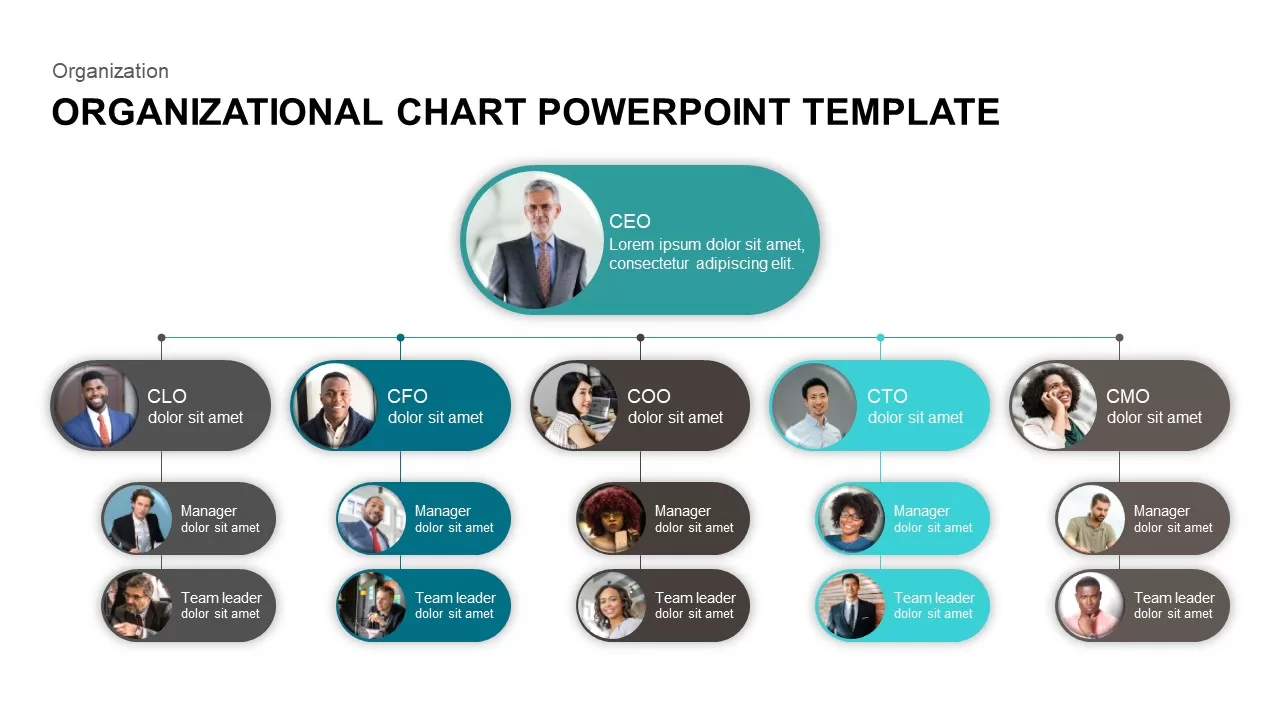
Org Chart PowerPoint Presentation Template
PowerPoint Charts
Premium
-
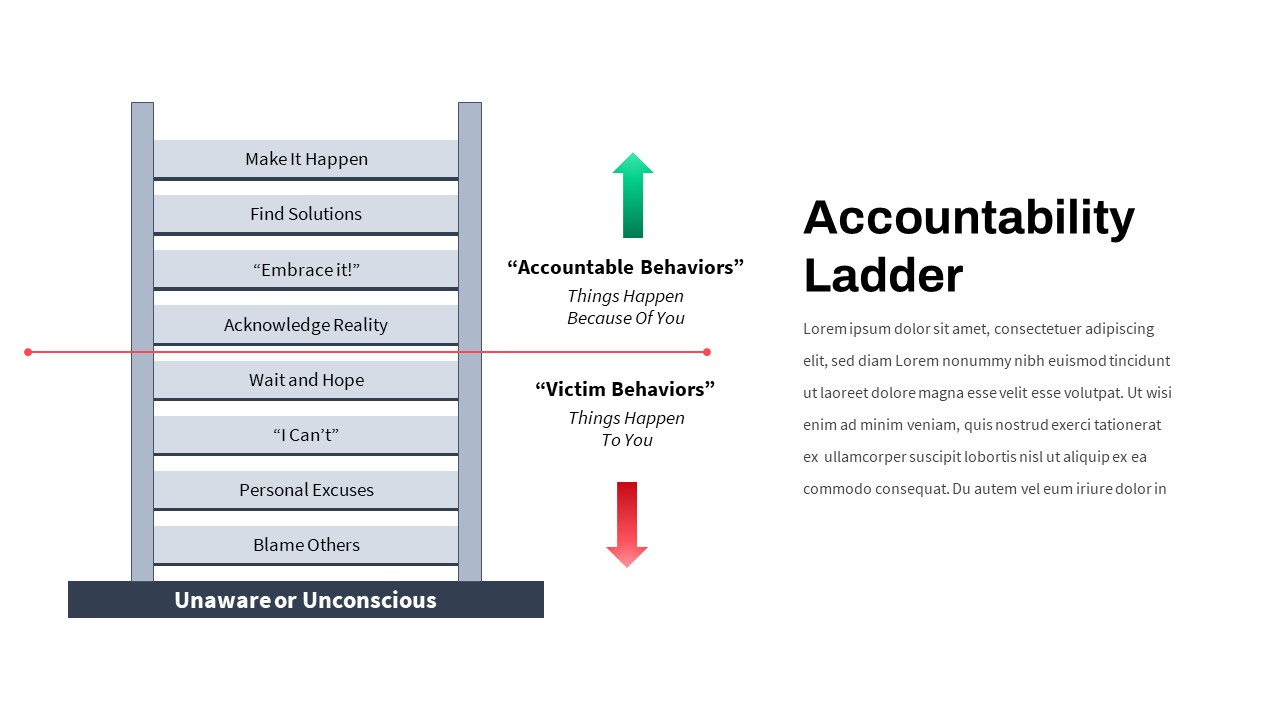
Accountability Ladder PowerPoint Template
PowerPoint Templates
Premium
-

Case Study PowerPoint and Keynote Template
PowerPoint Templates
Premium
-
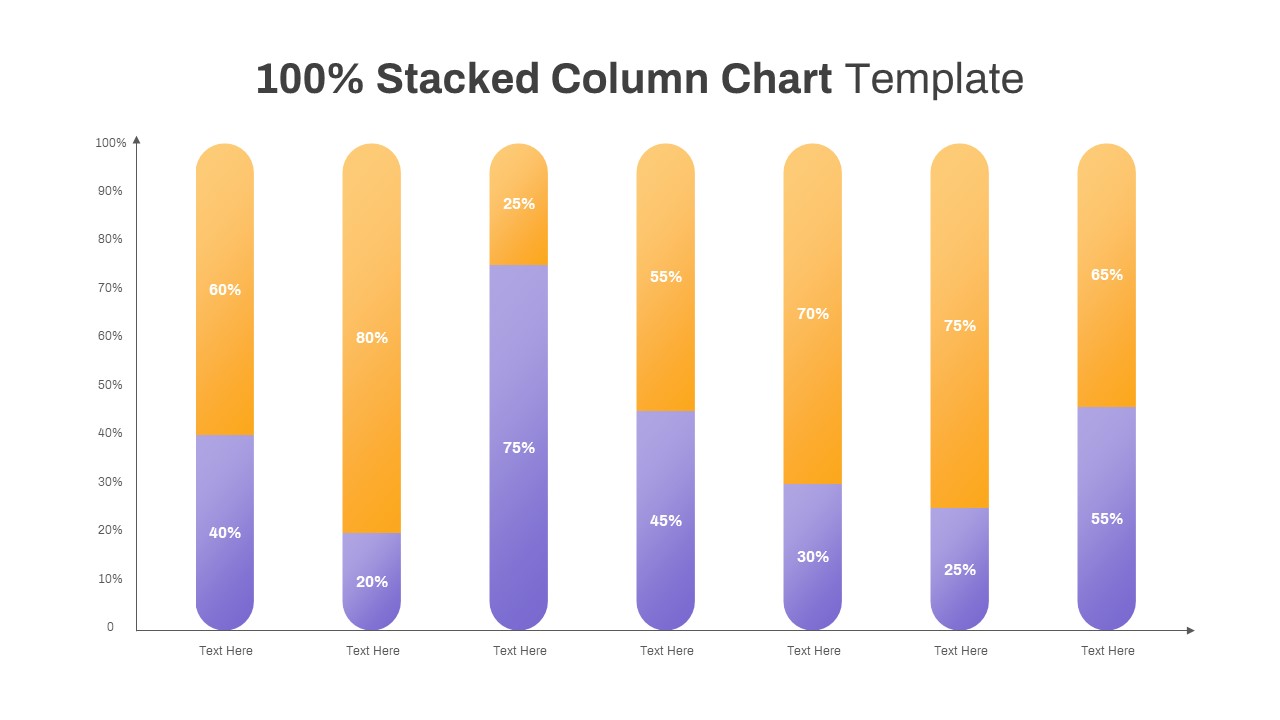
100% Stacked Column Chart PowerPoint Template
Column and Bar chart
Premium
-
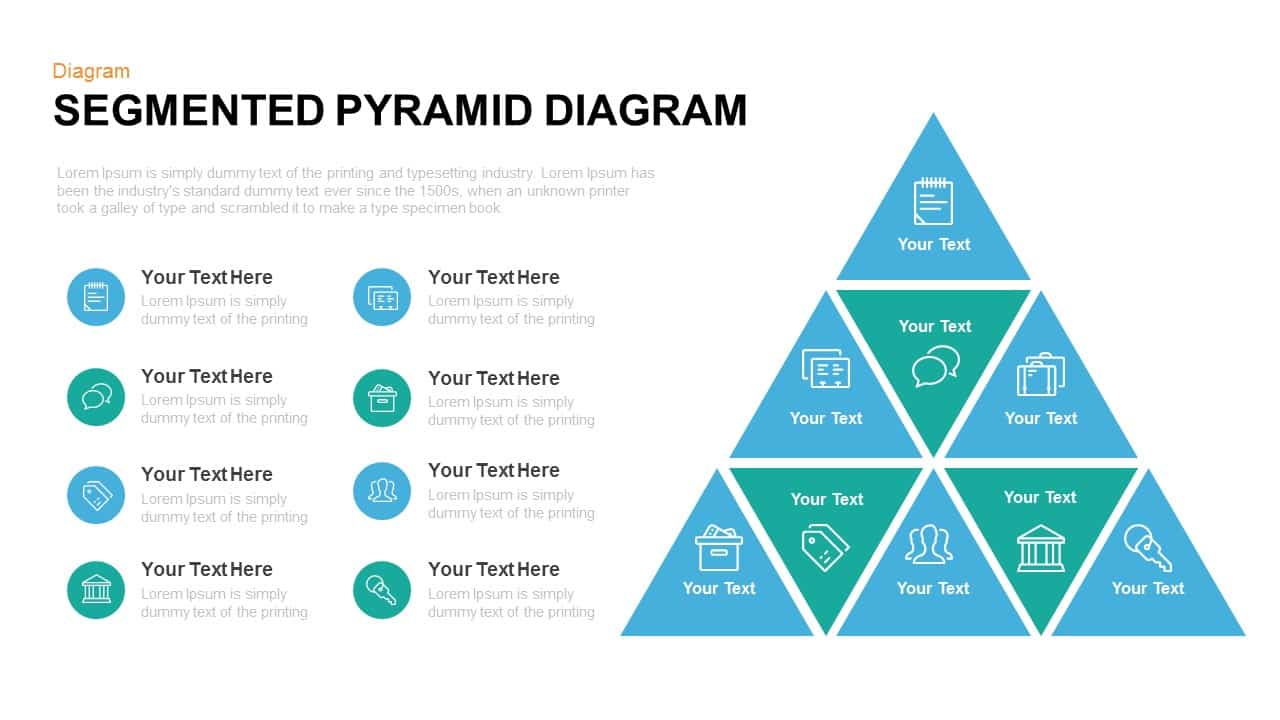
Segmented Pyramid Diagram Template for PowerPoint and Keynote
Pyramid
Premium
-
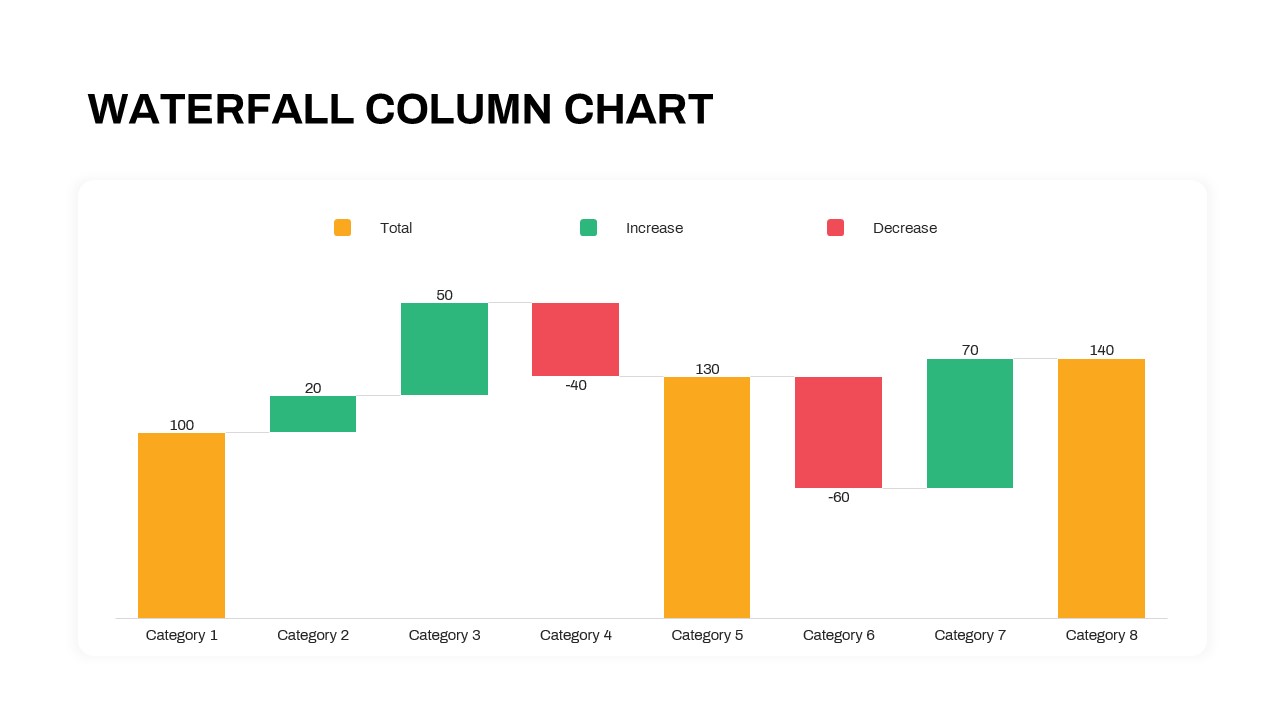
Waterfall Column Chart PowerPoint Template
Column and Bar chart
Premium
-
PPT Template Mind Map
Mind Map PowerPoint Template
Premium
-
Mirror Bar Chart PowerPoint Template
PowerPoint Templates
Premium
-
Population Chart PowerPoint Template
PowerPoint Templates
Premium
-
Free 3d Pie Chart PowerPoint Template & Keynote slide
Pie & Donut
Free