


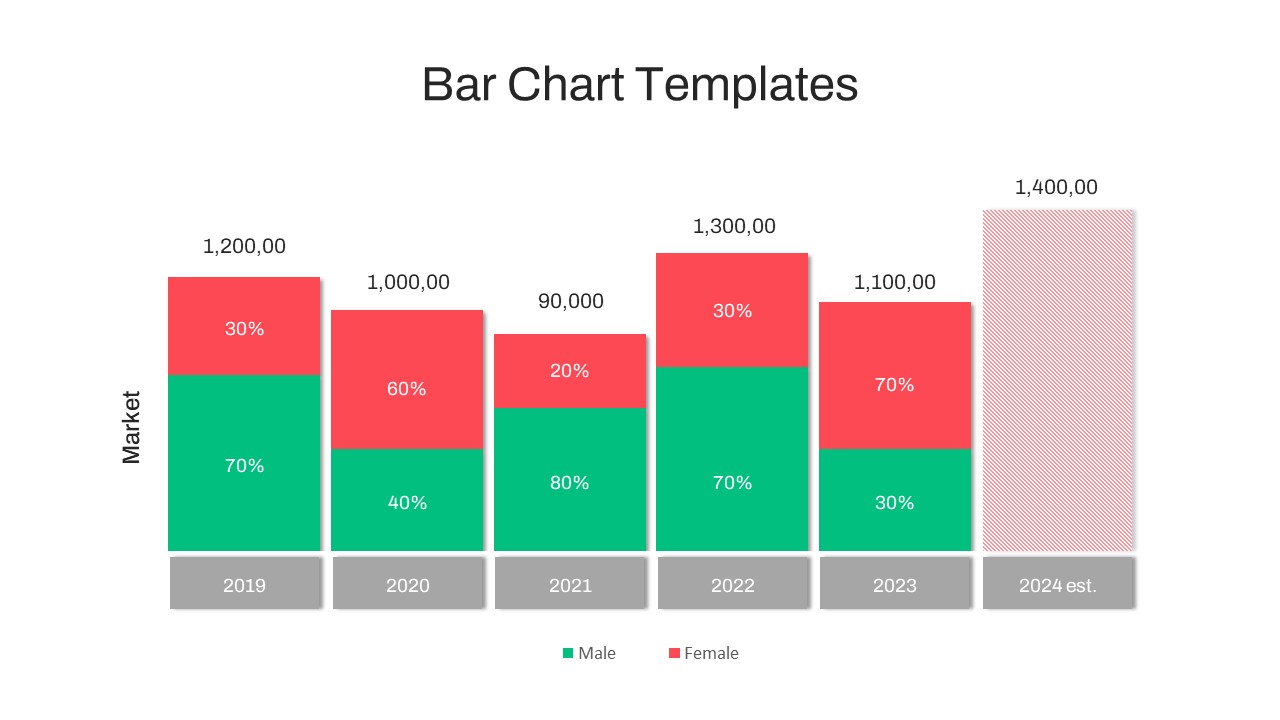
Sample Bar Chart Template for PowerPoint and Keynote Presentation
- Version
- Download 446
- File Size 0.00 KB
- File Count 1
- Create Date July 8, 2015
- Last Updated June 7, 2023
Sample Bar Chart Template for PowerPoint and Keynote Presentation
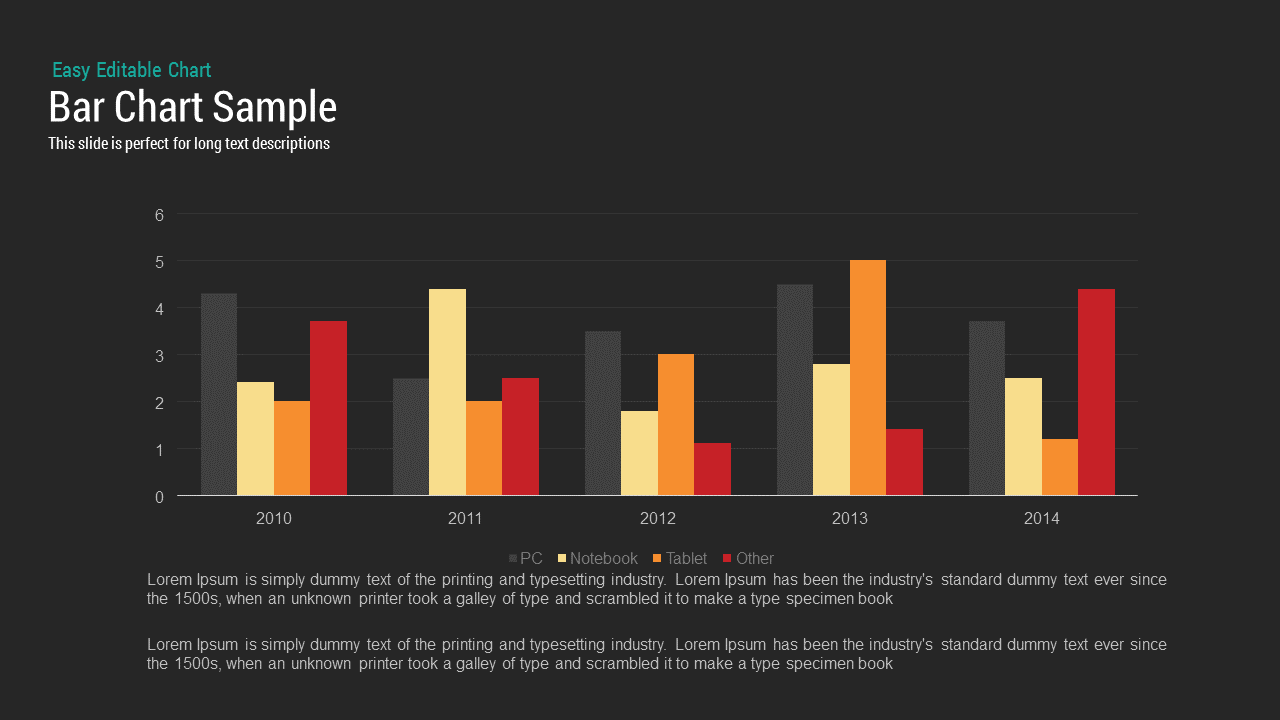
Sample Bar Chart PowerPoint Template
Sample bar chart PowerPoint template is created for the statistical representation of information that is useful for the easy learning of an analytical report. The clustered bar chart PowerPoint template contains four bars in each cluster. The height of the bars is generally proportional to the value of the data. This bar chart sample template can be used to make splendid presentations in PowerPoint and present data while maintaining the spectators focused in your performance. This can be edited to make sales presentations. The distinct design makes them stand out against the black and white background. The graphics are designed to eye-catching. They present a professional design that is ideal for formal business and research presentations.
Using the bar chart PowerPoint template, different statistical data can be presented. It is ideal for the presentation of either sales projections or historical sales data. This template can be used to examine diverse fiscal information, for the resolutions of making important business choices. The users can edit the features of this PowerPoint template, change color combination reshape the bars, are some of the few.
Sample bar chart template is commonly used when you need to represent data or make comparisons. It has X and Y axis, while one axis shows the categories, other shows the value associated to it. Bar Chart are mostly rectangular bars on a graph displayed either horizontally or vertically and the length of the bars vary depending on the values. This group bar chart sample has more than two bars which show comparison amongst more than one category. You can add in the necessary details, text and prepare a slide to show revenue gained or lost over a period of time, company performance, product sale, business growth etc. Bar Chart used during a meeting will add value to your presentations; the template is having both keynote and PowerPoint version.
Attached Files
| File |
|---|
| SB00002-Bar-Chart-Sample.zip |
Login to download this file
Add to favorites
Add to collection
-

Item ID
SB00002 -

Related Templates
-

Sales Deck Free PowerPoint Template
PowerPoint Templates
Free
-

Nature PowerPoint Presentation Template
PowerPoint Business Templates
Premium
-

Research Proposal PowerPoint Template
PowerPoint Templates
Premium
-

Cab Service PowerPoint Template
PowerPoint Templates
Premium
-

Free Vertical PowerPoint Template
PowerPoint Business Templates
Free
-

Free Nursing Capstone PowerPoint Deck
PowerPoint Templates
Free
-

Gym PowerPoint Template
PowerPoint Templates
Premium
-

VET Clinic PowerPoint Template
PowerPoint Templates
Premium
-

Free Space Minimal Deck Template
PowerPoint Templates
Free
-

Travel Agency PowerPoint Template
PowerPoint Templates
Premium
-

Free Physical Education PowerPoint Template Deck
Free PowerPoint Templates
Free
-

IoT Presentation Template
PowerPoint Templates
Premium
-

Effective Communication PowerPoint Template
PowerPoint Templates
Premium
-
World Map Infographic PowerPoint Template and Keynote Slide
PowerPoint Charts
Premium
-

PowerPoint Quiz With Timer
PowerPoint Templates
Premium
-

Pencil Bar Chart PowerPoint Template and Keynote Slide
Column and Bar chart
Premium
-

Annual Report PowerPoint Template and Keynote
PowerPoint Templates
Premium
-

Graph Paper PowerPoint Template Deck
PowerPoint Templates
Premium
-

Customer Experience Loyalty PowerPoint Deck Template
PowerPoint Templates
Premium
-

Macroeconomics PowerPoint Template
PowerPoint Templates
Premium
-

Free Economics PowerPoint Template
Free PowerPoint Templates
Free
-
Cylinder Bar Chart PowerPoint Template and Keynote Slide
Column and Bar chart
Premium
-

Free Aviation PowerPoint Template
Free PowerPoint Templates
Free
-

Free Charity PowerPoint Template Deck
PowerPoint Templates
Free
-

Free Army PowerPoint Template
PowerPoint Templates
Free
-

Free Cartoon PowerPoint Template
Free PowerPoint Templates
Free
-

Radial Bar Chart PowerPoint Templates and Keynote Slides
PowerPoint Charts
Premium
-
Data Bar Chart Template for PowerPoint and Keynote
Column and Bar chart
Premium
-

Animated Agriculture PowerPoint Deck Template
PowerPoint Templates
Premium
-

Free Real Estate Listing PowerPoint Template
Free PowerPoint Templates
Free
-
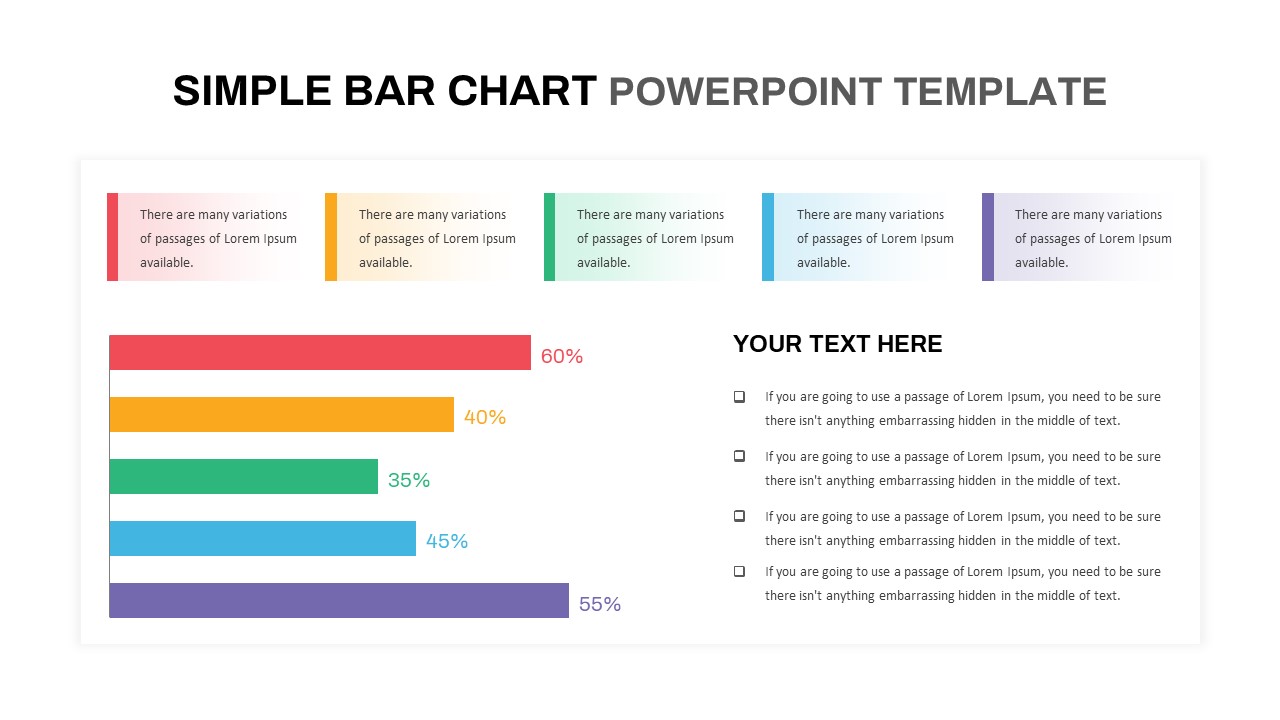
Simple Bar Chart PowerPoint Template
Column and Bar chart
Premium
-
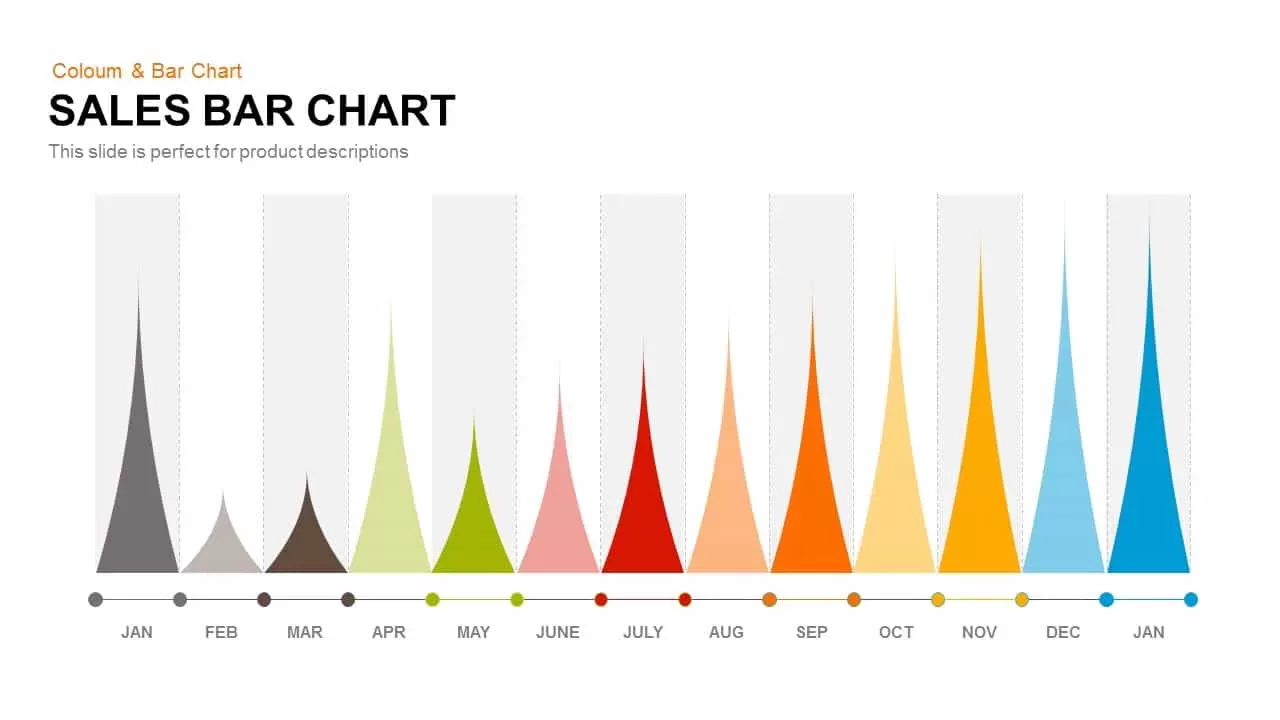
Sales Bar Chart Template for PowerPoint and Keynote
Column and Bar chart
Premium
-

Free University Presentation PowerPoint Template
PowerPoint Templates
Free
-
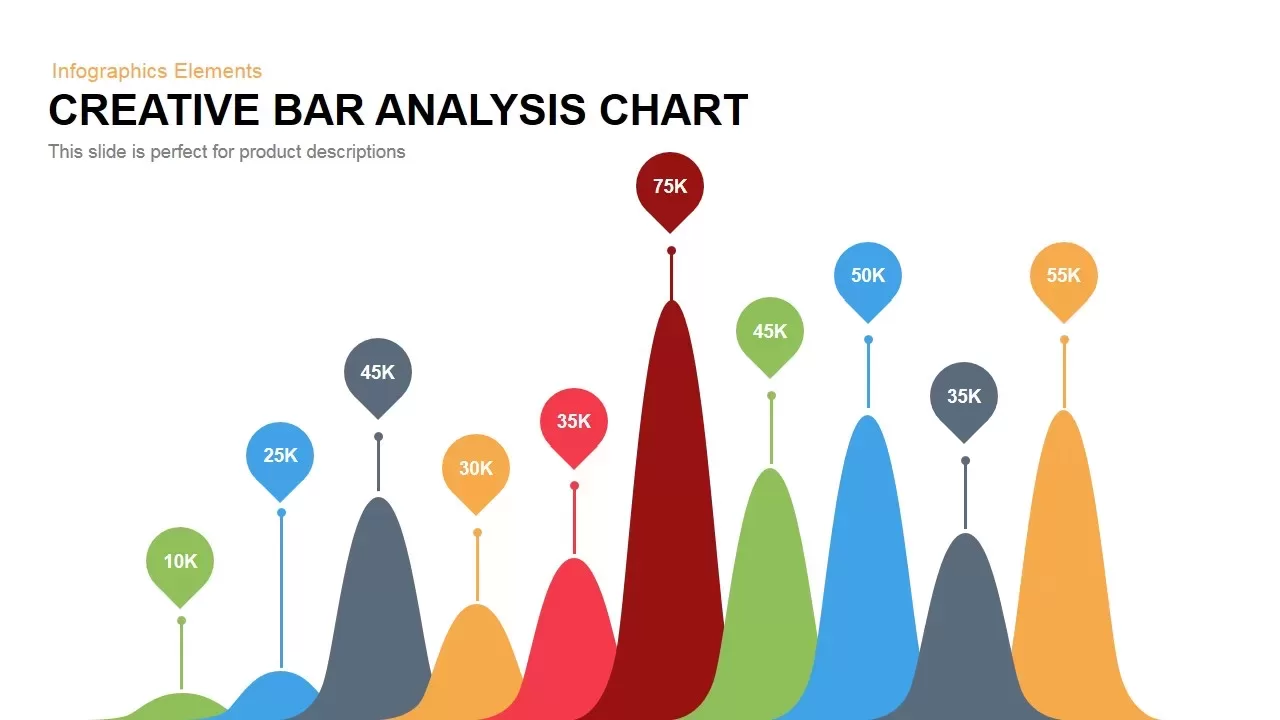
Creative Bar Chart Analysis PowerPoint Template and Keynote
Column and Bar chart
Premium
-
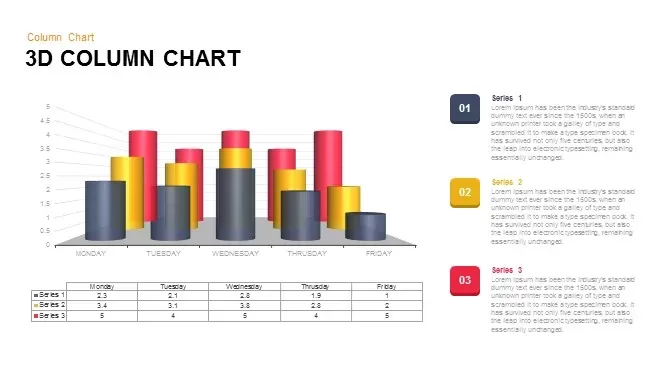
3D Column Chart for PowerPoint and Keynote Presentation
PowerPoint Charts
Premium
-

Free Event Planning PowerPoint Template
Free PowerPoint Templates
Free
-

Free Book Review PowerPoint Template
Free PowerPoint Templates
Free
-

Creative Bar Chart Data Analysis PowerPoint Template and Keynote
Infographic
Premium
-
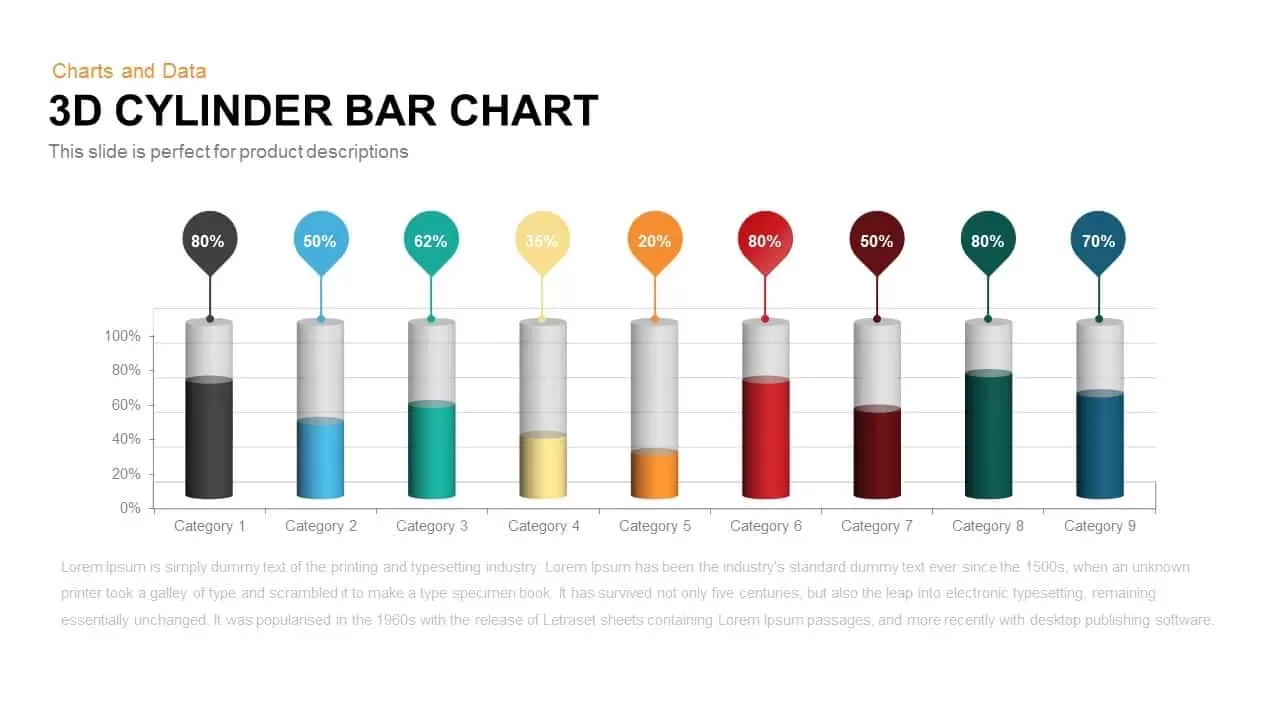
3D Cylinder Bar Chart PowerPoint Template and Keynote Slide
Column and Bar chart
Premium
-

Global Warming Infographic PowerPoint Template Deck
PowerPoint Templates
Premium
-

EFQM Model PowerPoint Template
PowerPoint Templates
Premium
-
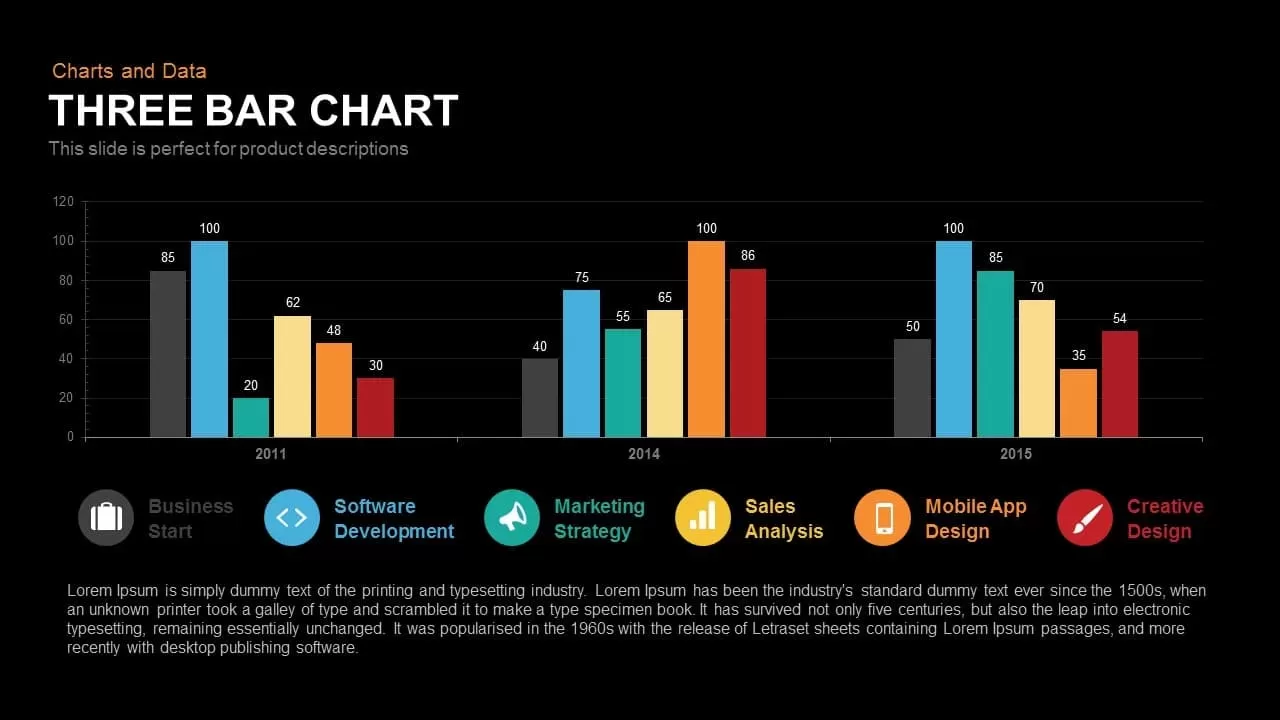
3 Bar Chart PowerPoint Template and Keynote Slide
Column and Bar chart
Premium
-

Data Science PowerPoint Template
PowerPoint Templates
Premium
-
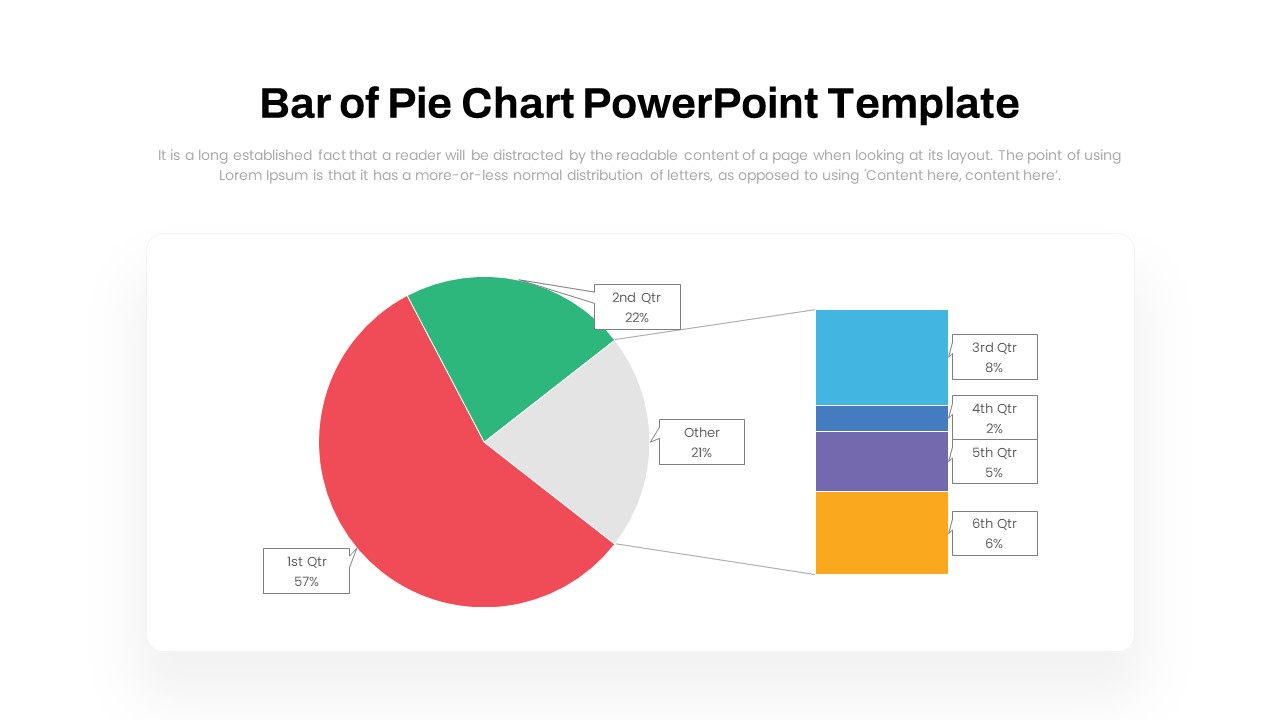
Bar of Pie Chart PowerPoint Template
PowerPoint Templates
Premium
-

Free Dunder Mifflin Paper Company Pitch Deck
Free PowerPoint Templates
Free
-

Real Estate PowerPoint Theme
PowerPoint Themes
Premium
-

Animated Clustered Bar Chart PowerPoint Template
PowerPoint Charts
Premium
-
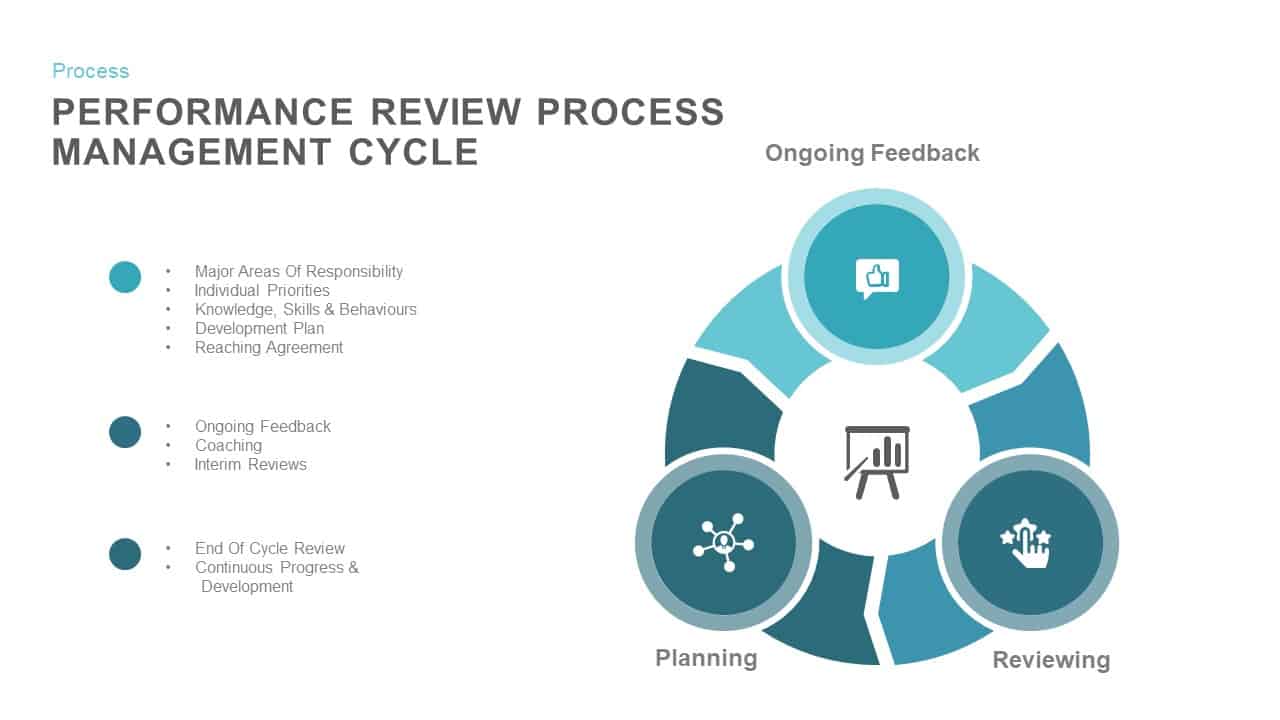
Performance Review Process Cycle PowerPoint and Keynote Slides
Diagrams
Premium
-
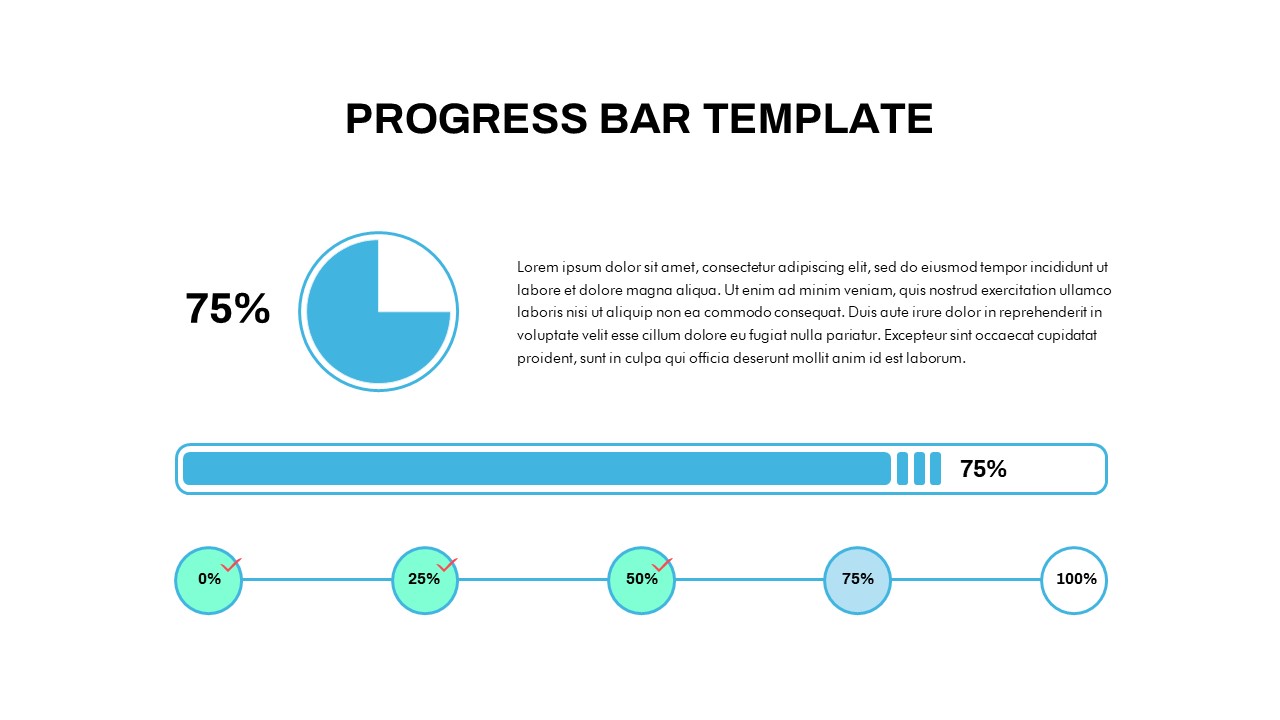
Progress Bar Chart PowerPoint Template
PowerPoint Templates
Premium
-
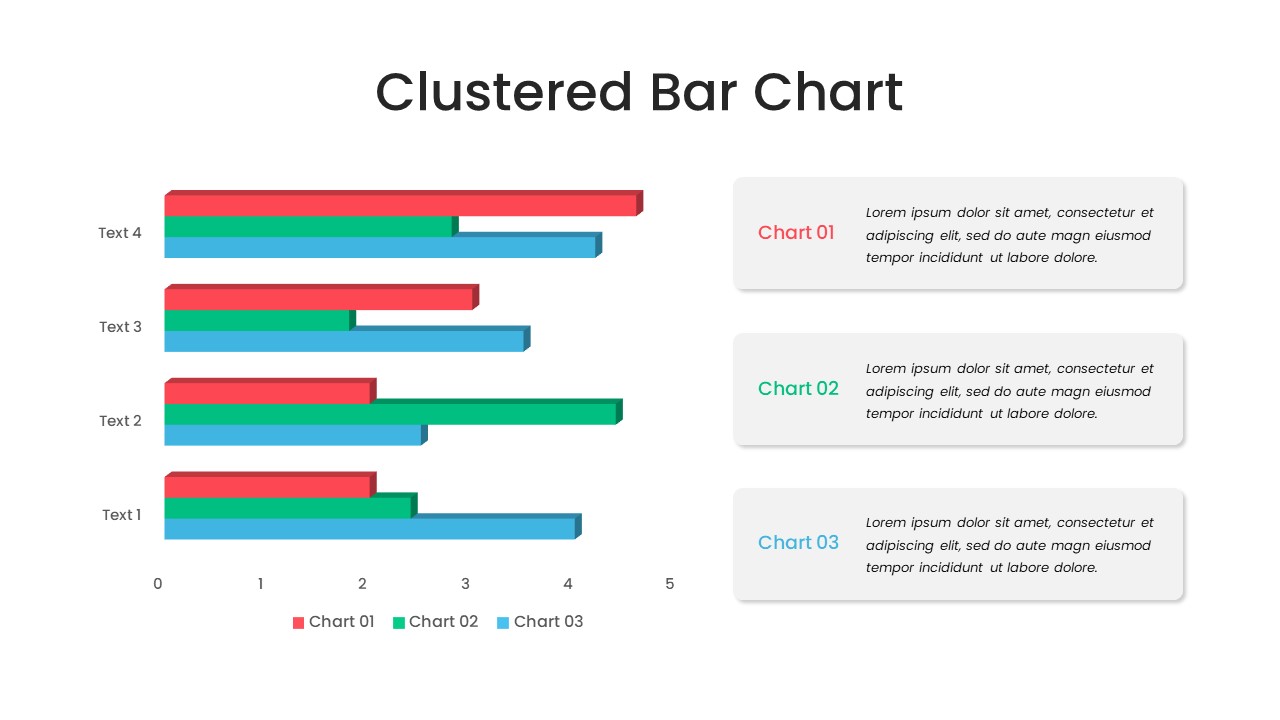
Clustered Bar Chart PowerPoint Template
Column and Bar chart
Premium
-
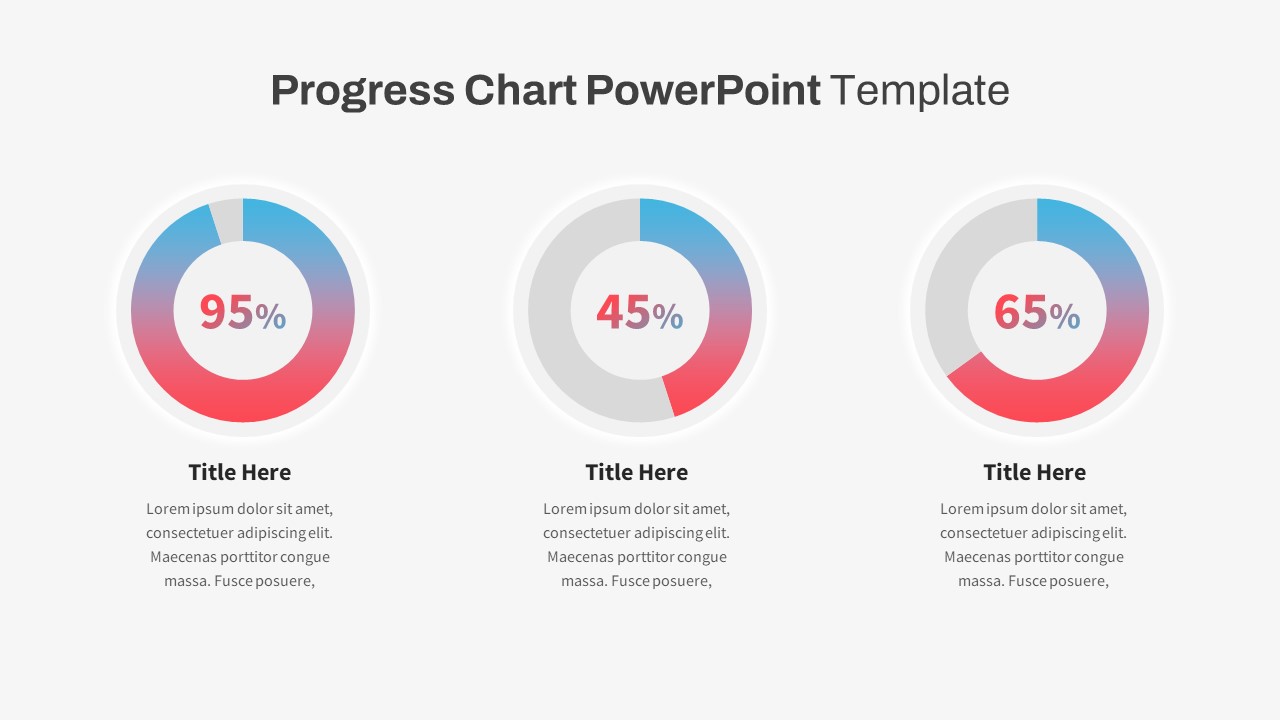
Progress Chart PowerPoint Template
PowerPoint Templates
Premium
-
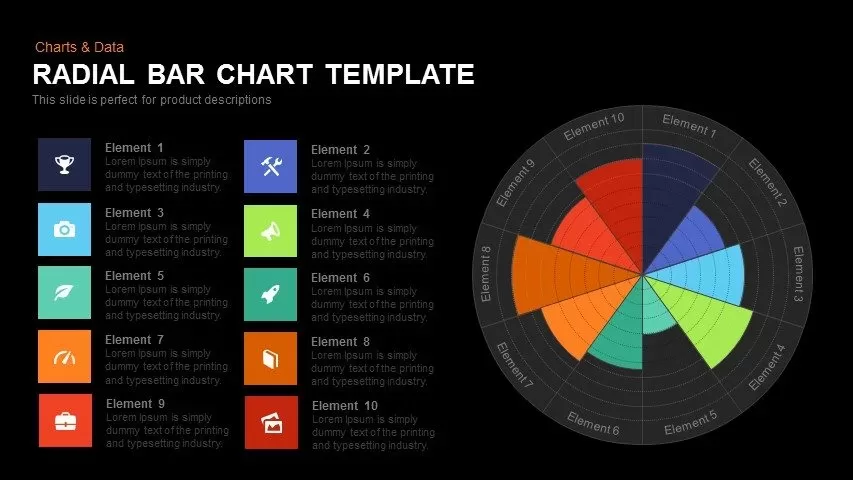
Radial Bar Chart Template for PowerPoint and Keynote
Circular Diagrams
Premium
-

Business Process Reengineering Template
PowerPoint Templates
Premium
-
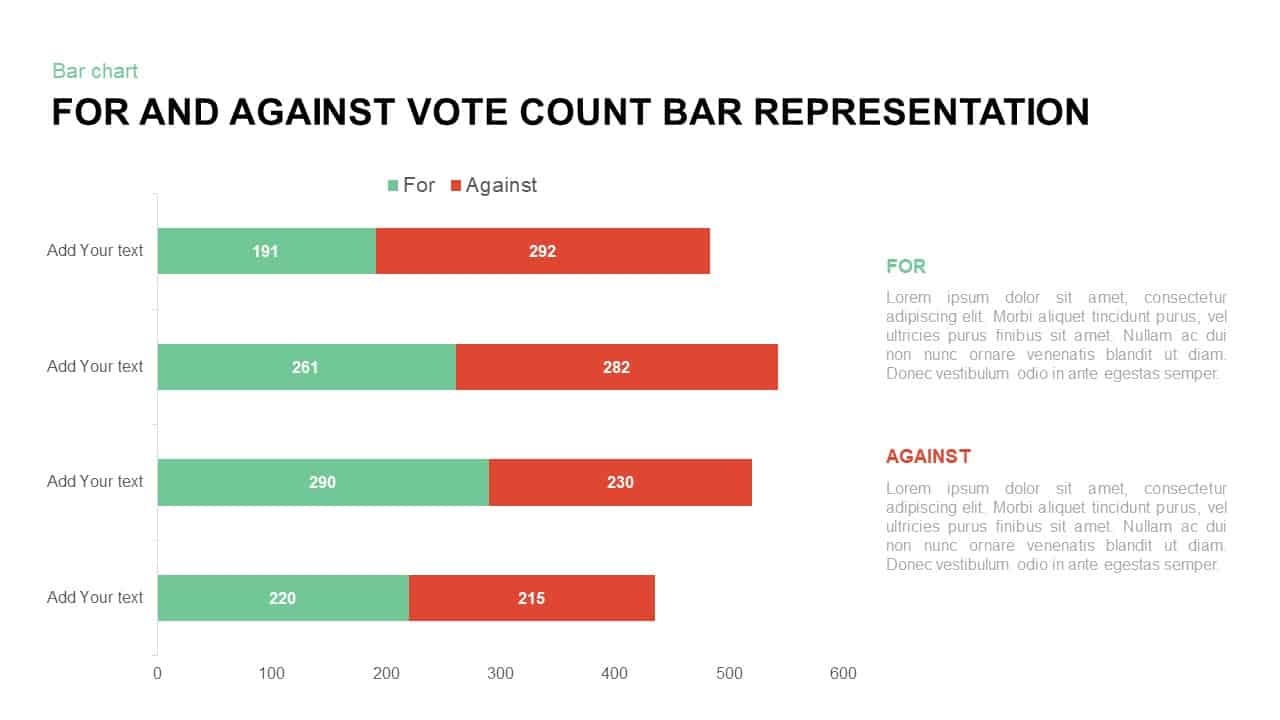
For and Against Vote Count Bar Chart for PowerPoint Presentation
Column and Bar chart
Premium
-
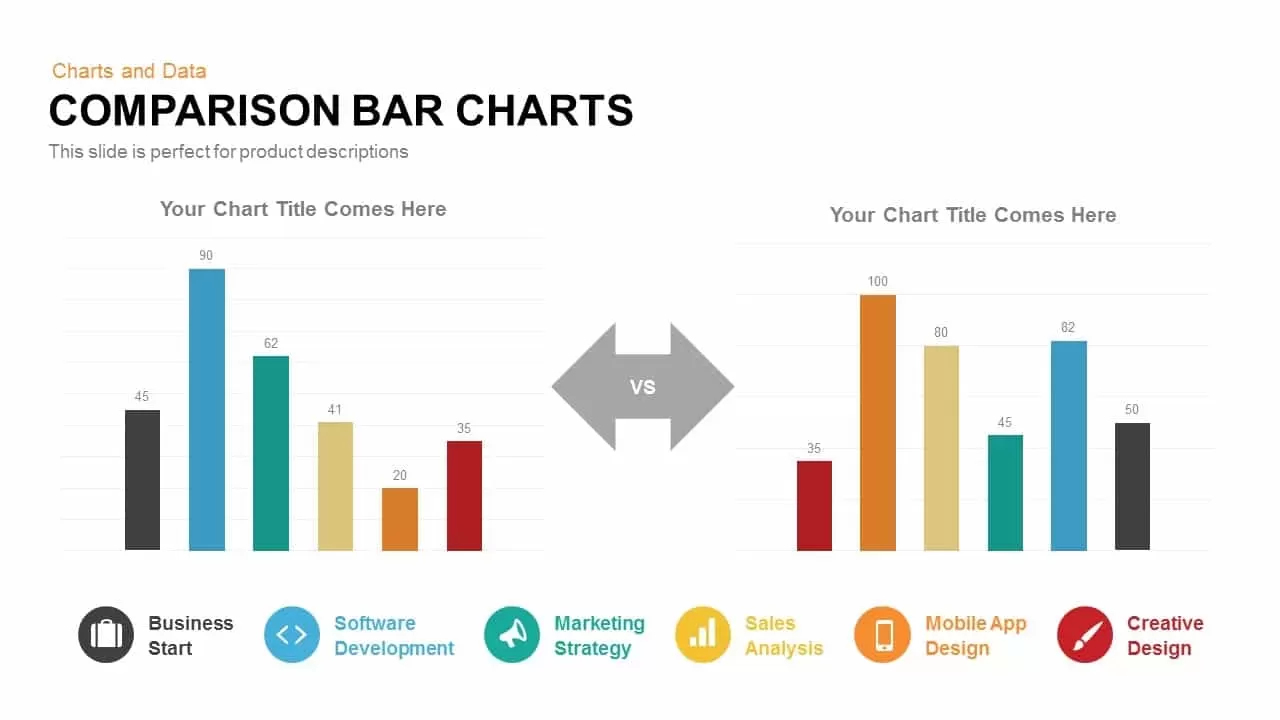
Comparison Bar Charts PowerPoint Template and Keynote Slide
Column and Bar chart
Premium
-
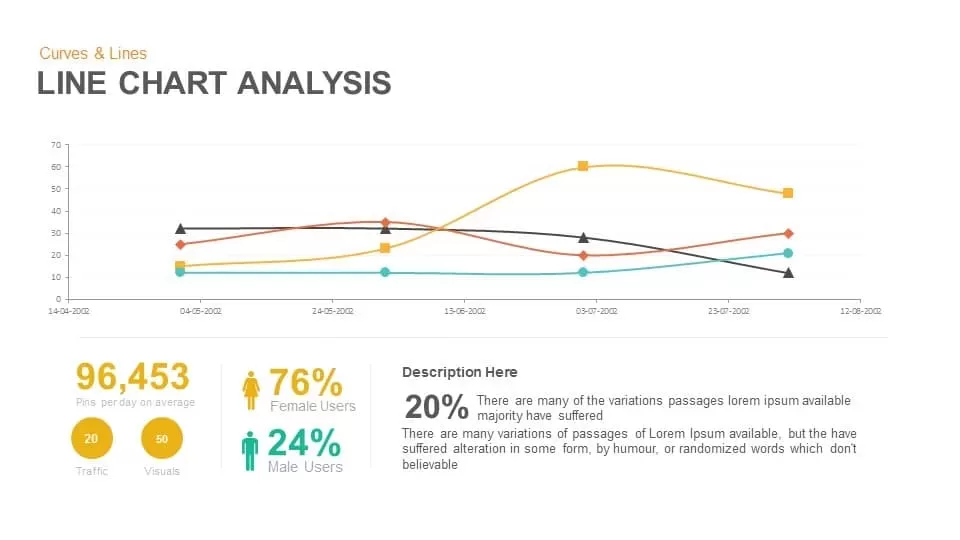
Line Chart Analysis PowerPoint Template and Keynote Slide
Curves and Lines
Premium
-
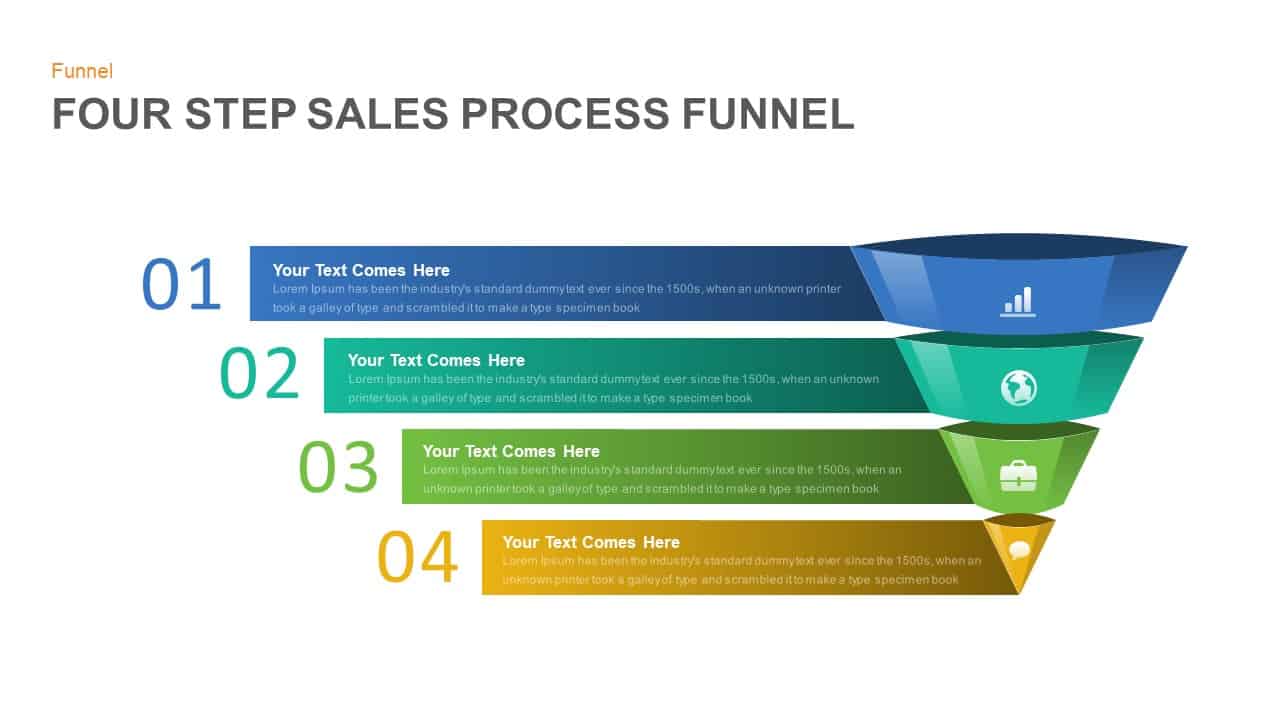
4 Step Sales Funnel Template PowerPoint
Funnel Diagrams
Premium
-

Stakeholder Register PowerPoint Template
PowerPoint Templates
Premium
-
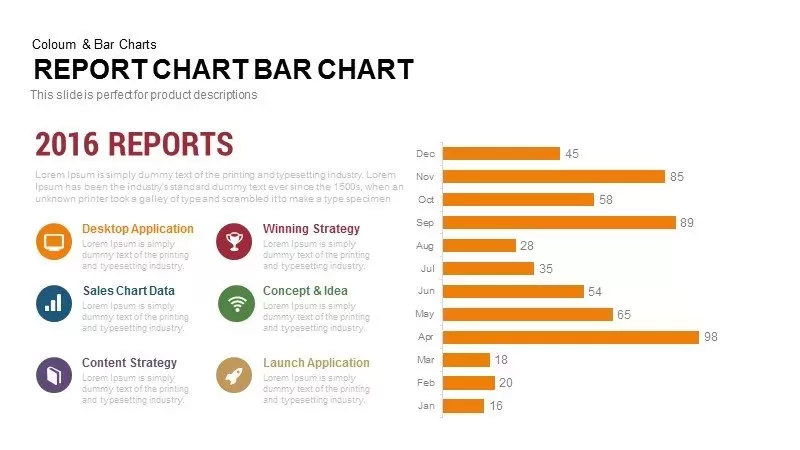
Report Bar Chart PowerPoint Template and Keynote
Column and Bar chart
Premium
-
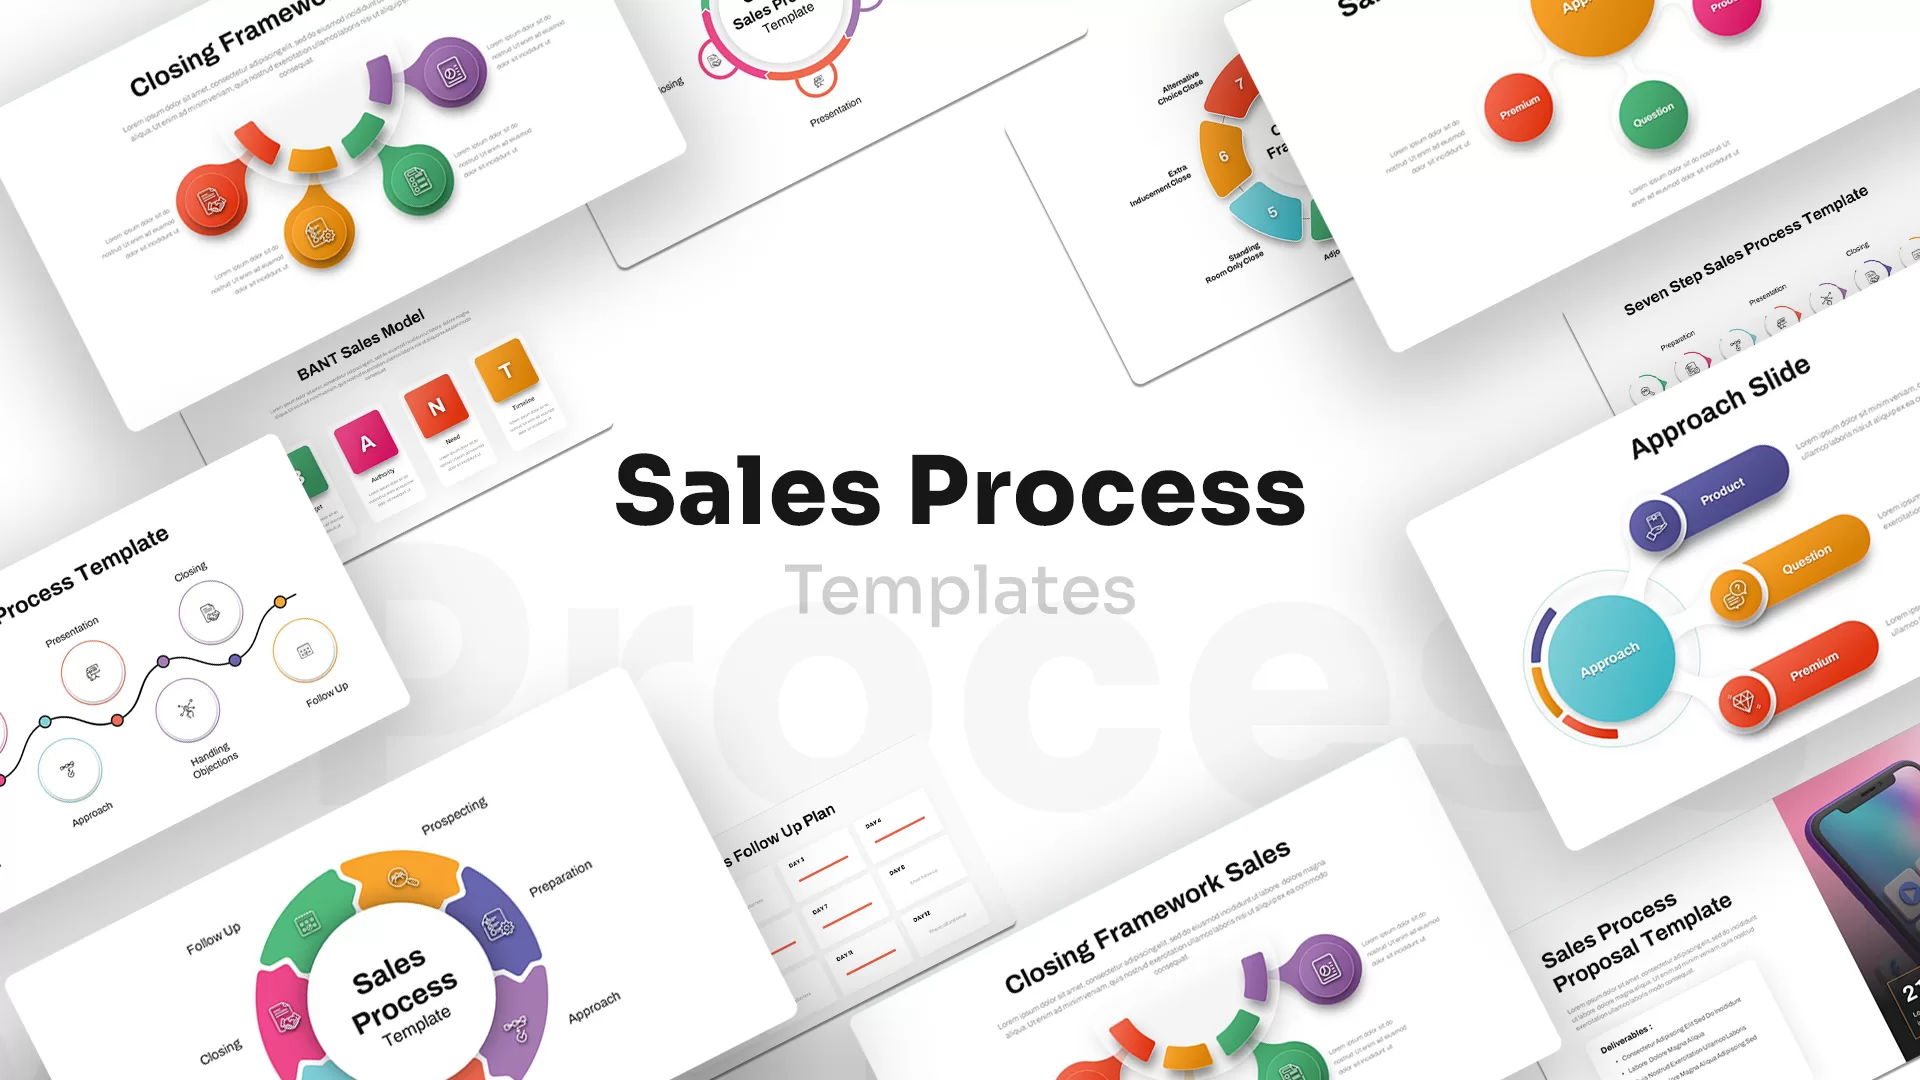
Sales Process PowerPoint Template
PowerPoint Templates
Premium
-

Free Charts and Graphs PowerPoint Template
PowerPoint Templates
Free
-
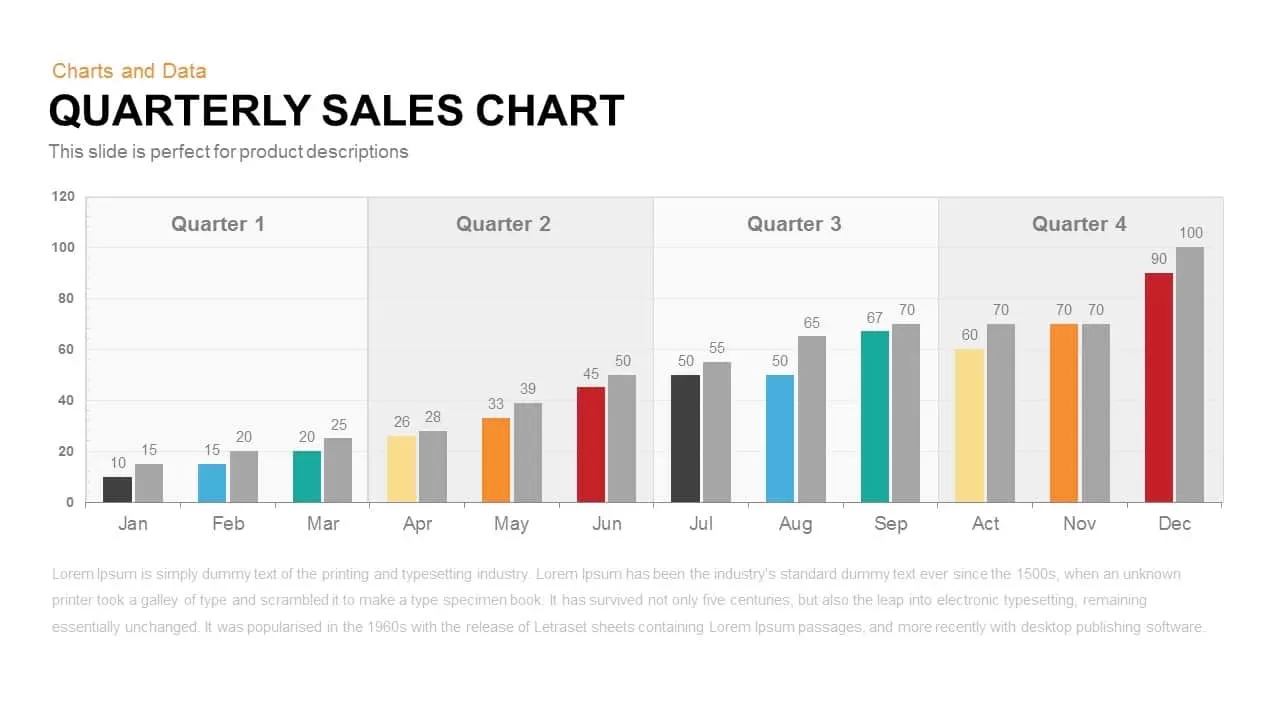
Quarterly Sales Chart PowerPoint Template and Keynote Slide
Column and Bar chart
Premium
-
Timeline Bar Chart PowerPoint
Column and Bar chart
Premium
-
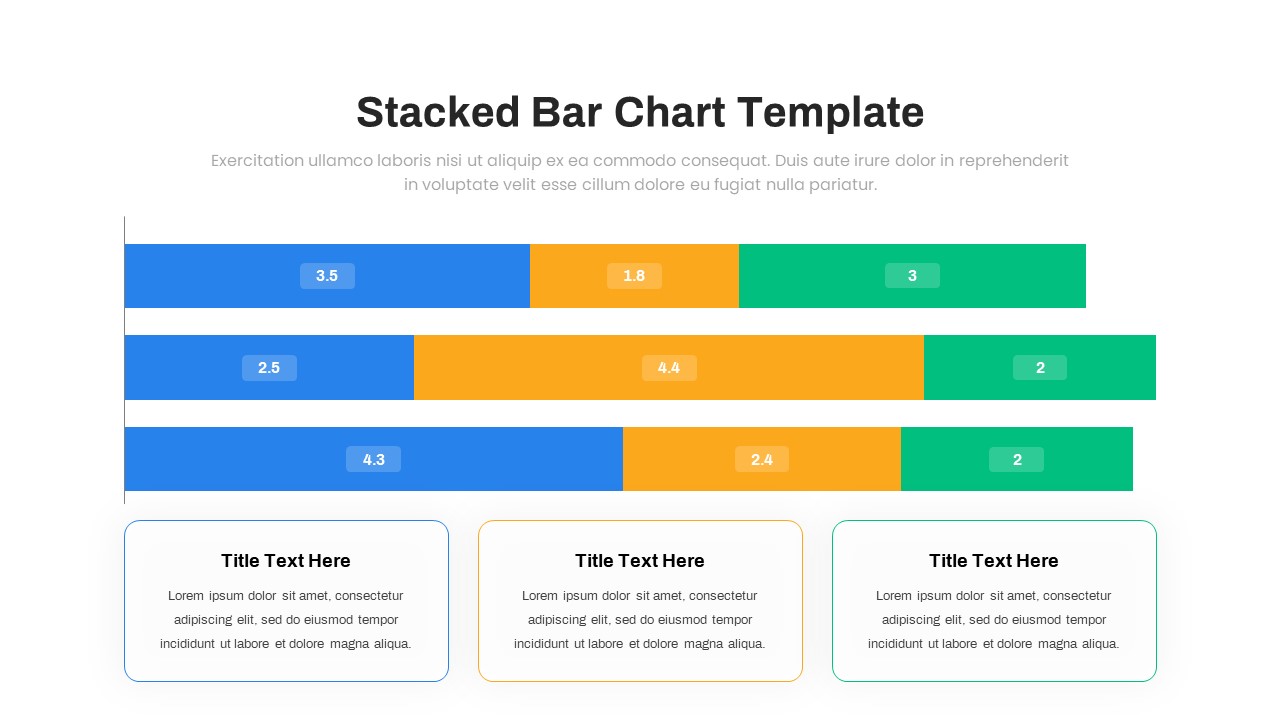
Animated Stacked Bar Chart PowerPoint Template
Column and Bar chart
Premium
-

Free AI Artificial Intelligence PowerPoint Template
PowerPoint Templates
Free
-
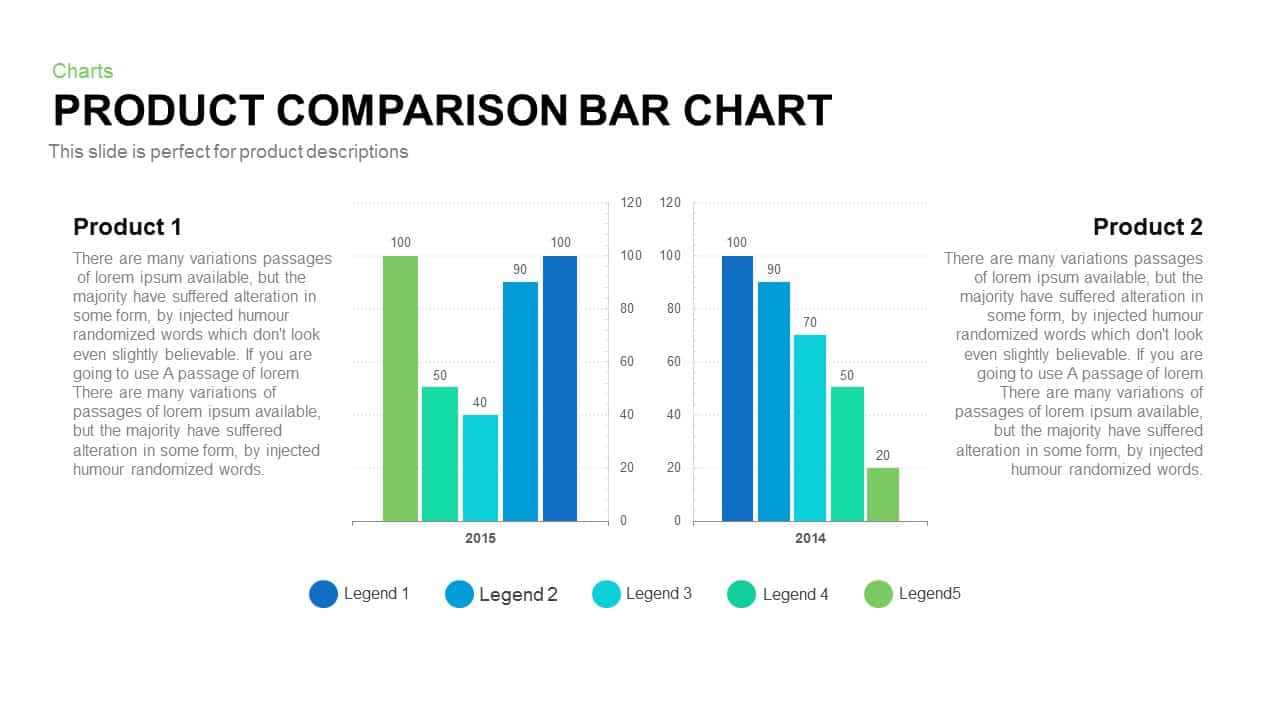
Product Comparison Bar Chart Template for PowerPoint and Keynote
PowerPoint Charts
Premium
-
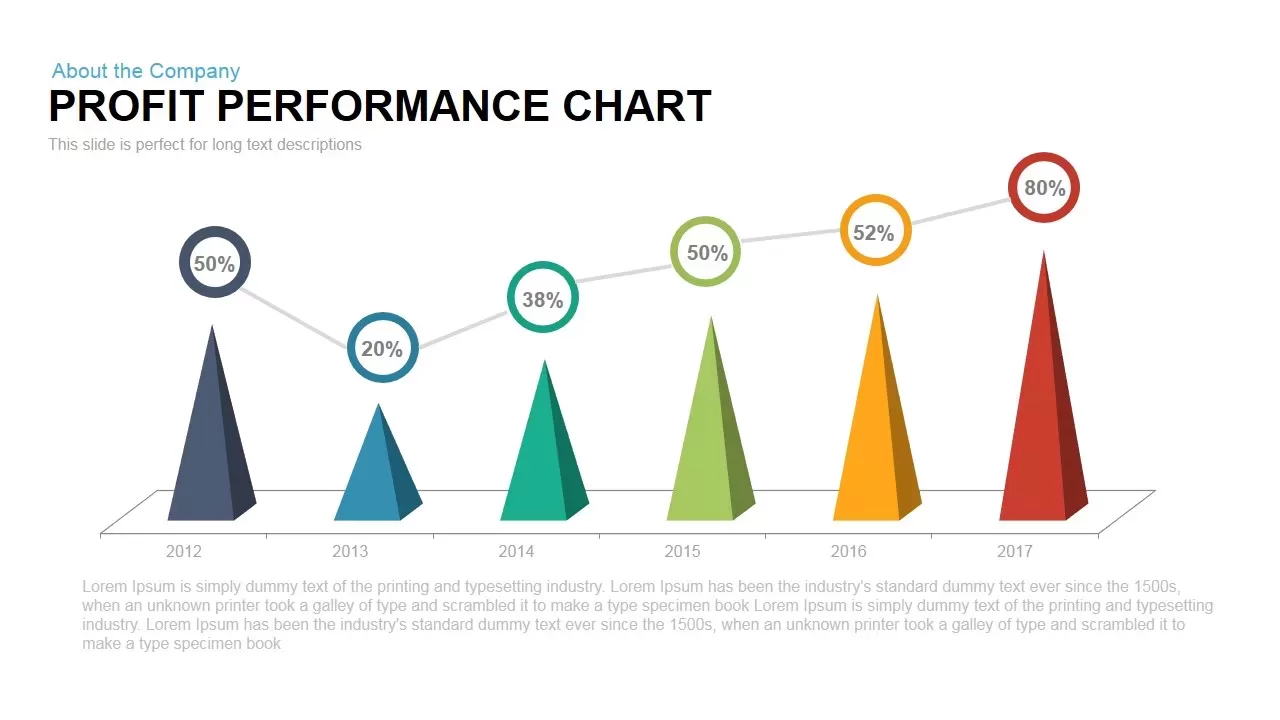
Profit Performance Chart PowerPoint Template
PowerPoint Charts
Premium
-
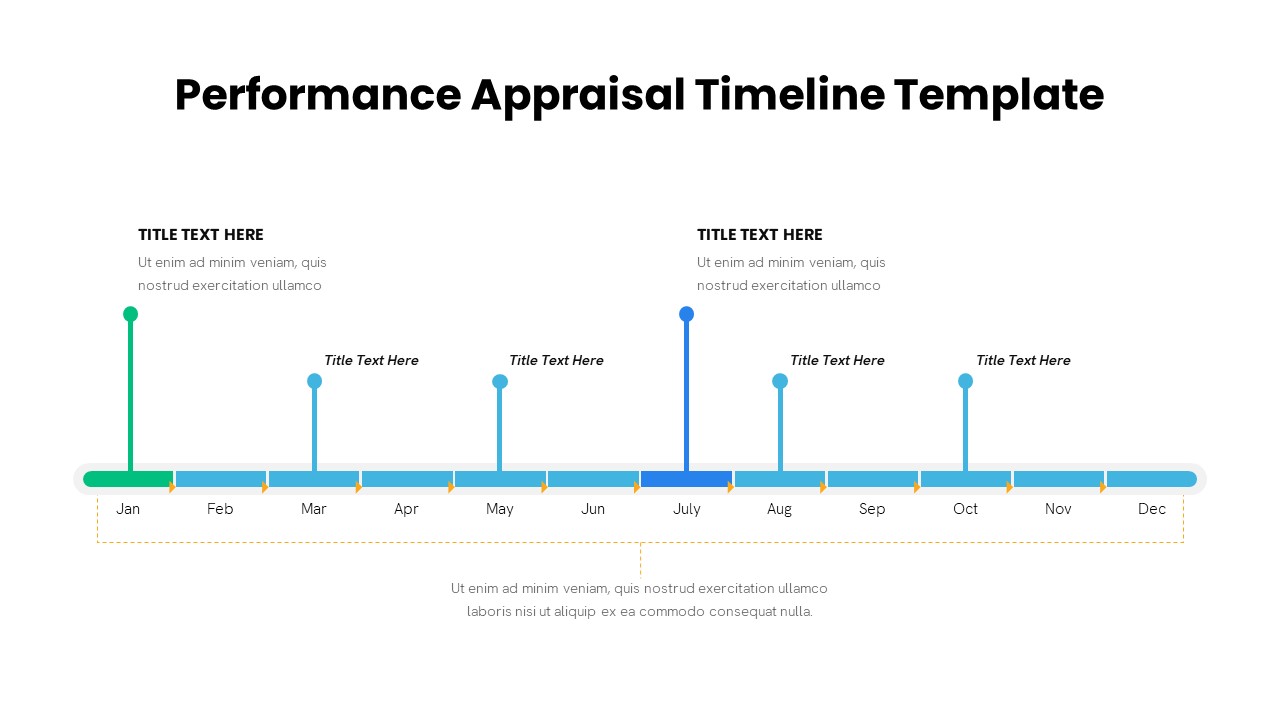
Performance Appraisal Timeline Template
Timeline PowerPoint Template
Premium
-

Proportional Area Chart PowerPoint Template
PowerPoint Templates
Premium
-
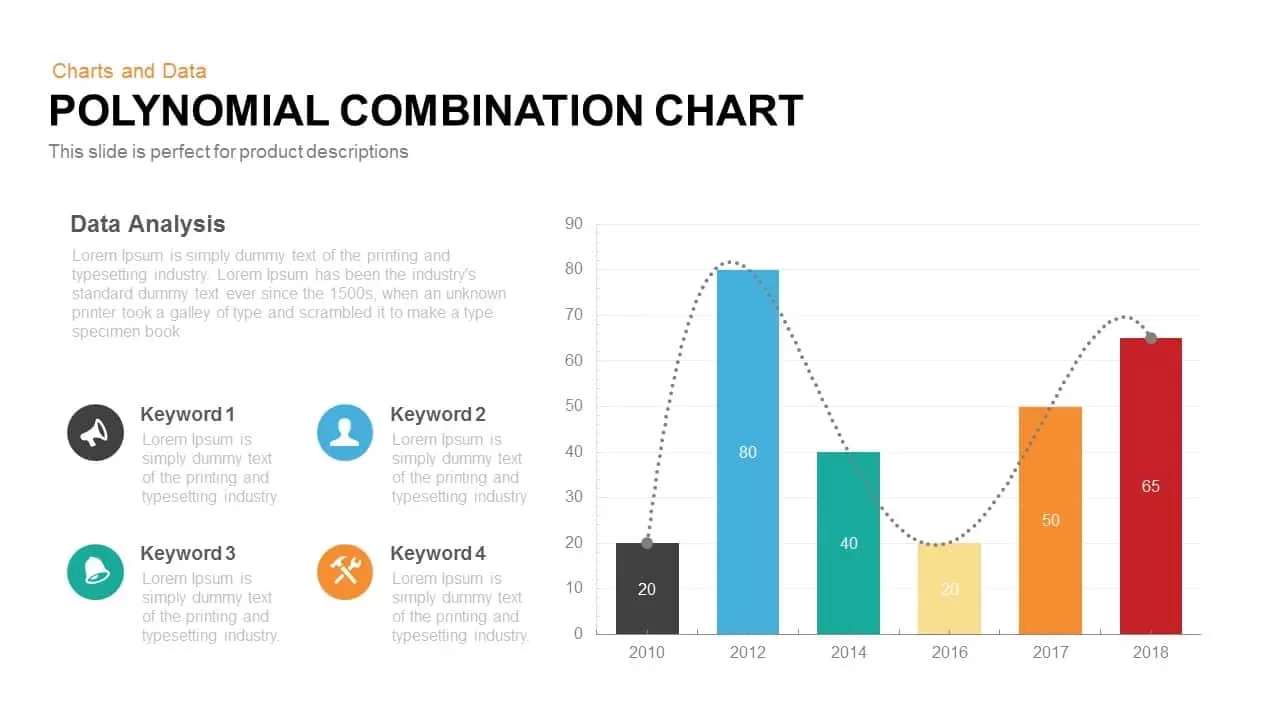
Polynomial Combination Chart PowerPoint Template and Keynote Slide
Column and Bar chart
Premium
-
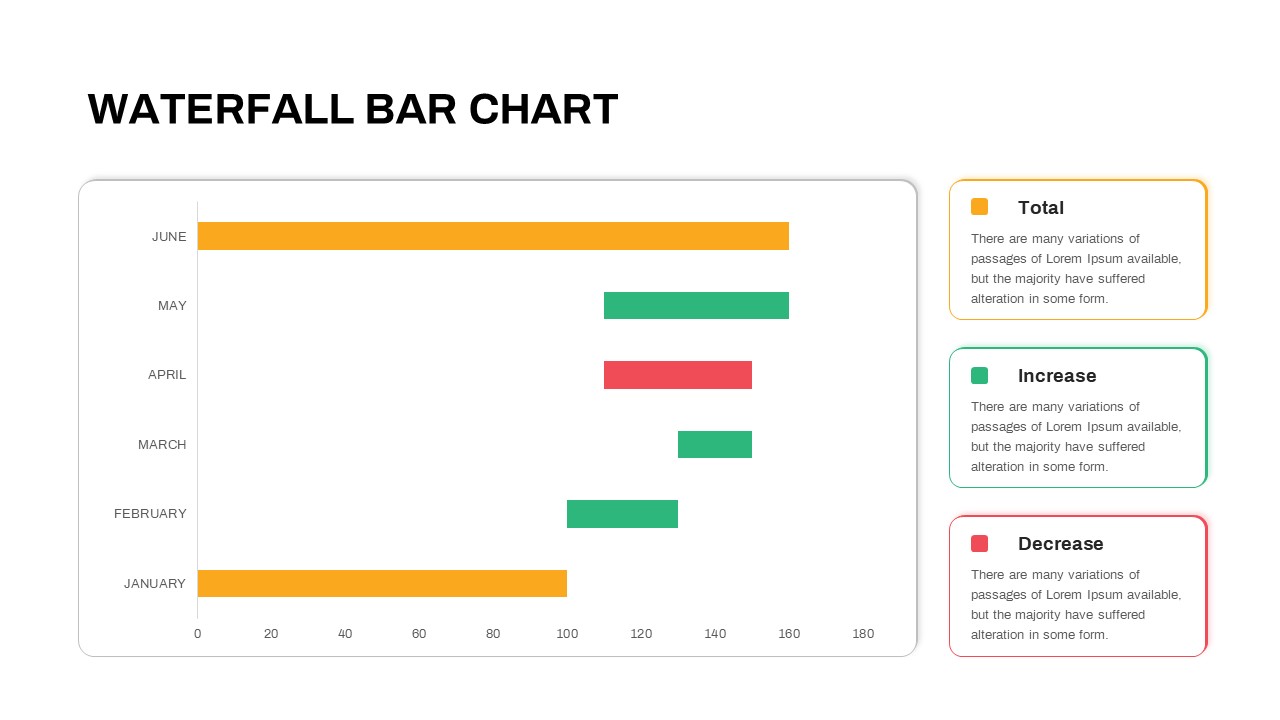
Waterfall Bar Chart PowerPoint Template
PowerPoint Charts
Premium
-

Clustered Column Chart PowerPoint Template
PowerPoint Charts
Premium
-
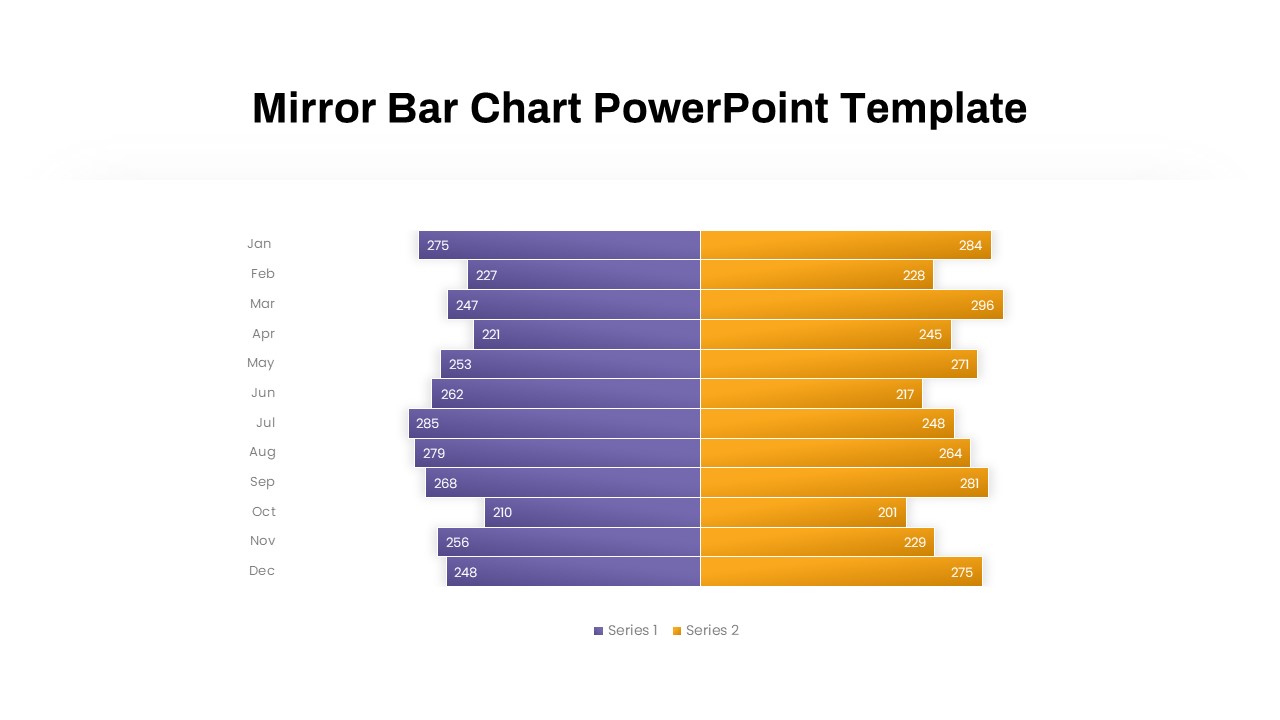
Mirror Bar Chart PowerPoint Template
PowerPoint Templates
Premium
-

Open Door Policy PowerPoint Template
PowerPoint Templates
Premium
-
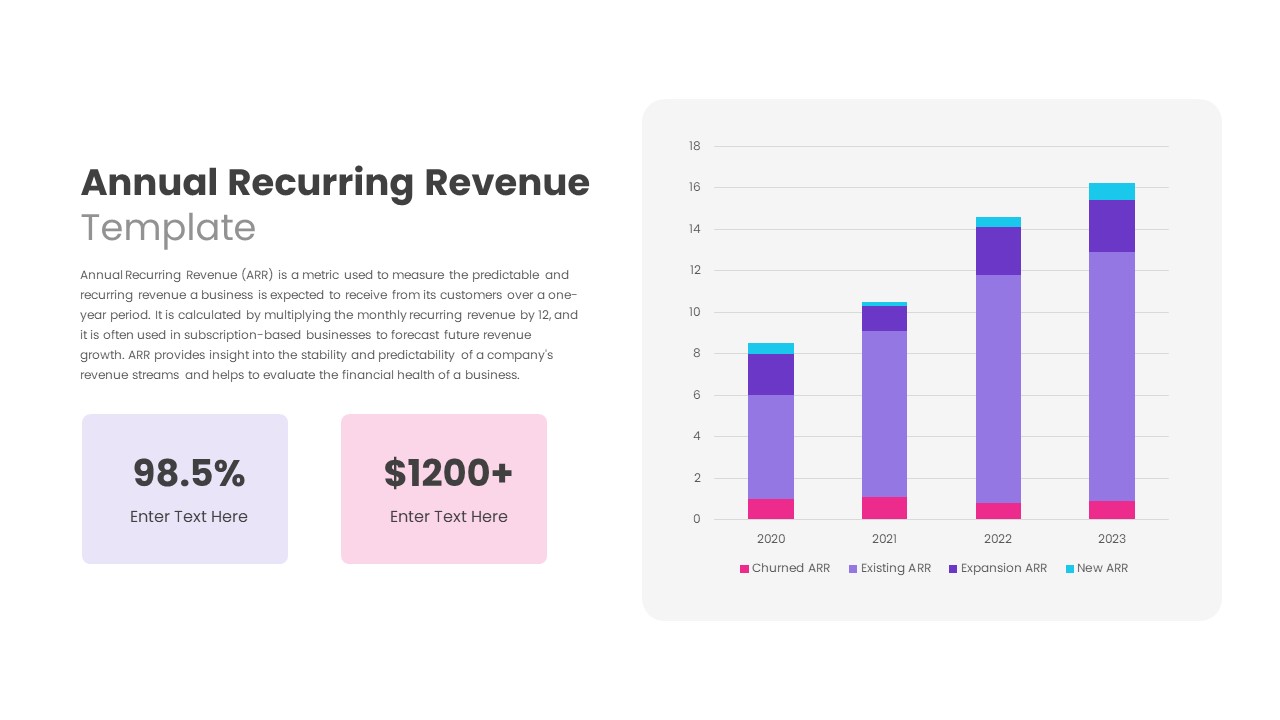
Annual Recurring Revenue PowerPoint Template
PowerPoint Templates
Premium
-
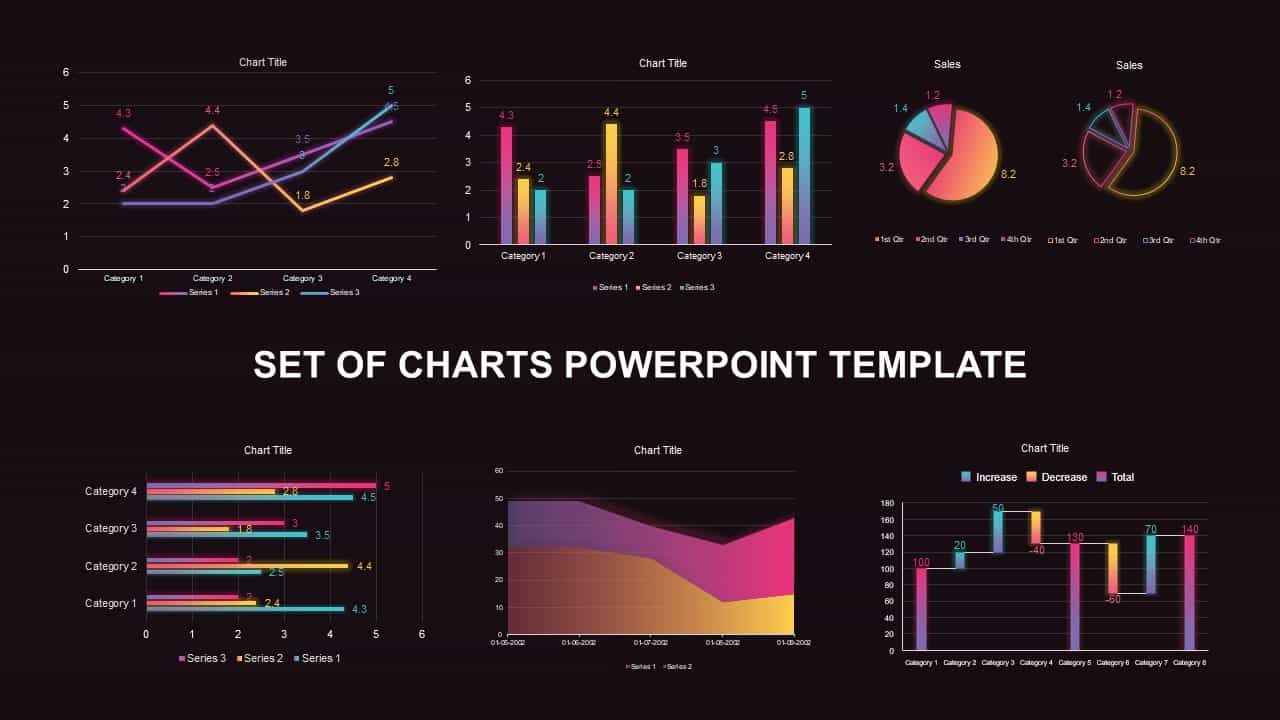
Set of Chart PowerPoint Template and Keynote Diagram
PowerPoint Charts
Premium
-
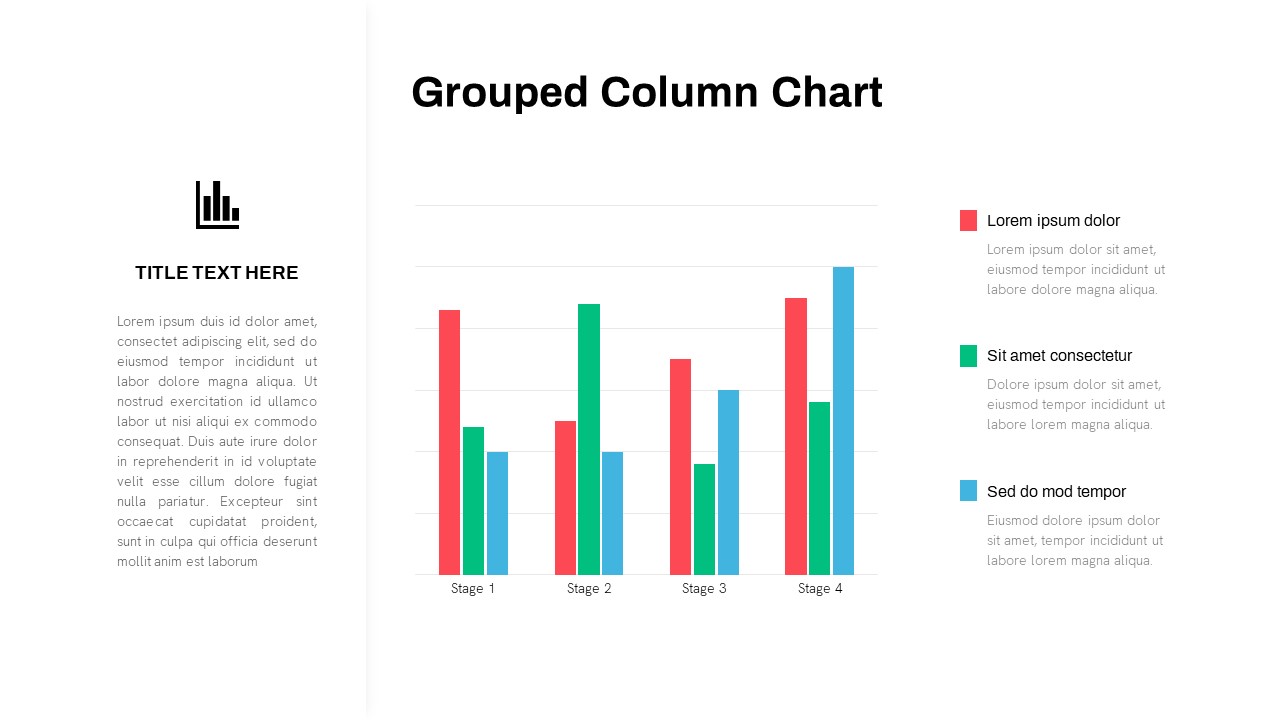
Grouped Column Chart PowerPoint Template
Column and Bar chart
Premium
-
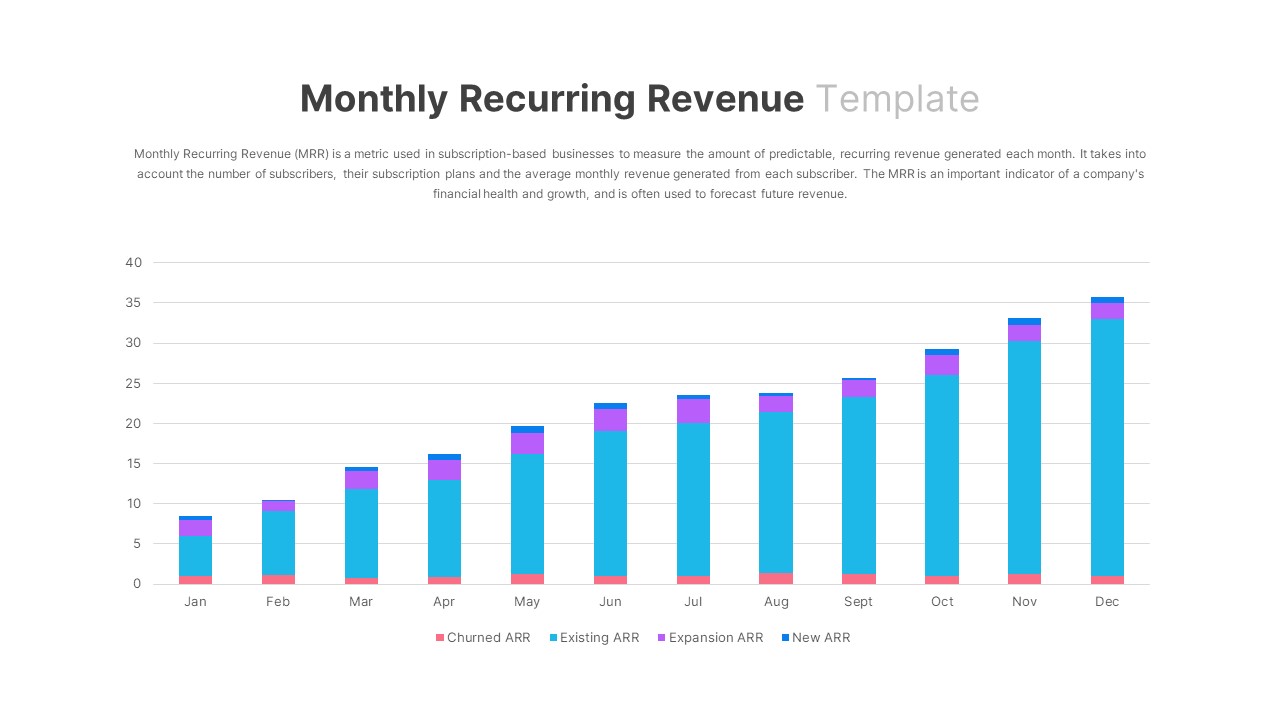
Monthly Recurring Revenue PowerPoint Template
PowerPoint Templates
Premium
-
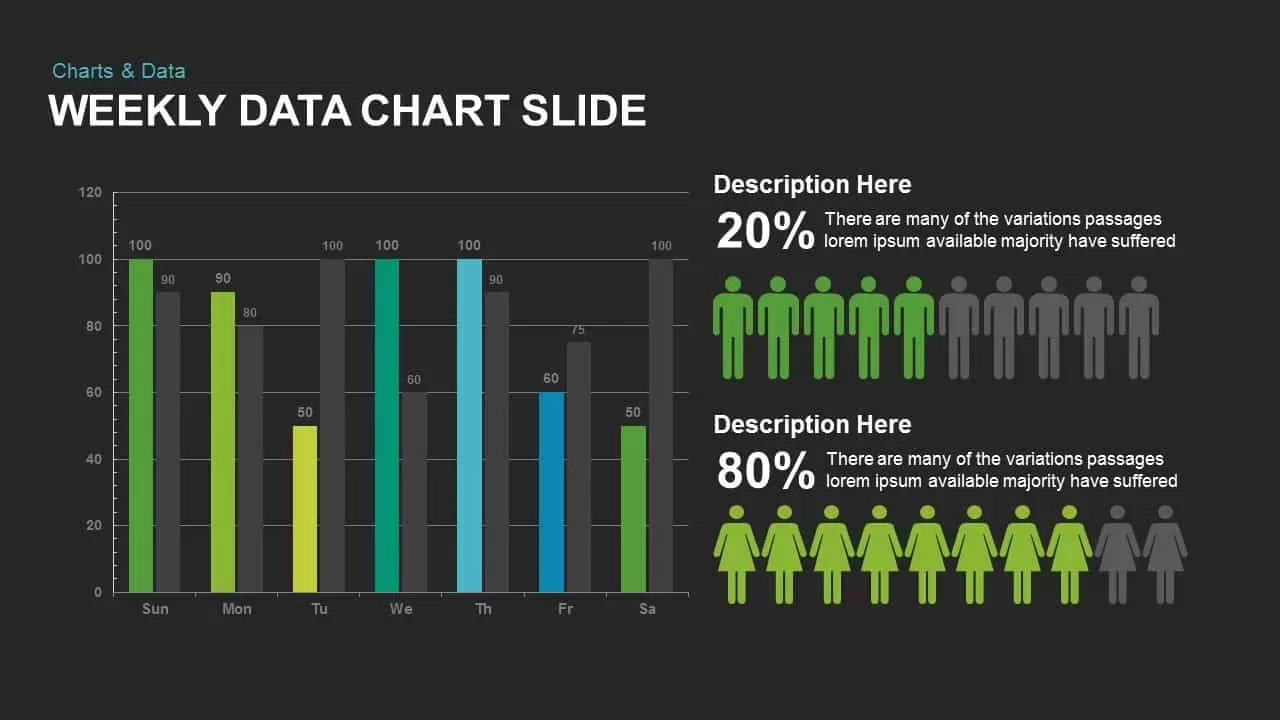
Weekly Data Charts PowerPoint Presentation Template and Keynote Slide
Infographic
Premium
-
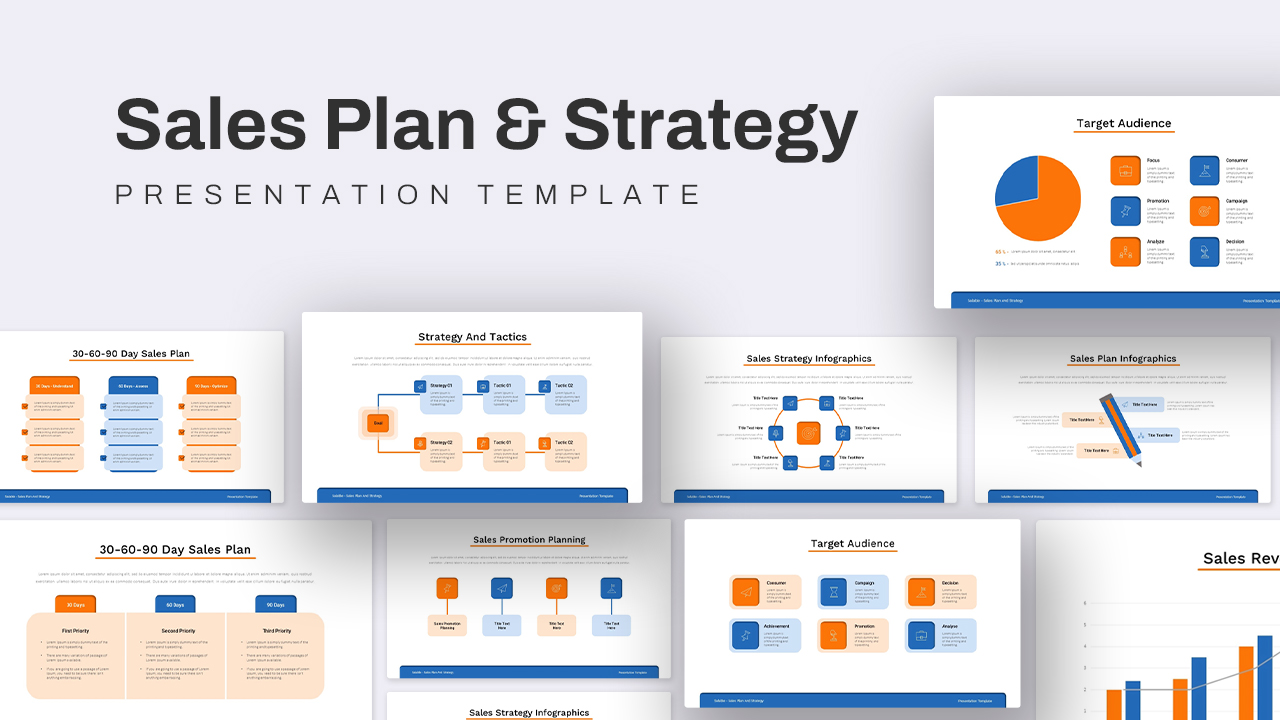
Sales Plan and Strategy Presentation Template
PowerPoint Templates
Premium
-

Animated Upcoming Event Poster PowerPoint Template
PowerPoint Templates
Premium
-
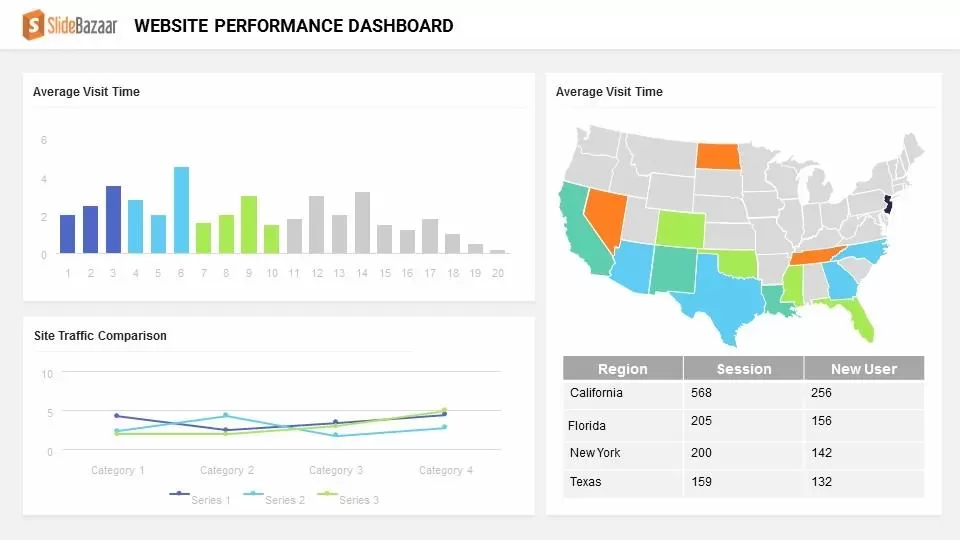
Website Performance Dashboard PowerPoint Template and Keynote
Infographic
Premium
-
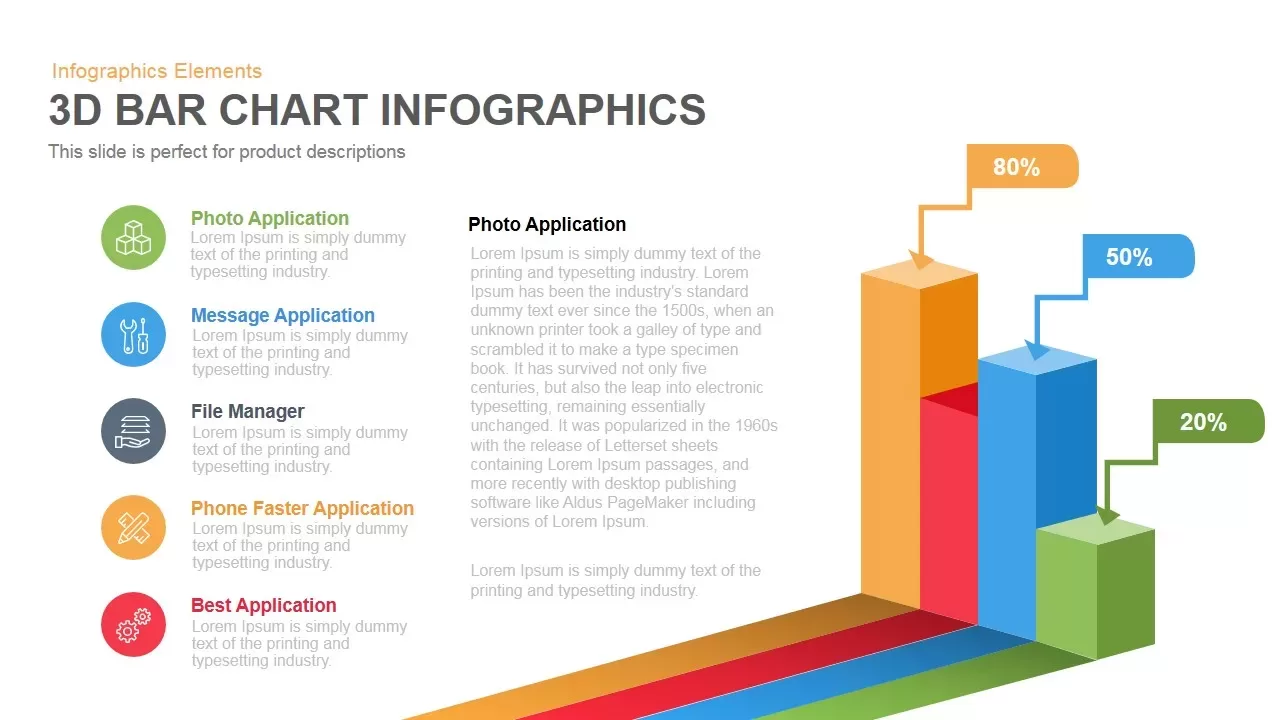
3D Bar Chart Infographics Template for PowerPoint and Keynote
Diagrams
Premium
-

Mekko Chart Template
PowerPoint Templates
Premium
-
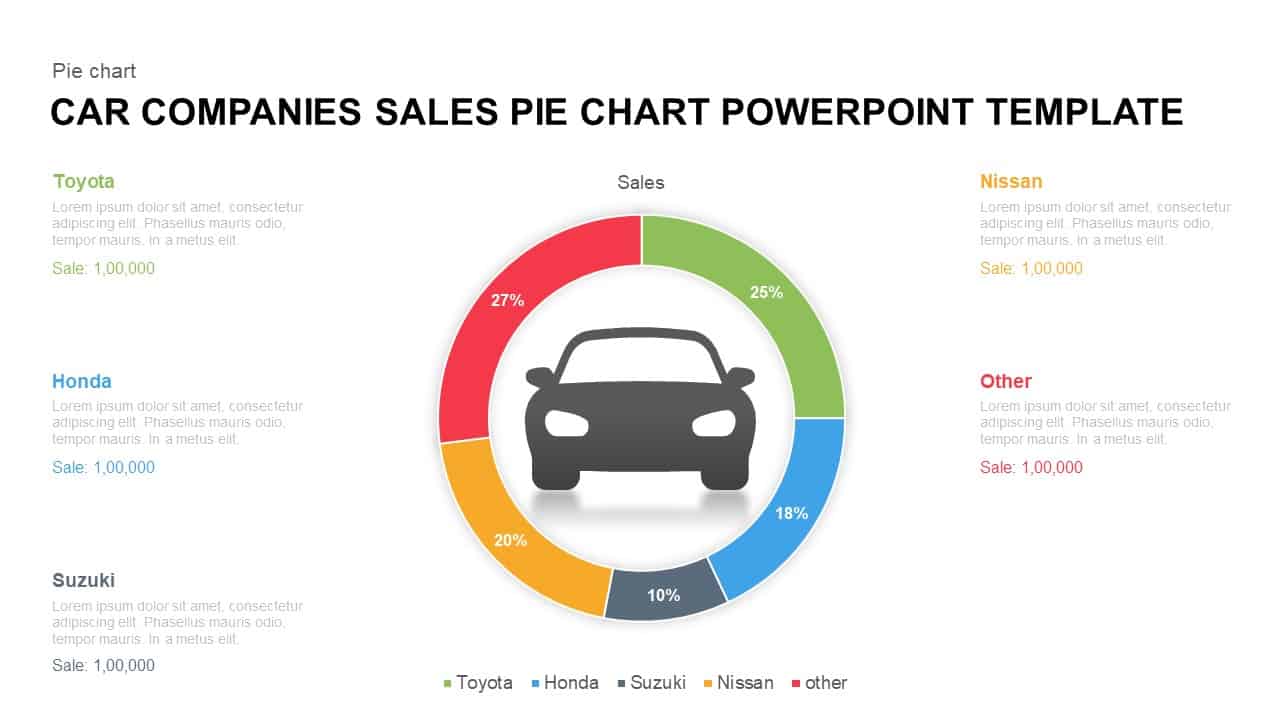
Car Companies Sales Pie Chart Template for PowerPoint & Keynote
Column and Bar chart
Premium
-

Dashboard Template for PowerPoint Presentation
PowerPoint Charts
Premium
-

Combination Chart PowerPoint Template
PowerPoint Charts
Premium
-
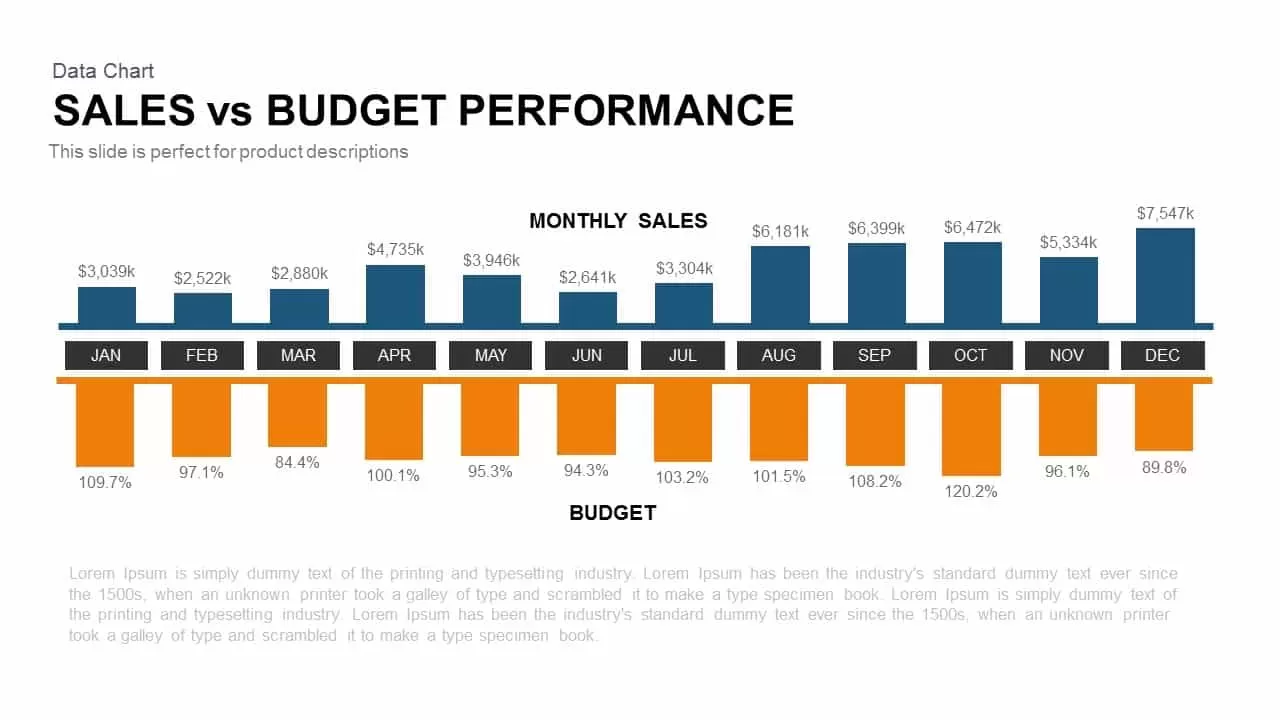
Sales Vs Budget Performance Template for PowerPoint and Keynote
PowerPoint Charts
Premium
-

Sales Meeting Presentation Template
PowerPoint Business Templates
Premium
-
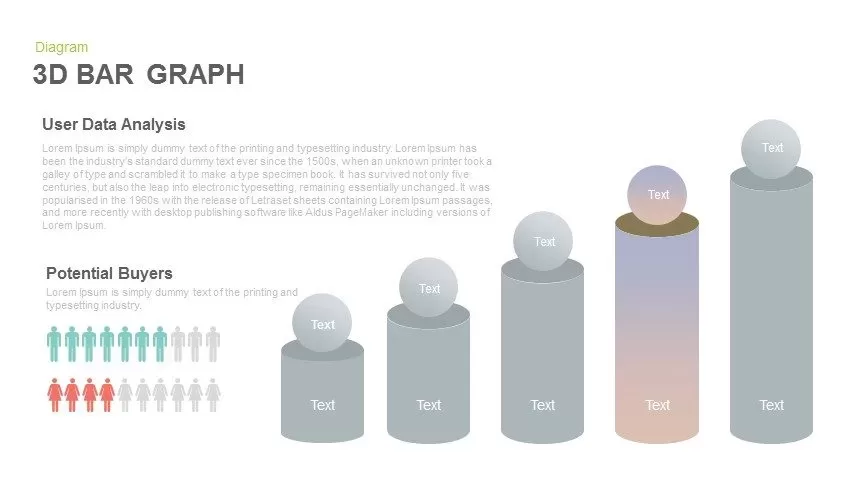
3d Bar Graph PowerPoint Template and Keynote Slide
Diagrams
Premium
-
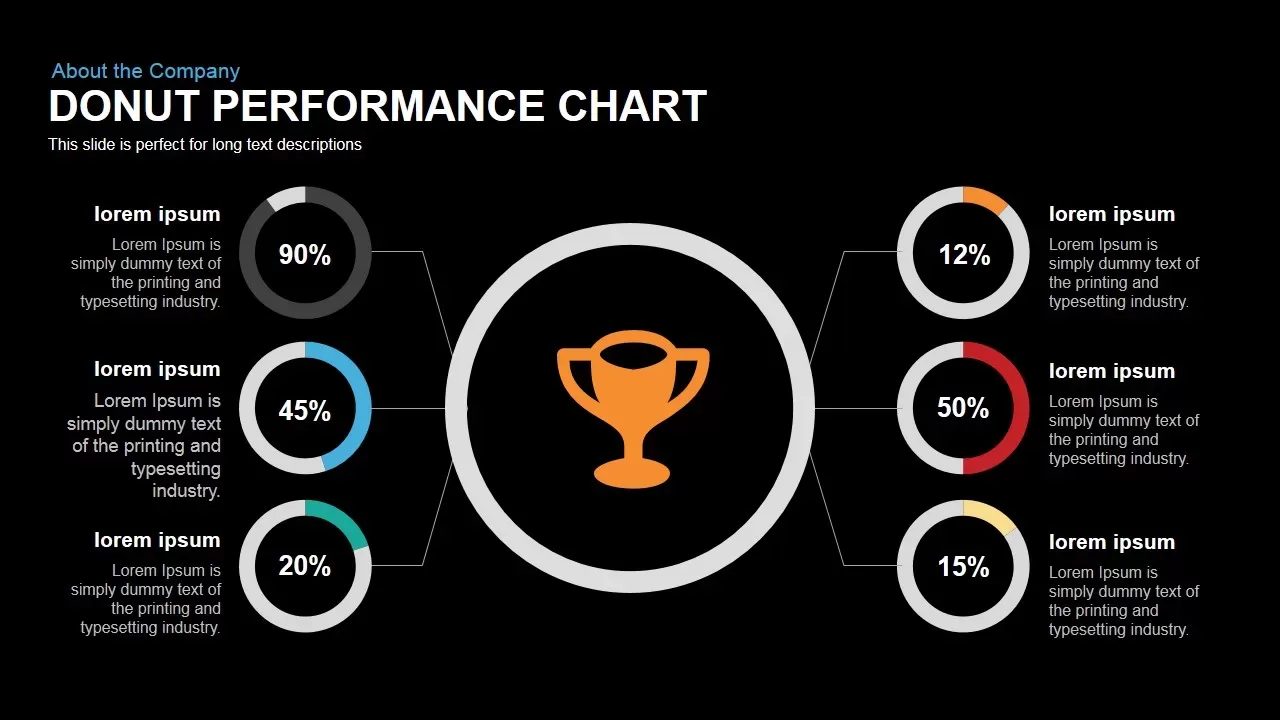
Donut Chart Performance PowerPoint Template and Keynote Slide
Pie & Donut
Premium
-

Biotechnology PowerPoint Presentation Template
PowerPoint Templates
Premium
-
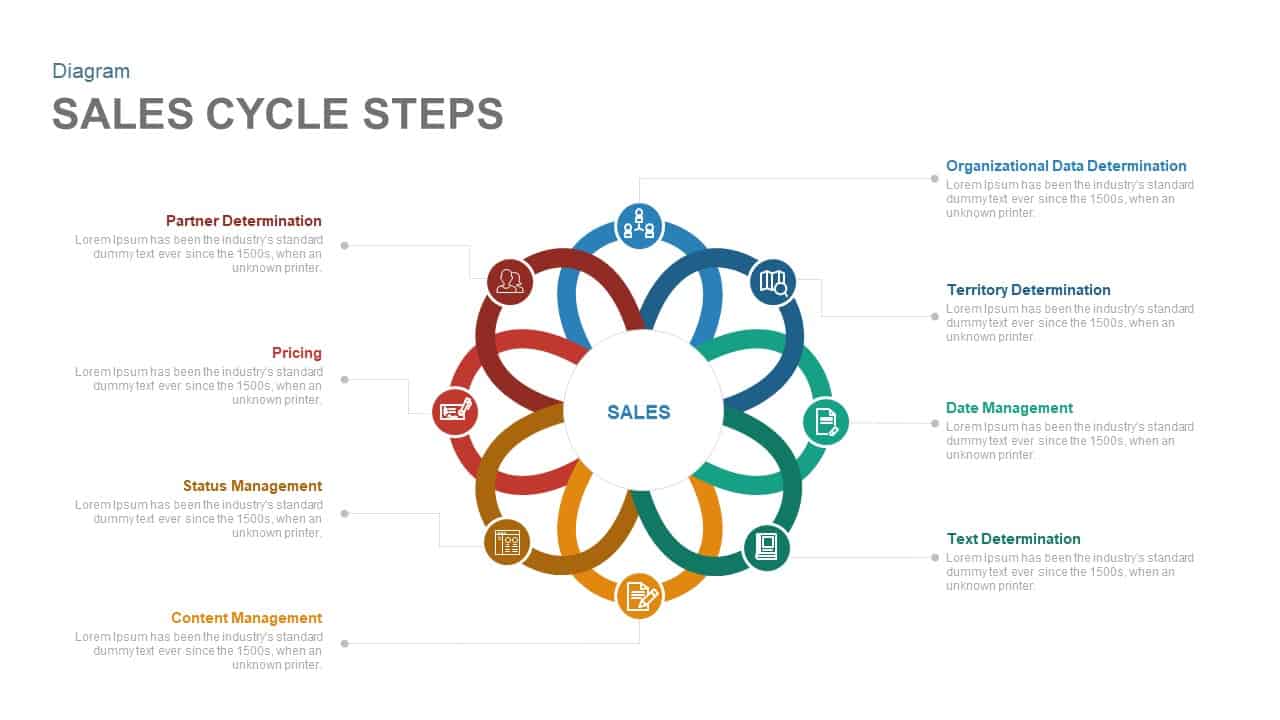
Sales Cycle Steps PowerPoint Template and Keynote Template
Circular Diagrams
Premium
-
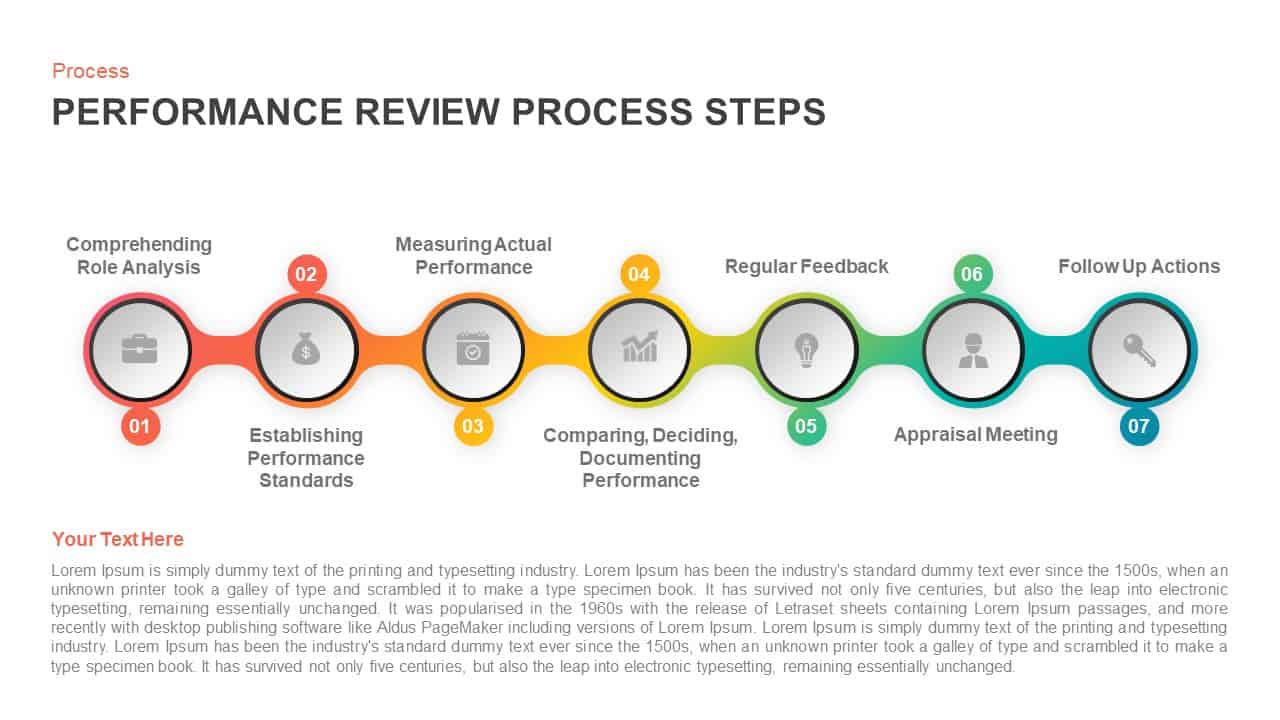
Performance Review Process Steps Timeline for PowerPoint Presentation
Keynote Templates
Premium
-

Power Analogy Metaphor PowerPoint Template
Metaphor, Simile & Analogy
Premium
-
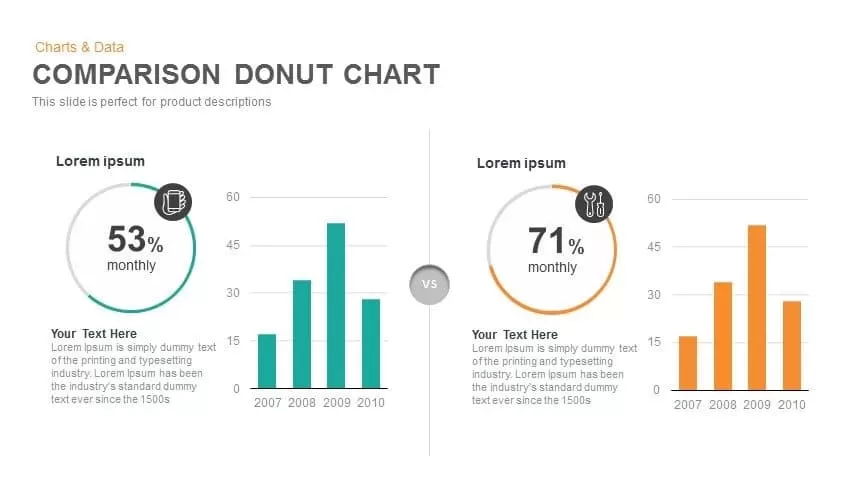
Comparison Donut Chart PowerPoint Template and Keynote
Keynote Templates
Premium
-
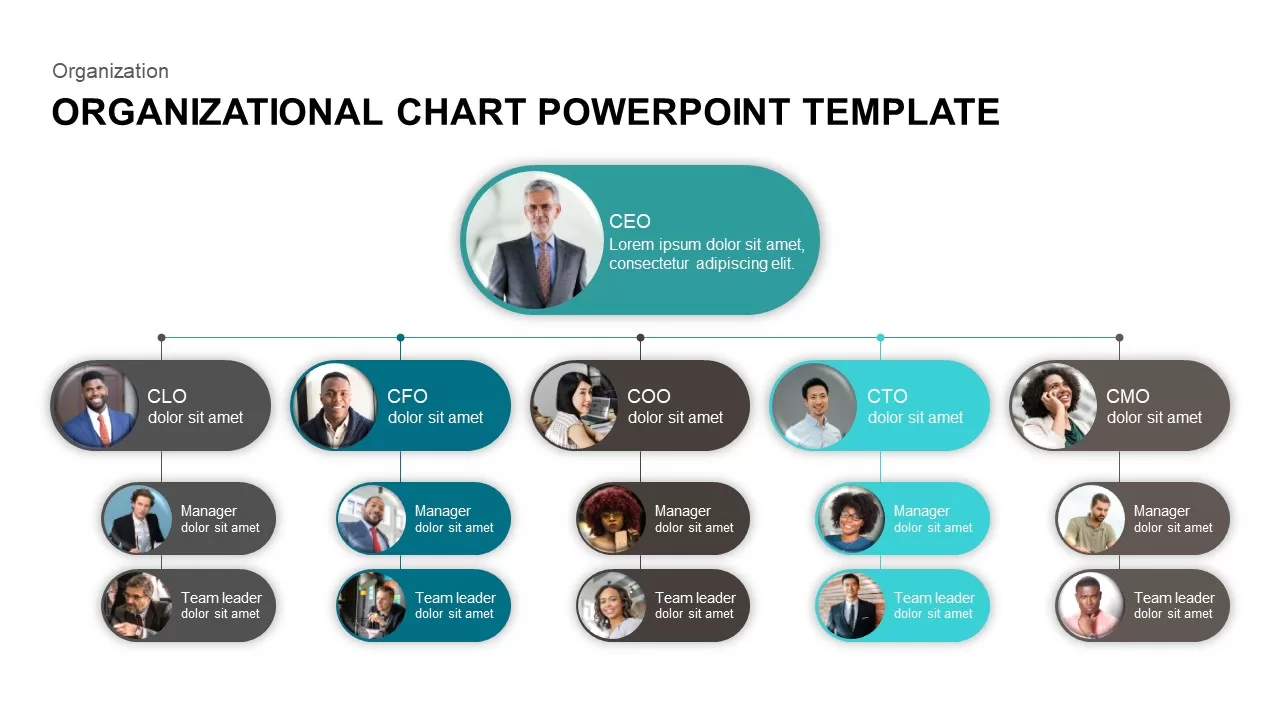
Org Chart PowerPoint Presentation Template
PowerPoint Charts
Premium
-
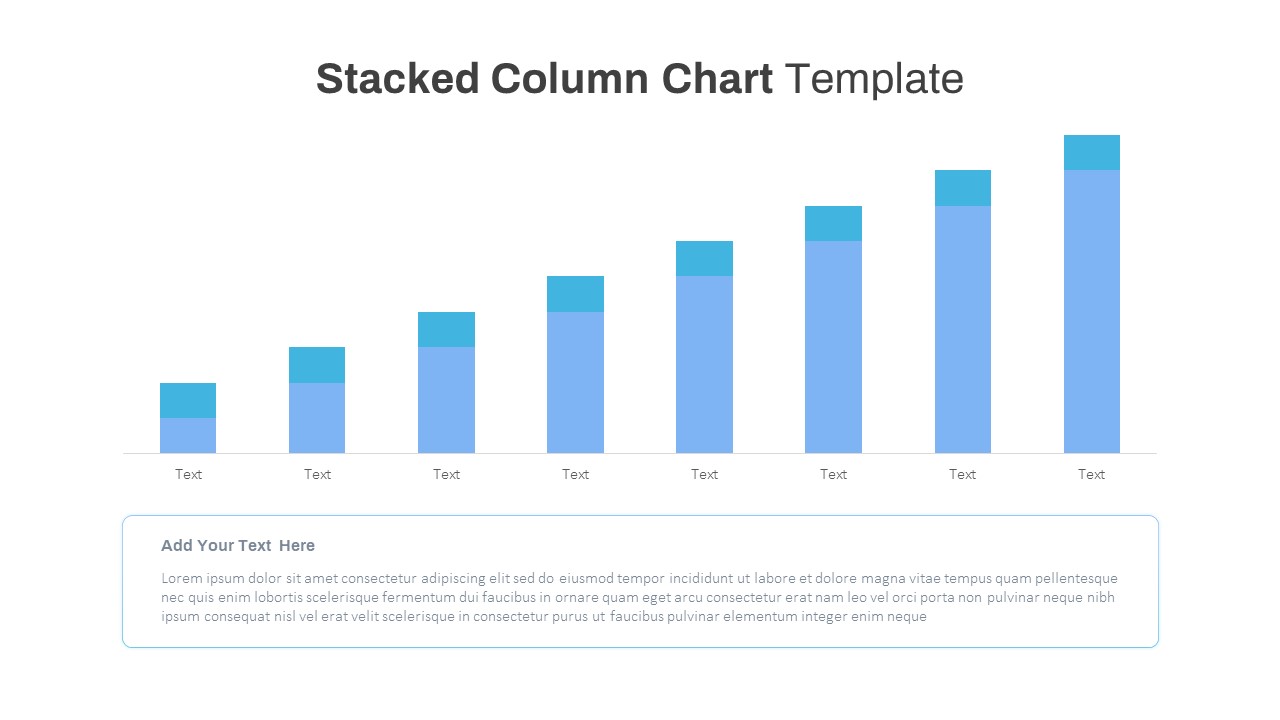
Free Stacked Column Chart Template
Column and Bar chart
Free
-

Area Chart PowerPoint Template
PowerPoint Charts
Premium
-
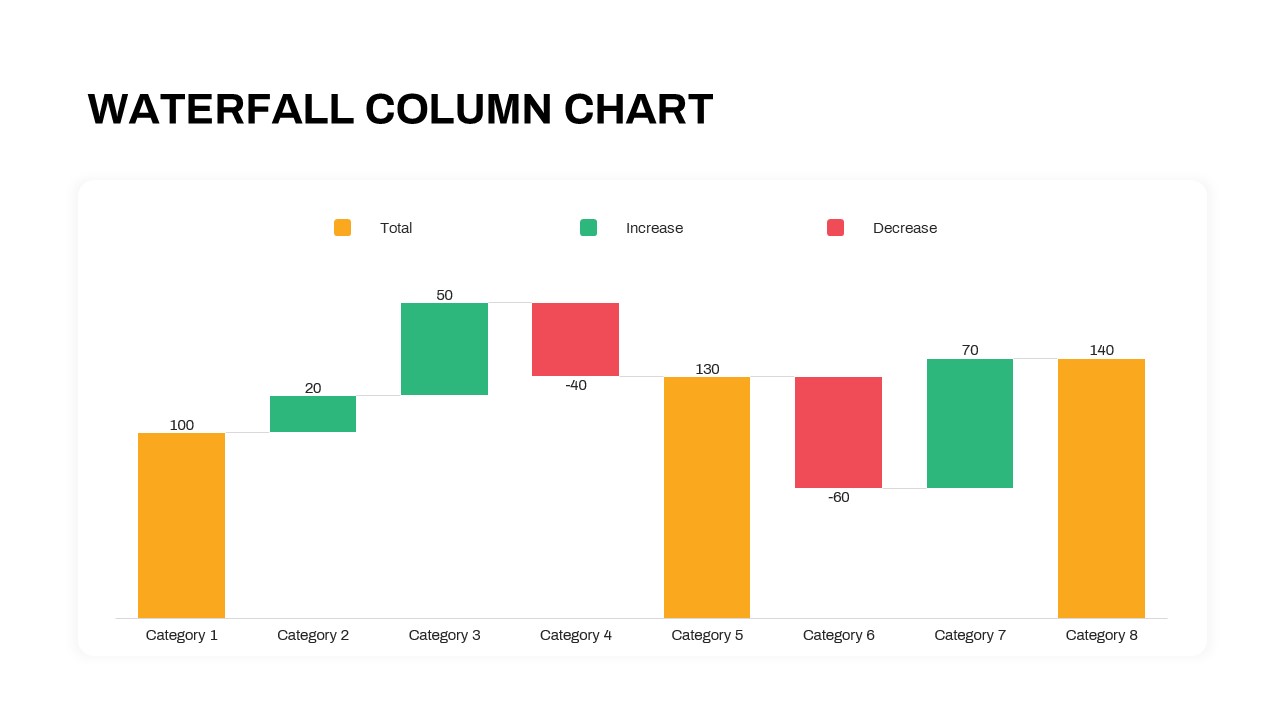
Waterfall Column Chart PowerPoint Template
Column and Bar chart
Premium