


S Curve PowerPoint Template
- Version
- Download 23
- File Size 0.00 KB
- File Count 1
- Create Date January 30, 2023
- Last Updated January 30, 2023
S Curve PowerPoint Template
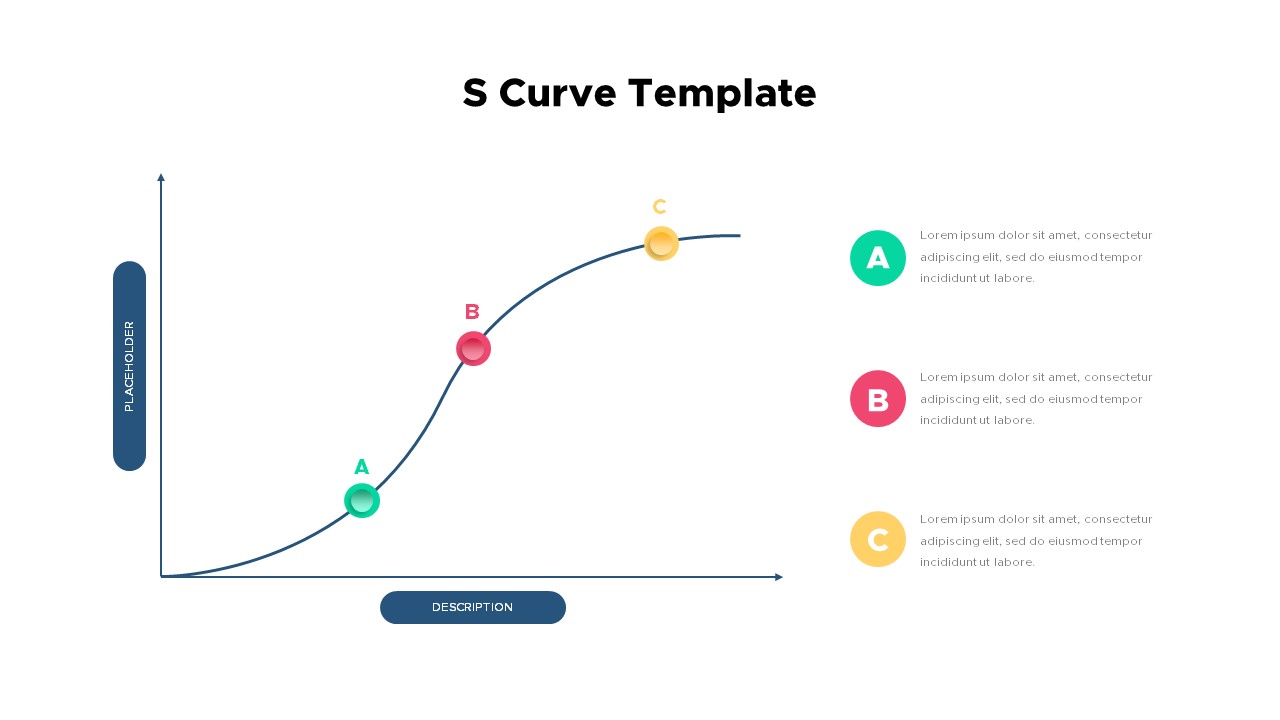
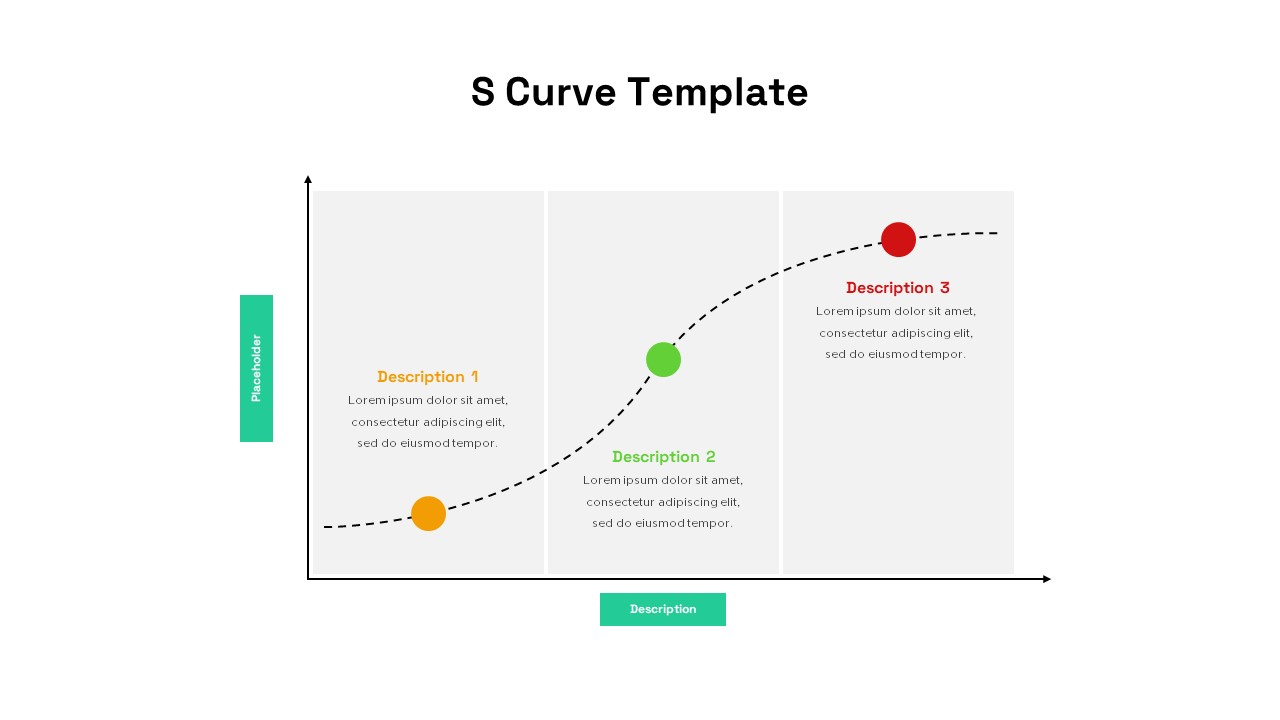
Use editable powerpoint graphs and diagrams for statistical slideshows. The S Curve Template for powerpoint presentation will display relevant cumulative data for a project, including cost and man-hours that will have taken to complete a task. It is called S curve because of the shape of the graph. It typically forms a thin "S." it is used to track the project's progress with the help of a mathematical chart. It forms an "S" shape because, in the initial stages, a project's growth is usually slow. However, the tempo is just beginning to accelerate. The team members are either engaging in researching to get more updated knowledge of the project or just beginning to work on the first phase of the execution. However, the growth takes its momentum, creating an upward slope on the middle part of the "S."
The S-Curve PowerPoint template helps to show the relationship between two different variables or parameters. The general powerpoint graph has many facets because it can add attributes from other presentation topics. For example, the S curve slide will fit cases including project development, sales, business growth, popular growth, and floating exchange rates. Besides, it can easily delineate inflations, interest rate differentials, and fiscal conditions. Finally, an S curve helps display the project's success with cumulative data of project aspects.
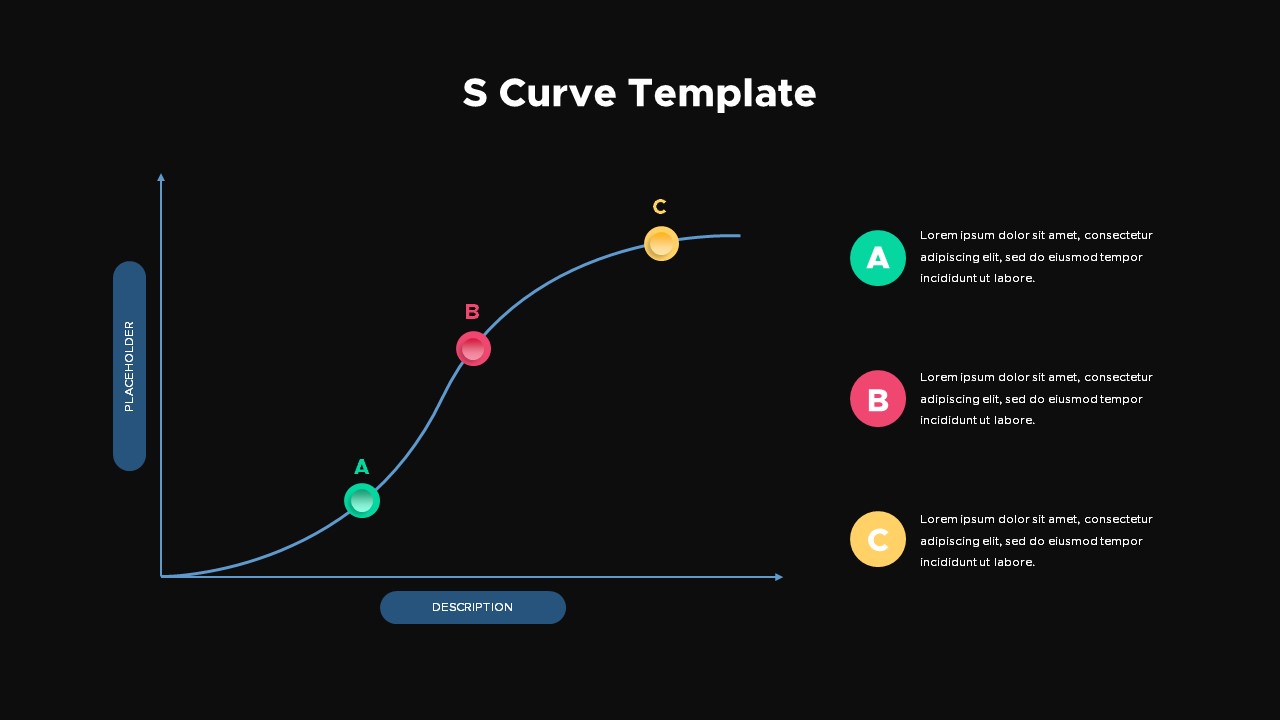
The S-Curve diagram for the PowerPoint presentation looks crystal clear on the black and white background. The project growth line has three touchpoints showing the direction of the attributes. These point circle designs are colored with RAG (red, amber/yellow, green )combination that allows reading project status easily. Besides, the users can add text descriptions on the right-hand side that are filled with the same colors for easy distinguishing. Project managers can download the S-Curve graph to share projects' status. The statistical diagram is designed in PowerPoint, Keynote, and Google slides. So, download and present with your favorite Software applications. Also, check out our other curves and lines templates.
Attached Files
| File |
|---|
| https://premiumdownloads.s3.amazonaws.com/SB03268-S Curve PowerPoint Template.ZIP |
Login to download this file
Add to favorites
Add to collection
-

Item ID
SB03268 -

Related Templates
-

Research Proposal PowerPoint Template
PowerPoint Templates
Premium
-

Free Nursing Capstone PowerPoint Deck
PowerPoint Templates
Free
-

Nature PowerPoint Presentation Template
PowerPoint Business Templates
Premium
-

Free Vertical PowerPoint Template
PowerPoint Business Templates
Free
-

Cab Service PowerPoint Template
PowerPoint Templates
Premium
-

Sales Deck Free PowerPoint Template
PowerPoint Templates
Free
-

VET Clinic PowerPoint Template
PowerPoint Templates
Premium
-

Free Space Minimal Deck Template
PowerPoint Templates
Free
-

Gym PowerPoint Template
PowerPoint Templates
Premium
-

Travel Agency PowerPoint Template
PowerPoint Templates
Premium
-

Free Physical Education PowerPoint Template Deck
Free PowerPoint Templates
Free
-

IoT Presentation Template
PowerPoint Templates
Premium
-

Graph Paper PowerPoint Template Deck
PowerPoint Templates
Premium
-

Effective Communication PowerPoint Template
PowerPoint Templates
Premium
-

PowerPoint Quiz With Timer
PowerPoint Templates
Premium
-
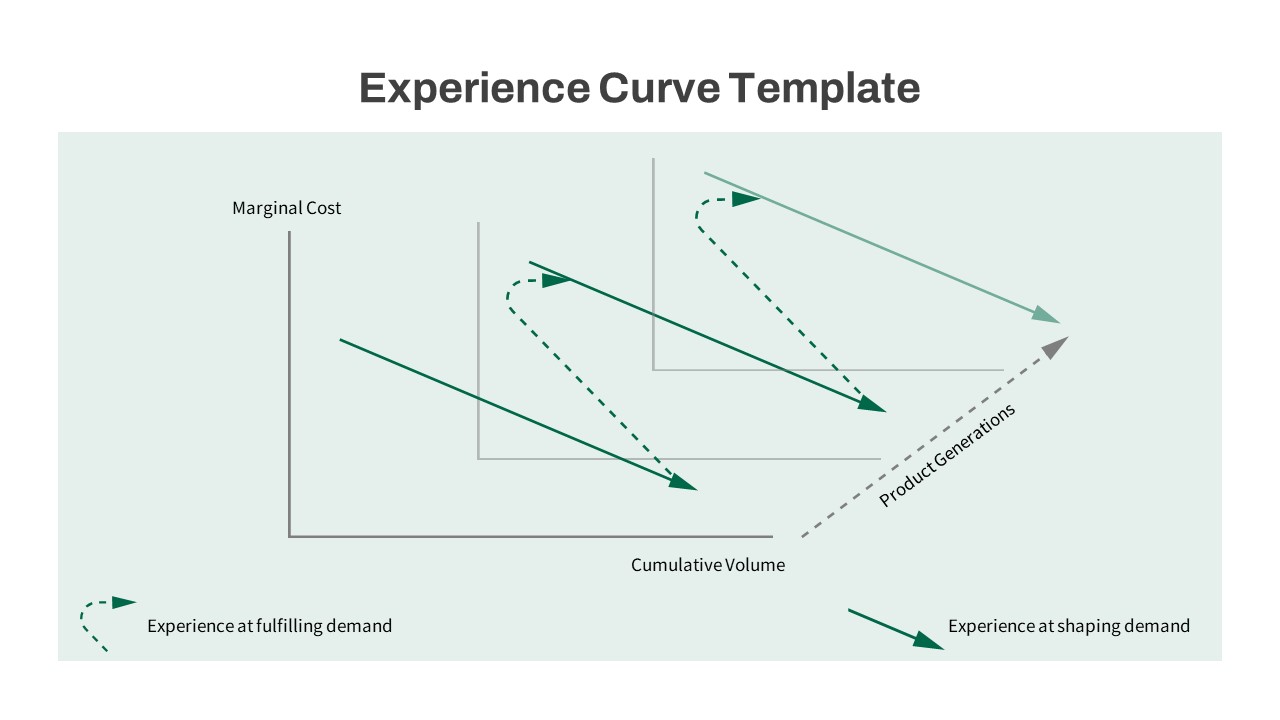
Experience Curve PowerPoint Template
Keynote Templates
Premium
-

Free Charity PowerPoint Template Deck
PowerPoint Templates
Free
-

Macroeconomics PowerPoint Template
PowerPoint Templates
Premium
-

Free Army PowerPoint Template
PowerPoint Templates
Free
-

Free Economics PowerPoint Template
Free PowerPoint Templates
Free
-

Free Cartoon PowerPoint Template
Free PowerPoint Templates
Free
-

Customer Experience Loyalty PowerPoint Deck Template
PowerPoint Templates
Premium
-
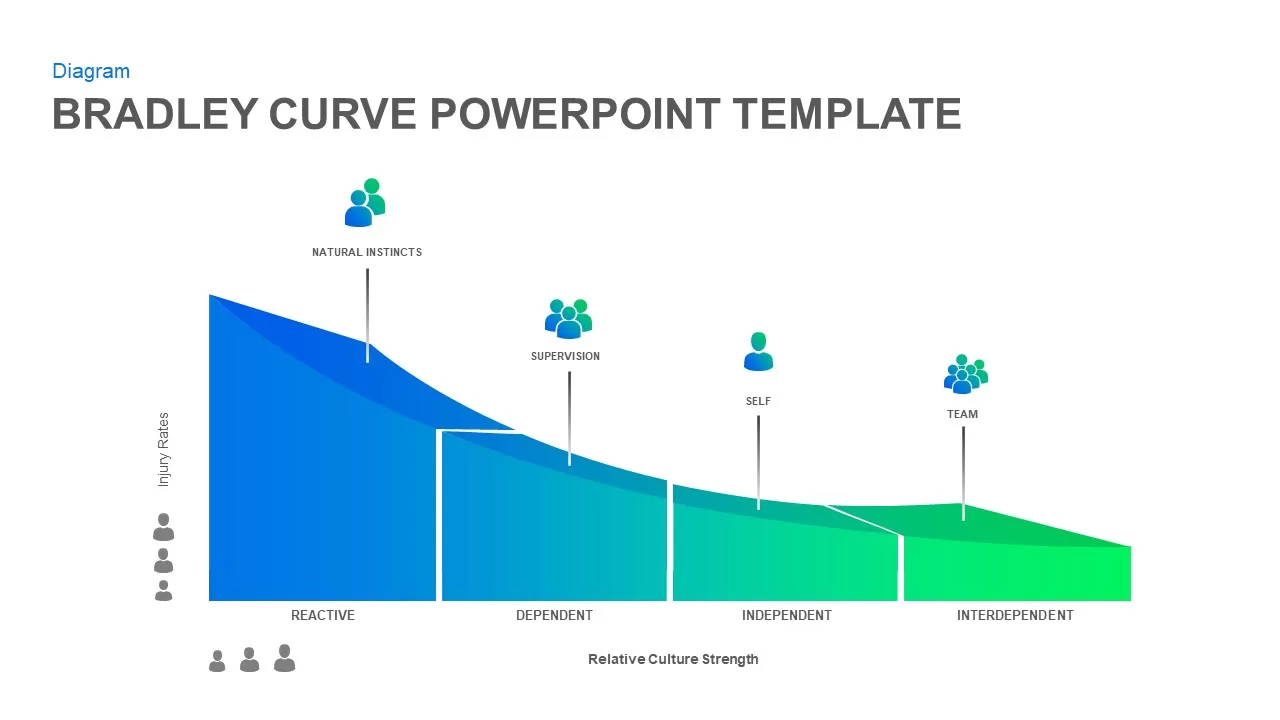
Bradley Curve PowerPoint Template
PowerPoint Charts
Premium
-

Free Aviation PowerPoint Template
Free PowerPoint Templates
Free
-

Free Real Estate Listing PowerPoint Template
Free PowerPoint Templates
Free
-

Animated Agriculture PowerPoint Deck Template
PowerPoint Templates
Premium
-

Free Event Planning PowerPoint Template
Free PowerPoint Templates
Free
-

Free University Presentation PowerPoint Template
PowerPoint Templates
Free
-

Free Book Review PowerPoint Template
Free PowerPoint Templates
Free
-

Stakeholder Register PowerPoint Template
PowerPoint Templates
Premium
-

Global Warming Infographic PowerPoint Template Deck
PowerPoint Templates
Premium
-

Data Science PowerPoint Template
PowerPoint Templates
Premium
-

Real Estate PowerPoint Theme
PowerPoint Themes
Premium
-
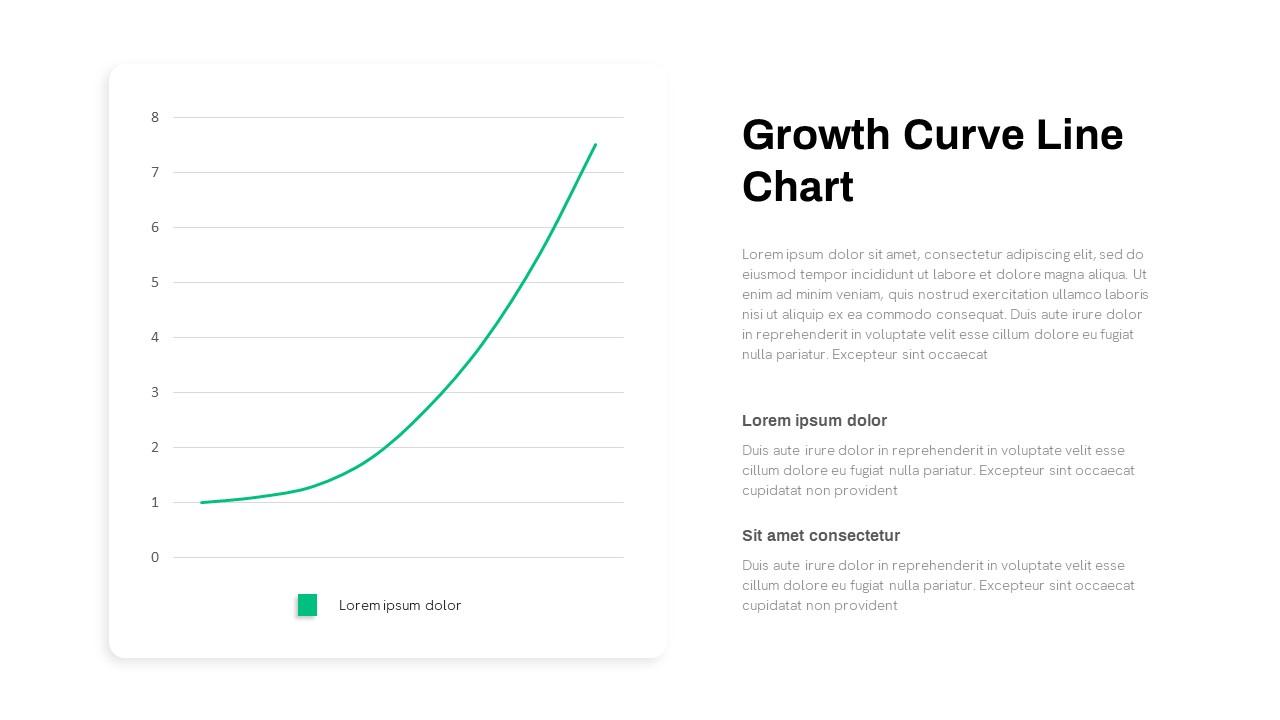
Growth Curve Line Chart PowerPoint Template
Curves and Lines
Premium
-
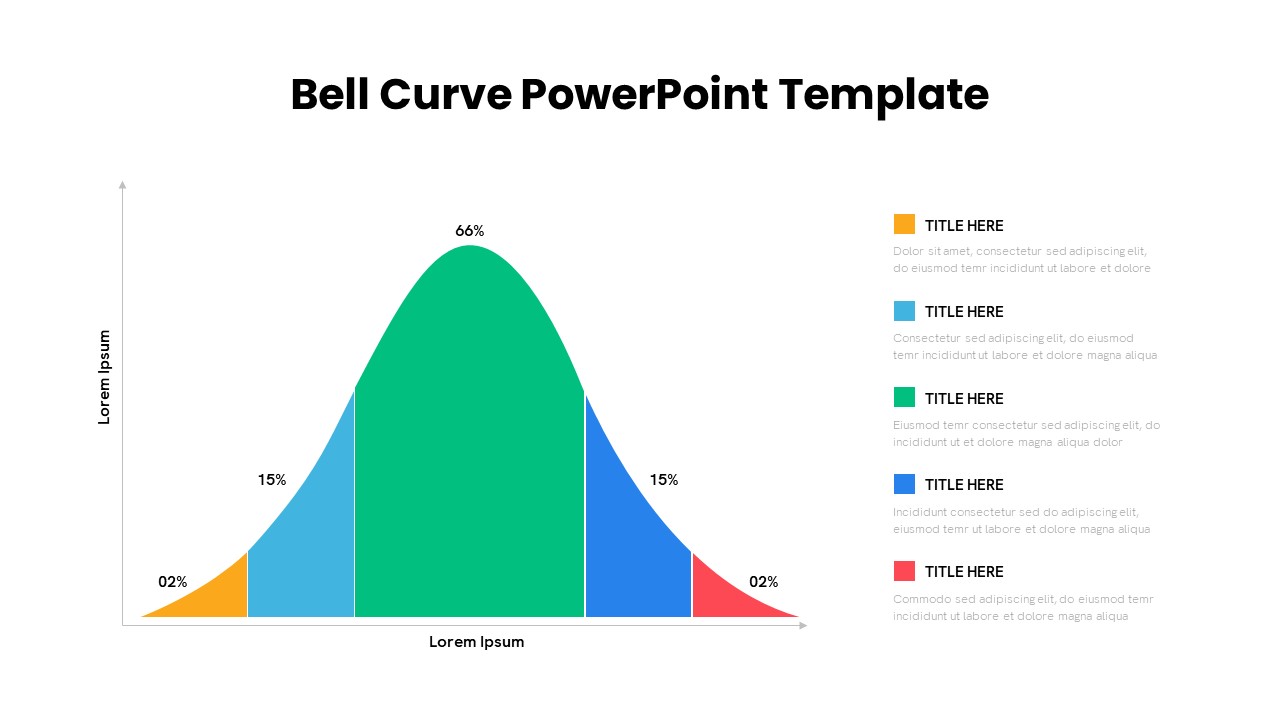
Bell Curve PowerPoint Template
PowerPoint Templates
Premium
-

EFQM Model PowerPoint Template
PowerPoint Templates
Premium
-

Free Dunder Mifflin Paper Company Pitch Deck
Free PowerPoint Templates
Free
-
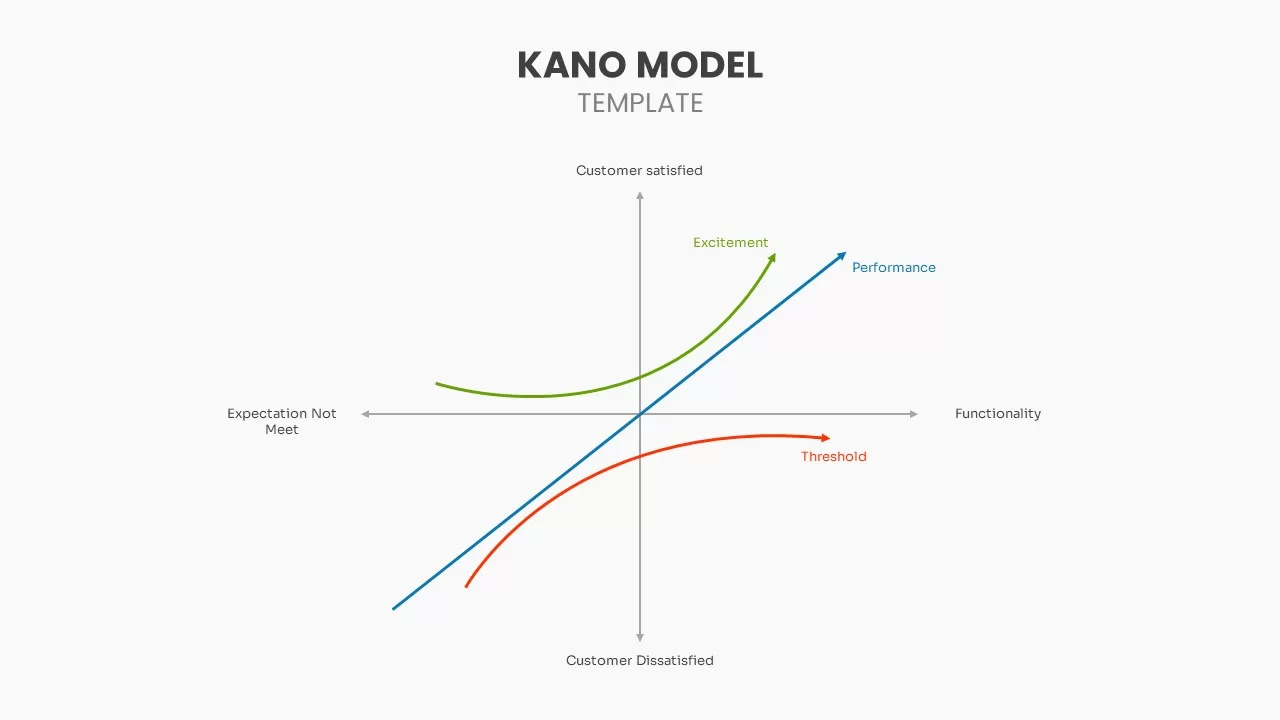
Kano Model Template
Curves and Lines
Premium
-
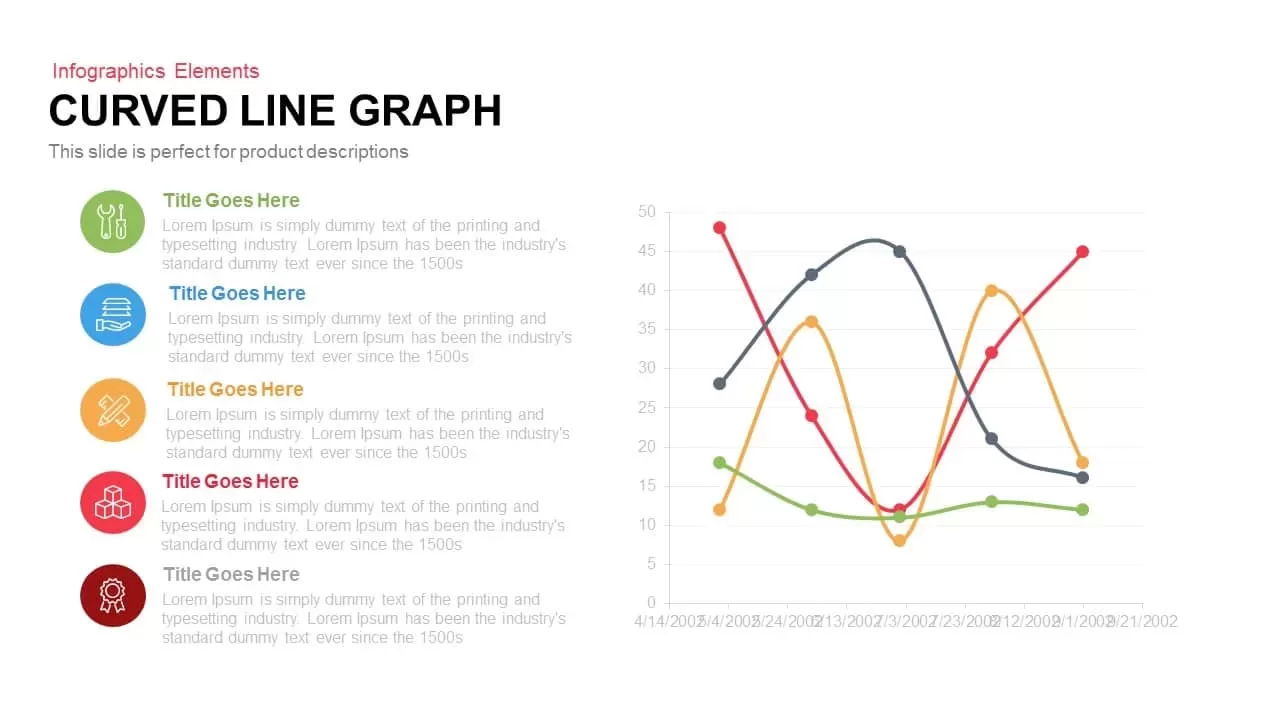
Curved Line Graph PowerPoint Template and Keynote Slide
Curves and Lines
Premium
-

Annual Report PowerPoint Template and Keynote
PowerPoint Templates
Premium
-

Free Charts and Graphs PowerPoint Template
PowerPoint Templates
Free
-

Free AI Artificial Intelligence PowerPoint Template
PowerPoint Templates
Free
-
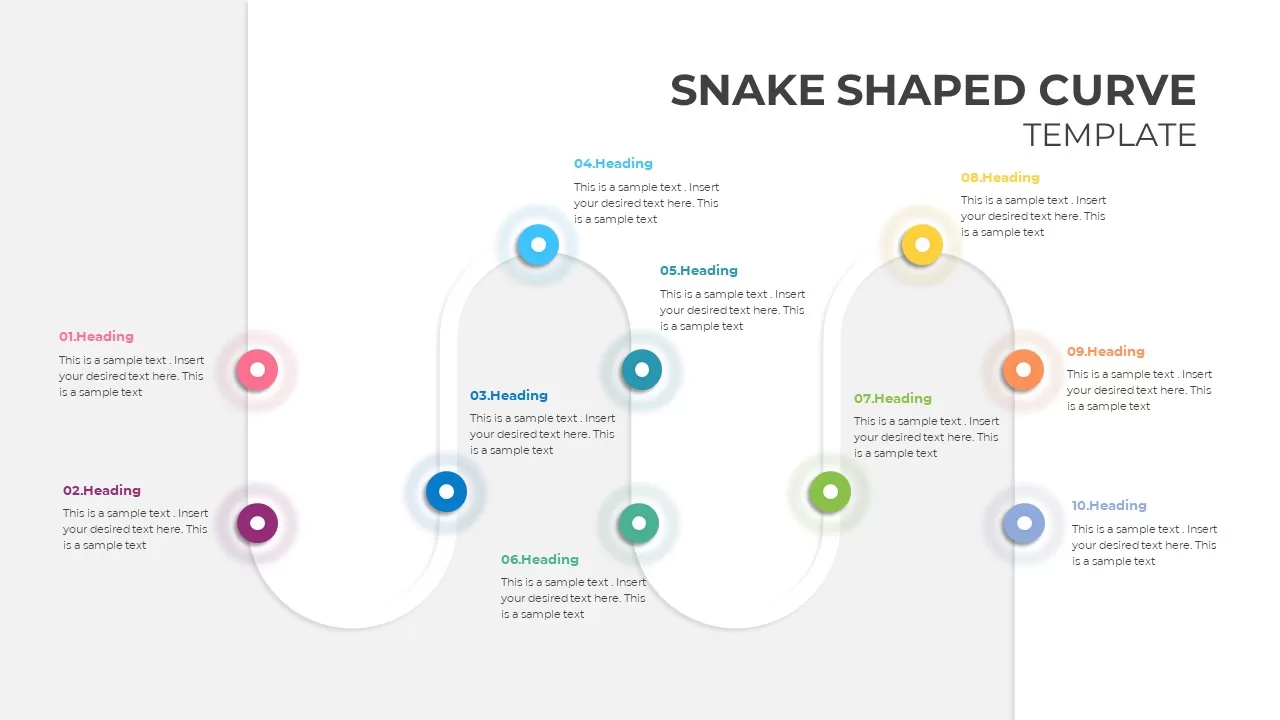
Snake Shaped Curve Diagram
Shapes
Premium
-

Business Process Reengineering Template
PowerPoint Templates
Premium
-

Area Chart PowerPoint Template
PowerPoint Charts
Premium
-
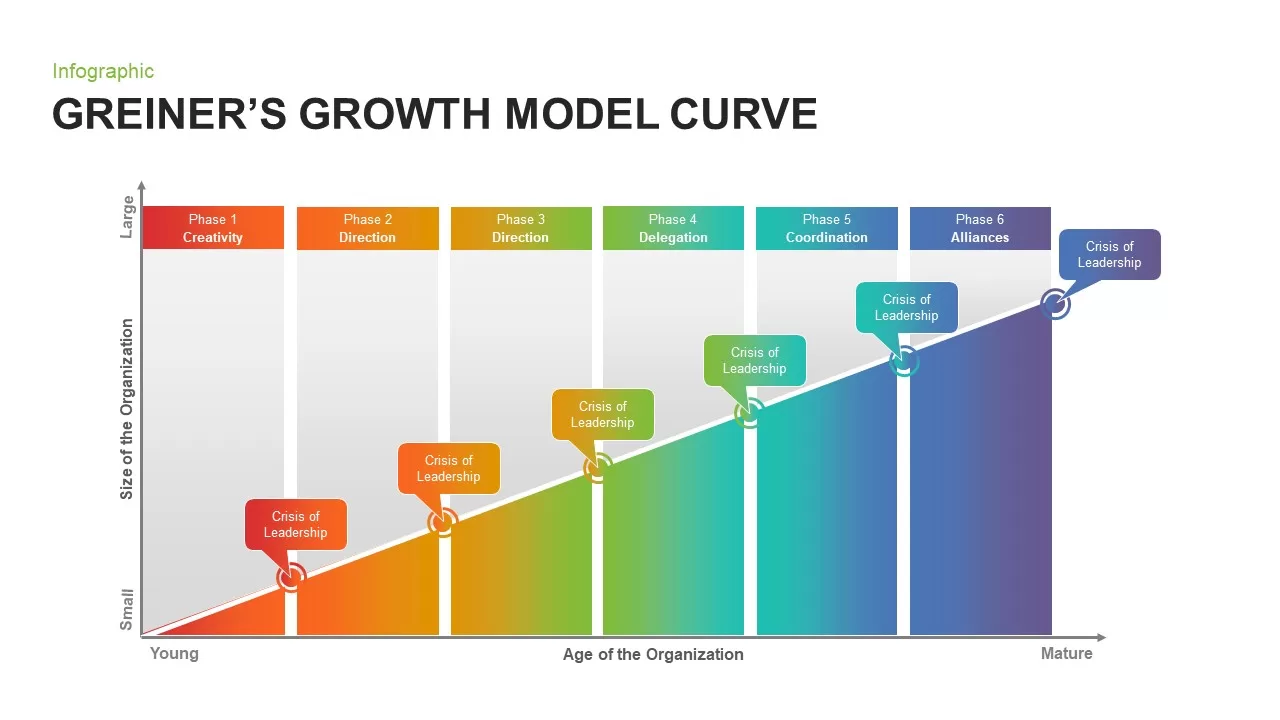
Greiner’s Growth Model Curve for PowerPoint
Business Models
Premium
-

Animated Upcoming Event Poster PowerPoint Template
PowerPoint Templates
Premium
-

Open Door Policy PowerPoint Template
PowerPoint Templates
Premium
-
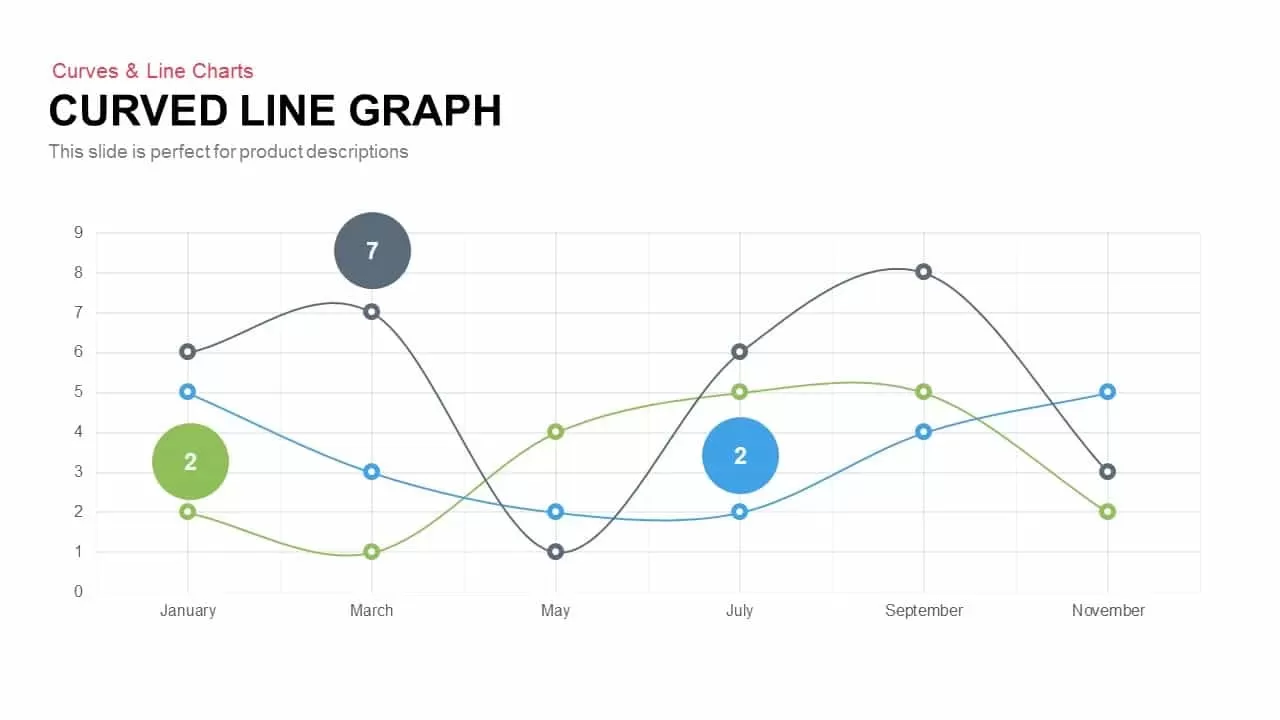
Curved Line Graph PowerPoint Template and Keynote
Curves and Lines
Premium
-

Biotechnology PowerPoint Presentation Template
PowerPoint Templates
Premium
-
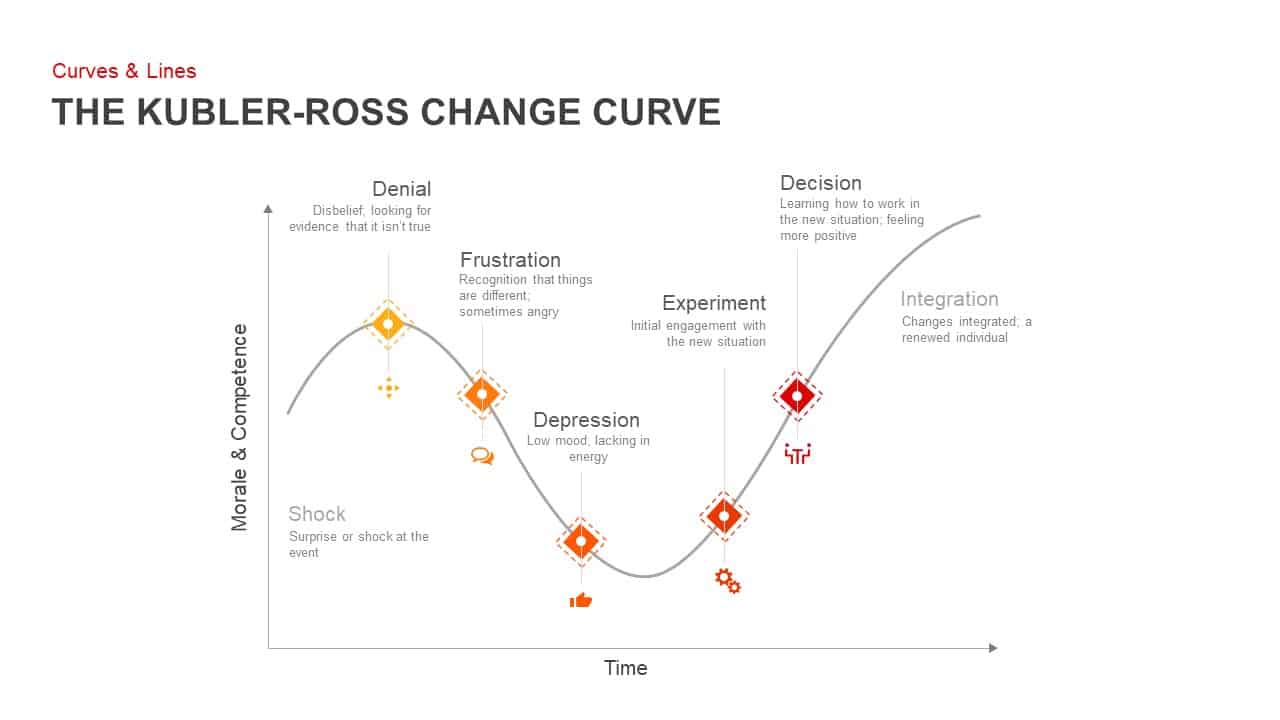
Kubler Ross Change Curve PowerPoint Template
Business Models
Premium
-
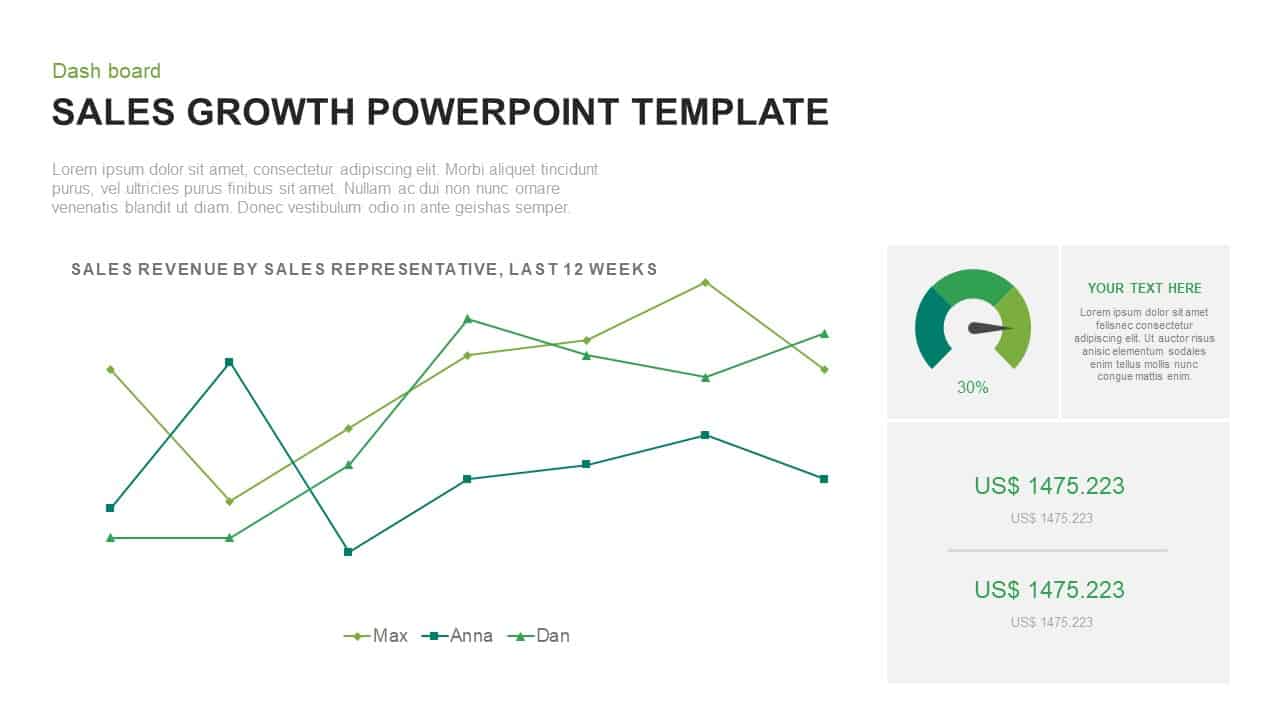
Sales Growth PowerPoint Presentation Template
Curves and Lines
Premium
-
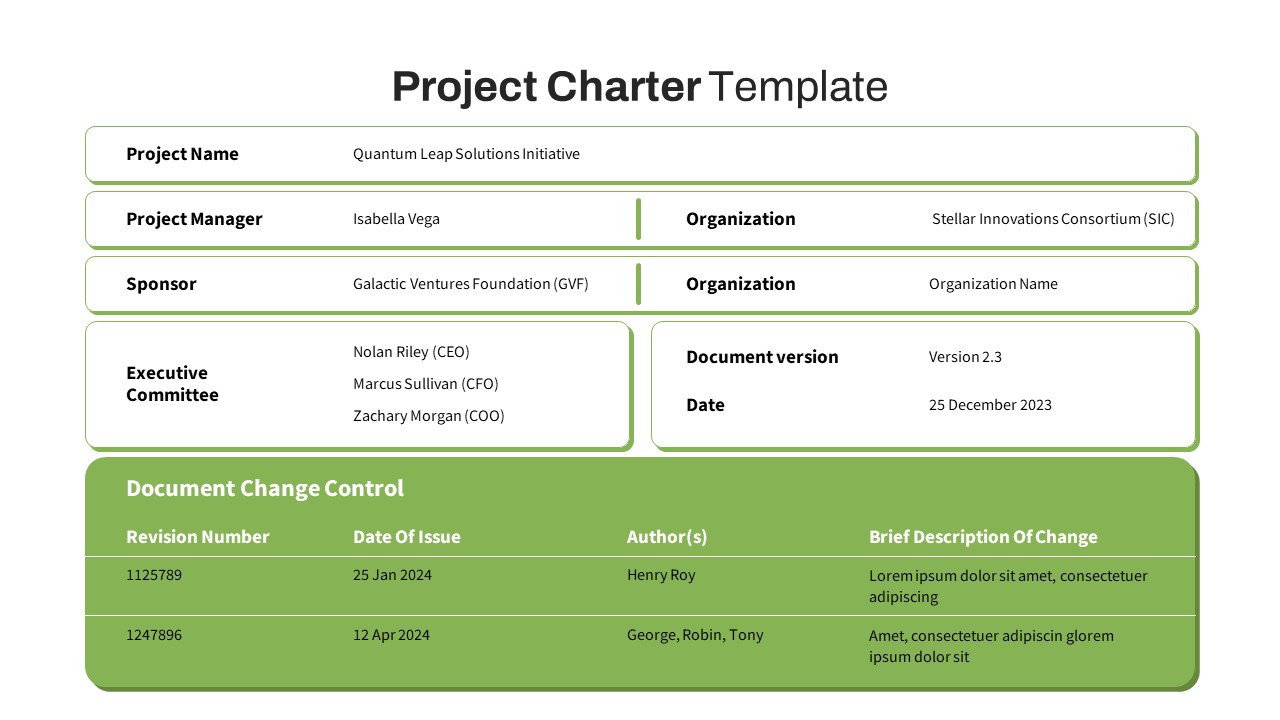
Free Project Charter PowerPoint Template
Free PowerPoint Templates
Free
-
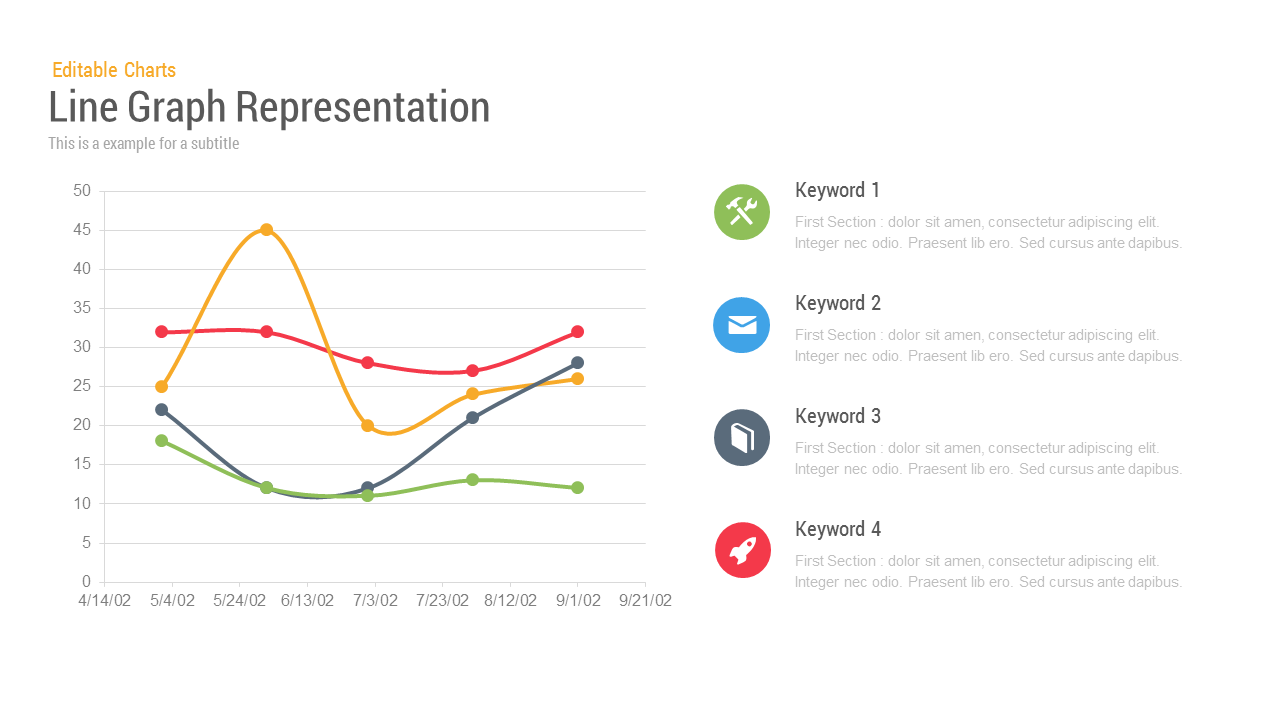
Line Chart Representation PowerPoint Templates and Keynote Slides
PowerPoint Charts
Premium
-
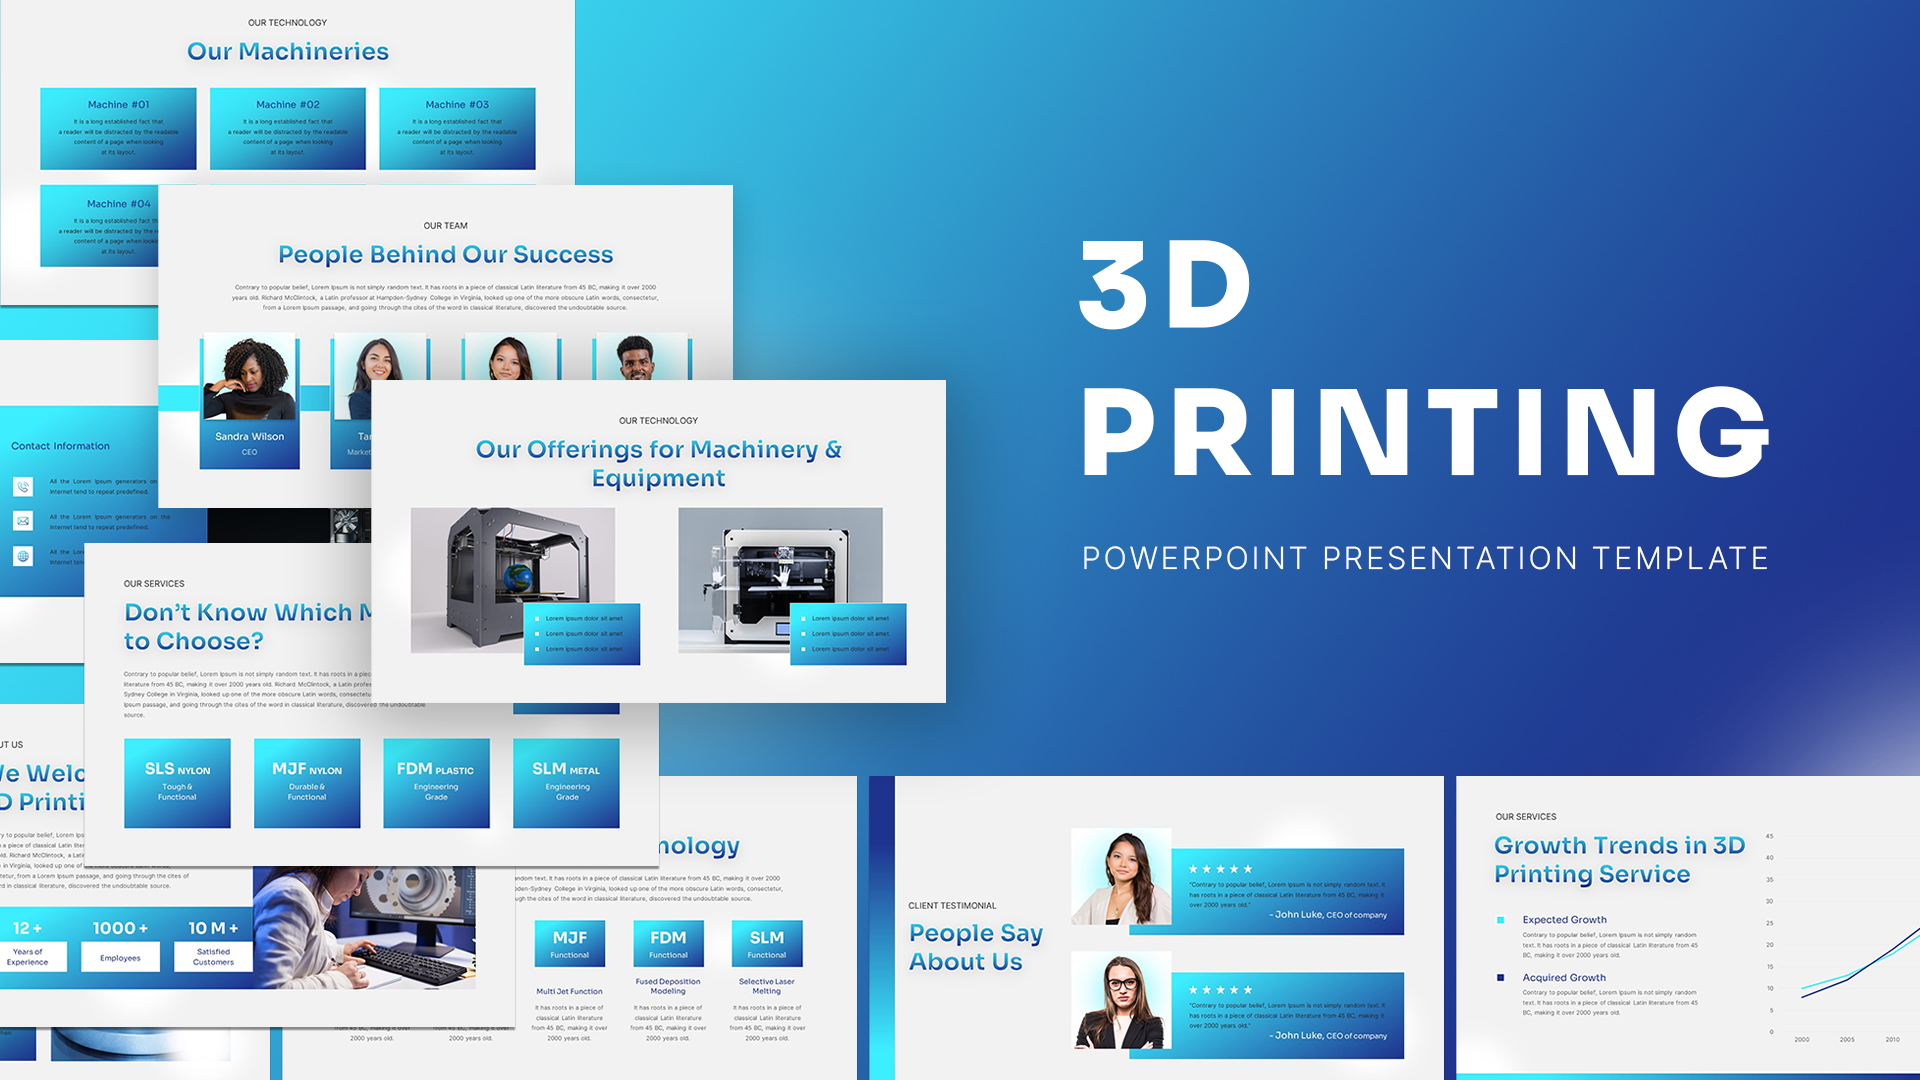
3D Printing Deck PowerPoint Template
PowerPoint Templates
Premium
-

Power Analogy Metaphor PowerPoint Template
Metaphor, Simile & Analogy
Premium
-
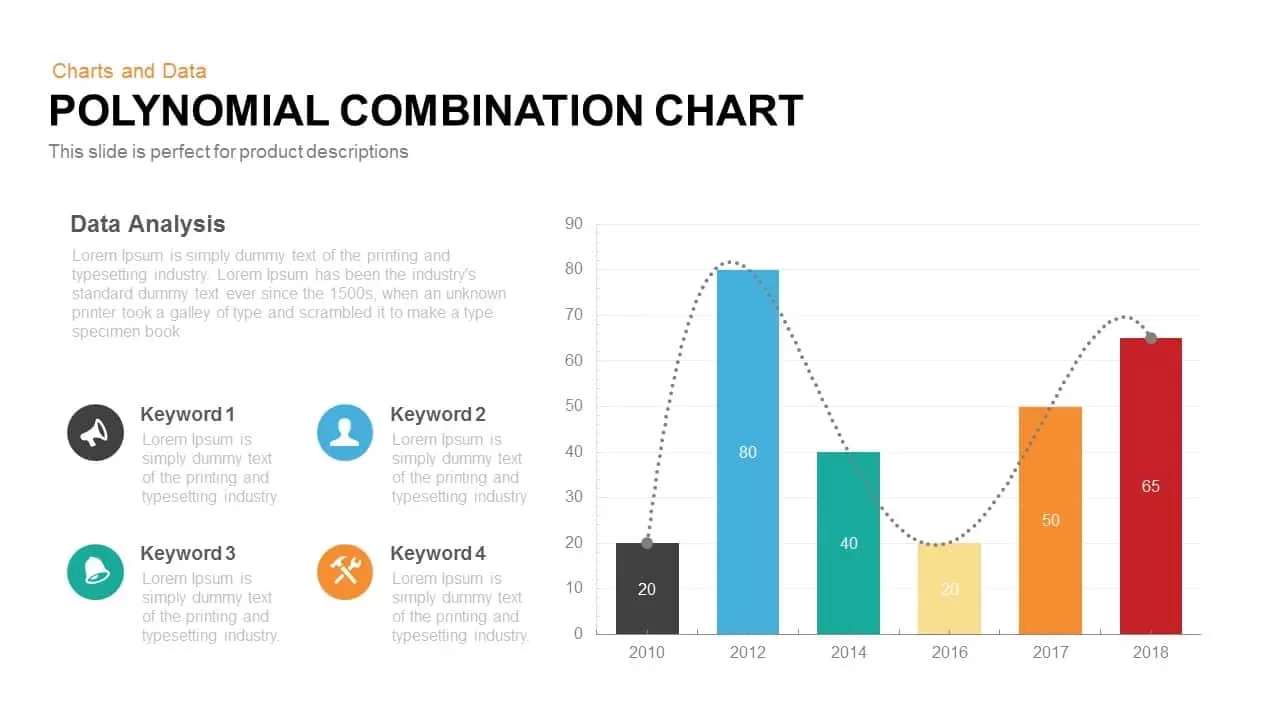
Polynomial Combination Chart PowerPoint Template and Keynote Slide
Column and Bar chart
Premium
-
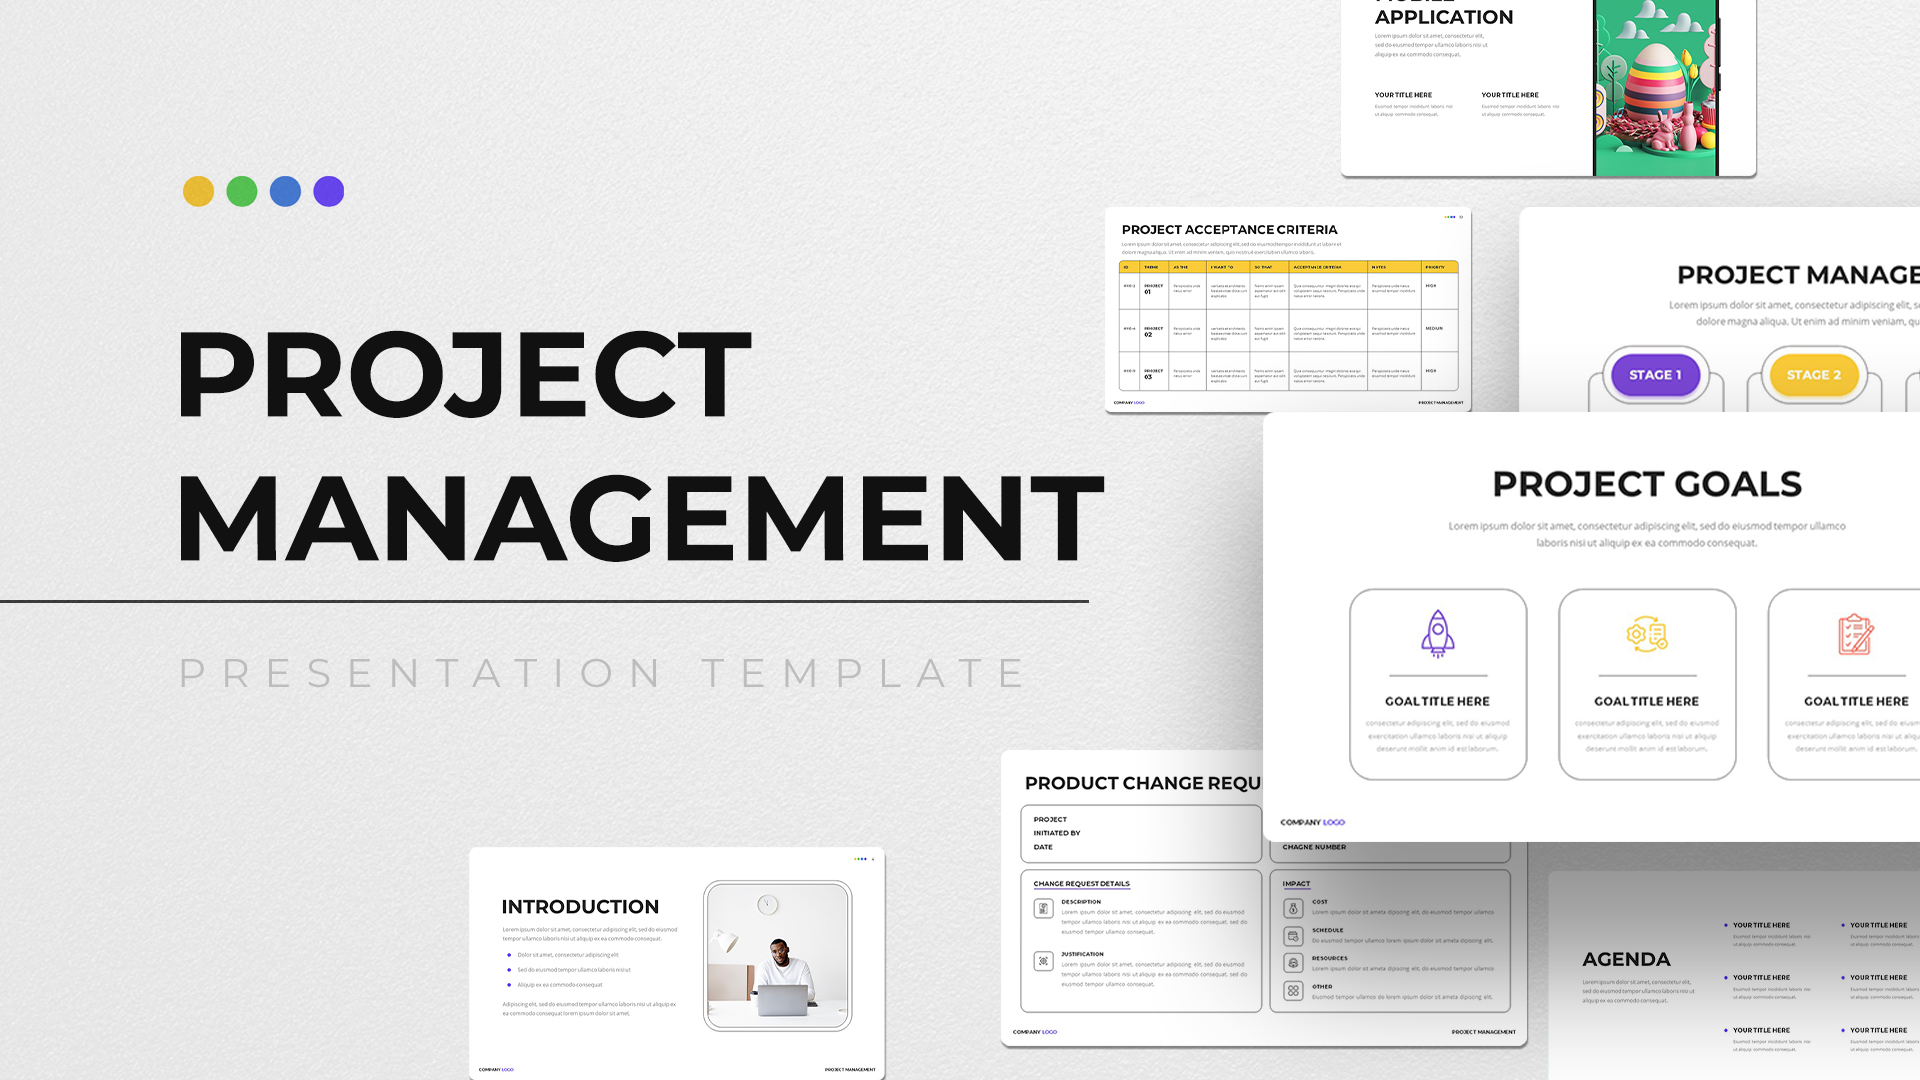
Project Management Presentation Template
PowerPoint Business Templates
Premium
-
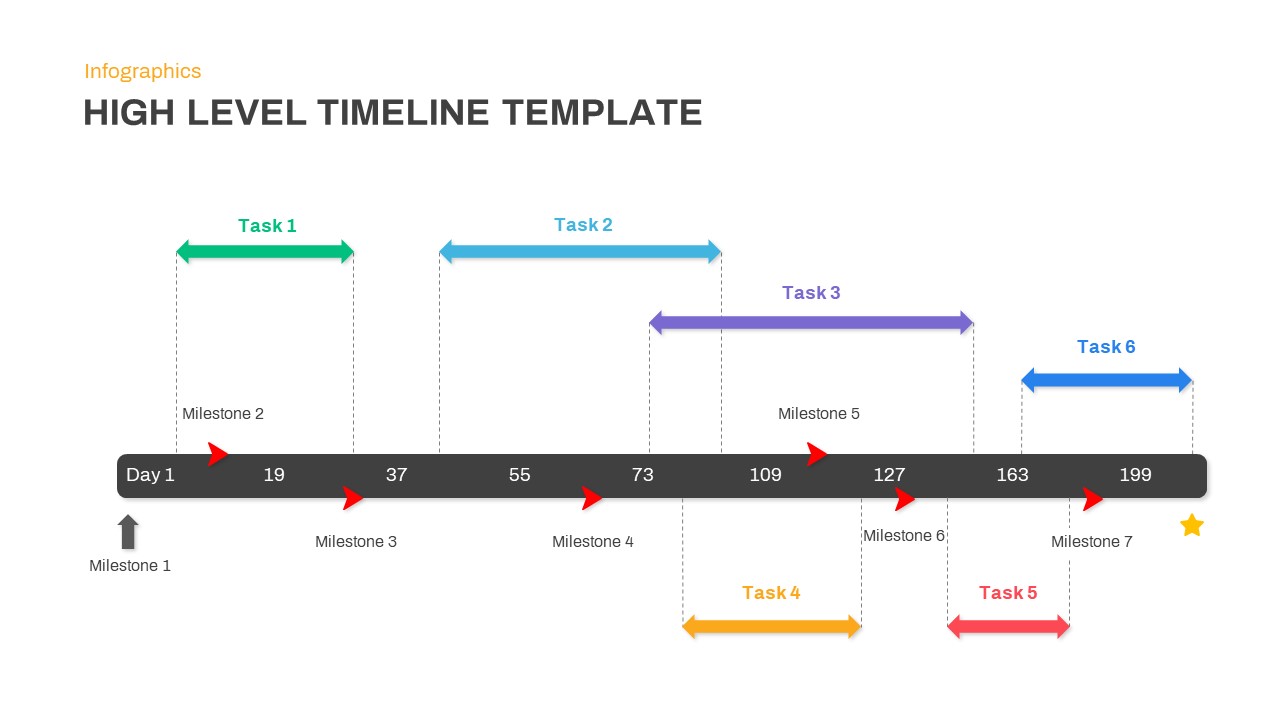
High Level Timeline PowerPoint Template
Timeline PowerPoint Template
Premium
-
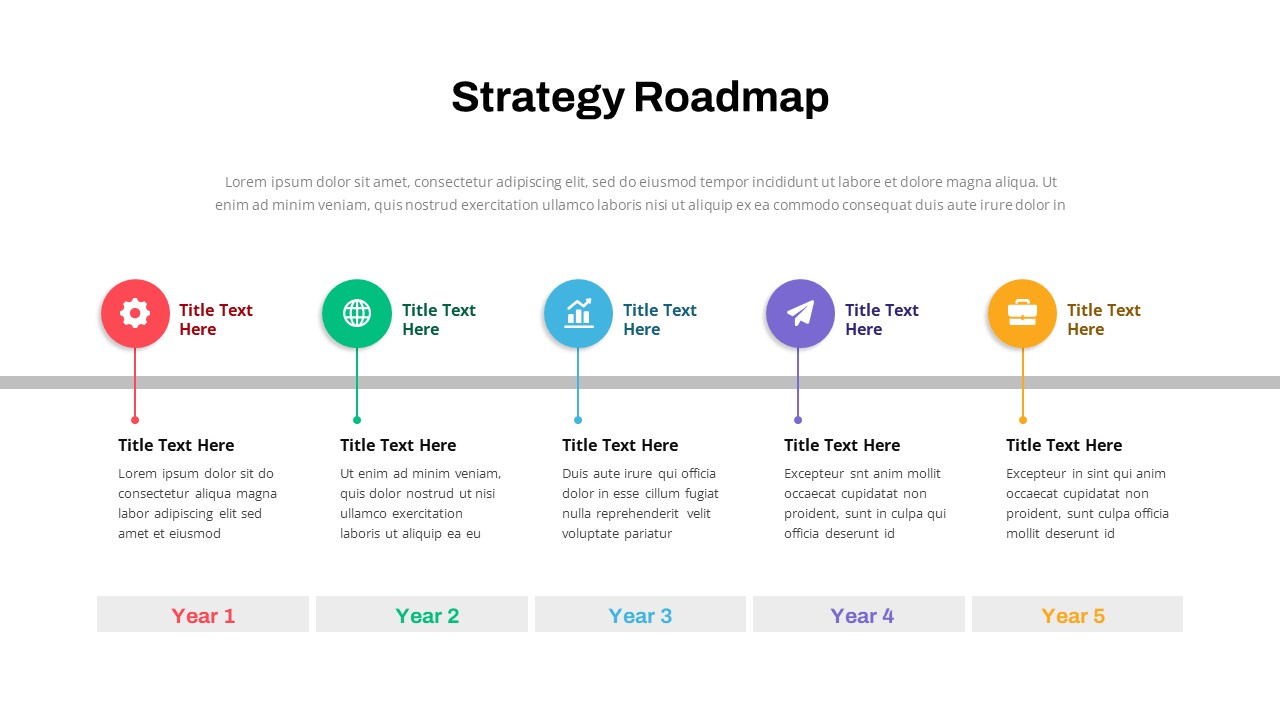
Data Strategy Roadmap PowerPoint Template
PowerPoint Templates
Premium
-
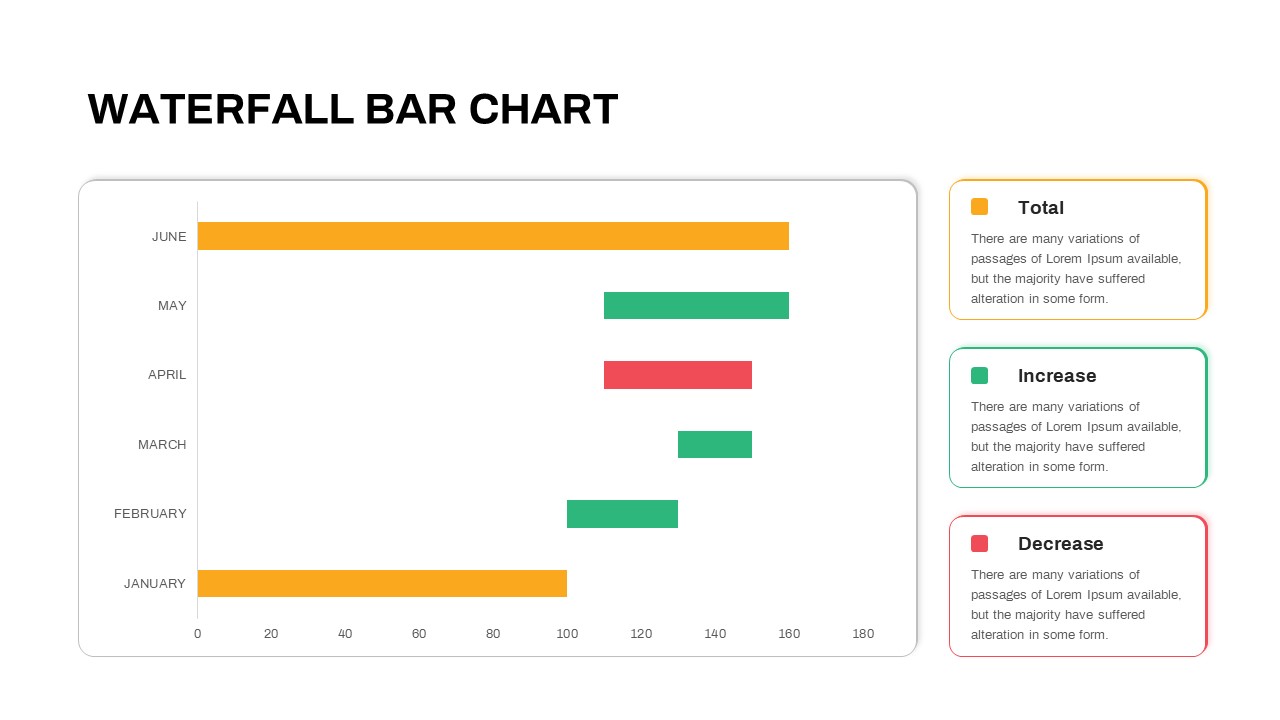
Waterfall Bar Chart PowerPoint Template
PowerPoint Charts
Premium
-
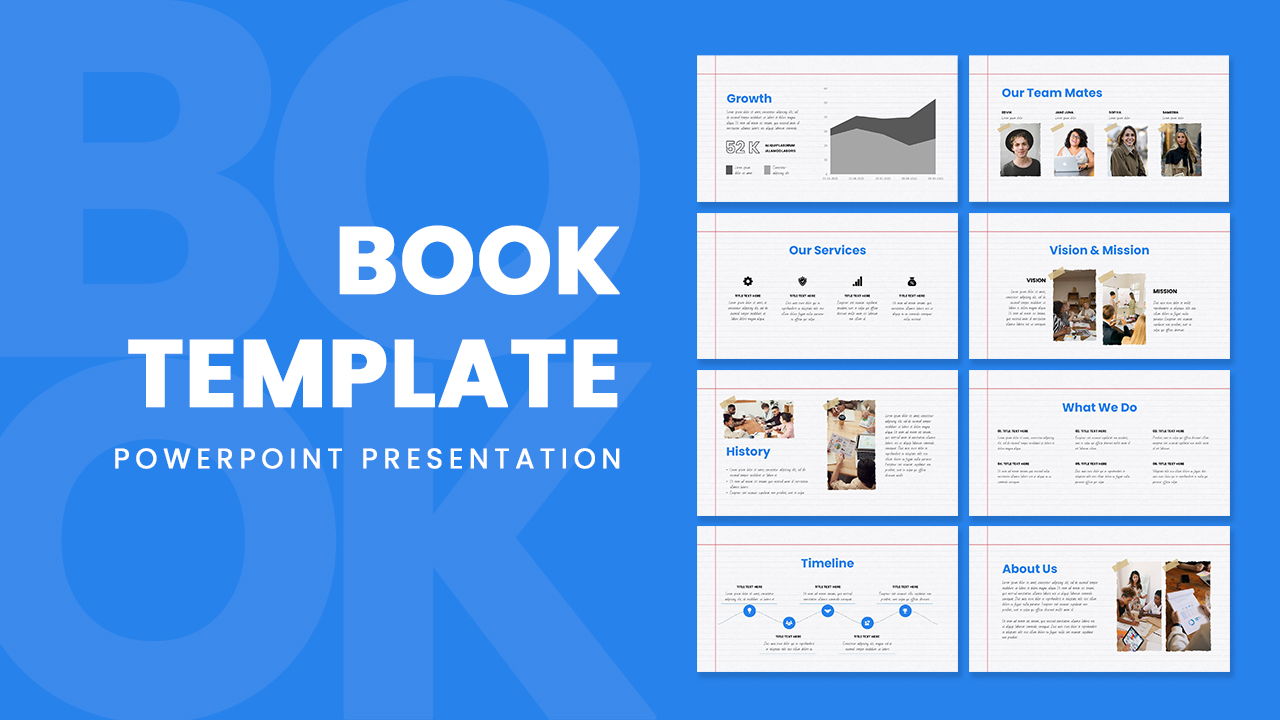
Free PowerPoint Book Template
Free slides
Free
-
DMAIC PowerPoint Template
Business Models
Premium
-
Company Performance Business Growth PowerPoint Template
Business Models
Premium
-
Data Flow PowerPoint Presentation Template
PowerPoint Templates
Premium
-
Growth Infographic Arrow PowerPoint Template and Keynote Slide
Arrow Diagrams
Premium
-

Cyber Monday PowerPoint Template
PowerPoint Business Templates
Premium
-
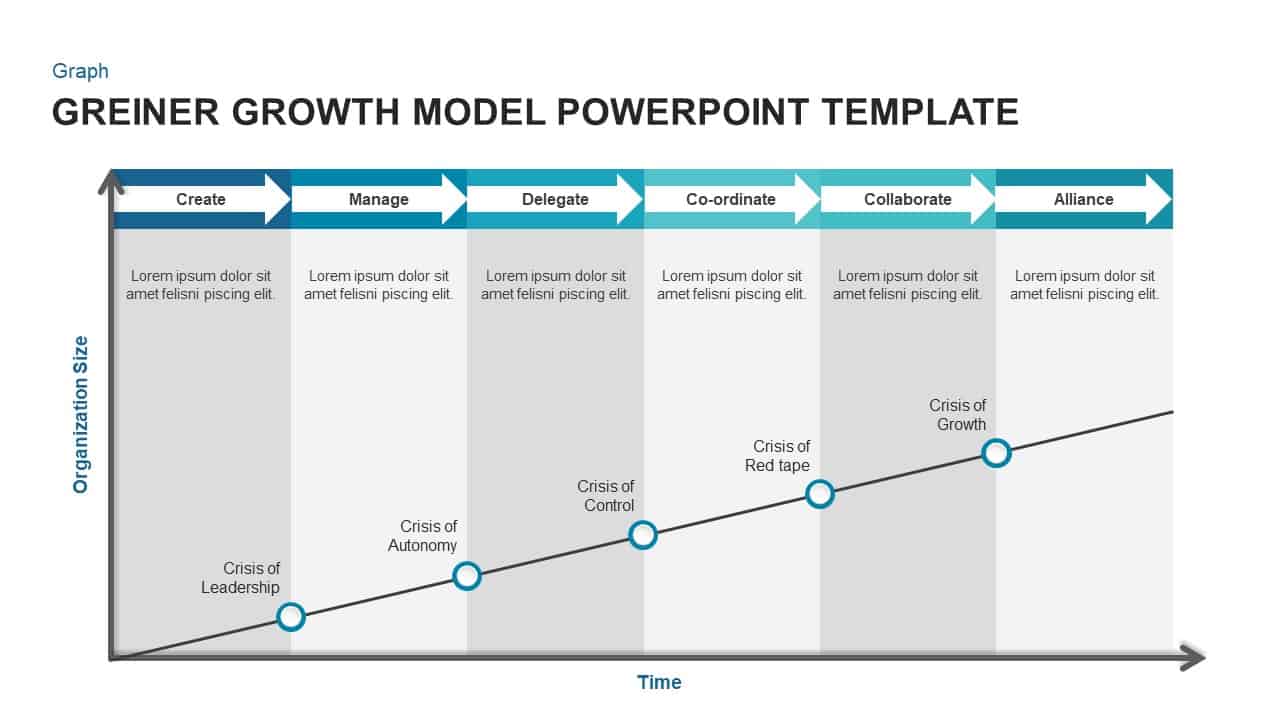
Greiner’s Growth Model Template for PowerPoint & Keynote
Business Models
Premium
-
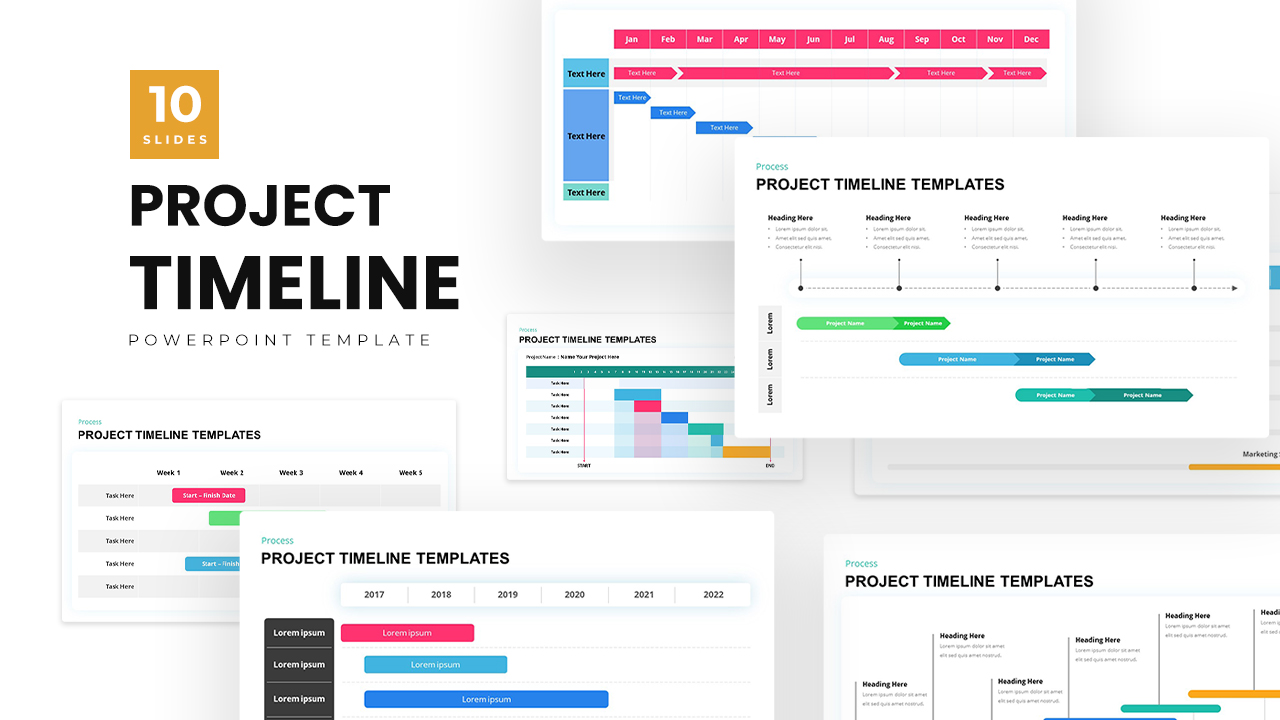
Project Timeline Template PowerPoint
Timeline PowerPoint Template
Premium
-
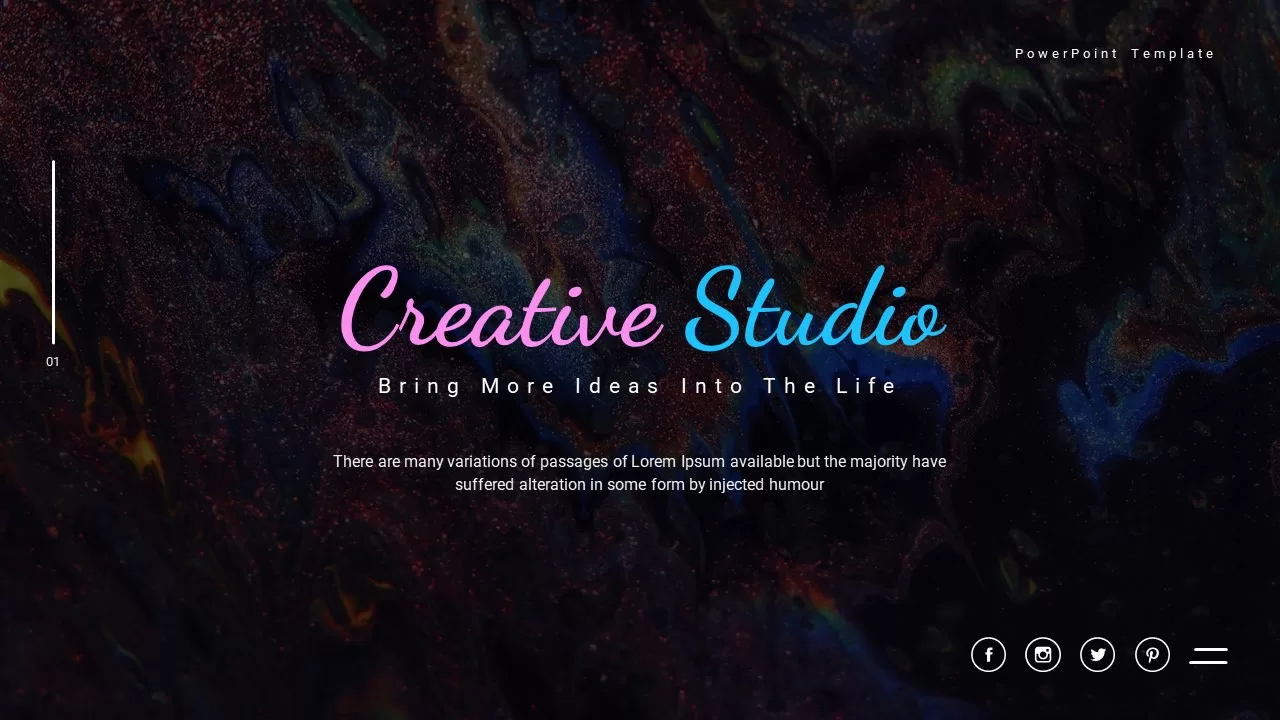
Creative Studio PowerPoint Template
PowerPoint Business Templates
Premium
-
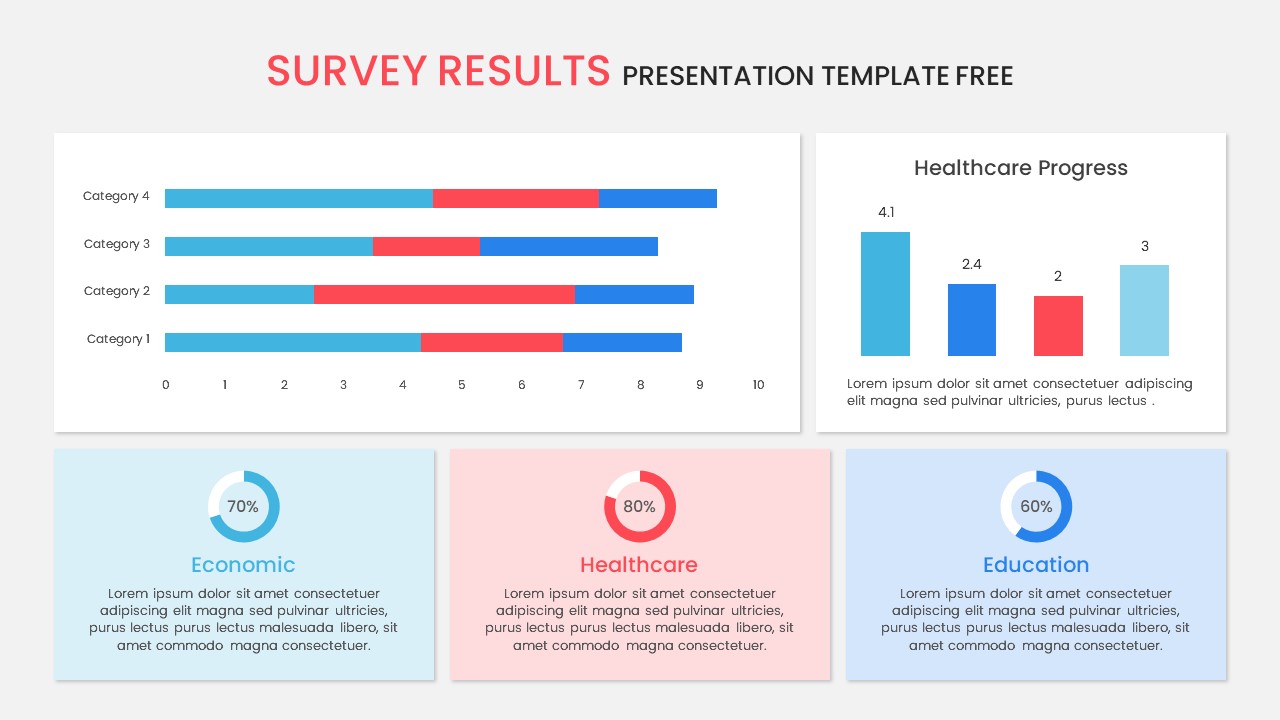
Survey Results PowerPoint Template Free
Free PowerPoint Templates
Free
-
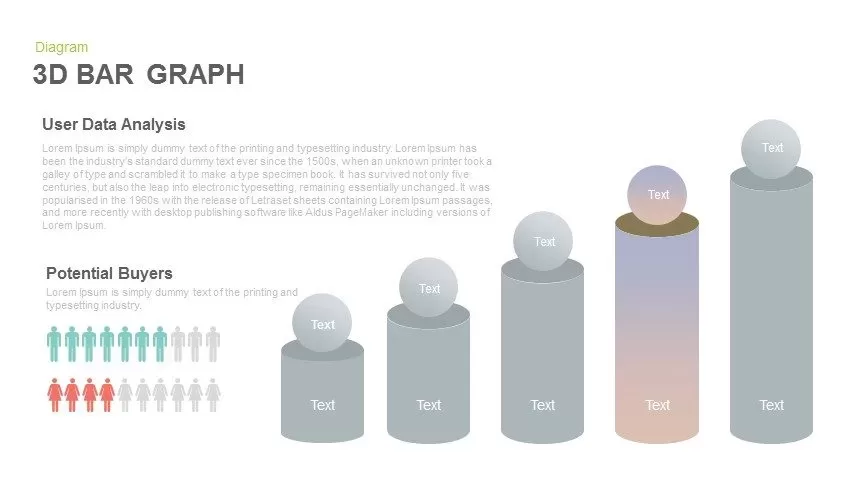
3d Bar Graph PowerPoint Template and Keynote Slide
Diagrams
Premium
-

Finance Consulting PowerPoint Template
PowerPoint Templates
Premium
-
S Curve Template For PowerPoint
PowerPoint Templates
Premium
-
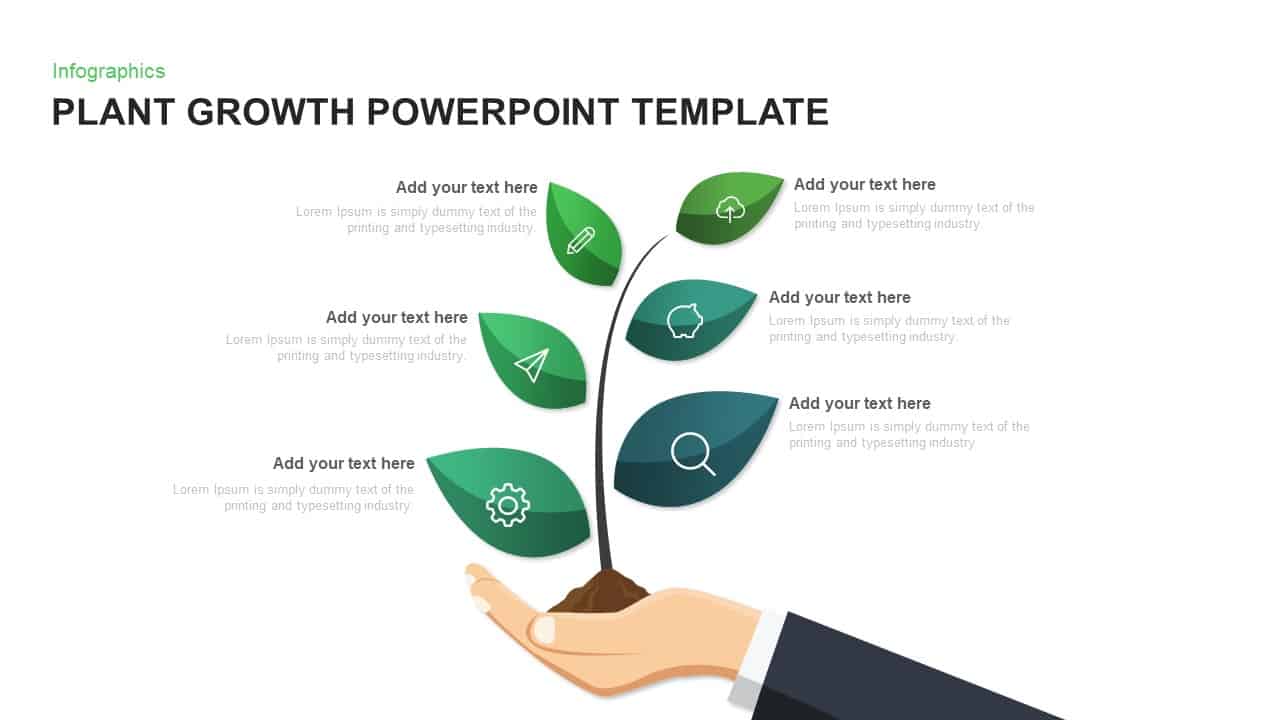
Plant Growth Template for PowerPoint and Keynote
Tree Diagrams
Premium
-
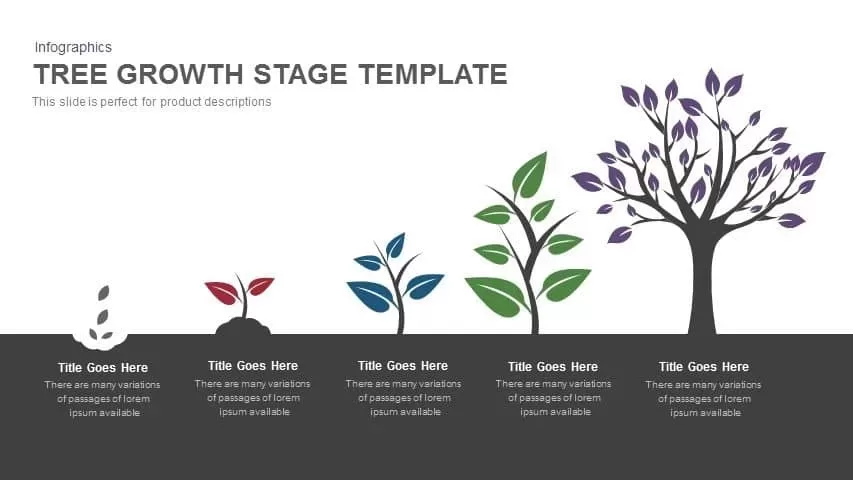
Tree Growth Stage PowerPoint Template and Keynote
Infographic
Premium
-
Free Project Kickoff Meeting Template PowerPoint
Free PowerPoint Templates
Free
-
Project Management Dashboard PowerPoint Template and Keynote Template
PowerPoint Templates
Premium
-
PowerPoint Isometric Shapes Four Box Template
Diagrams
Premium
-
Emotional Intelligence Slide
PowerPoint Templates
Premium
-

Multipurpose Business PowerPoint Template
PowerPoint Business Templates
Premium
-
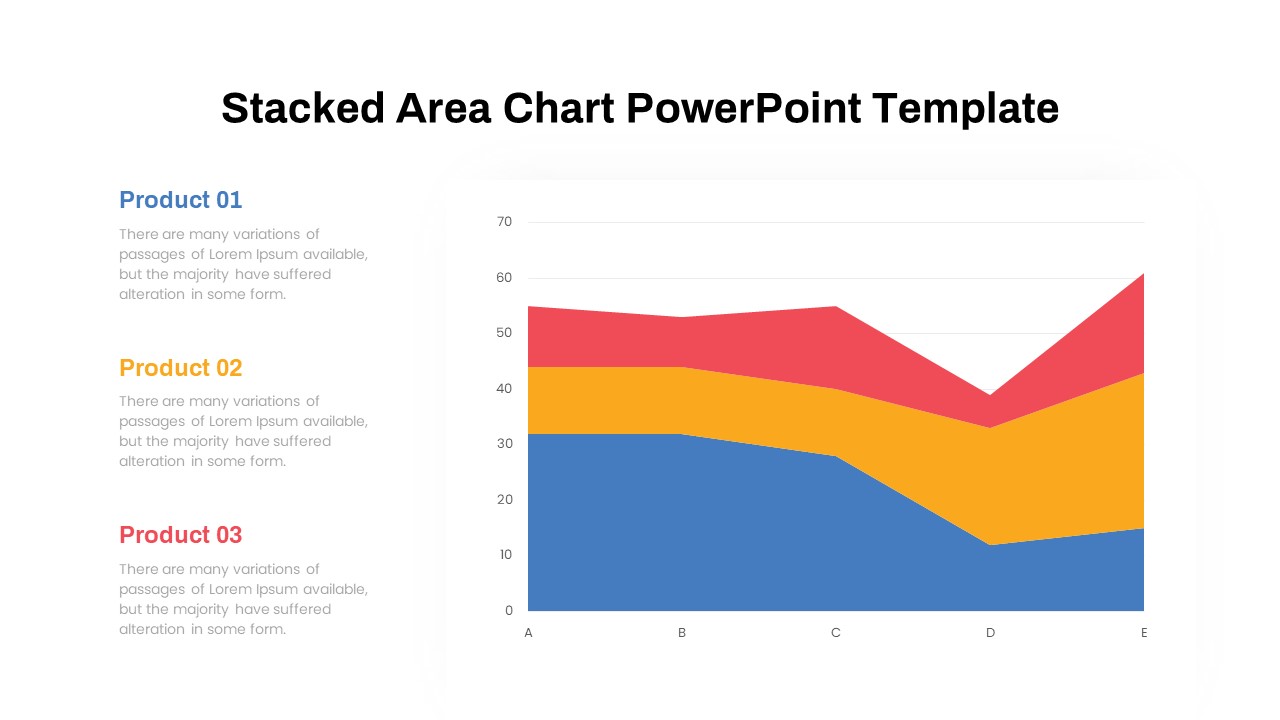
Stacked Area Chart PowerPoint Template
PowerPoint Charts
Premium
-

Disaster Management Template
PowerPoint Templates
Premium
-
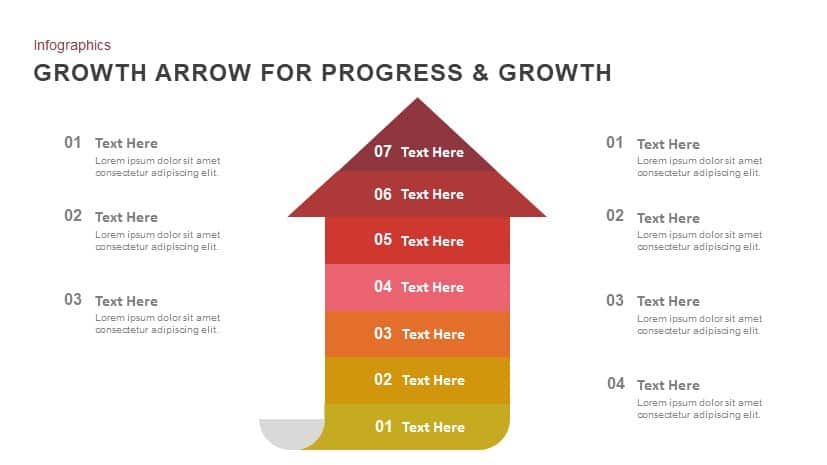
Progress & Growth Arrow PowerPoint Template and Keynote
Arrow Diagrams
Premium
-
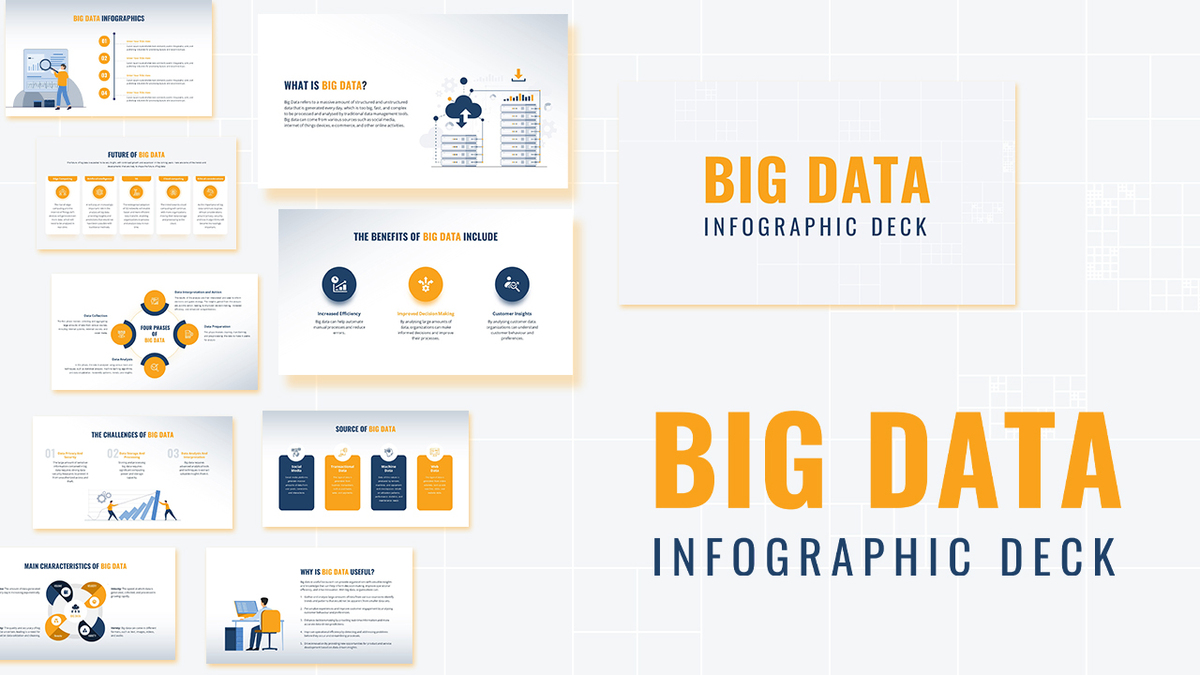
Big Data Infographic Deck For PowerPoint
PowerPoint Business Templates
Premium
-
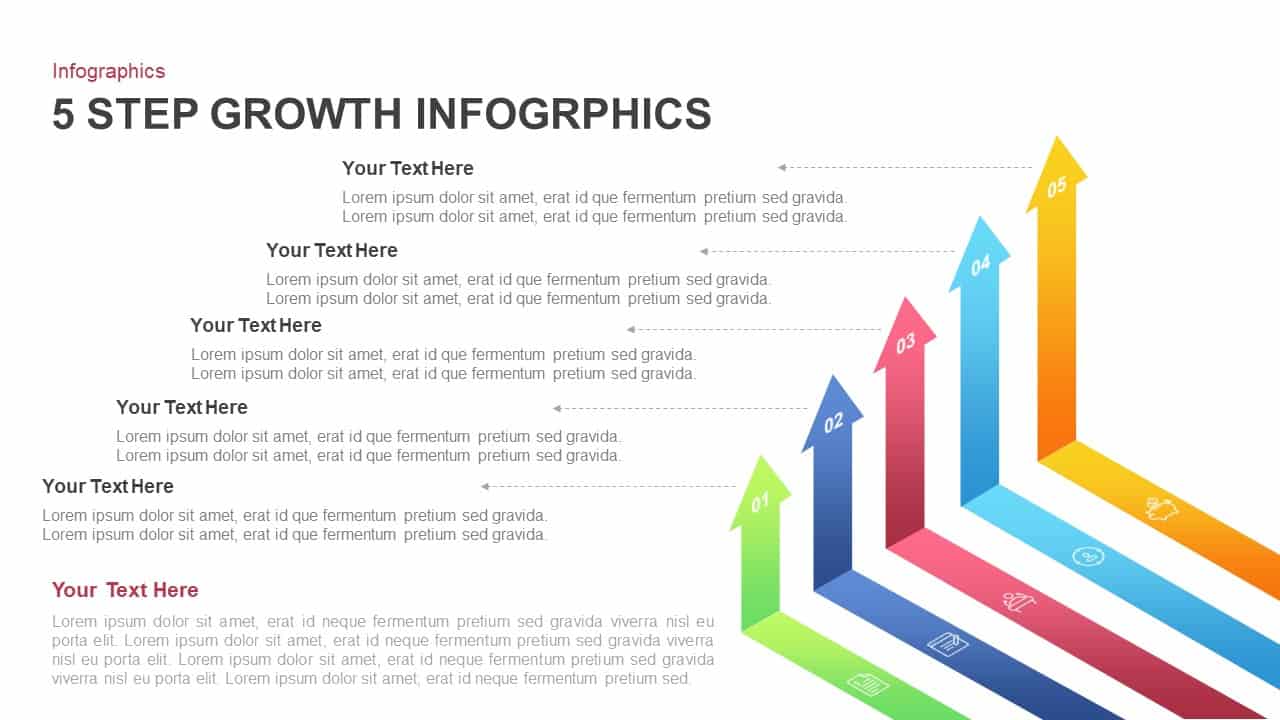
5 Step Growth Infographic Templates for PowerPoint Presentation
Business Models
Premium
-
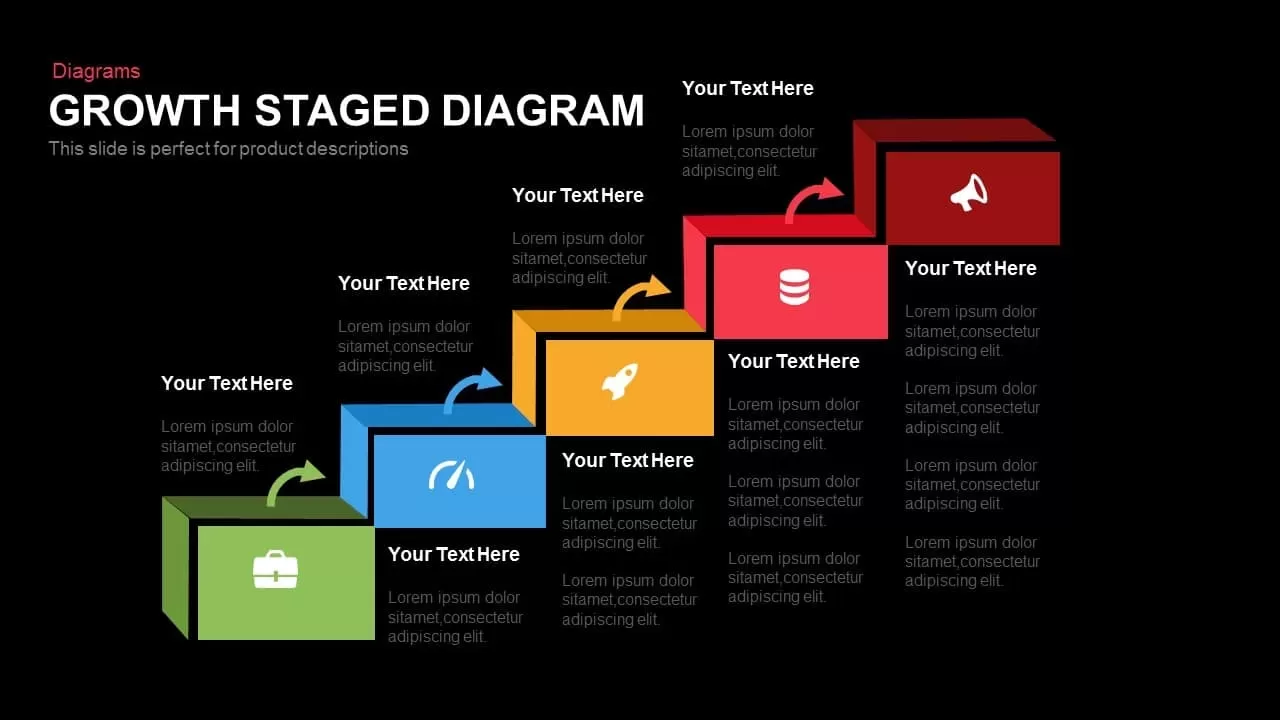
Growth Staged Step Diagram Template for PowerPoint and Keynote
Diagrams
Premium
-
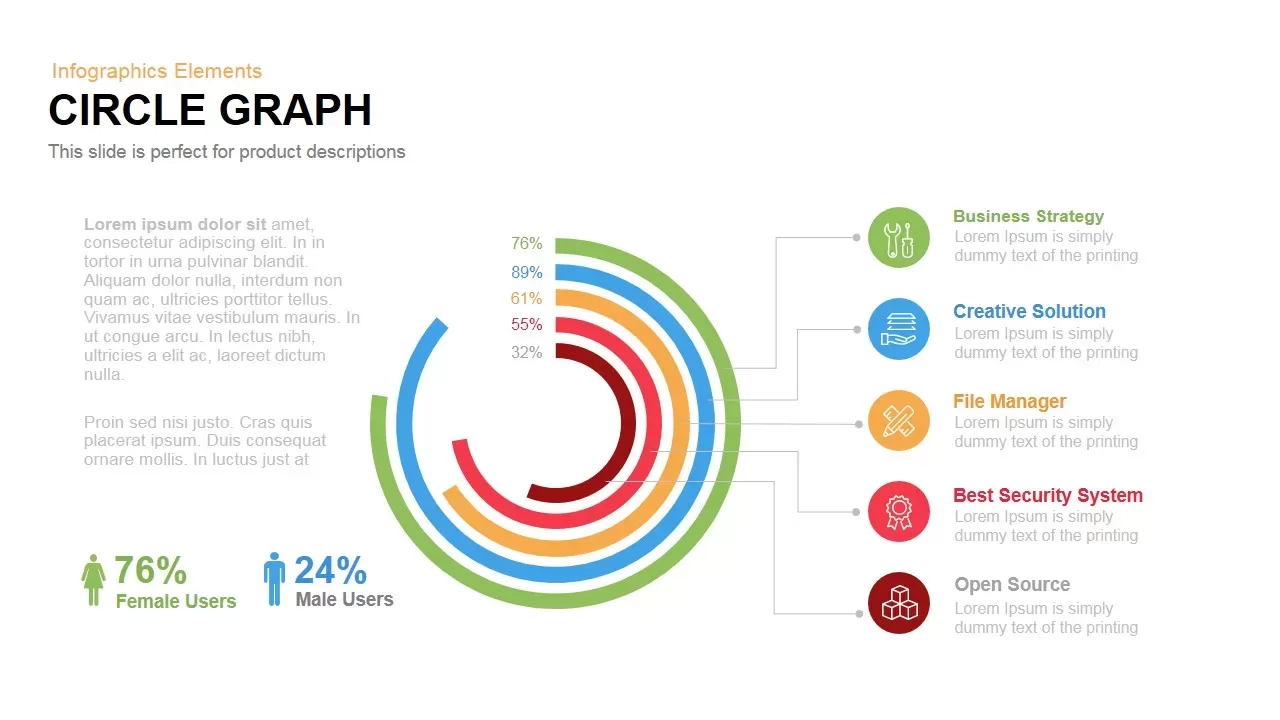
Circle Graph PowerPoint Template and Keynote Slide
Business Models
Premium
-

Dashboard Template for PowerPoint Presentation
PowerPoint Charts
Premium
-
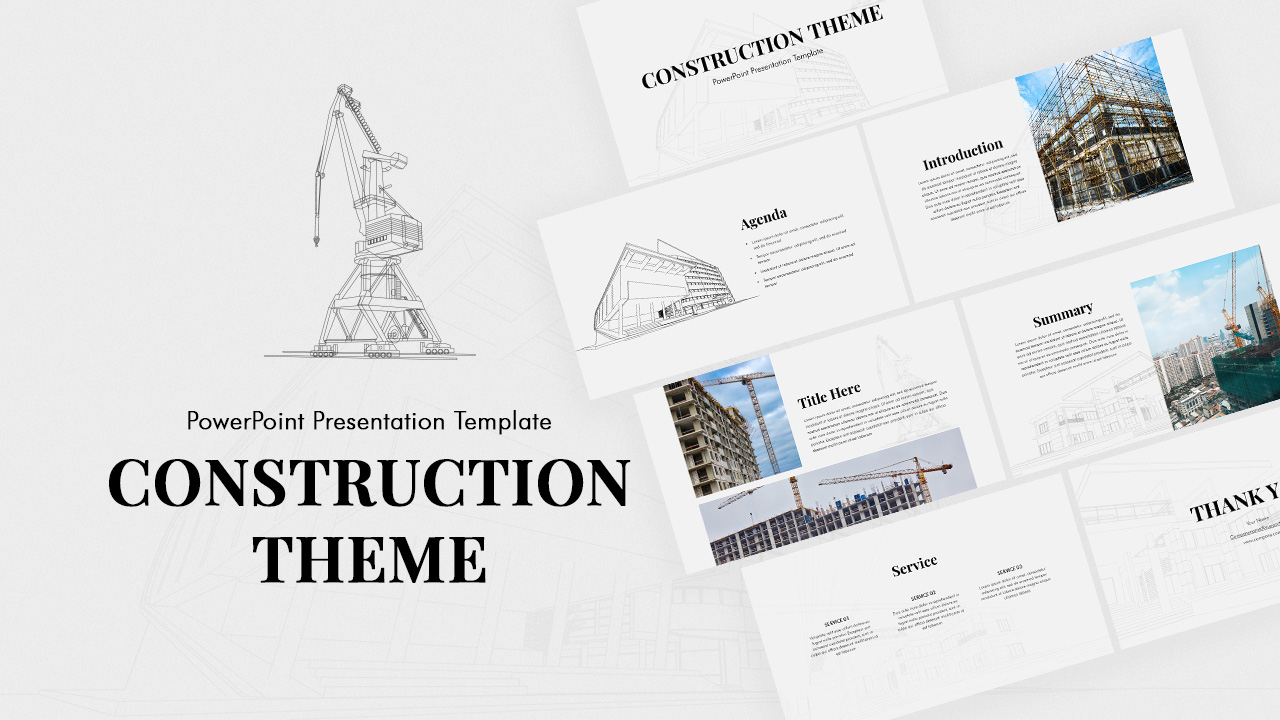
Construction PowerPoint Presentation Theme
PowerPoint Themes
Premium
-
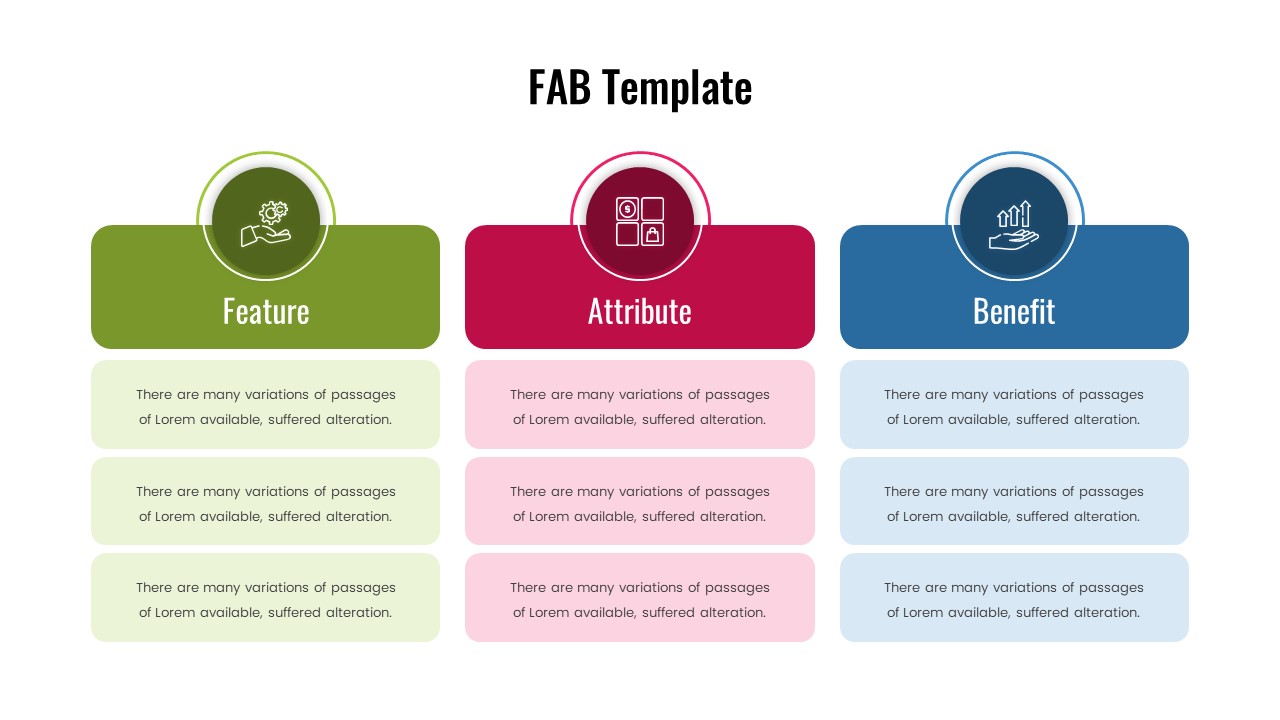
FAB Slide For PowerPoint
PowerPoint Templates
Premium
-
Project Roadmap PowerPoint Template
PowerPoint Templates
Premium
-
Corporate PowerPoint Presentation Template
PowerPoint Business Templates
Premium
-
Growth Steps Template Diagram for PowerPoint and Keynote
Diagrams
Premium
-
Project Execution Plan PowerPoint Template
Infographic
Premium
-
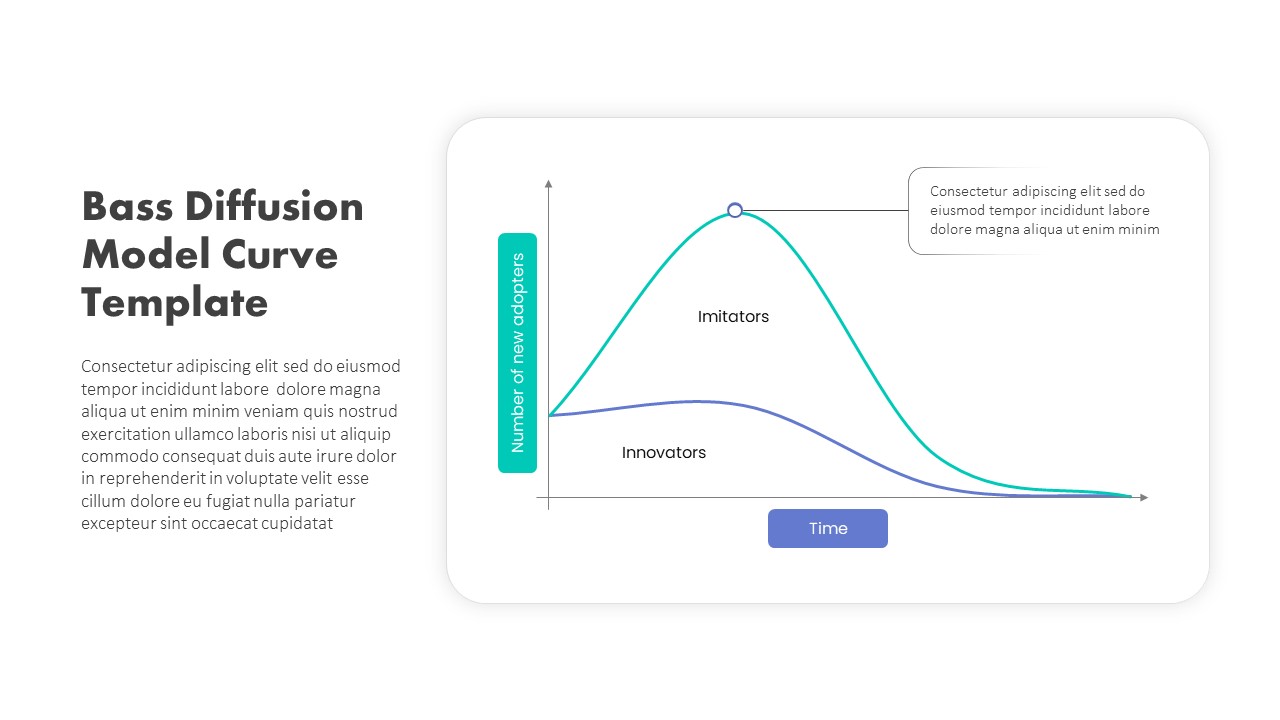
Bass Diffusion Model Chart PowerPoint Slide Template
PowerPoint Templates
Premium
-
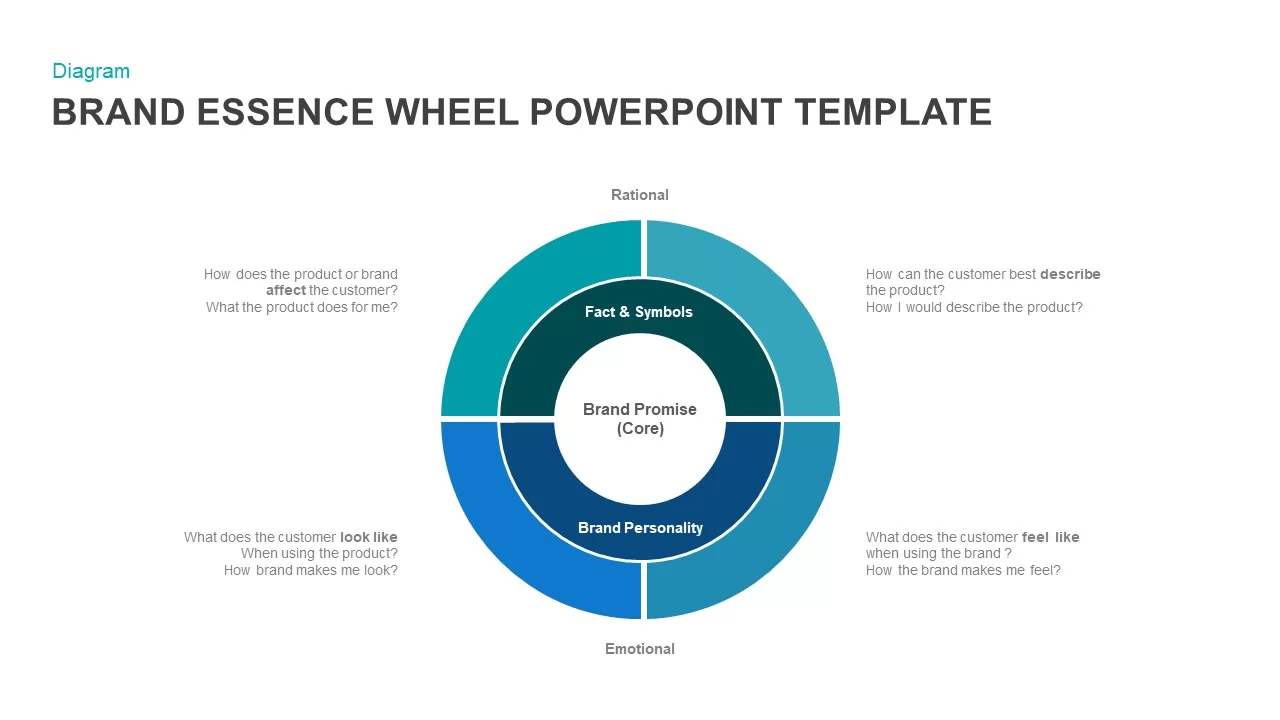
Brand Essence Wheel PowerPoint Template
Diagrams
Premium
-
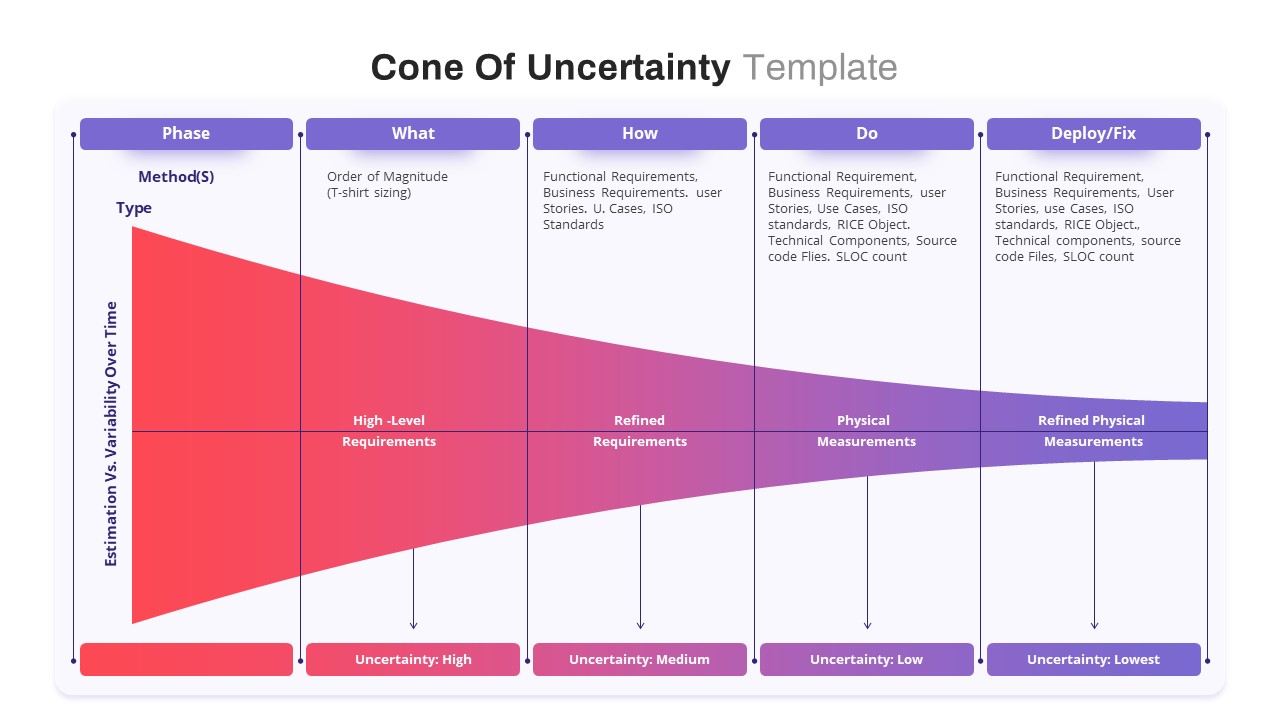
Cone Of Uncertainty PowerPoint Template
PowerPoint Charts
Premium
-
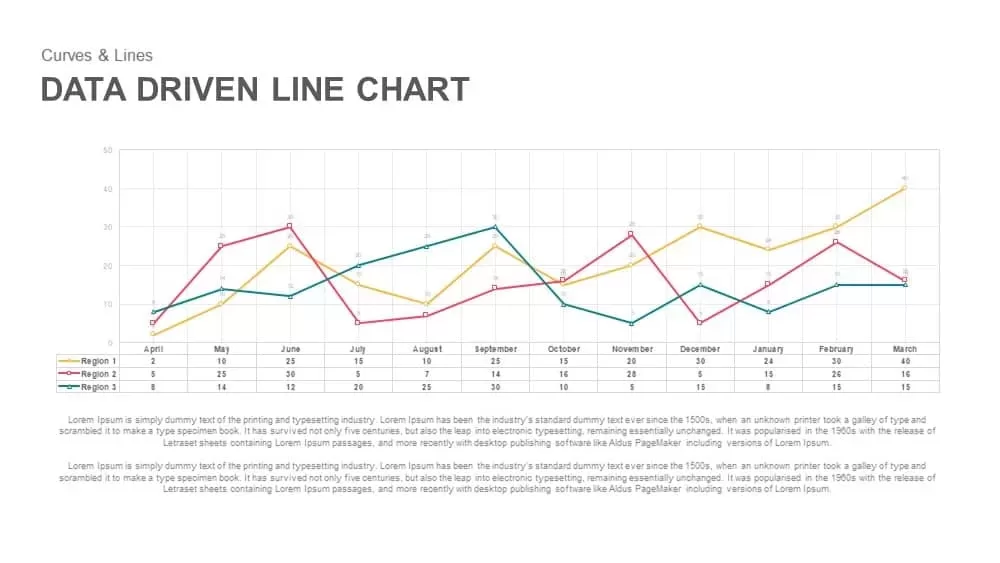
Data Driven Line Chart Template for PowerPoint & Keynote
Curves and Lines
Premium
-
Data Bar Chart Template for PowerPoint and Keynote
Column and Bar chart
Premium