


Rectangle Area Chart powerpoint
This template is part of a deck featuring multiple slides. To check out all slides, click on See All.
See All

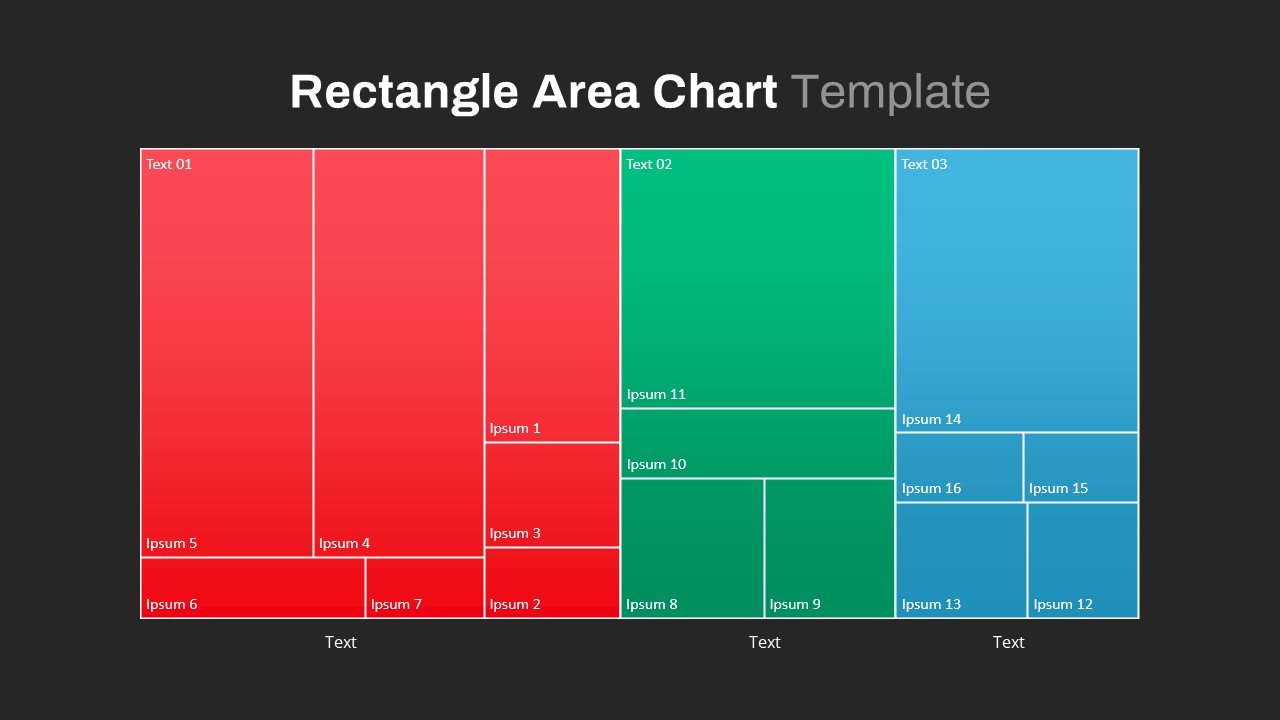
The rectangle area chart template is an excellent choice for visualizing data arranged in columns or rows on a worksheet. It is particularly effective for illustrating trends over time and emphasizing the total value. By displaying the sum of plotted values, this chart type highlights the relationship between individual components and the entire dataset, making it a powerful tool for presenting both temporal and comparative data. Its versatility makes it a popular option for various presentations, enabling audiences to grasp complex information effortlessly. Key features of rectangle area chart PowerPoint template
- Dynamic Visuals: The template boasts eye-catching rectangle area charts that breathe life into your data. Each rectangle's size represents data values, making it easier for your audience to comprehend information quickly.
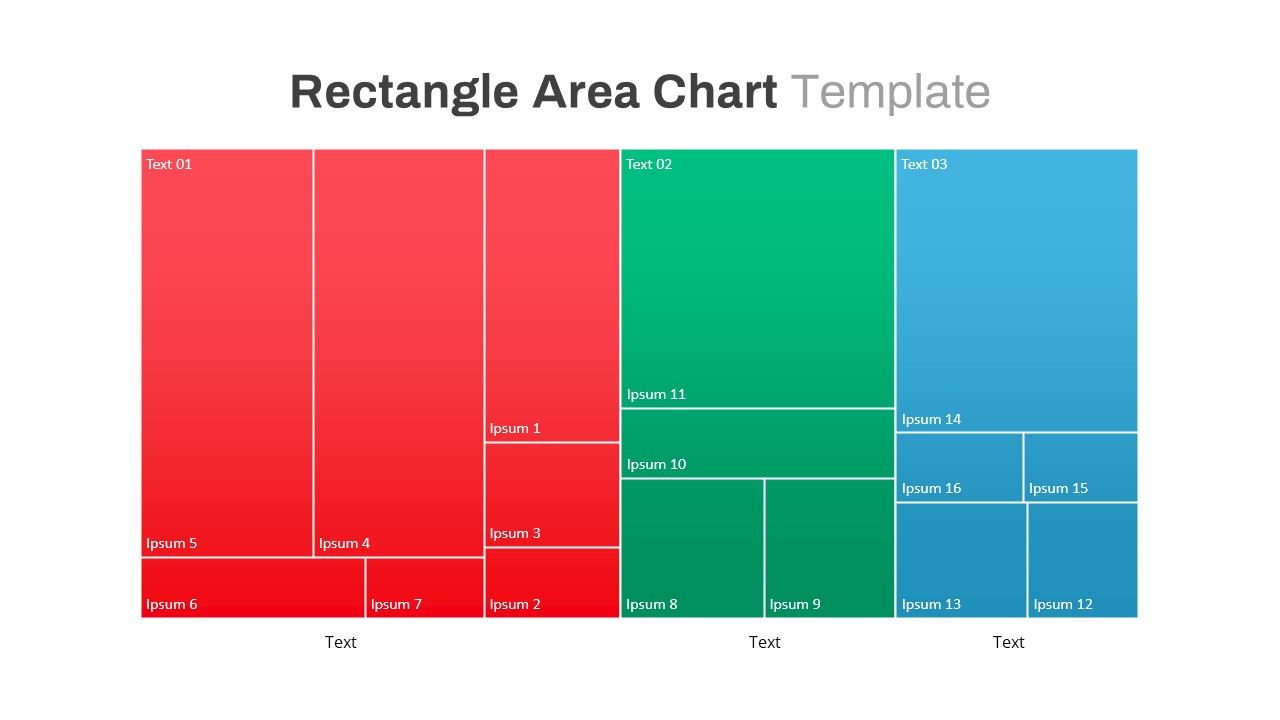
- Customizable Design: Our user-friendly interface allows you to effortlessly modify colors, fonts, and sizes to match your brand identity and presentation theme.
- Data Flexibility: Whether you're displaying sales figures, market trends, or demographic data, the Rectangle Area Chart PowerPoint template adapts to various data types with ease.
- Data Labeling: Enhance clarity by adding data labels above or within the rectangles, providing your audience with concise information at a glance.
- Easy Data Input: Simply copy and paste your data into the designated fields, and the template will automatically generate the corresponding rectangle area chart.
- Versatile Usages: Ideal for business reports, marketing presentations, educational purposes, and more, this template empowers you to convey critical insights effectively.