


Rectangle Area Chart Template
- Version
- Download 12
- File Size 0.00 KB
- File Count 1
- Create Date August 22, 2023
- Last Updated August 14, 2023
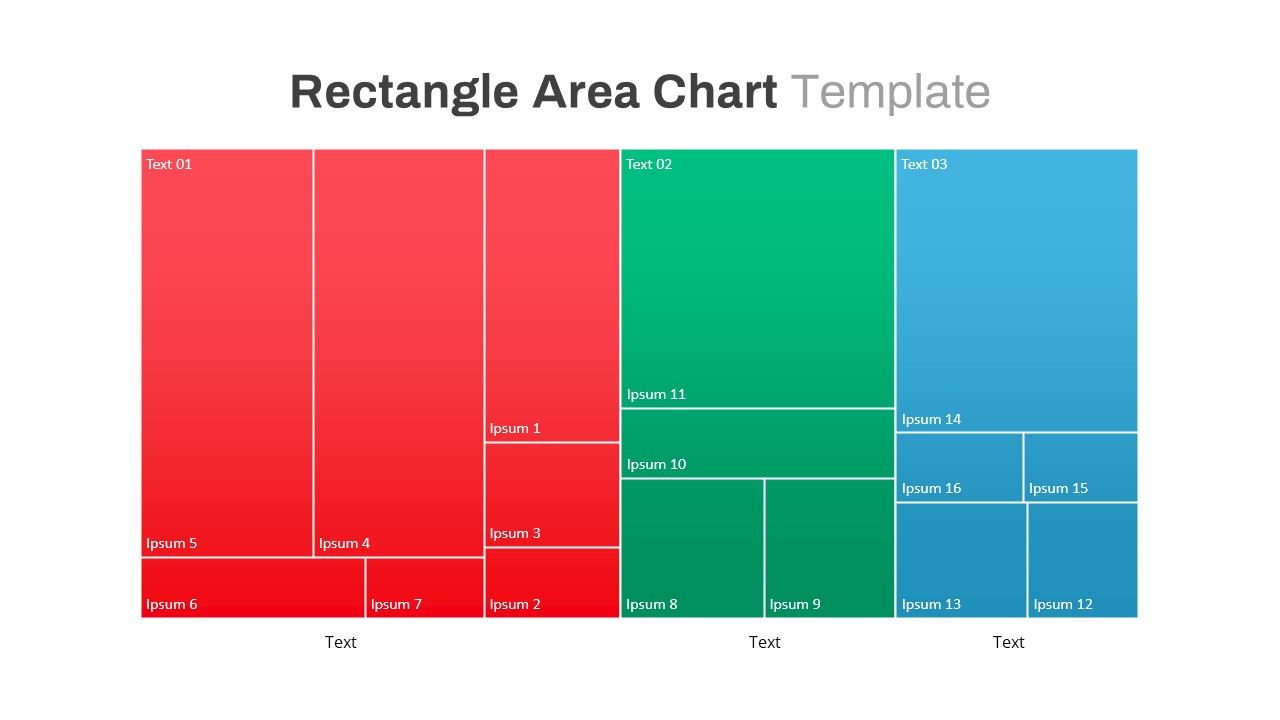
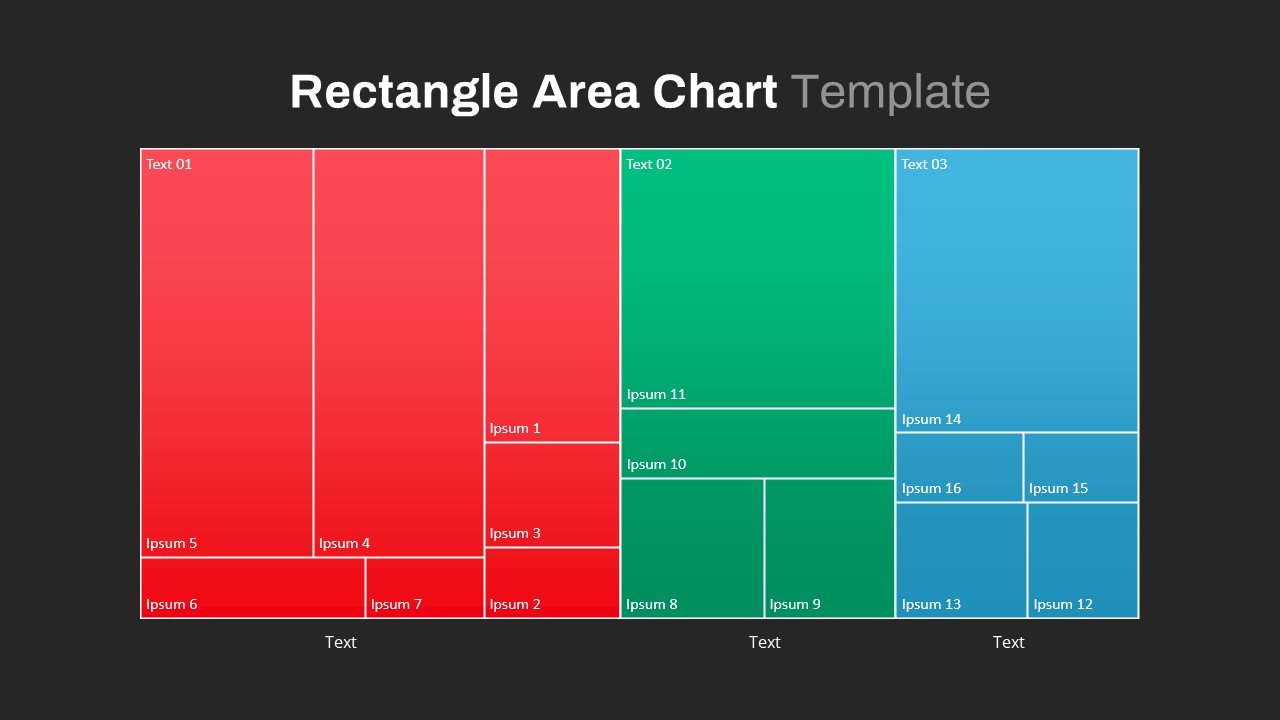
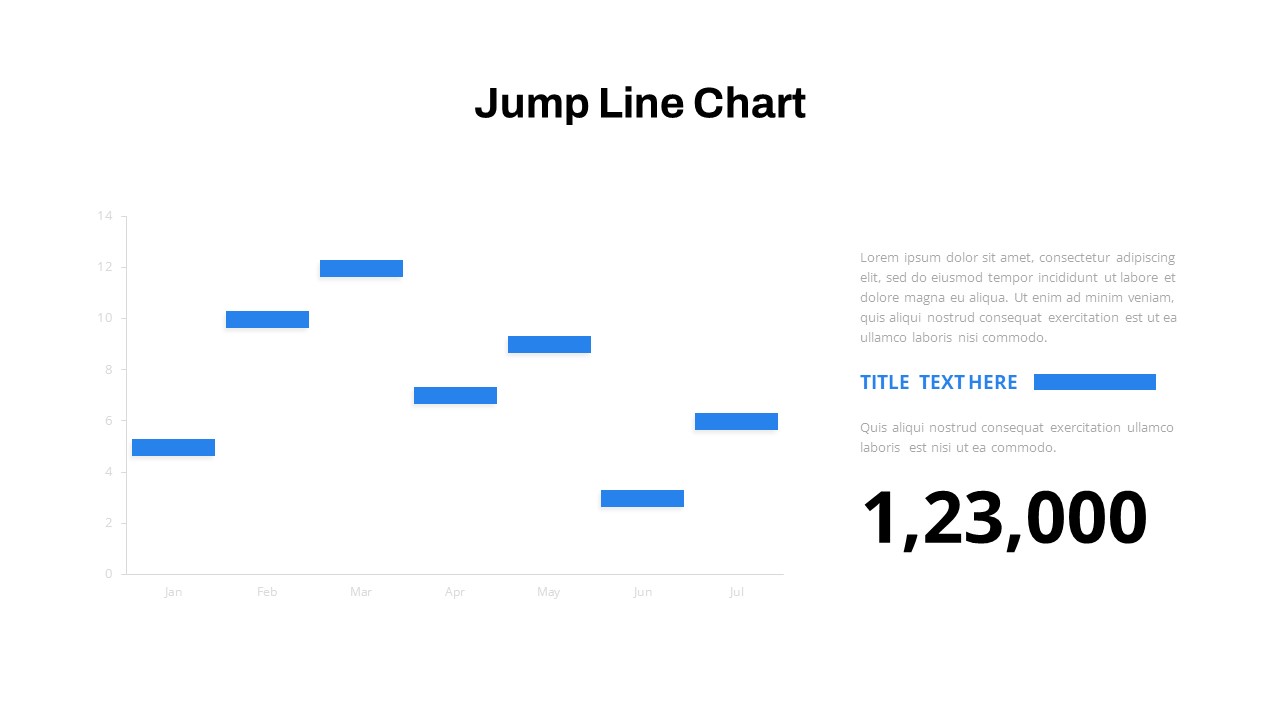
Rectangle Area Chart Template
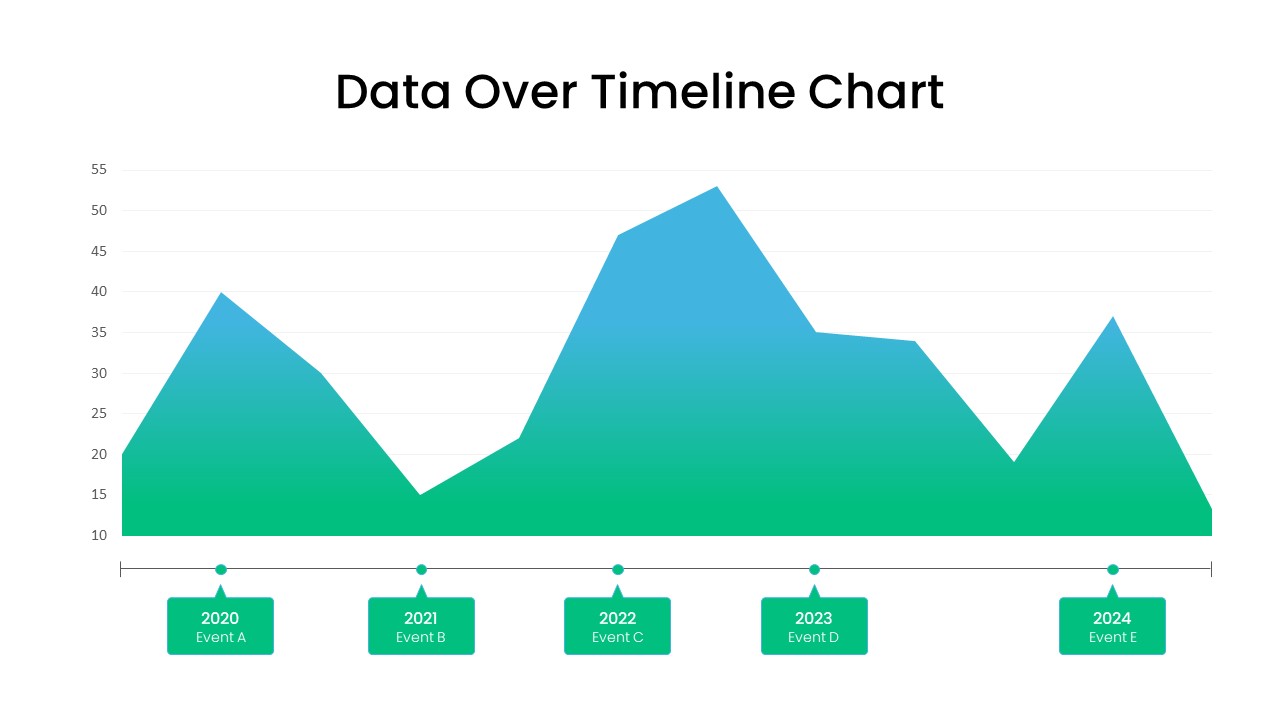
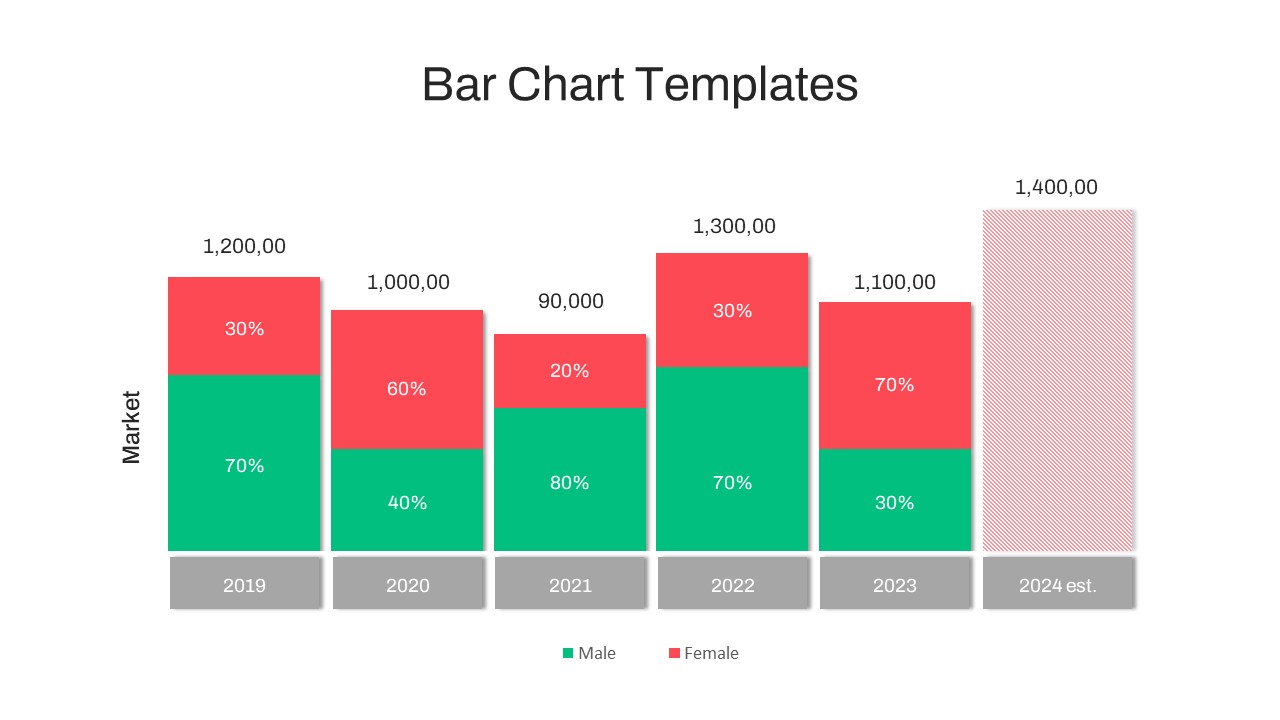
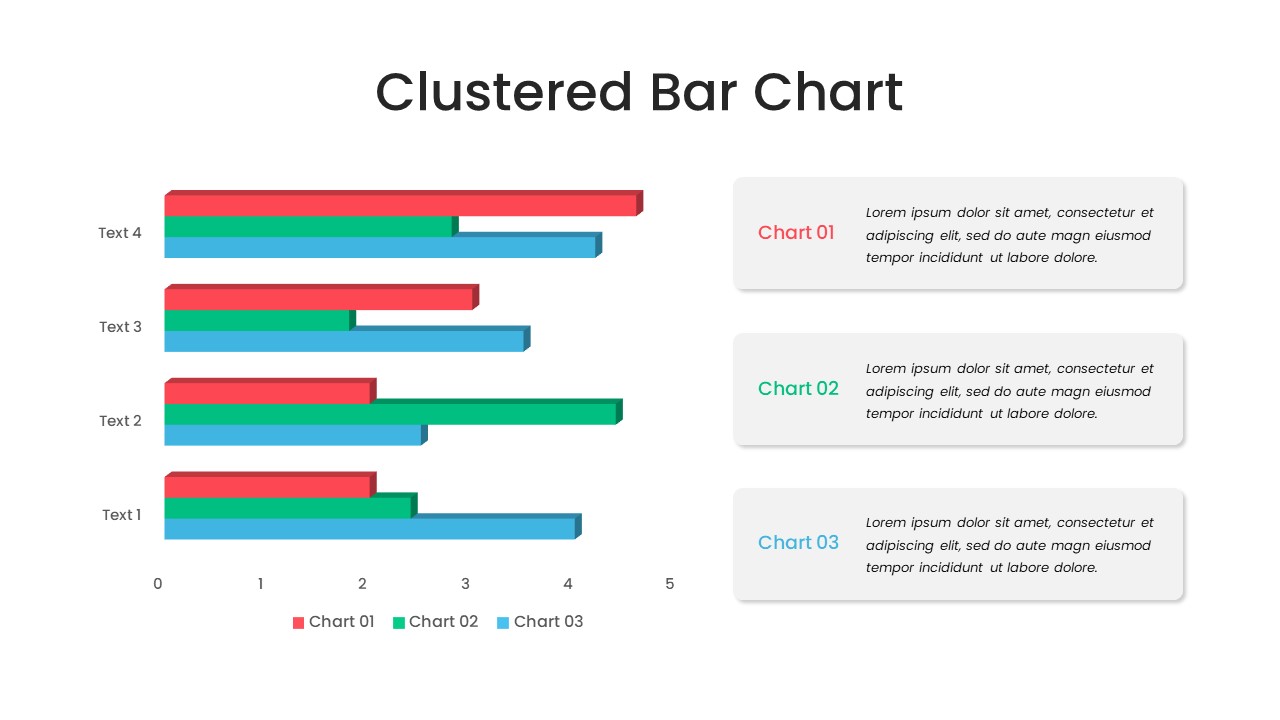
The rectangle area chart template is an excellent choice for visualizing data arranged in columns or rows on a worksheet. It is particularly effective for illustrating trends over time and emphasizing the total value. By displaying the sum of plotted values, this chart type highlights the relationship between individual components and the entire dataset, making it a powerful tool for presenting both temporal and comparative data. Its versatility makes it a popular option for various presentations, enabling audiences to grasp complex information effortlessly.
Key features of rectangle area chart PowerPoint template
- Dynamic Visuals: The template boasts eye-catching rectangle area charts that breathe life into your data. Each rectangle's size represents data values, making it easier for your audience to comprehend information quickly.
- Customizable Design: Our user-friendly interface allows you to effortlessly modify colors, fonts, and sizes to match your brand identity and presentation theme.
- Data Flexibility: Whether you're displaying sales figures, market trends, or demographic data, the Rectangle Area Chart PowerPoint template adapts to various data types with ease.
- Data Labeling: Enhance clarity by adding data labels above or within the rectangles, providing your audience with concise information at a glance.
- Easy Data Input: Simply copy and paste your data into the designated fields, and the template will automatically generate the corresponding rectangle area chart.
- Versatile Usages: Ideal for business reports, marketing presentations, educational purposes, and more, this template empowers you to convey critical insights effectively.
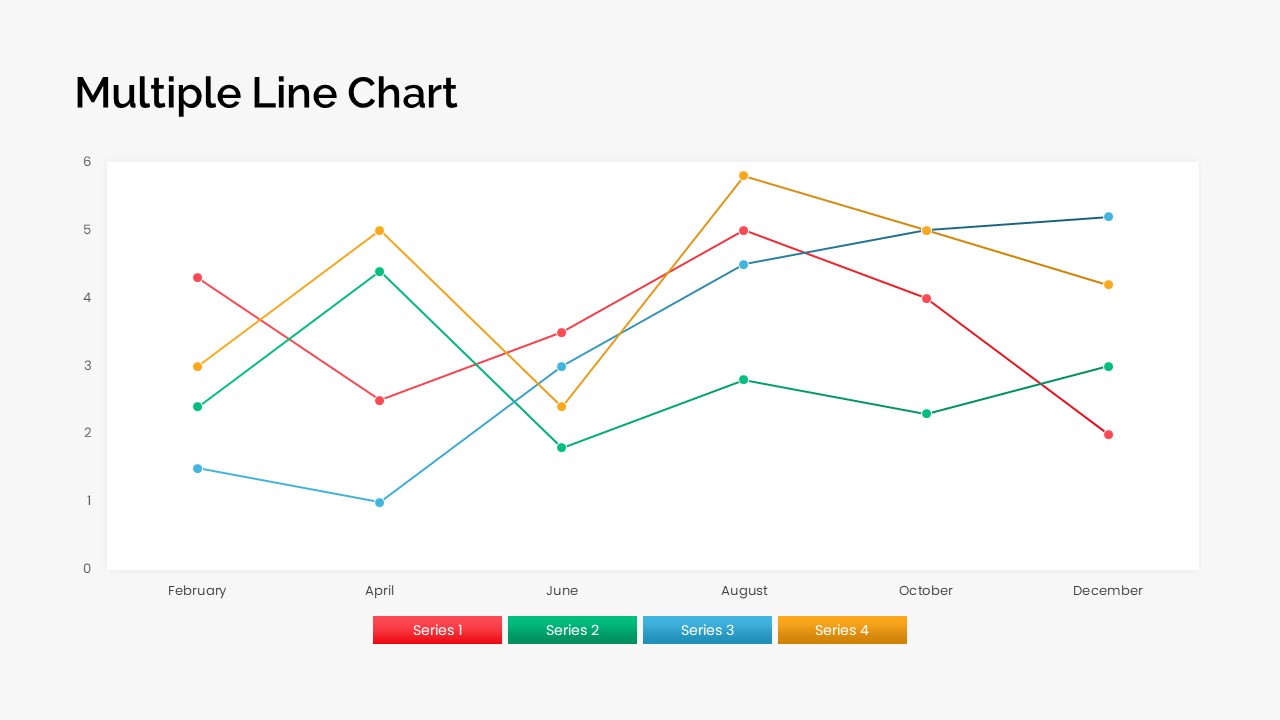
Experience the versatility of our Rectangle Area Chart PowerPoint template, featuring distinct column sizes with a striking tricolor combination. The customizable black-and-white background, column sizes, and colors can be effortlessly adjusted using the edit menu.
Elevate your data presentations, captivate your audience, and leave a lasting impression with this rectangle area chart ppt template. Simplify complex information and master the art of data-driven communication. Download now to unleash the power of visual storytelling in your presentations. Also, check out our area chart PowerPoint templates!
Attached Files
| File | Action |
|---|---|
| https://premiumdownloads.s3.amazonaws.com/SB03708-Rectangle Area Chart Template.ZIP | Download |
Login to download this file
Add to favorites
Add to collection
-

Item ID
SB03708 -

Related Templates
-

Nature PowerPoint Presentation Template
PowerPoint Business Templates
Premium
-

Free Vertical PowerPoint Template
PowerPoint Business Templates
Free
-

Cab Service PowerPoint Template
PowerPoint Templates
Premium
-

Research Proposal PowerPoint Template
PowerPoint Templates
Premium
-

Gym PowerPoint Template
PowerPoint Templates
Premium
-

Sales Deck Free PowerPoint Template
PowerPoint Templates
Free
-

Free Space Minimal Deck Template
PowerPoint Templates
Free
-

Travel Agency PowerPoint Template
PowerPoint Templates
Premium
-

Free Nursing Capstone PowerPoint Deck
PowerPoint Templates
Free
-

VET Clinic PowerPoint Template
PowerPoint Templates
Premium
-

Free Physical Education PowerPoint Template Deck
Free PowerPoint Templates
Free
-

IoT Presentation Template
PowerPoint Templates
Premium
-

Effective Communication PowerPoint Template
PowerPoint Templates
Premium
-

PowerPoint Quiz With Timer
PowerPoint Templates
Premium
-

Free Cartoon PowerPoint Template
Free PowerPoint Templates
Free
-

Graph Paper PowerPoint Template Deck
PowerPoint Templates
Premium
-

Free Economics PowerPoint Template
Free PowerPoint Templates
Free
-

Free Charity PowerPoint Template Deck
PowerPoint Templates
Free
-

Free Real Estate Listing PowerPoint Template
Free PowerPoint Templates
Free
-

Macroeconomics PowerPoint Template
PowerPoint Templates
Premium
-

Free Army PowerPoint Template
PowerPoint Templates
Free
-

Customer Experience Loyalty PowerPoint Deck Template
PowerPoint Templates
Premium
-

Free University Presentation PowerPoint Template
PowerPoint Templates
Free
-

Free Aviation PowerPoint Template
Free PowerPoint Templates
Free
-

Free Event Planning PowerPoint Template
Free PowerPoint Templates
Free
-

Animated Agriculture PowerPoint Deck Template
PowerPoint Templates
Premium
-

Free Book Review PowerPoint Template
Free PowerPoint Templates
Free
-
Data Flow PowerPoint Presentation Template
PowerPoint Templates
Premium
-

Global Warming Infographic PowerPoint Template Deck
PowerPoint Templates
Premium
-

Real Estate PowerPoint Theme
PowerPoint Themes
Premium
-

Data Science PowerPoint Template
PowerPoint Templates
Premium
-

Free Dunder Mifflin Paper Company Pitch Deck
Free PowerPoint Templates
Free
-

EFQM Model PowerPoint Template
PowerPoint Templates
Premium
-

Annual Report PowerPoint Template and Keynote
PowerPoint Templates
Premium
-
Core Values Sections PowerPoint Template and Keynote
Business Models
Premium
-

Free AI Artificial Intelligence PowerPoint Template
PowerPoint Templates
Free
-
Spline Chart PowerPoint Template
PowerPoint Charts
Premium
-

Stakeholder Register PowerPoint Template
PowerPoint Templates
Premium
-
Segmented Scatter Chart PowerPoint Template
PowerPoint Charts
Premium
-

Area Chart PowerPoint Template
PowerPoint Charts
Premium
-

Animated Upcoming Event Poster PowerPoint Template
PowerPoint Templates
Premium
-
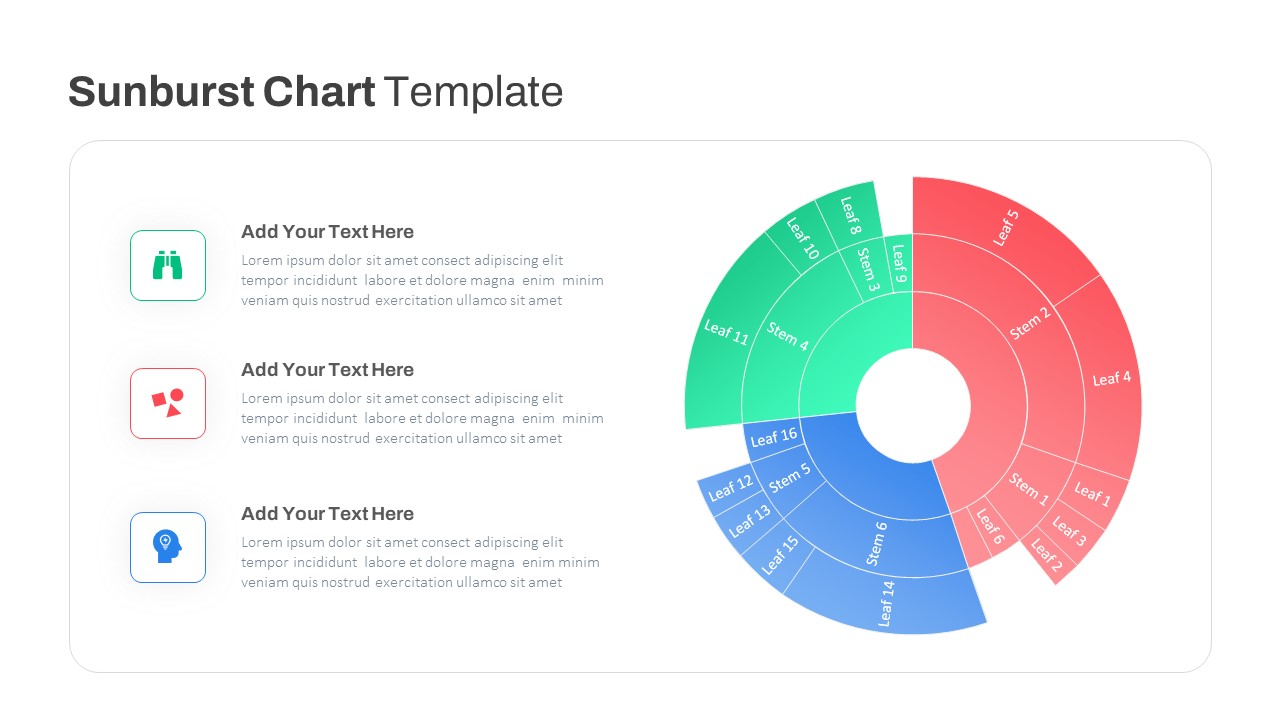
Sun Burst Chart PowerPoint Template
Circular Diagrams
Premium
-

Business Process Reengineering Template
PowerPoint Templates
Premium
-
Free Charts & Graphs Deck PowerPoint Template
PowerPoint Templates
Free
-

Open Door Policy PowerPoint Template
PowerPoint Templates
Premium
-

Proportional Area Chart PowerPoint Template
PowerPoint Templates
Premium
-

Mekko Chart Template
PowerPoint Templates
Premium
-
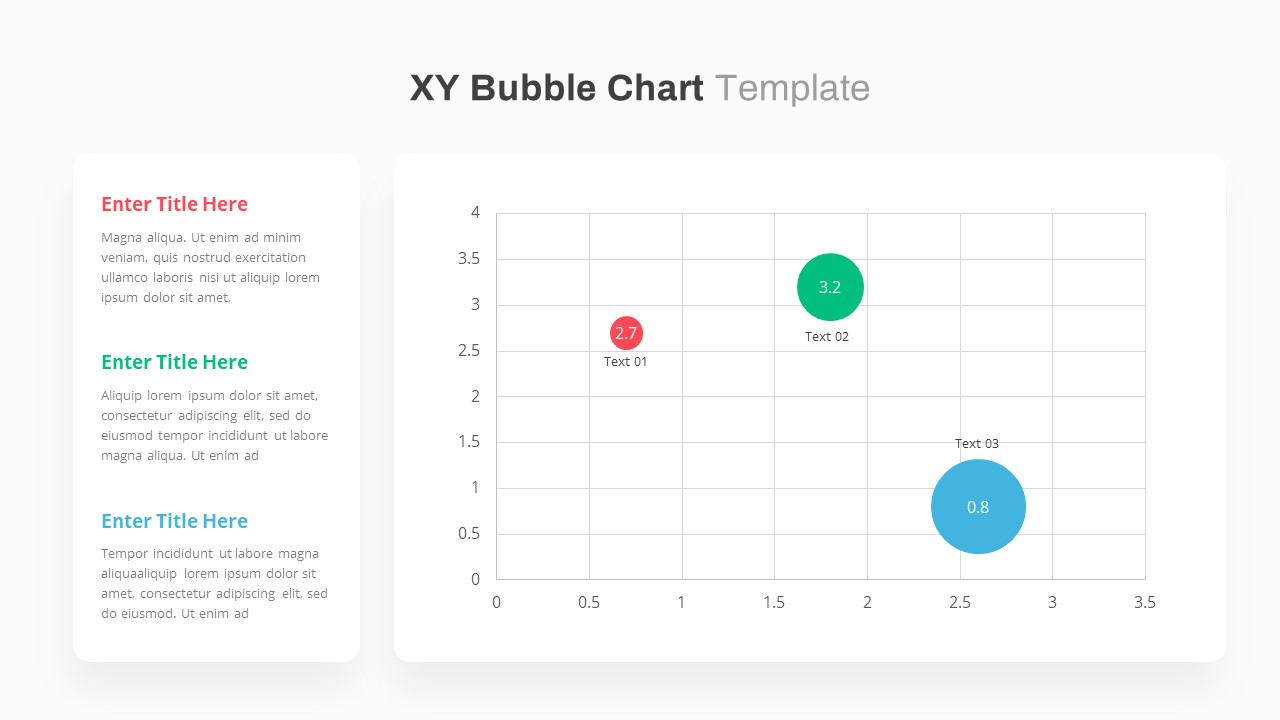
X Y Bubble Chart PowerPoint Template
PowerPoint Charts
Premium
-
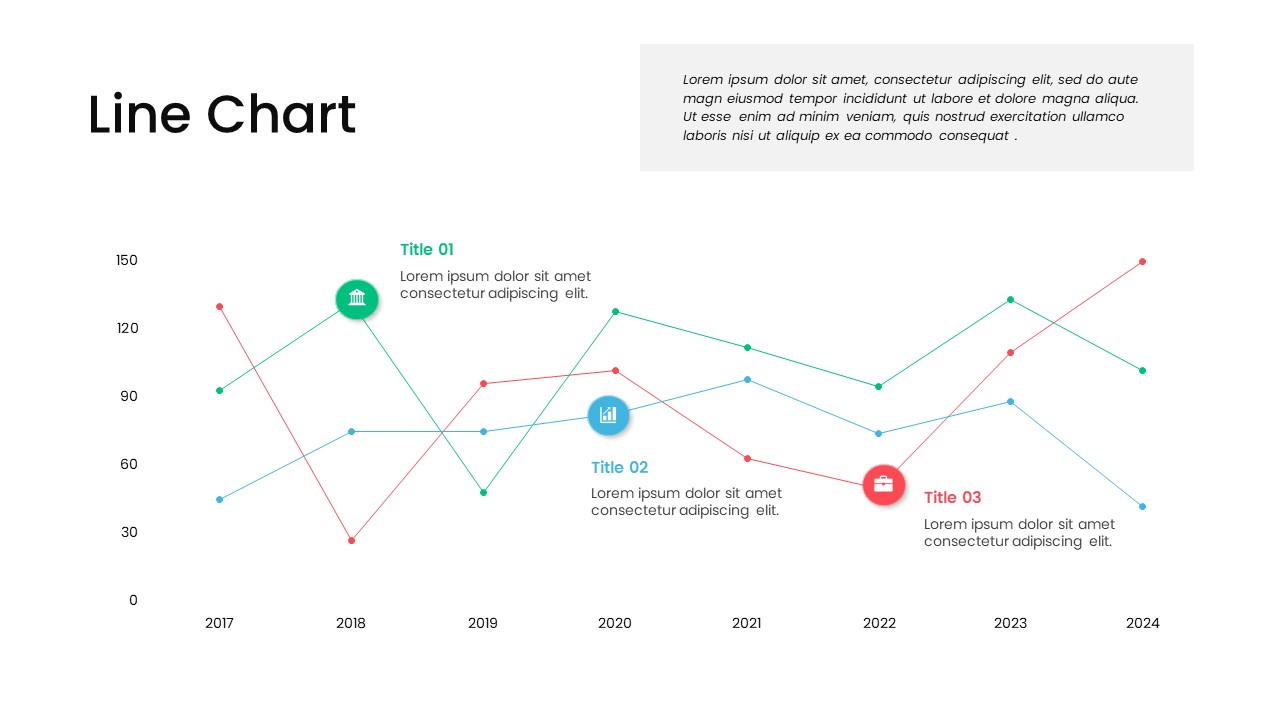
Line Chart PowerPoint Template
PowerPoint Charts
Premium
-
Data Over Time Line Chart PowerPoint Template
PowerPoint Charts
Premium
-
Grouped Column Chart PowerPoint Template
Column and Bar chart
Premium
-
Polar Chart PowerPoint Template
PowerPoint Templates
Premium
-
Waterfall Column Chart PowerPoint Template
Column and Bar chart
Premium
-
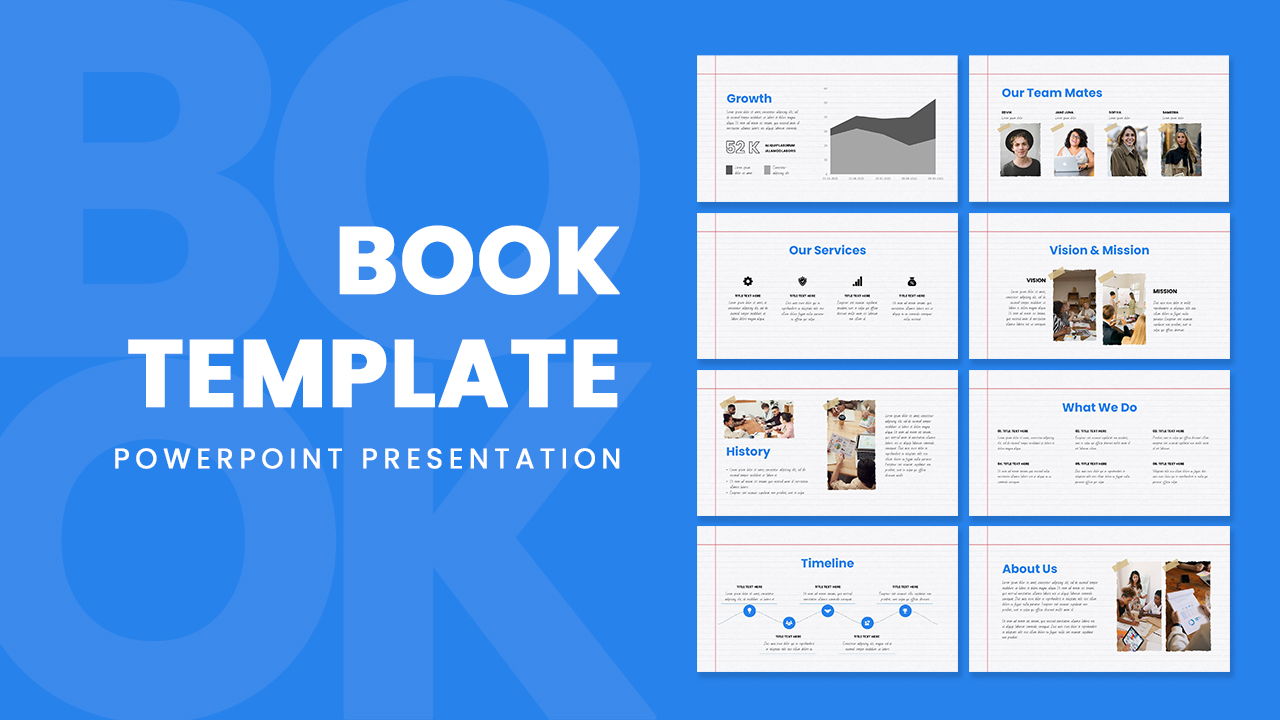
Free PowerPoint Book Template
Free slides
Free
-
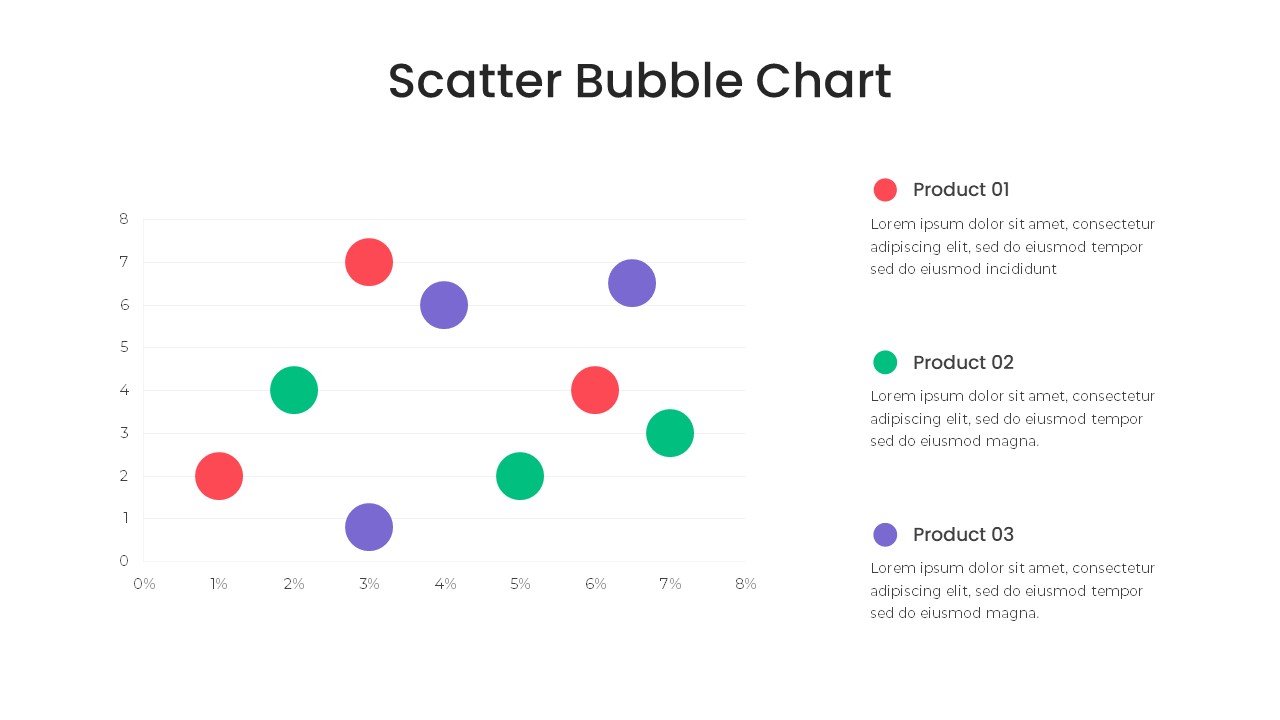
Bubble Chart PowerPoint Template
PowerPoint Templates
Premium
-
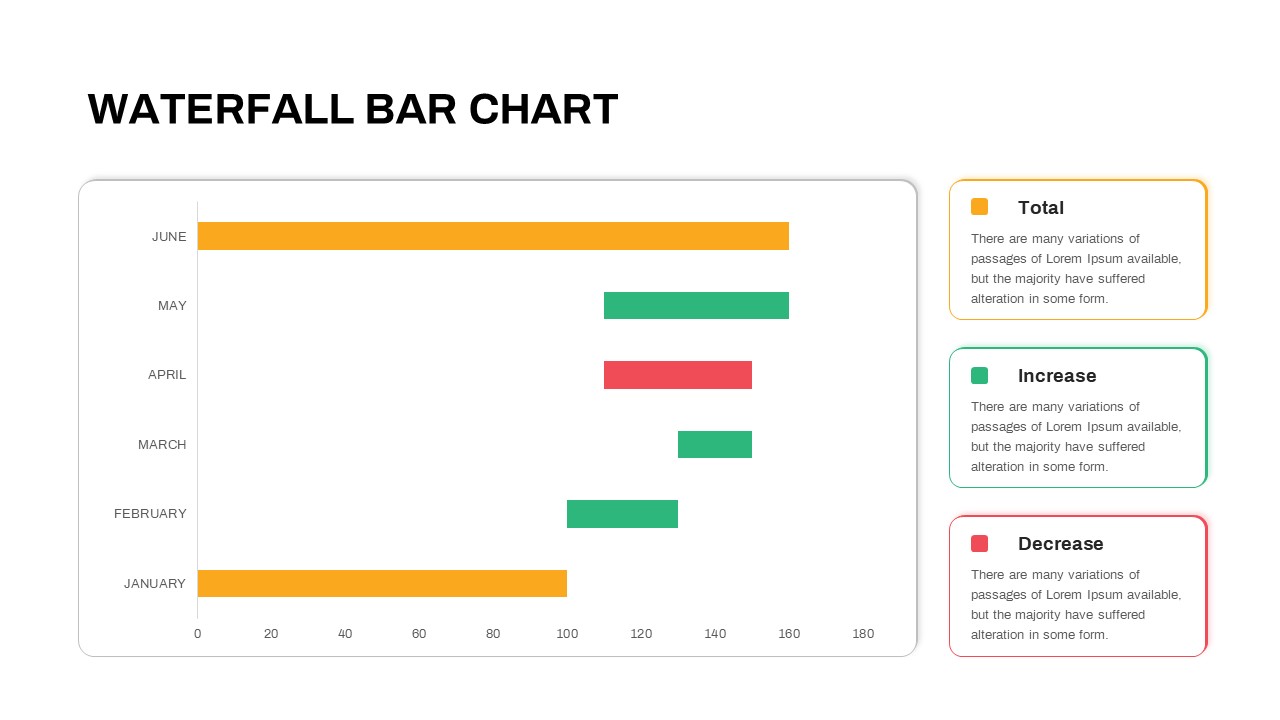
Waterfall Bar Chart PowerPoint Template
PowerPoint Charts
Premium
-

Free Charts and Graphs PowerPoint Template
PowerPoint Templates
Free
-
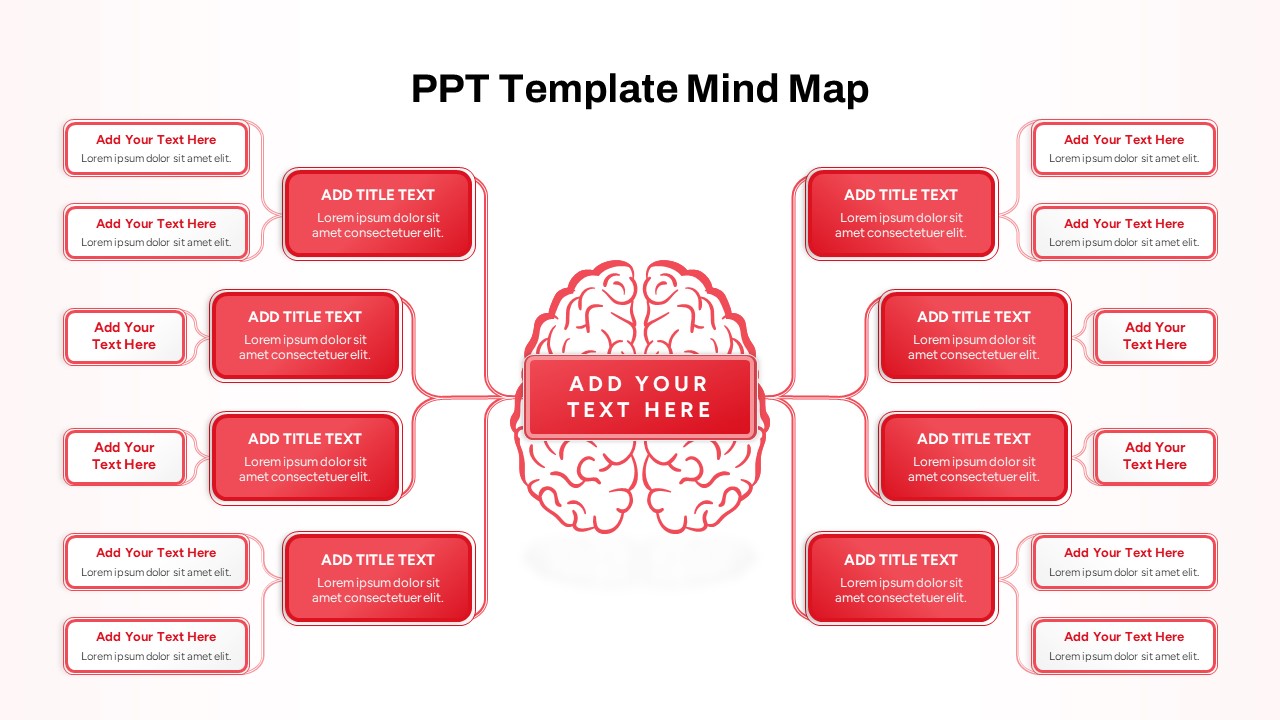
PPT Template Mind Map
Mind Map PowerPoint Template
Premium
-

Power Analogy Metaphor PowerPoint Template
Metaphor, Simile & Analogy
Premium
-
Multiple Line Chart PowerPoint Template
PowerPoint Charts
Premium
-

Biotechnology PowerPoint Presentation Template
PowerPoint Templates
Premium
-
4 Step Core Values PowerPoint Template
Business Models
Premium
-

Clustered Column Chart PowerPoint Template
PowerPoint Charts
Premium
-
Timeline Bar Chart PowerPoint
Column and Bar chart
Premium
-
Arrow Line Chart PowerPoint Template
Arrow Diagrams
Premium
-
Data Strategy Roadmap PowerPoint Template
PowerPoint Templates
Premium
-
Evolution Line Chart PowerPoint Template
PowerPoint Templates
Premium
-

Radial Bar Chart PowerPoint Templates and Keynote Slides
PowerPoint Charts
Premium
-

Animated Clustered Bar Chart PowerPoint Template
PowerPoint Charts
Premium
-
4 QUAD Chart PowerPoint Template
PowerPoint Charts
Premium
-
Jump Line Chart PowerPoint Template
Column and Bar chart
Premium
-
Clustered Bar Chart PowerPoint Template
Column and Bar chart
Premium
-
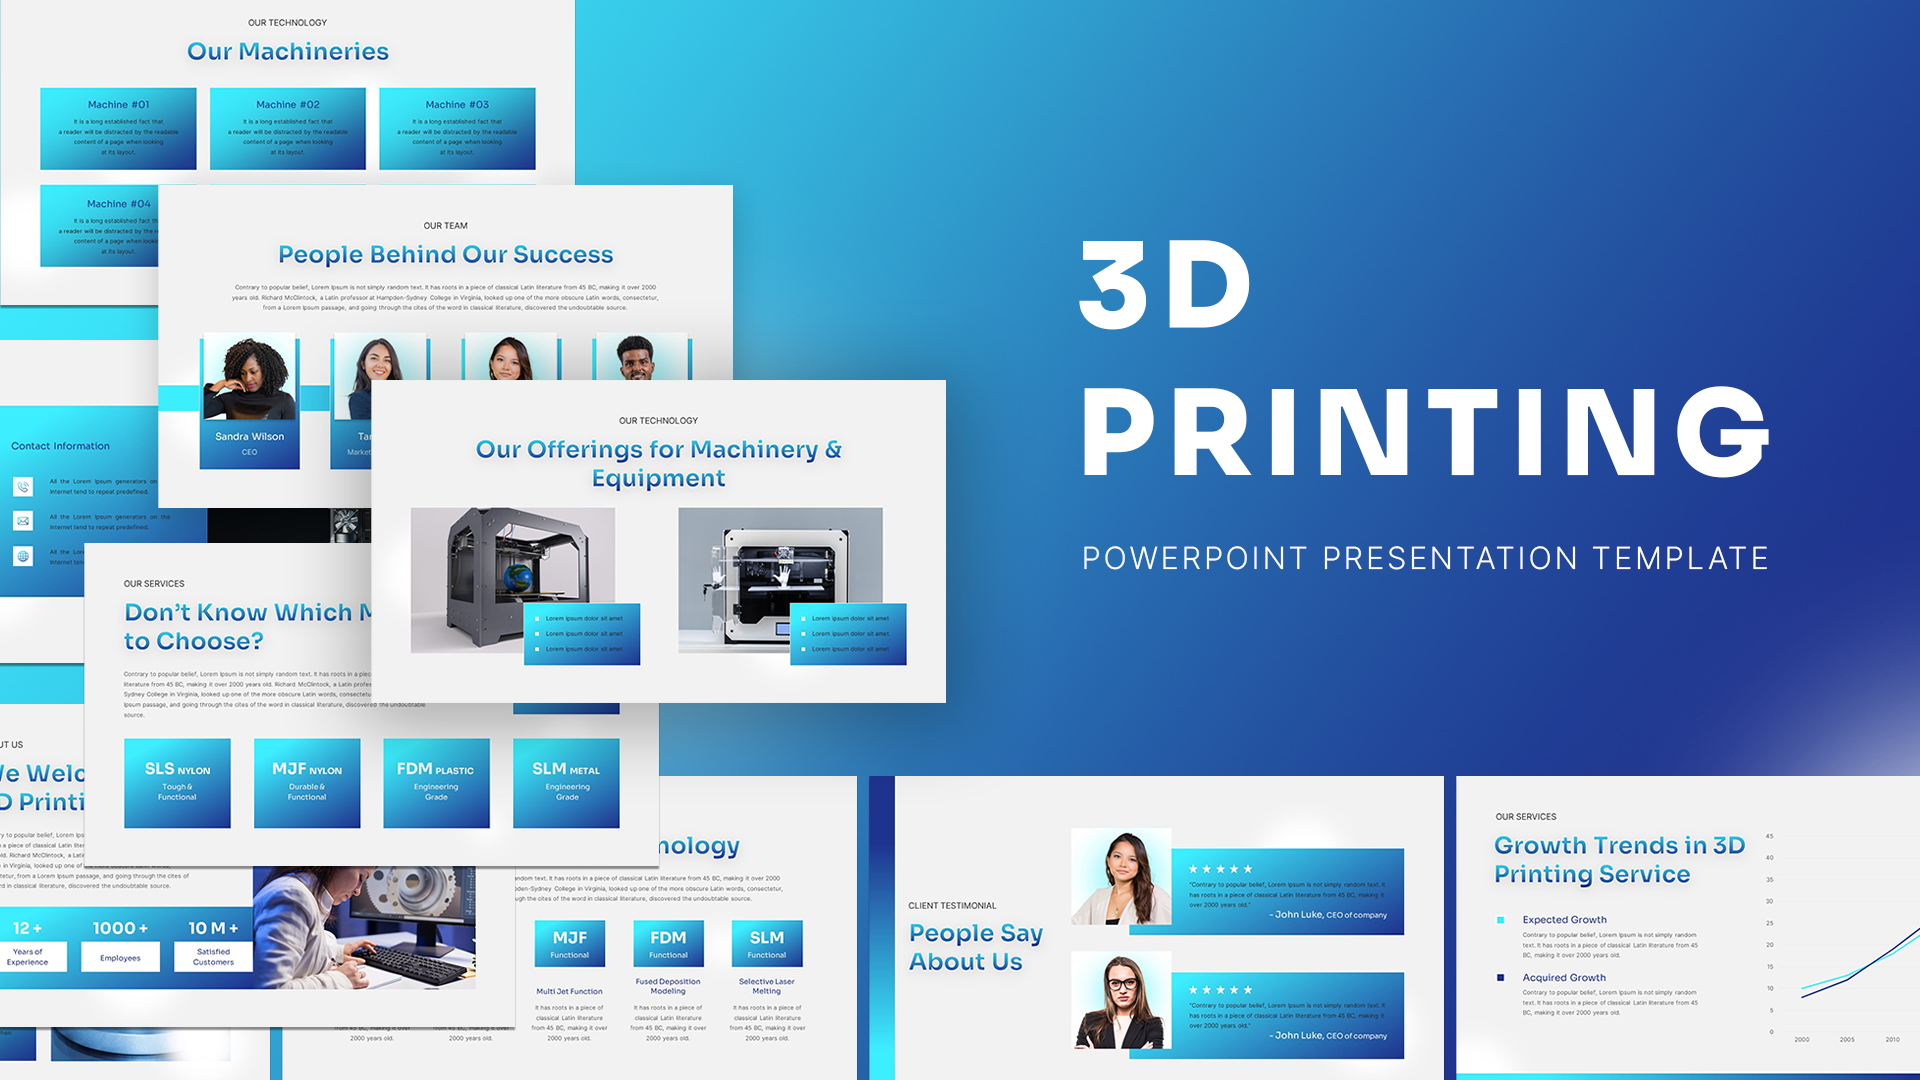
3D Printing Deck PowerPoint Template
PowerPoint Templates
Premium
-
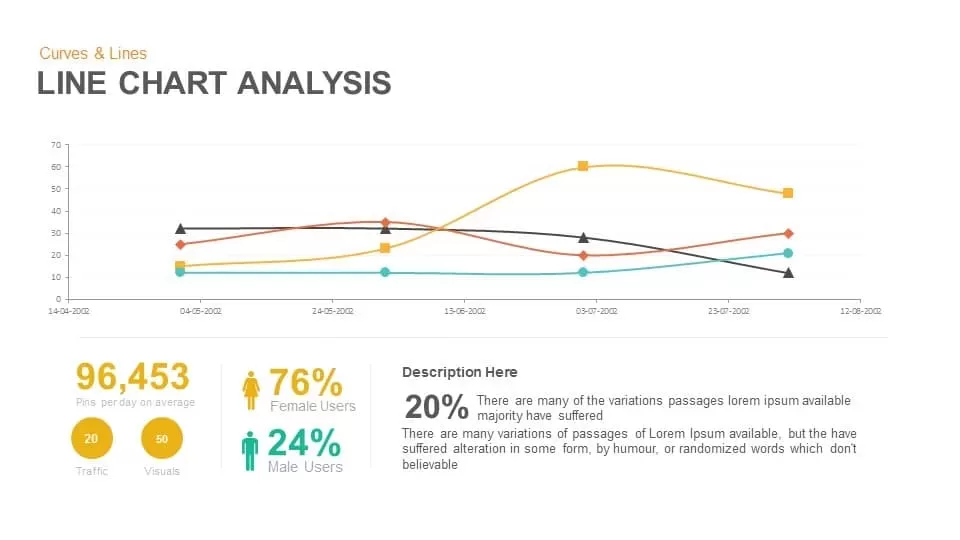
Line Chart Analysis PowerPoint Template and Keynote Slide
Curves and Lines
Premium
-
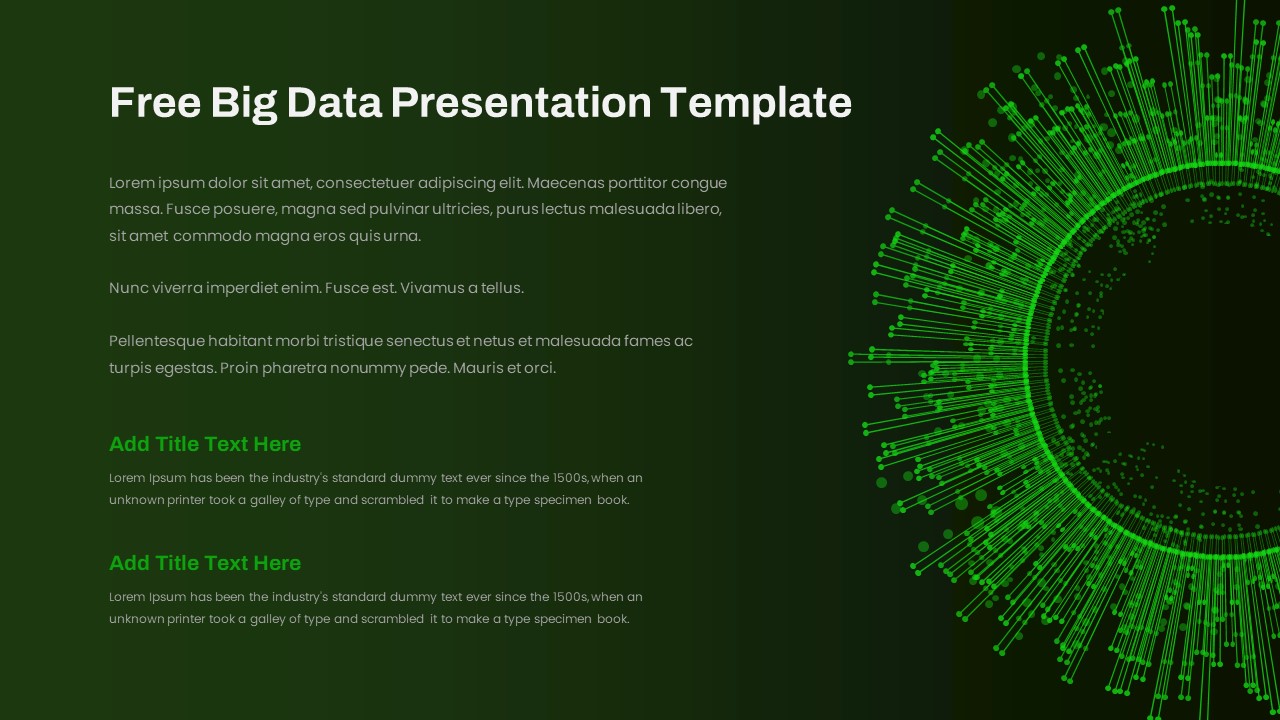
Free Big Data PowerPoint Template
PowerPoint Templates
Free
-

Combination Chart PowerPoint Template
PowerPoint Charts
Premium
-

Disaster Management Template
PowerPoint Templates
Premium
-
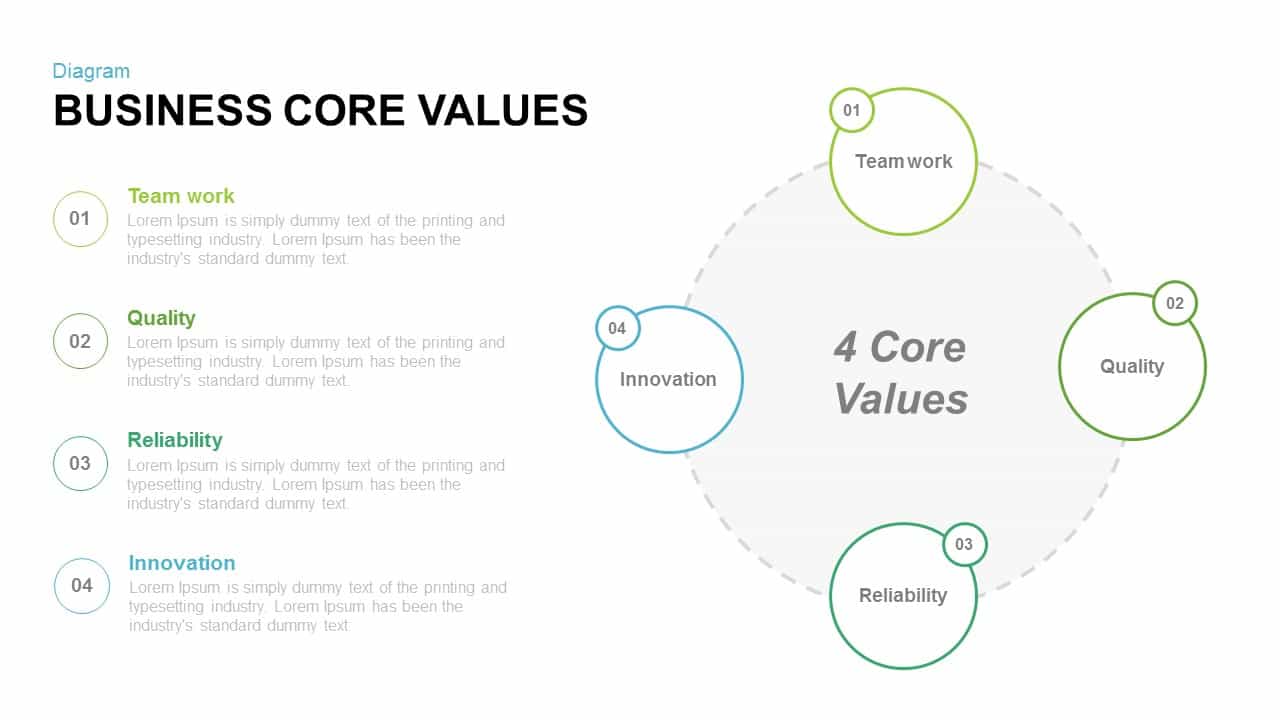
Business Core Values PowerPoint and Keynote template
Business Models
Premium
-

Multipurpose Business PowerPoint Template
PowerPoint Business Templates
Premium
-
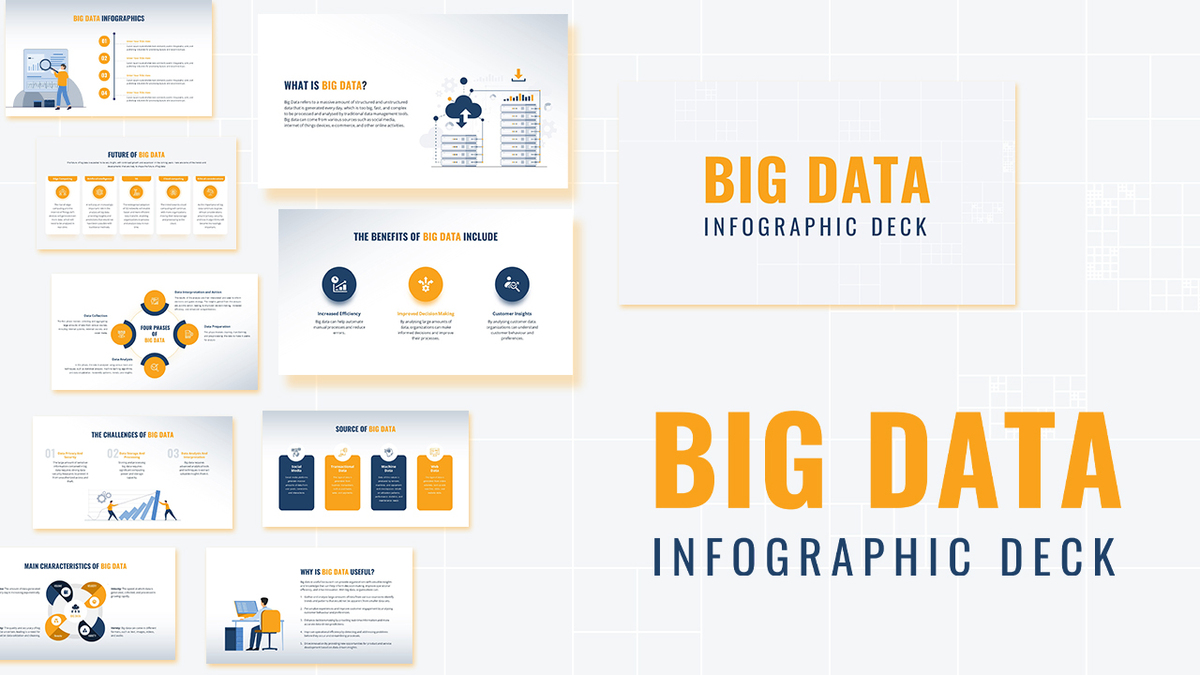
Big Data Infographic Deck For PowerPoint
PowerPoint Business Templates
Premium
-
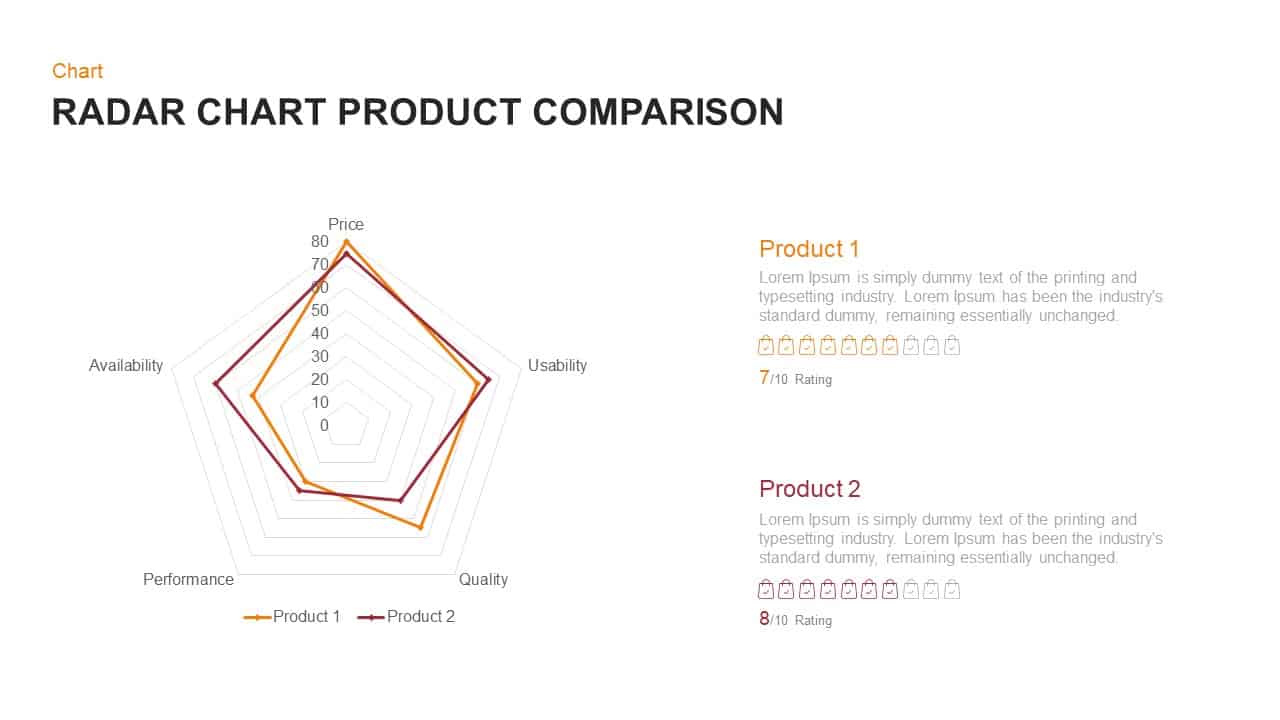
Radar Chart Product Comparison PowerPoint Template
Business Models
Premium
-
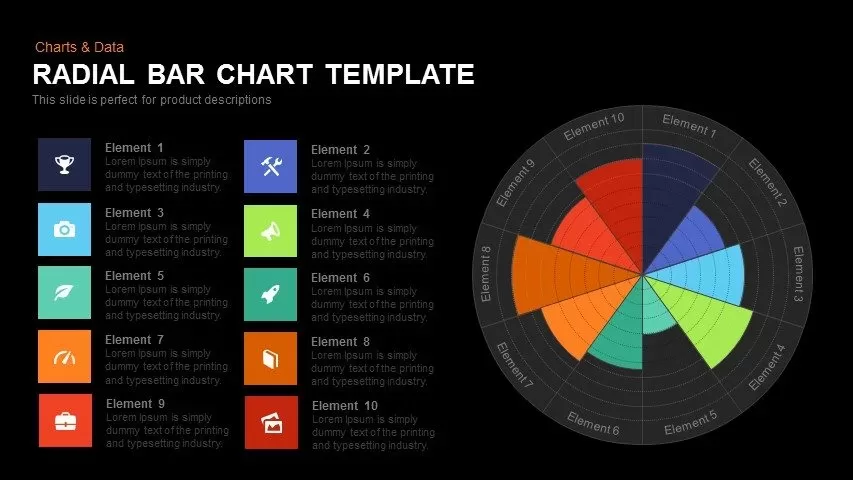
Radial Bar Chart Template for PowerPoint and Keynote
Circular Diagrams
Premium
-

Finance Consulting PowerPoint Template
PowerPoint Templates
Premium
-
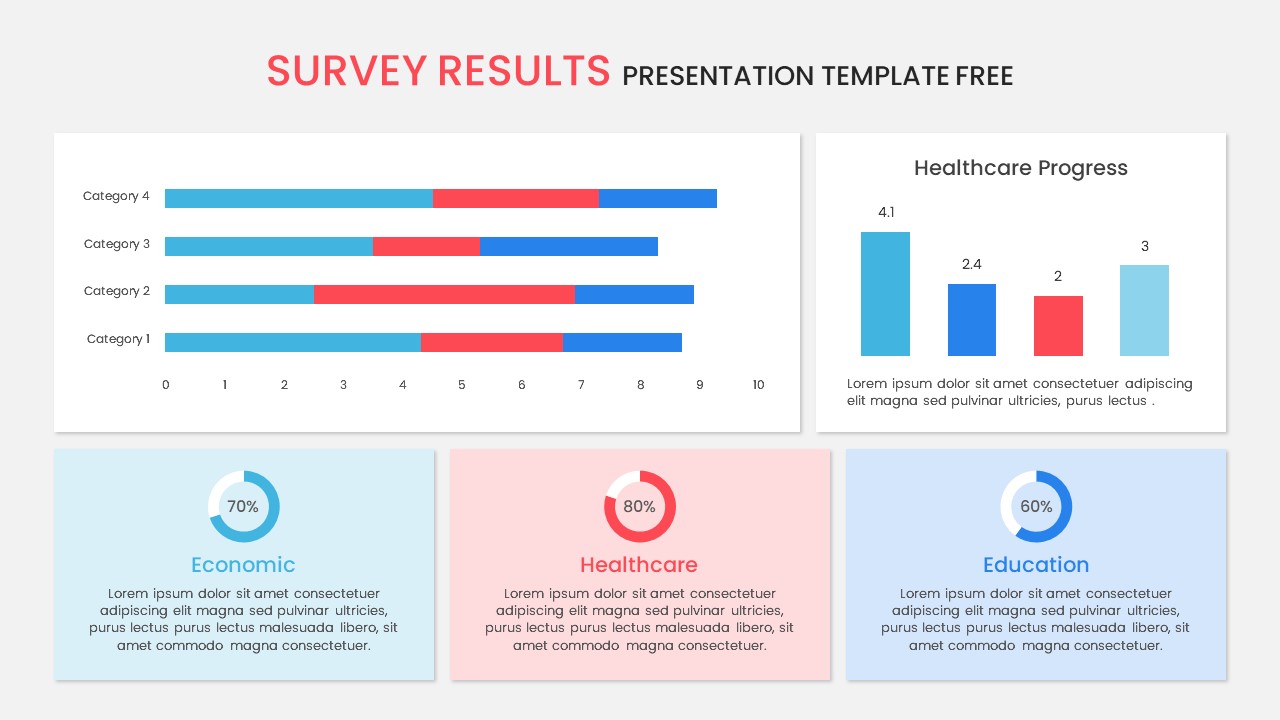
Survey Results PowerPoint Template Free
Free PowerPoint Templates
Free
-
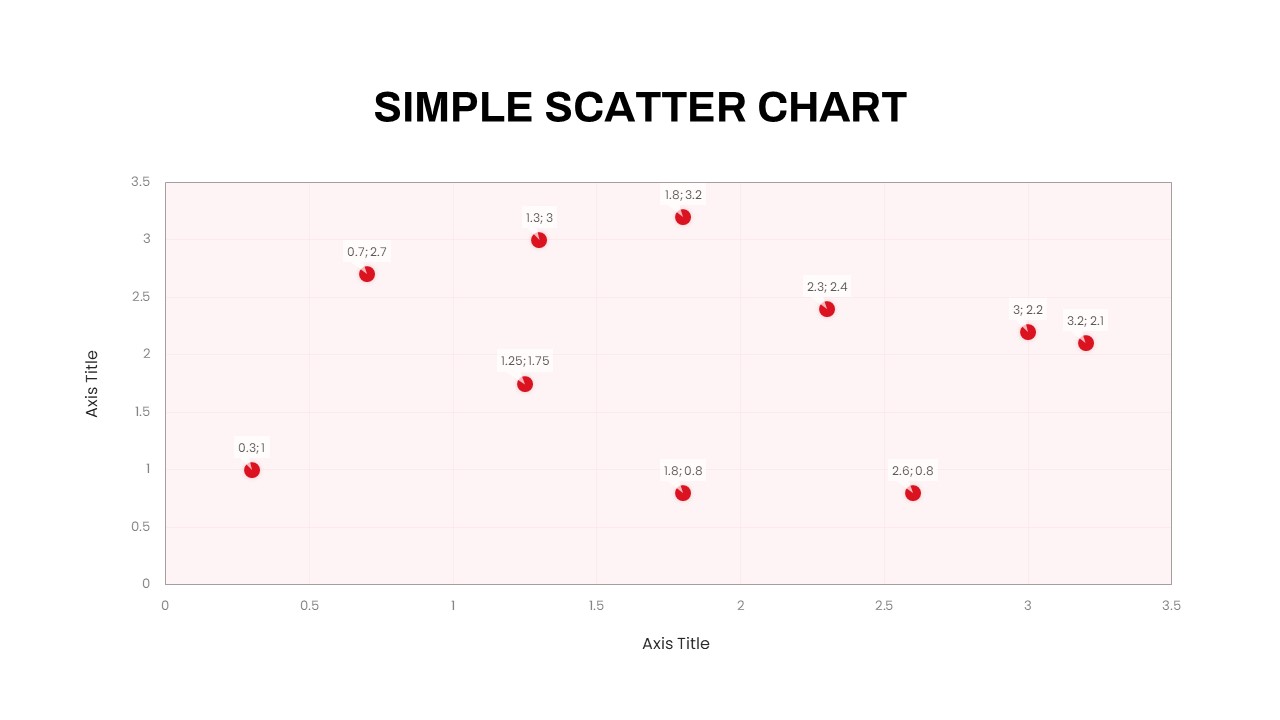
Simple Scatter Chart PowerPoint Template
PowerPoint Charts
Premium
-
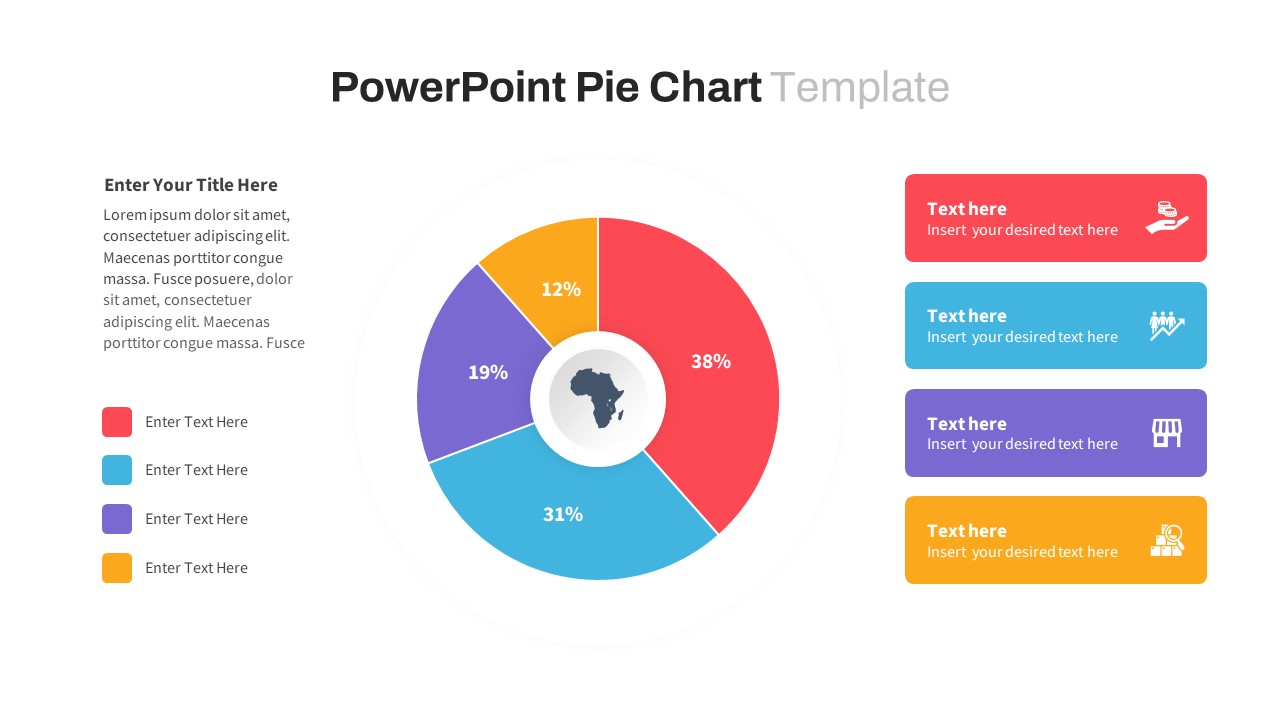
Pie Chart PowerPoint Template
Infographic
Premium
-
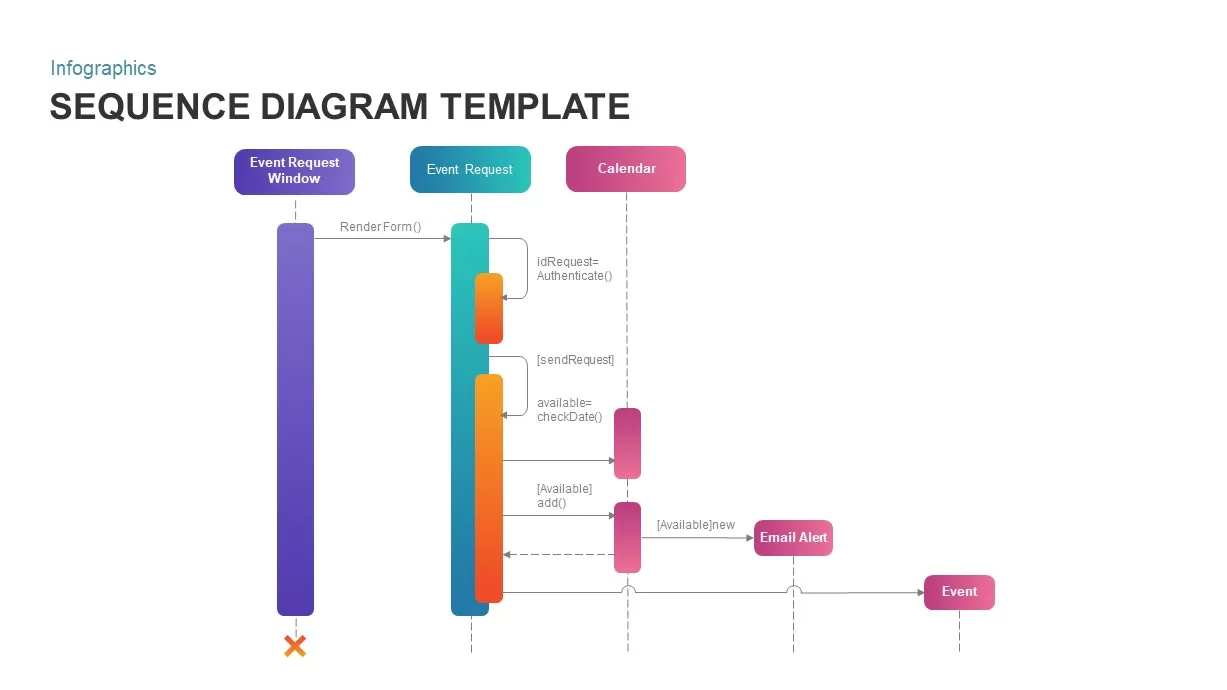
Sequence Diagram for PowerPoint Presentations
Diagrams
Premium
-
Waffle Chart PowerPoint Template
PowerPoint Templates
Premium
-
Kaizen Pick Chart PowerPoint Template
PowerPoint Templates
Premium
-
Multi level Donut Chart Template for PowerPoint and Keynote
PowerPoint Charts
Premium
-
Split Representation Donut Chart Template for PowerPoint and Keynote
Keynote Templates
Premium
-

Creative Studio PowerPoint Template
PowerPoint Business Templates
Premium
-

Pencil Bar Chart PowerPoint Template and Keynote Slide
Column and Bar chart
Premium
-
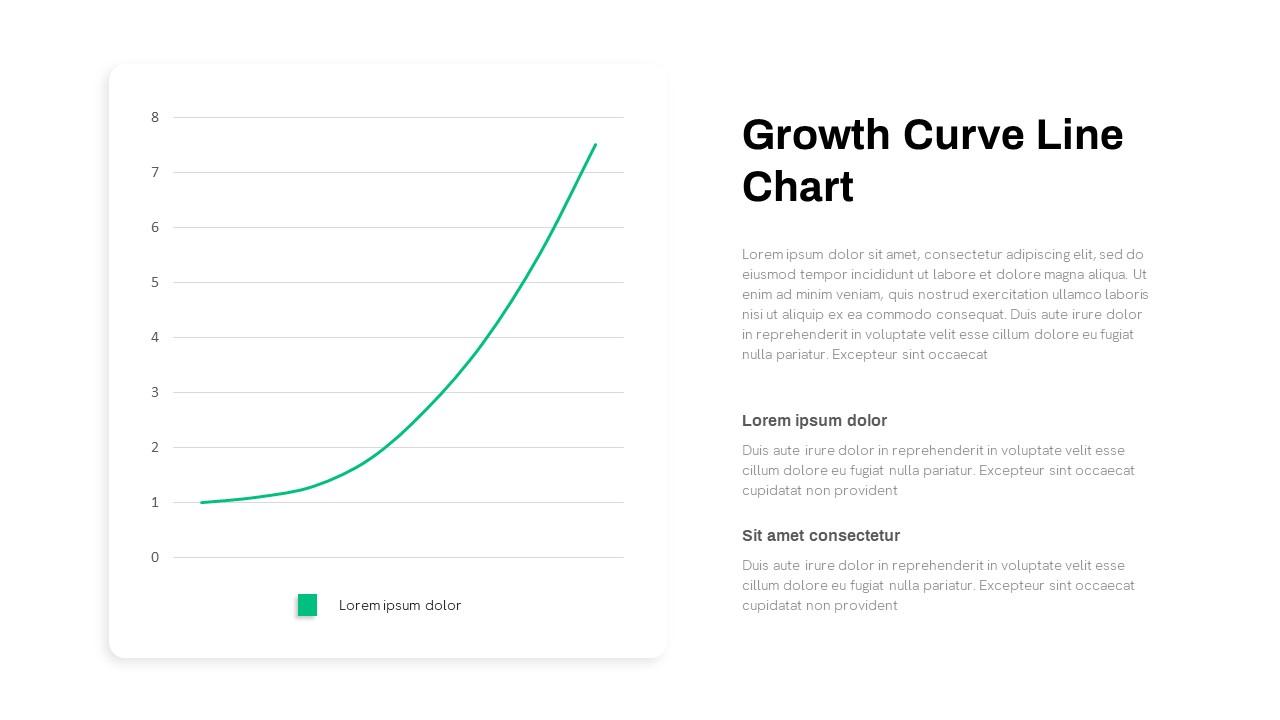
Growth Curve Line Chart PowerPoint Template
Curves and Lines
Premium
-
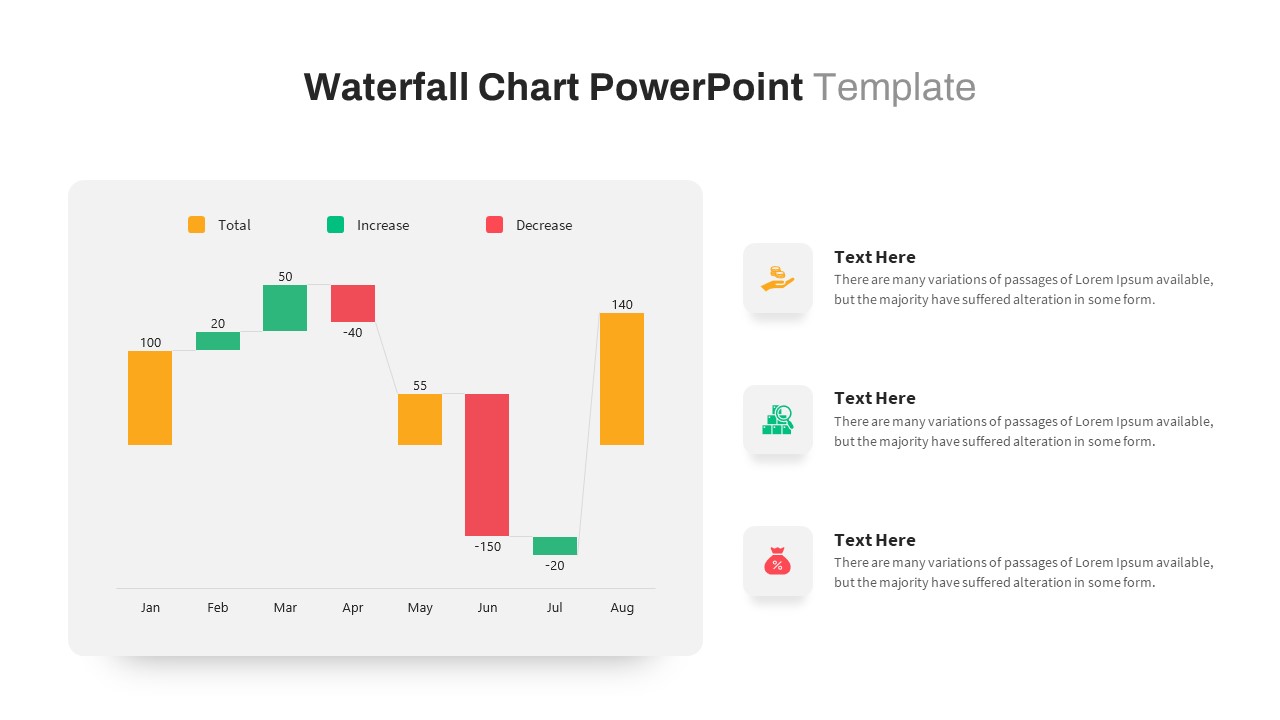
Waterfall Chart PowerPoint Template
PowerPoint Charts
Premium
-
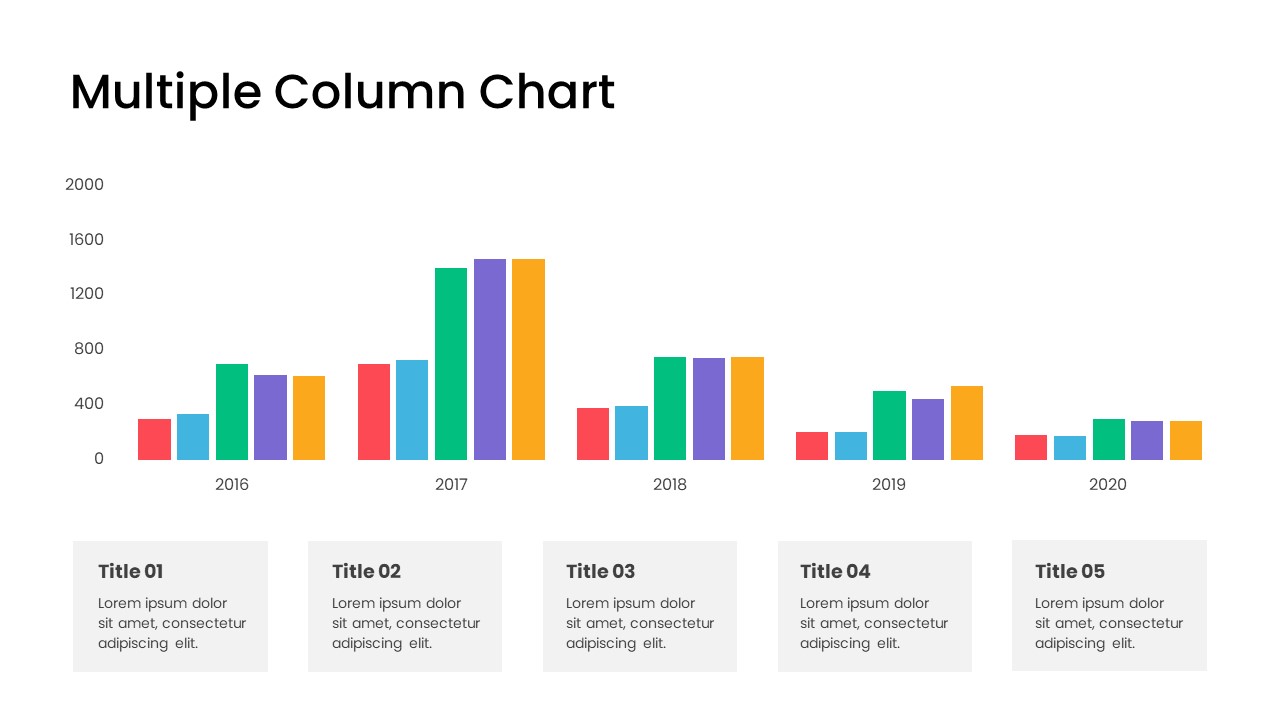
Multiple Column Chart PowerPoint Template
Column and Bar chart
Premium
-
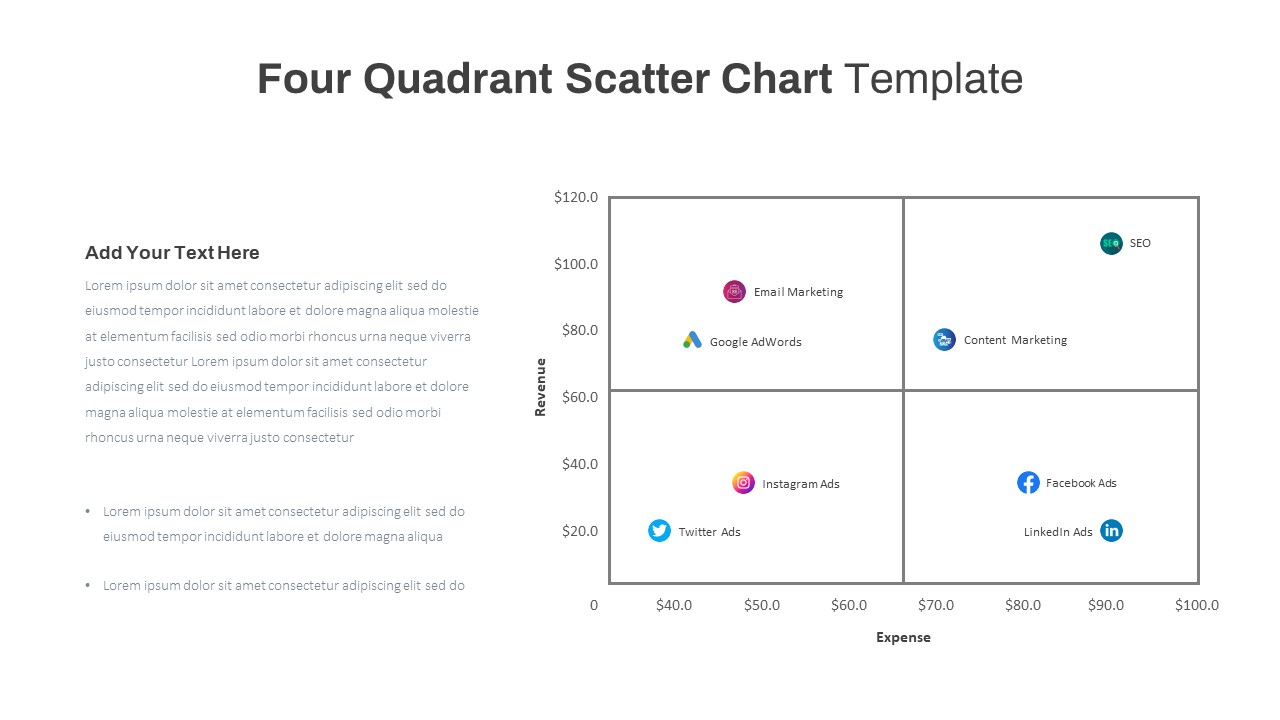
Four Quadrant Scatter Chart PowerPoint Template
PowerPoint Charts
Premium
-
DMAIC PowerPoint Template
Business Models
Premium
-
Population Pyramid Chart PowerPoint Template
PowerPoint Templates
Premium
-
Free KPI Dashboard PowerPoint Template
PowerPoint Templates
Free