


Rag Status Infographic Diagrams


- Version 1.0.0
- Download 75
- File Size 0.00 KB
- File Count 1
- Create Date February 20, 2022
- Last Updated December 9, 2022
Rag Status Infographic Diagrams
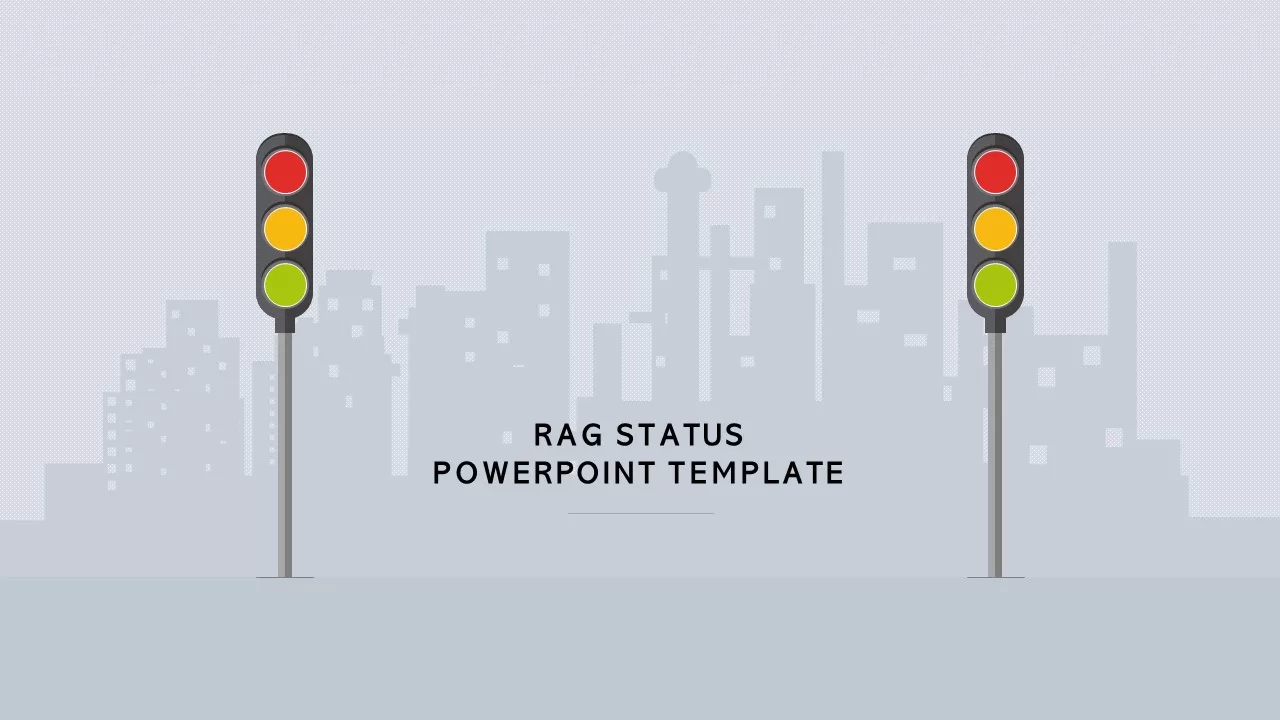
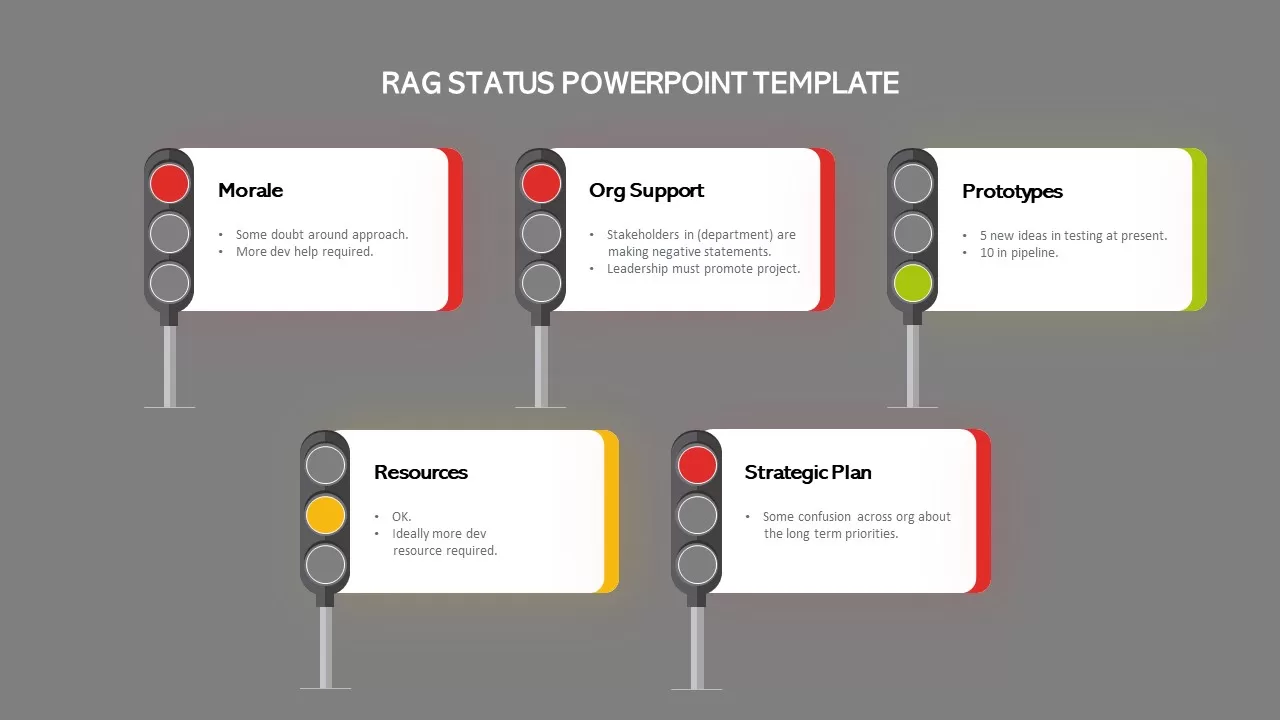
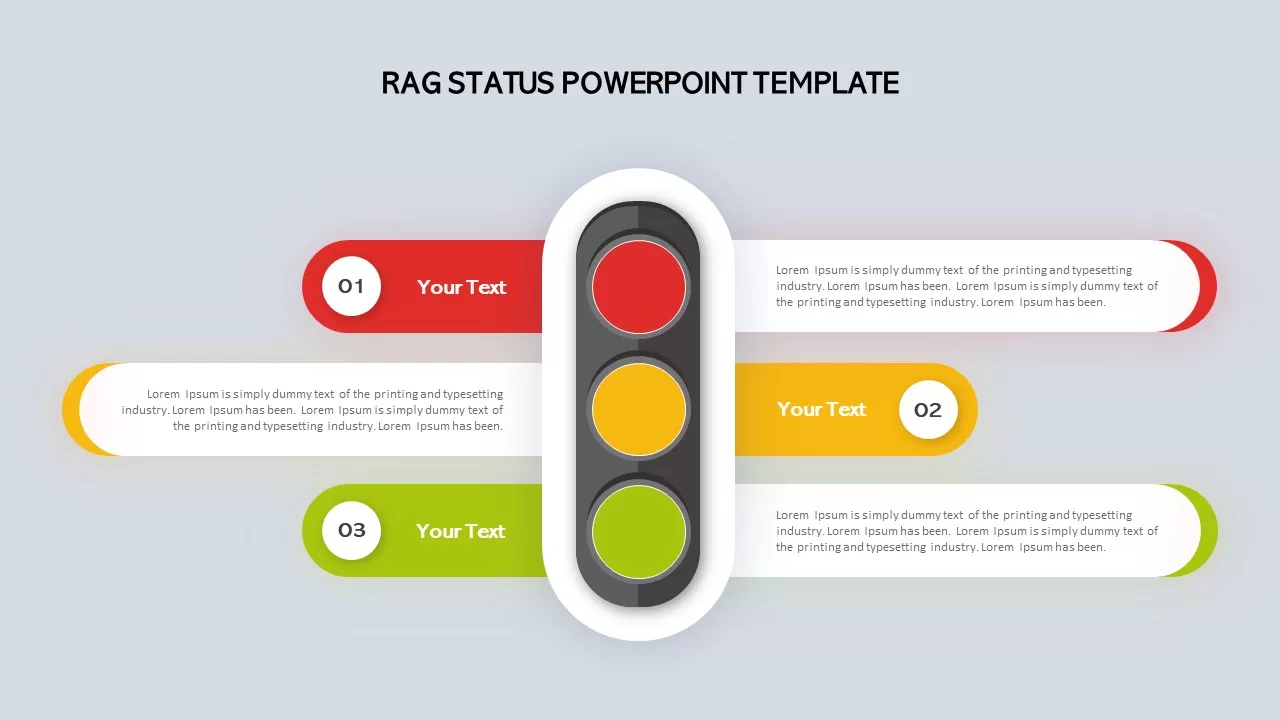
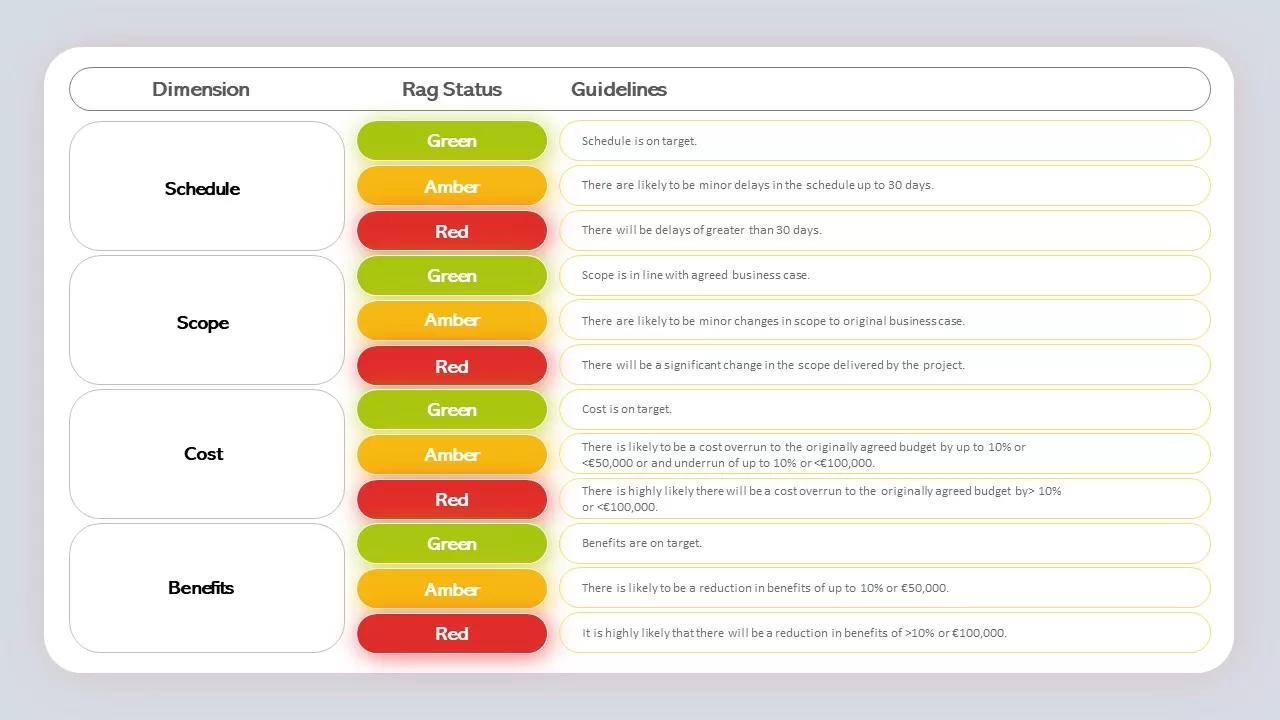
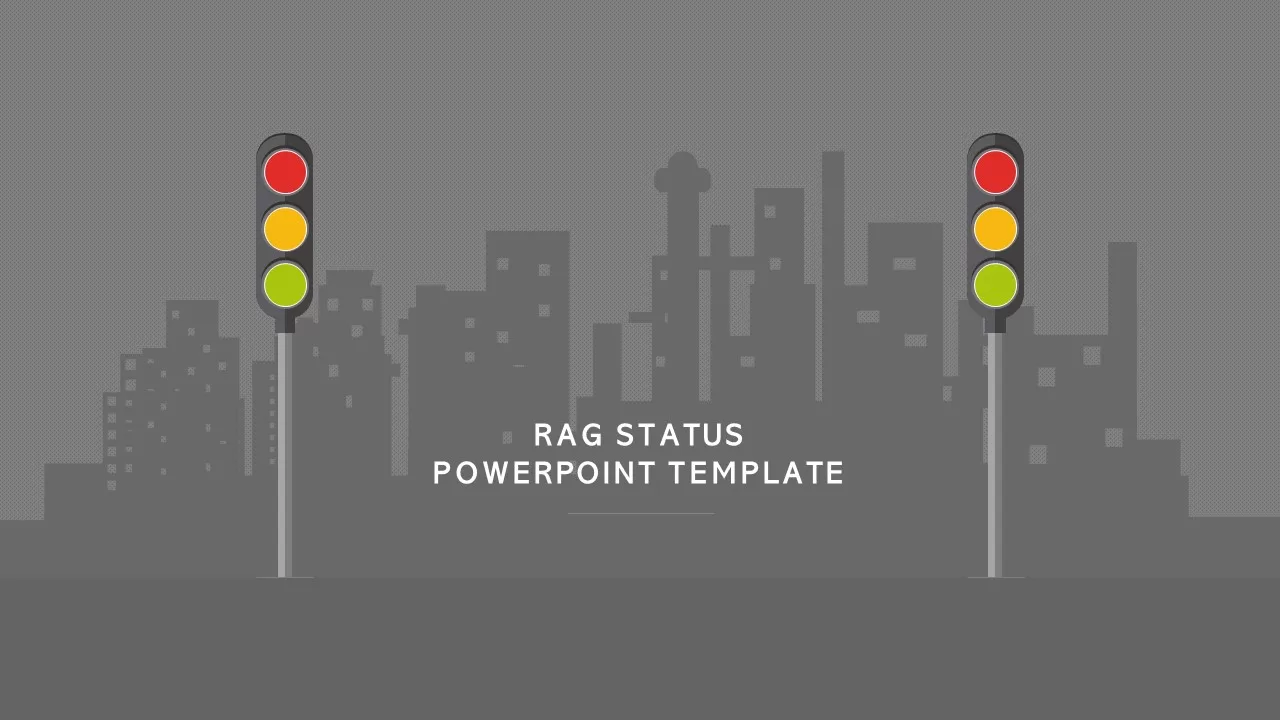
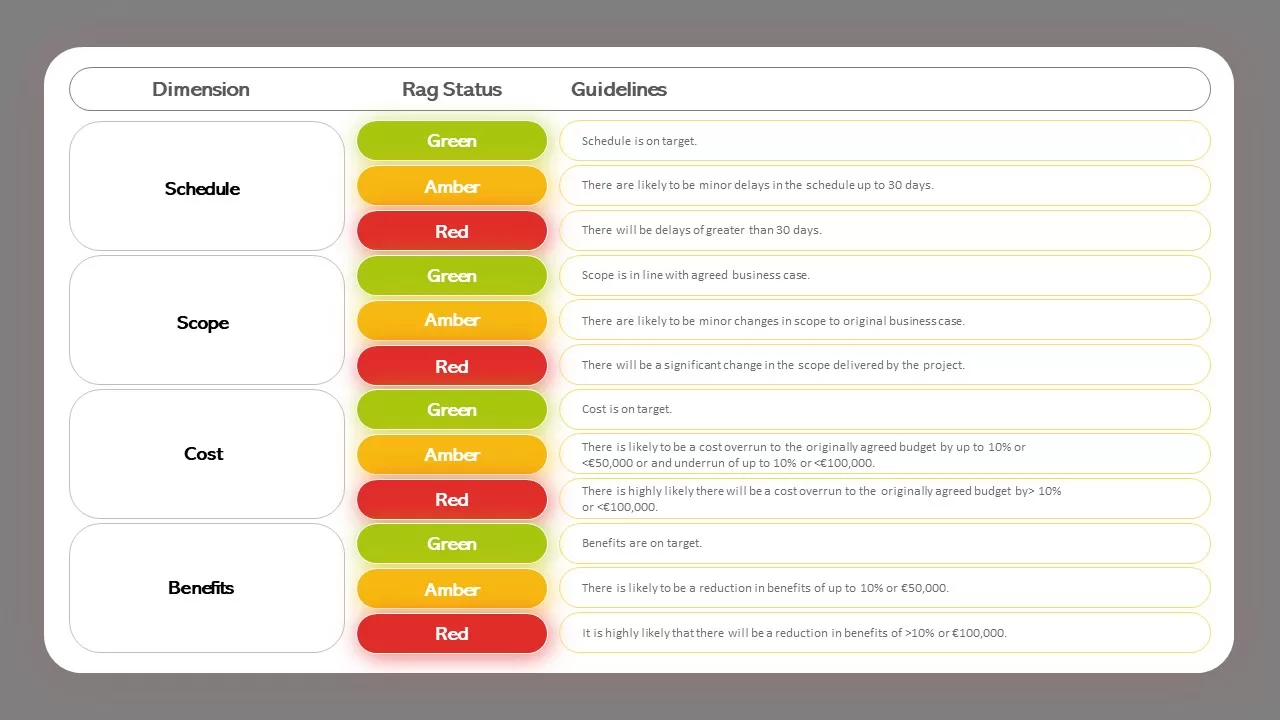
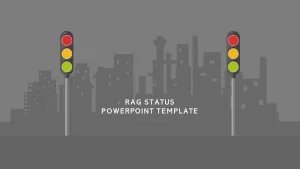
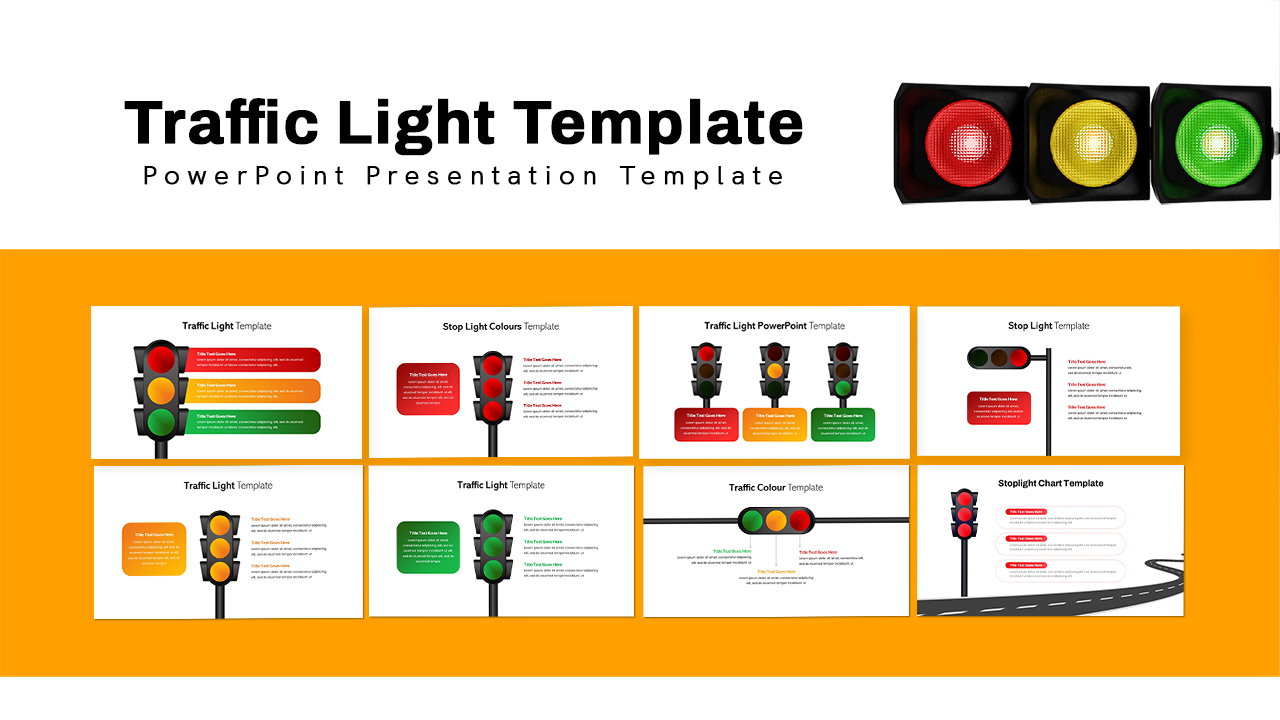
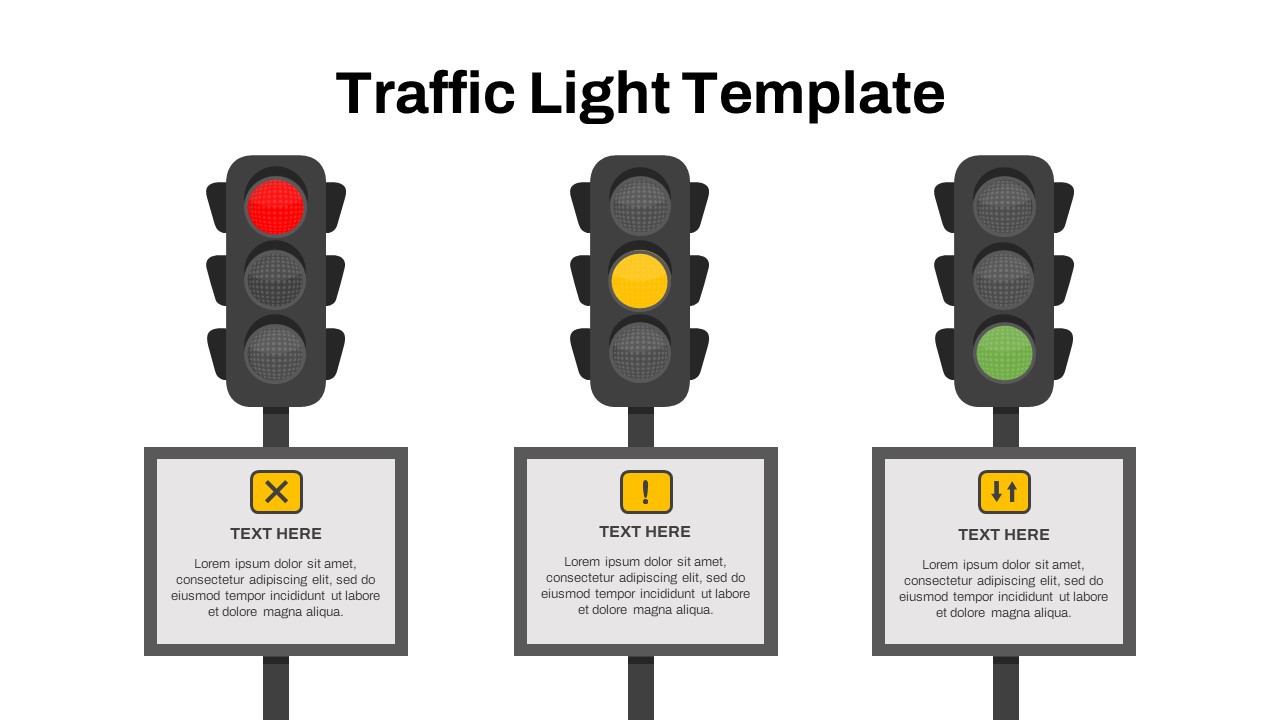
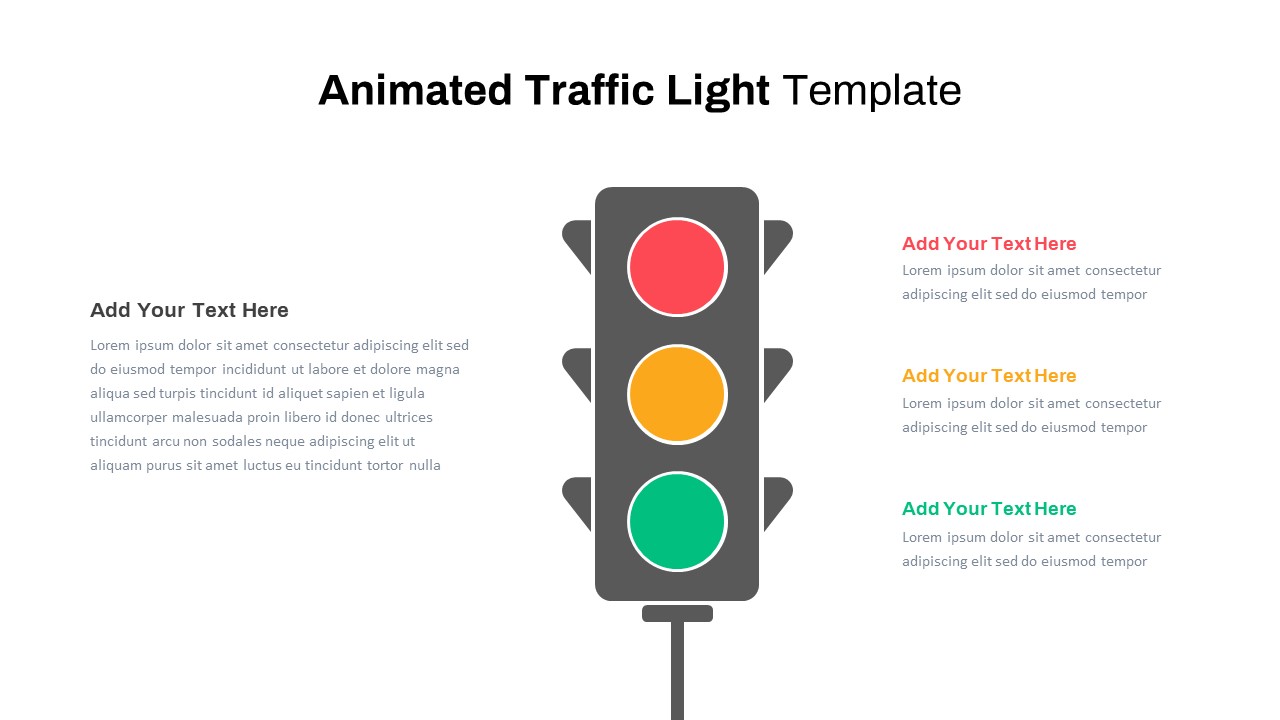
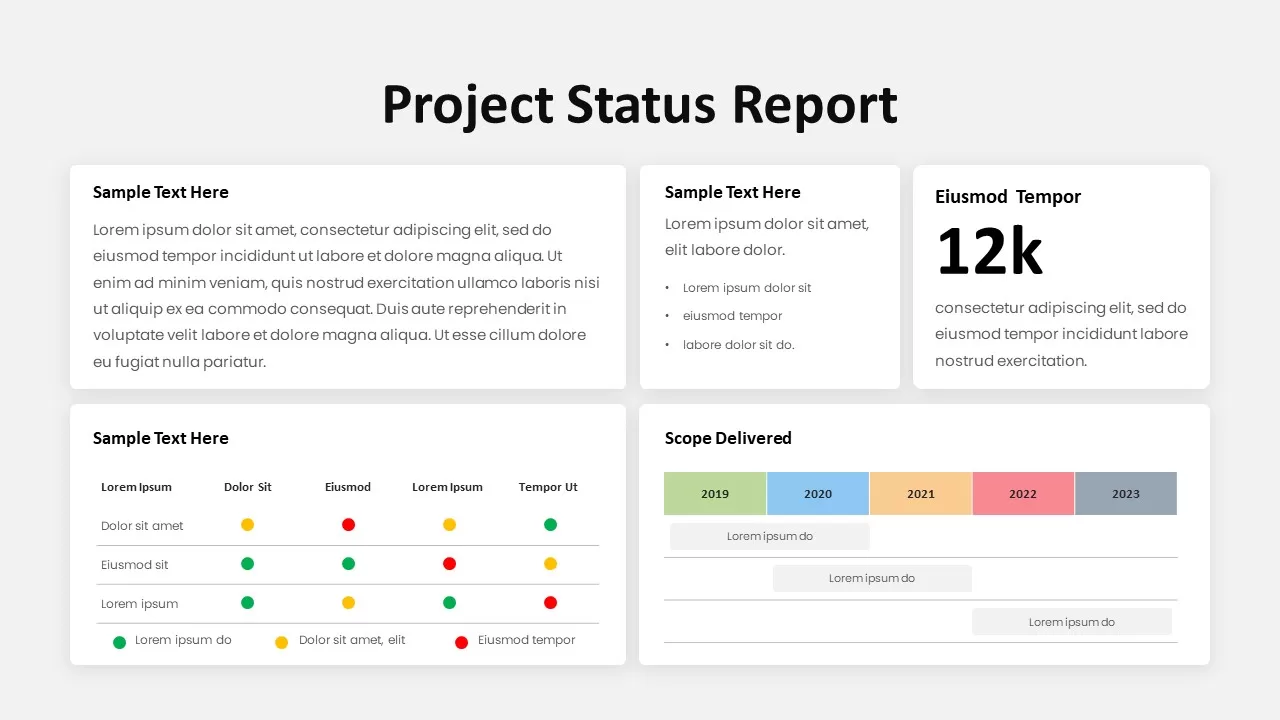
Rag status Infographic diagrams contain the typical symbolization of traffic lights to show project status. The template features all traffic lights, that is red to show stoplight or stop, amber to denote pause or slow down and green to show proceed or active. Red-Orange-Green or Red-Amber-Green or RAG are universal symbols to show stop, slow down and proceed.
Every day, project managers face dozens of decisions. One of the most important is how best to use resources to complete a project on time and within budget. Juggling schedules, deadlines, employee availability, and budgets can be difficult enough without factoring in extraneous variables like equipment breakdowns or material shortages. Inevitably, something will come up that requires a change in plan - but what's the best way to handle those changes?
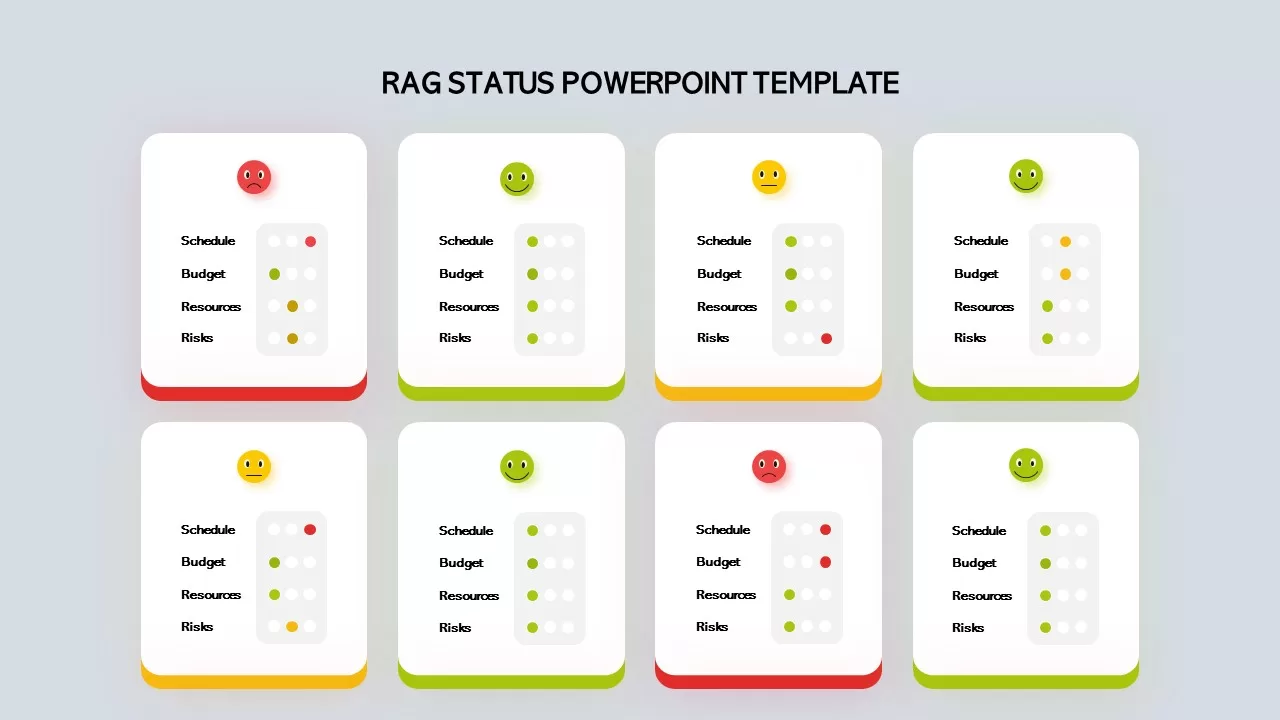
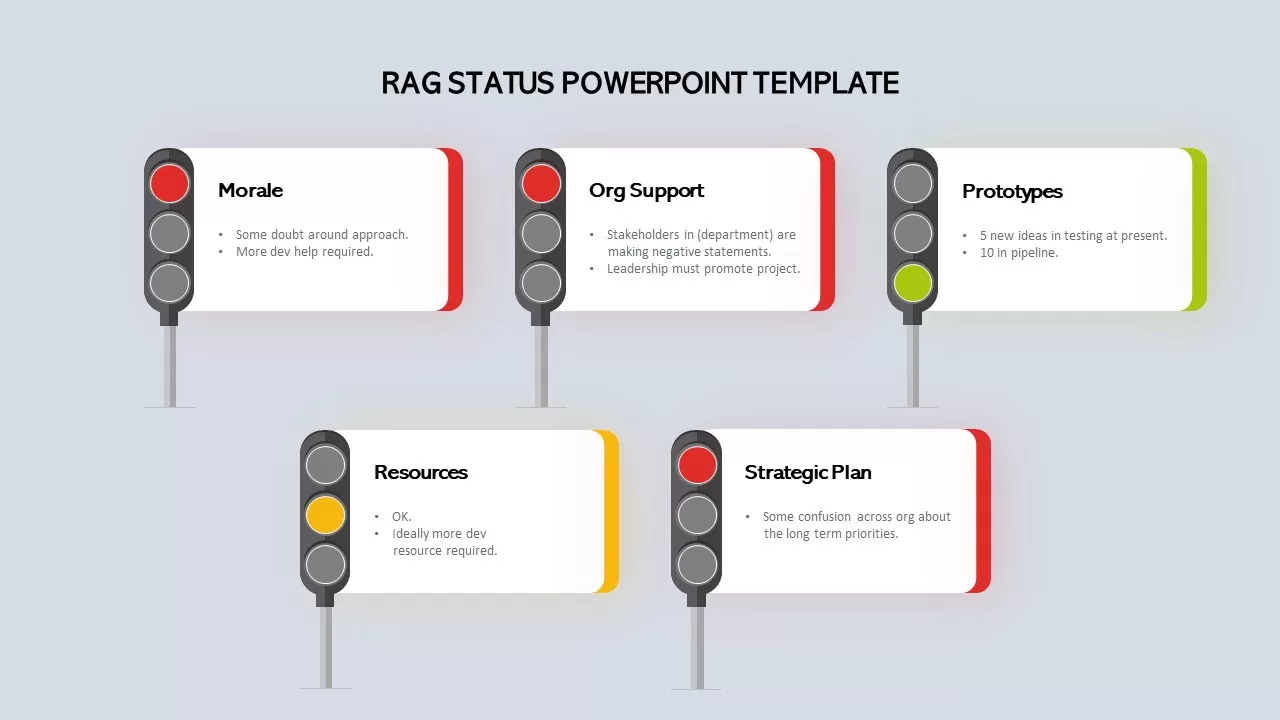
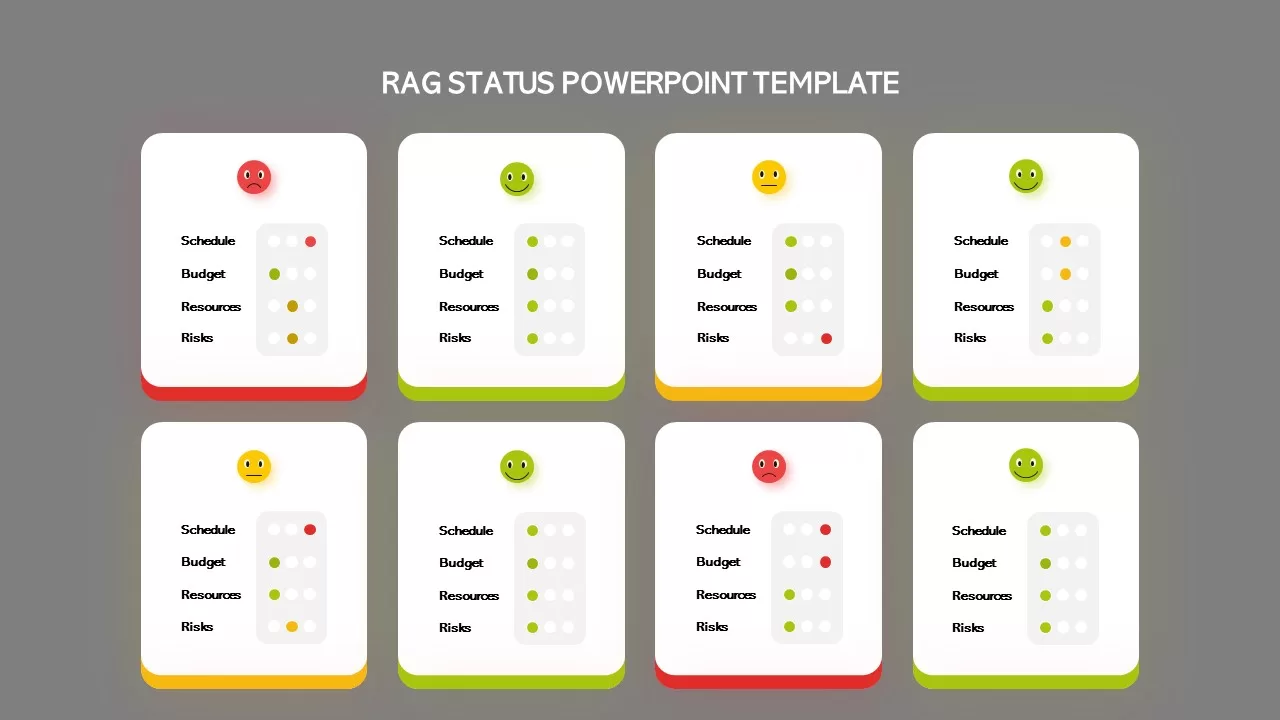
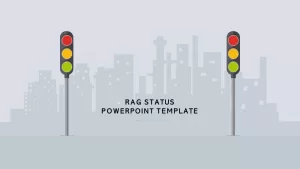
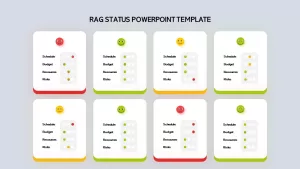
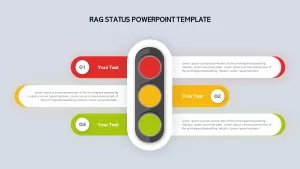
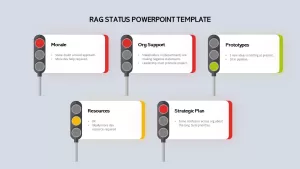
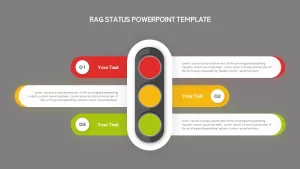
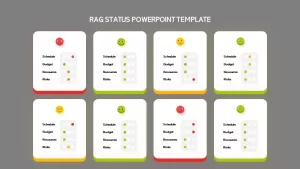
They are introducing our newest PowerPoint template, rag status. This template is perfect for businesses and organizations who want to show their sustainability initiatives visually appealing. With over five designs of different formats, you'll be able to showcase your work engagingly and professionally. The rag status project slide has a cover slide of traffic signals, timeline templates with five-step traffic light designs, emoji PowerPoint templates have traffic outlook, table PowerPoint with the different colour mix. Each template comes with light and background shadow that may help other presentations in a single PowerPoint creation.
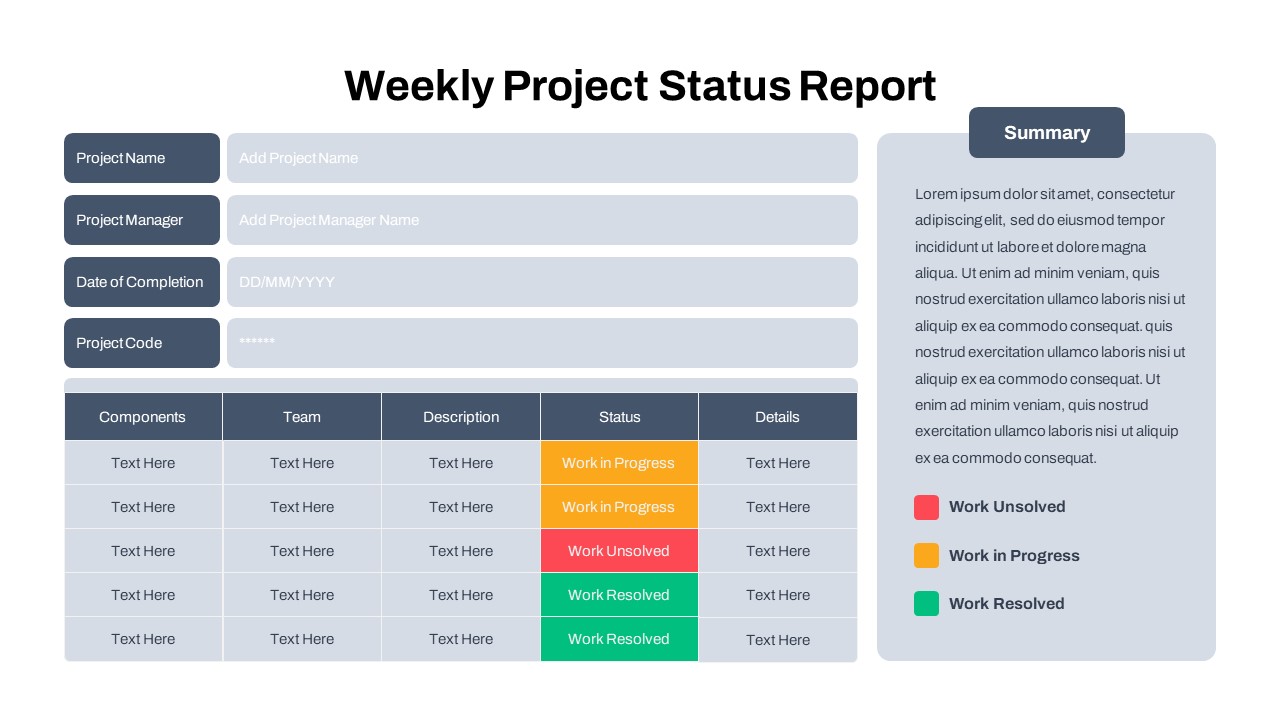
Rag status Infographic PowerPoint are the perfect way to present complex information in an easy-to-digest format. With their combination of images and text, they can help you quickly and clearly explain trends, processes, or ideas. Plus, their attractive visuals are more likely to capture your audience's attention than a dry block of text. So, if you need to make a point clearly and engagingly, infographic diagrams are the tool for you!
Attached Files
| File | Action |
|---|---|
| https://premiumdownloads.s3.amazonaws.com/SB02143-Rag Status PowerPoint Template.zip | Download |
Login to download this file
Add to favorites
Add to collection
-

Item ID
SB02143 -

Related Templates
-
Traffic Lights Template
Metaphor, Simile & Analogy
Premium
-
Free Traffic Light PowerPoint Template
Free PowerPoint Templates
Free
-
Free Weekly Status Report PowerPoint Template
PowerPoint Templates
Free
-
Free Road Street Sign PowerPoint Template
PowerPoint Templates
Free
-
Animated Traffic Light PowerPoint Template
Metaphor, Simile & Analogy
Premium
-
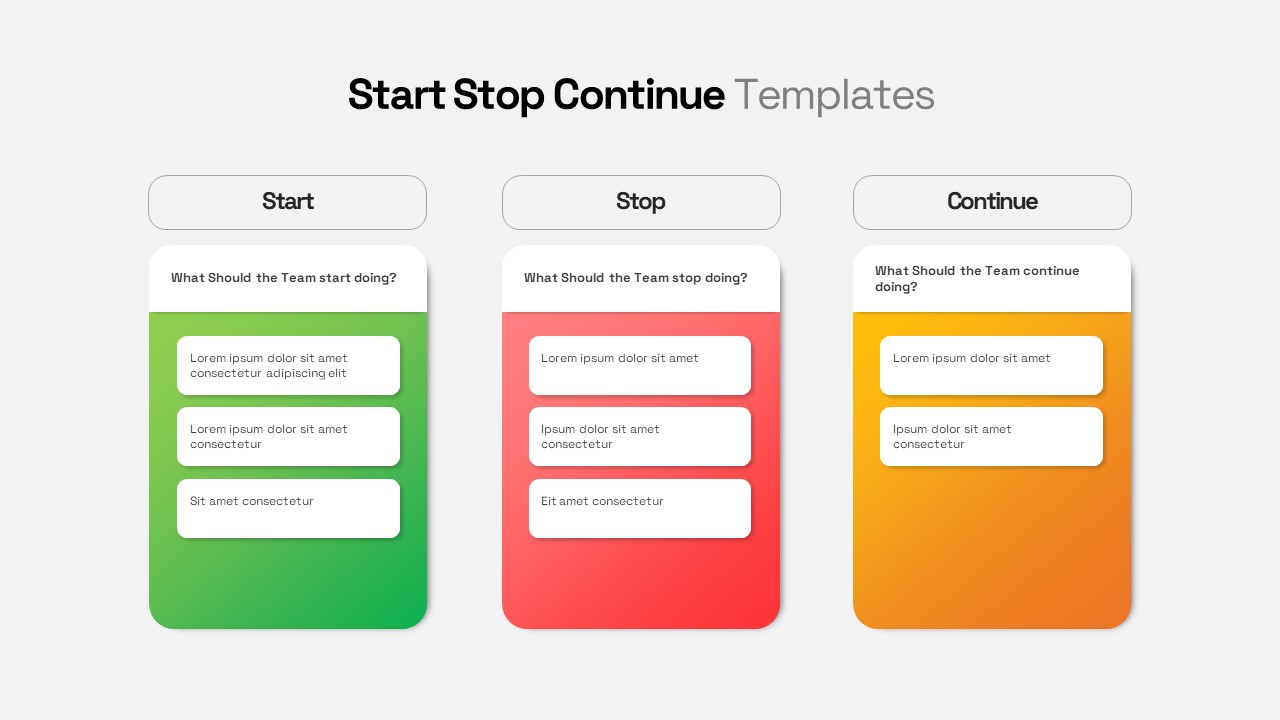
Start Stop Continue Templates
Metaphor, Simile & Analogy
Premium
-
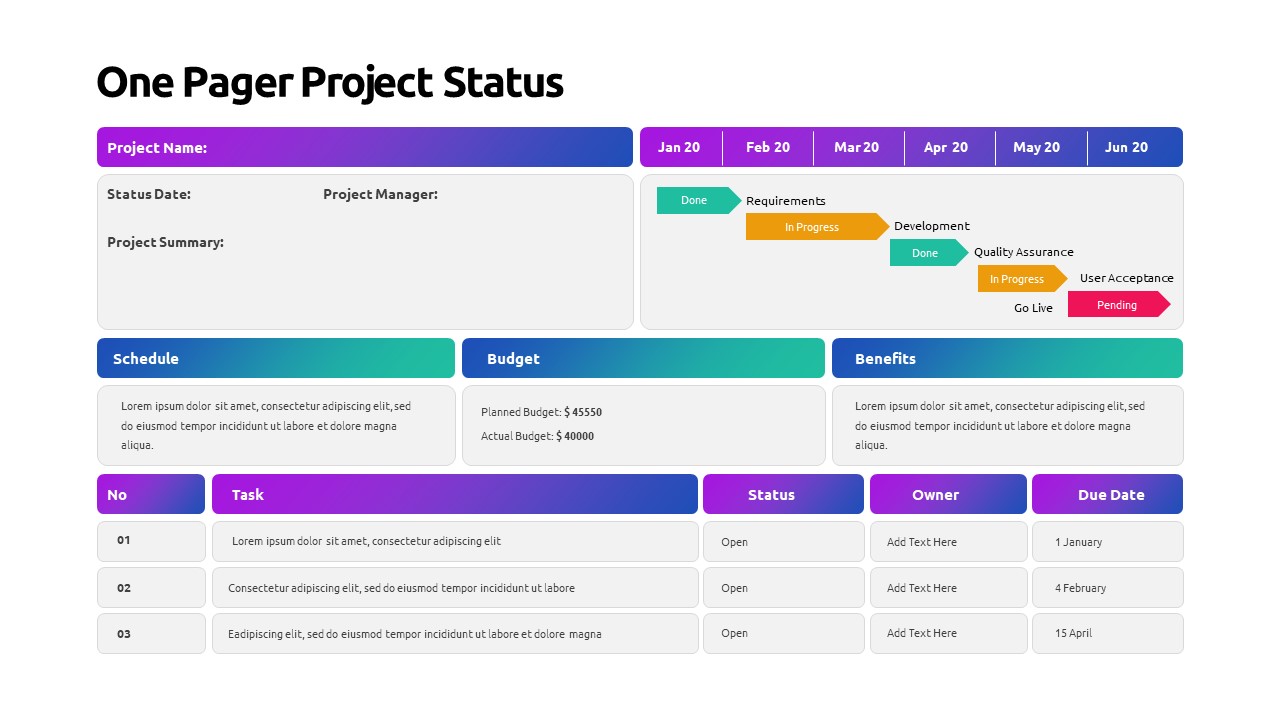
One Pager Project Status PowerPoint Template
PowerPoint Templates
Premium
-
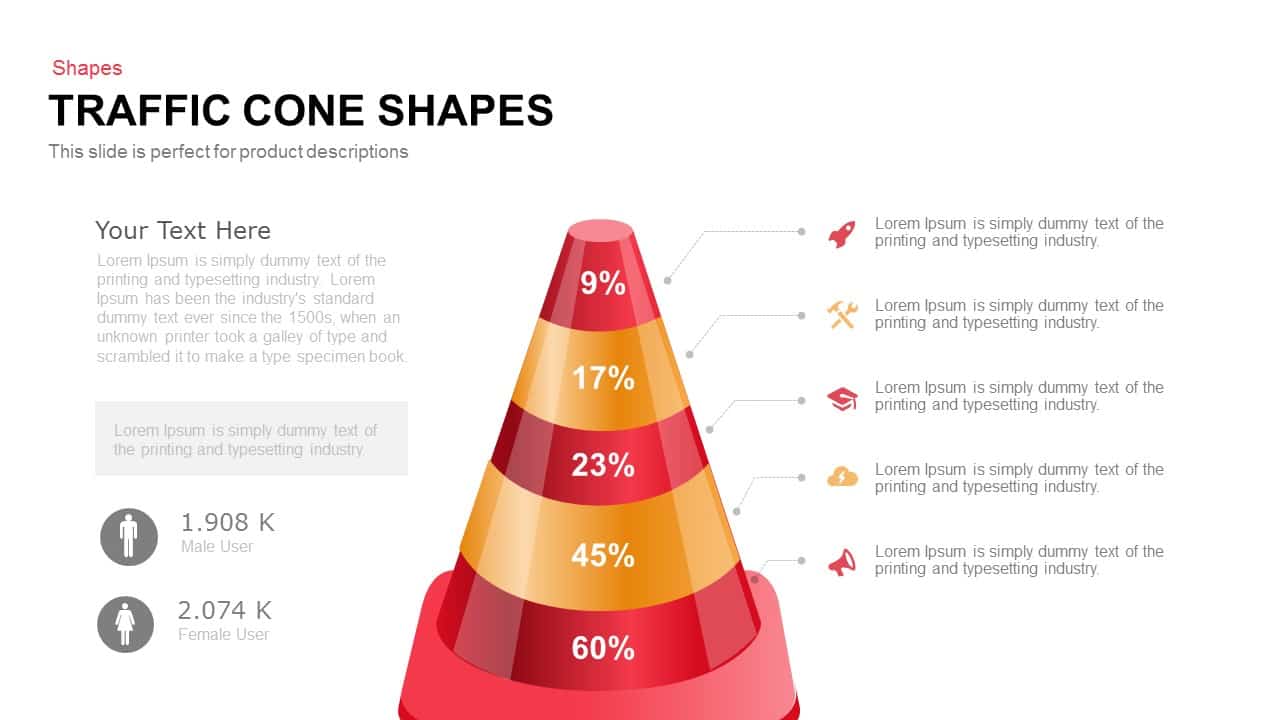
Traffic Cone Shapes Template for PowerPoint and Keynote
Infographic
Premium
-
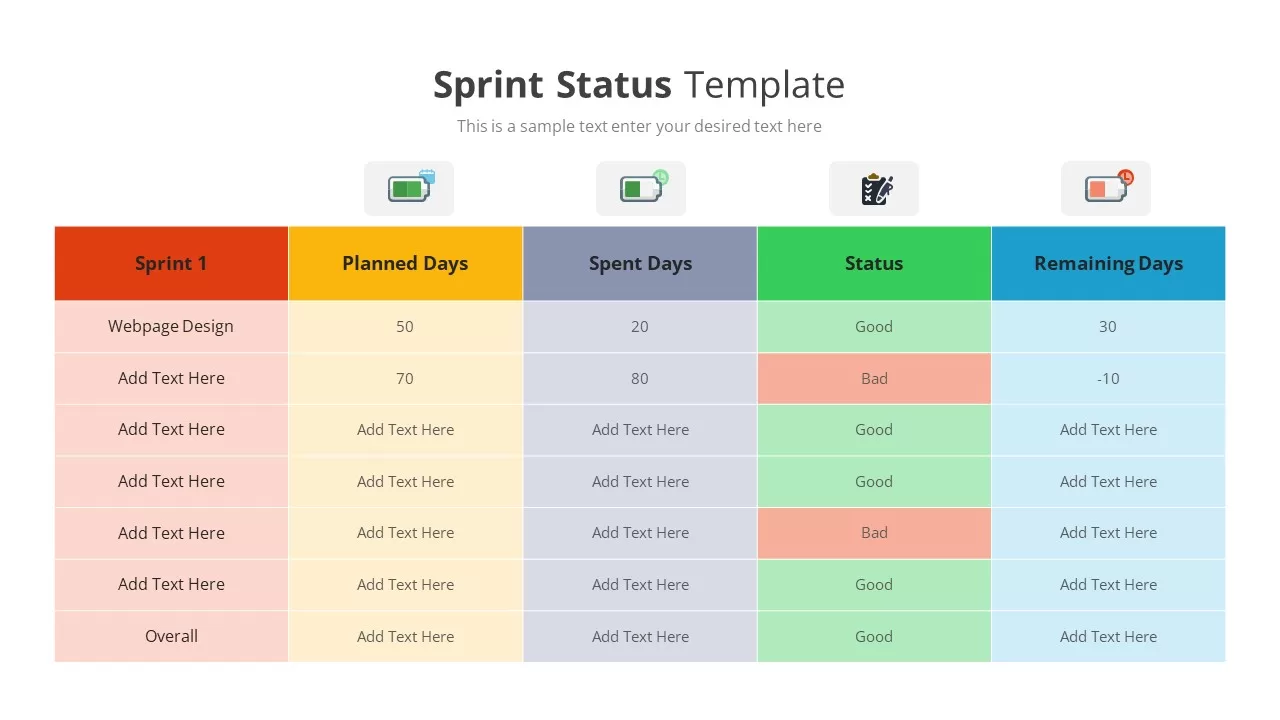
Sprint Status Template
Text and Table
Premium
-
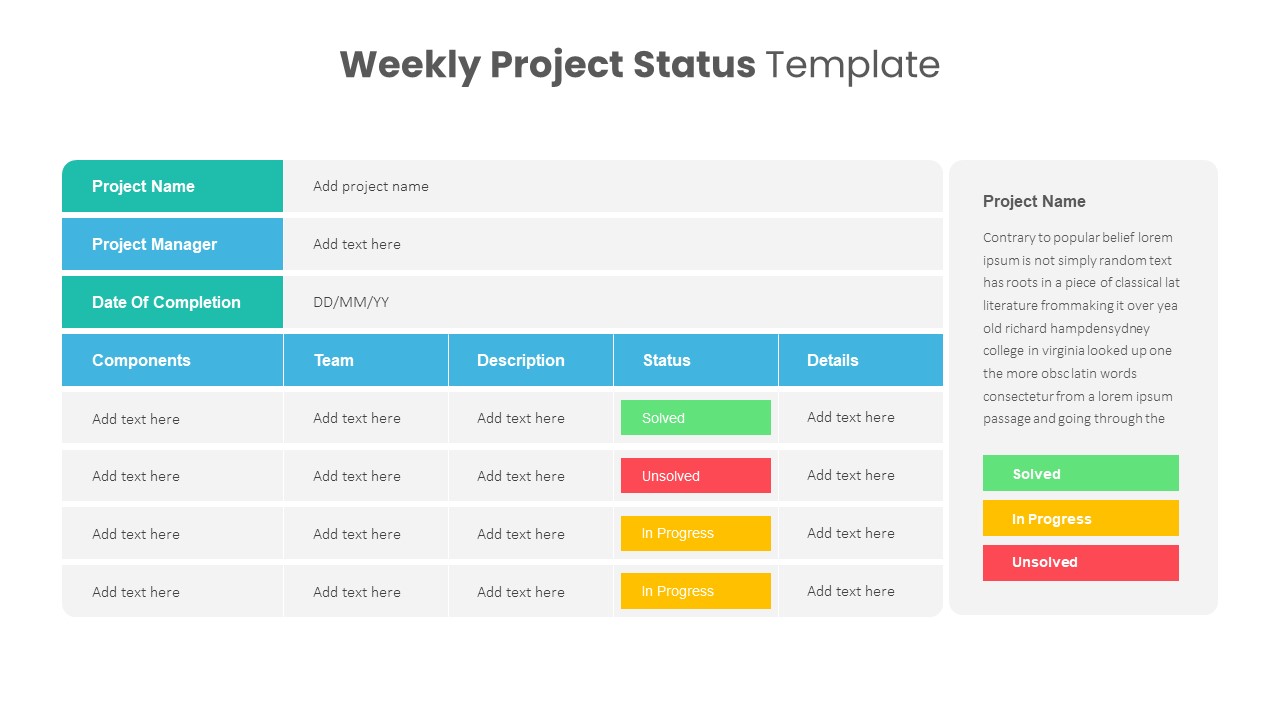
Weekly Project Status Template
PowerPoint Templates
Premium
-
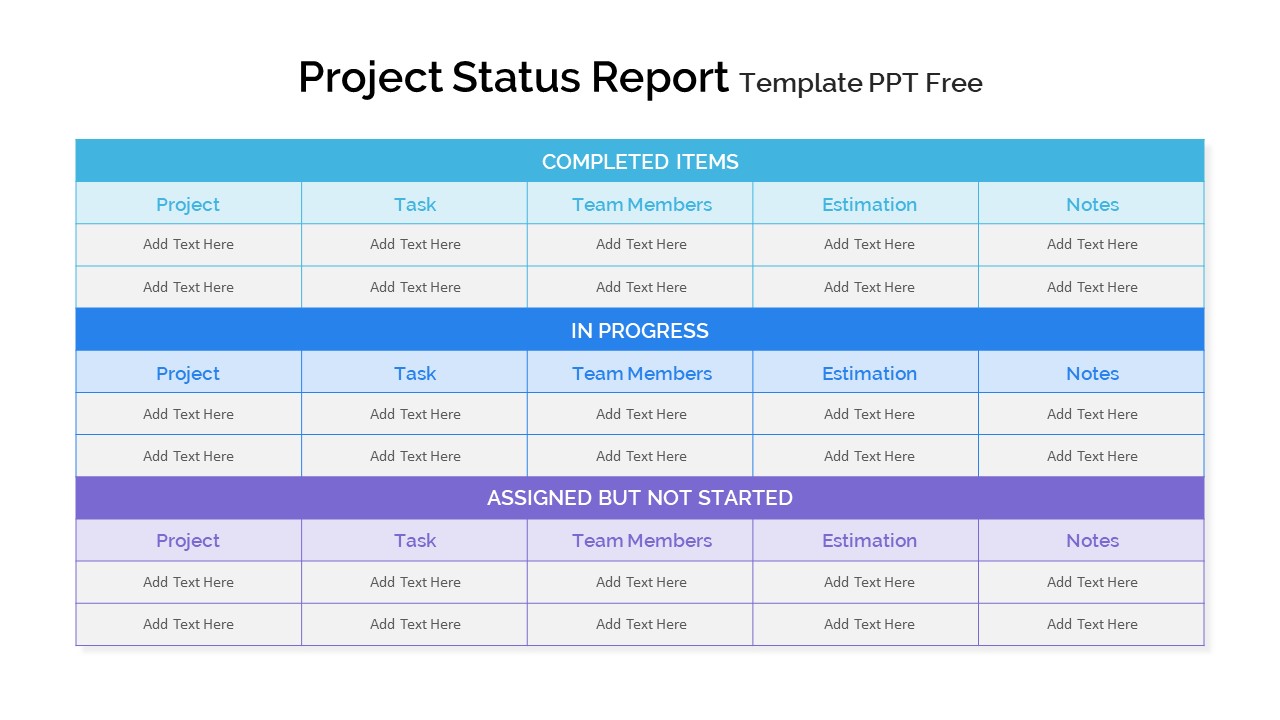
Project Status Report PowerPoint Template Free
PowerPoint Templates
Free
-
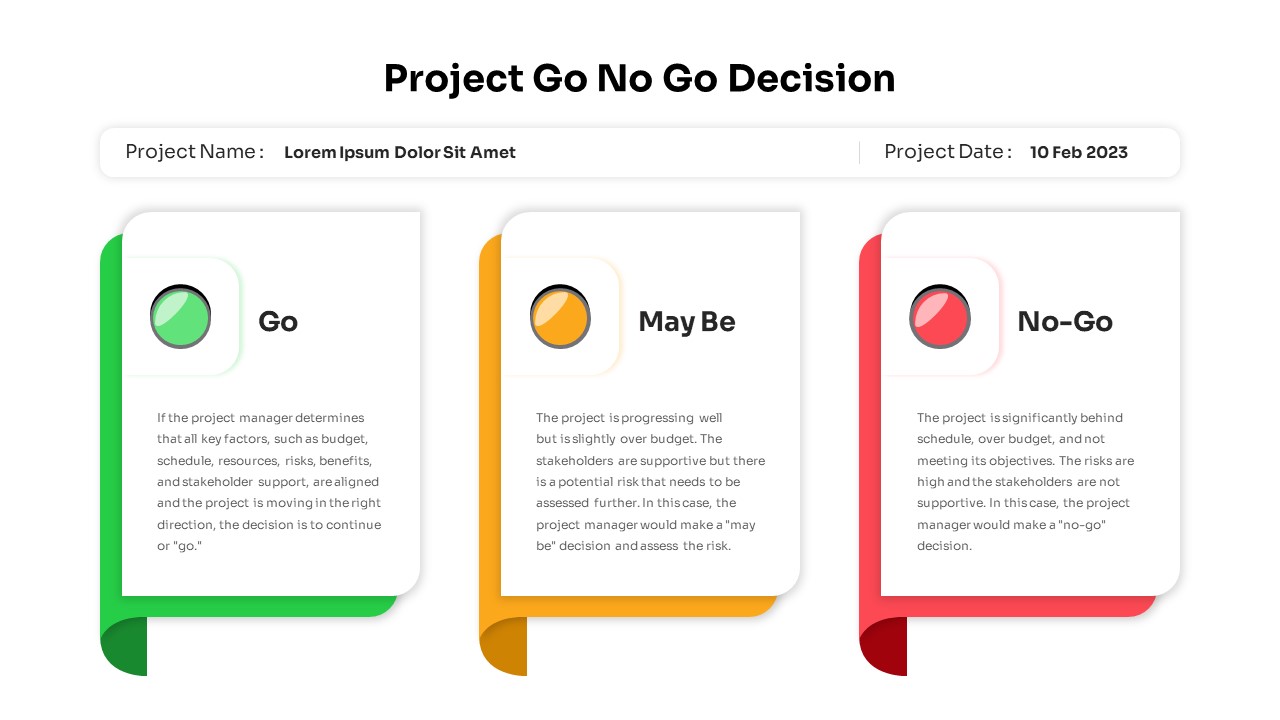
Project Go No-Go PowerPoint Template
PowerPoint Templates
Premium
-
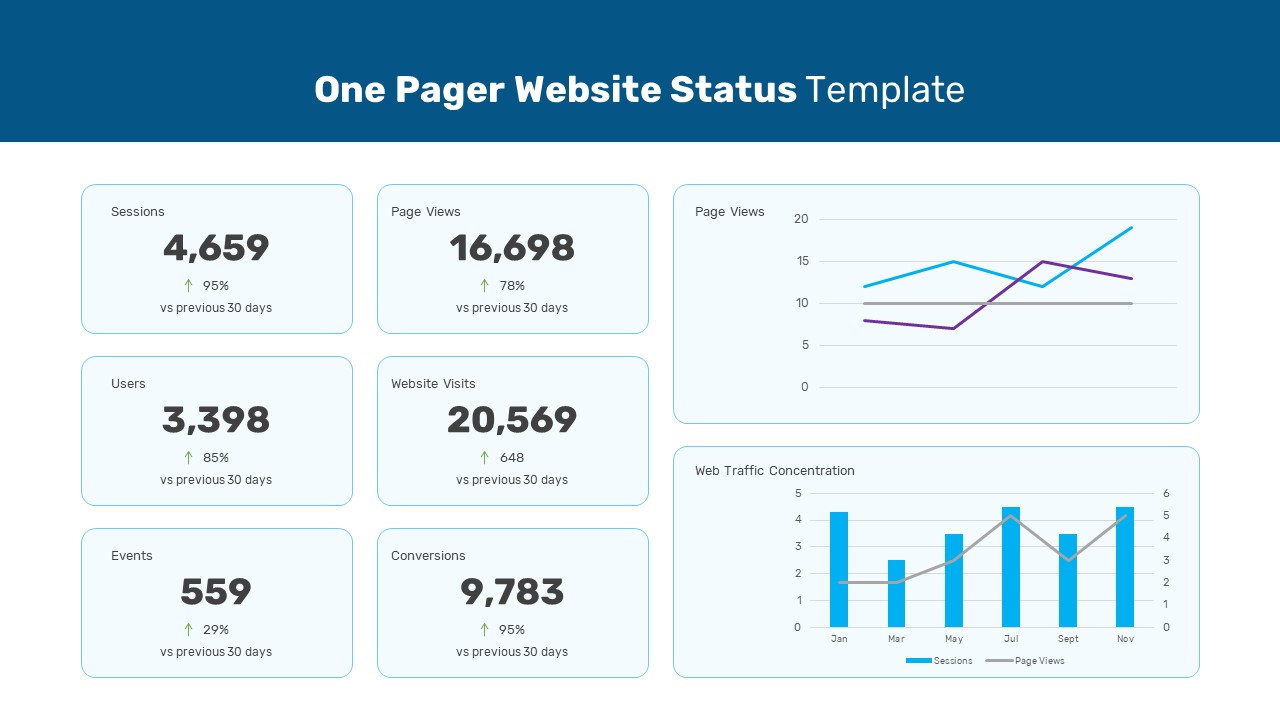
One Pager Website Status PowerPoint Template
PowerPoint Templates
Premium
-
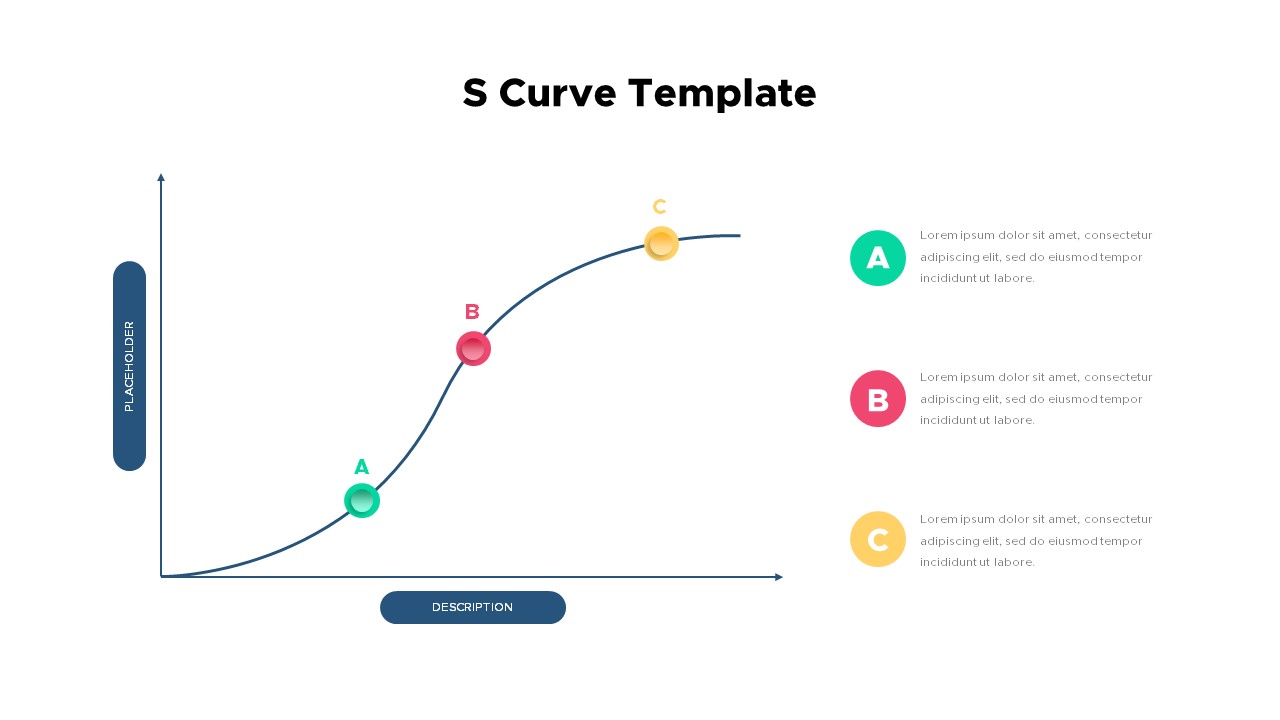
S Curve PowerPoint Template
Curves and Lines
Premium
-
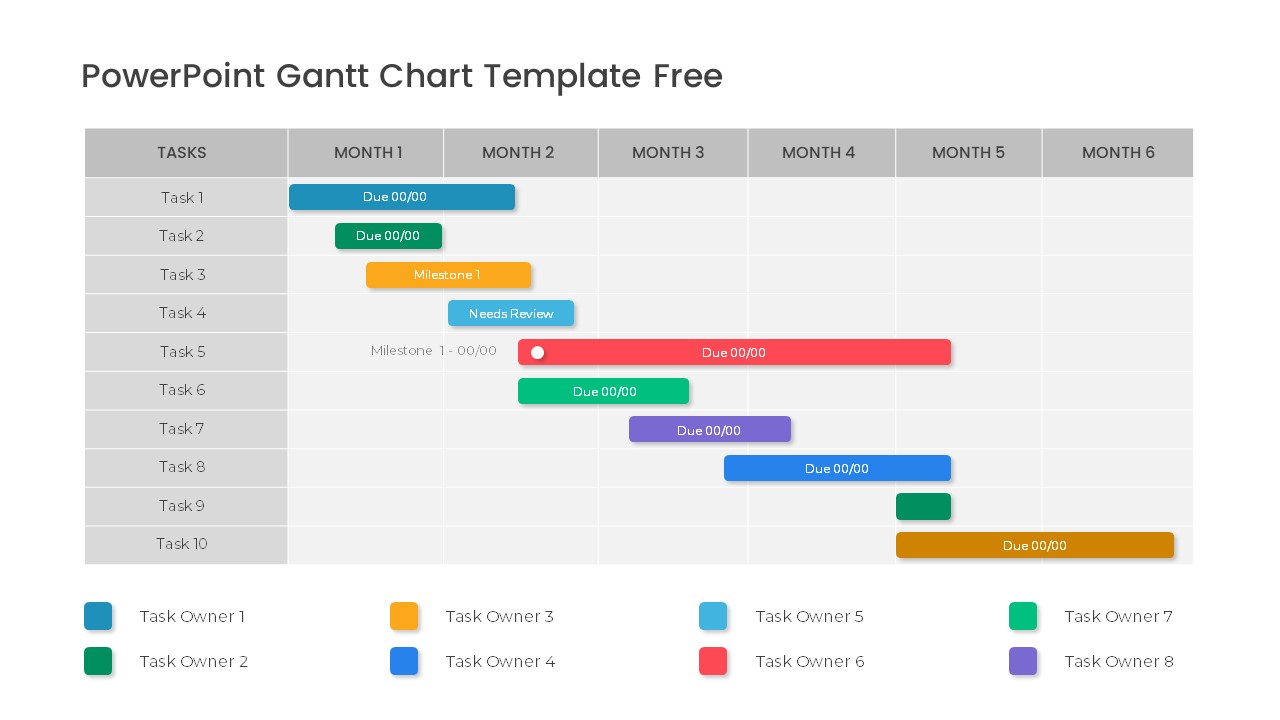
Free PowerPoint Gantt Chart Template
PowerPoint Charts
Free
-
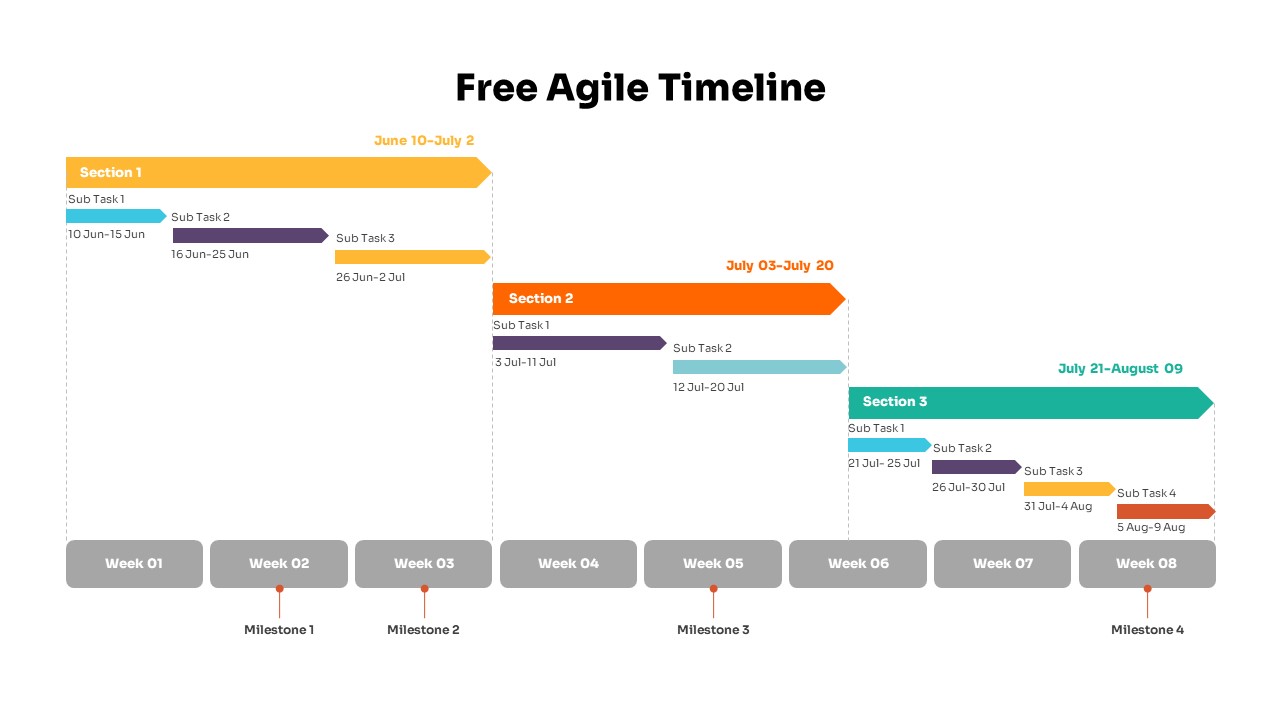
Free Agile Timeline PowerPoint Template
Free PowerPoint Templates
Free
-
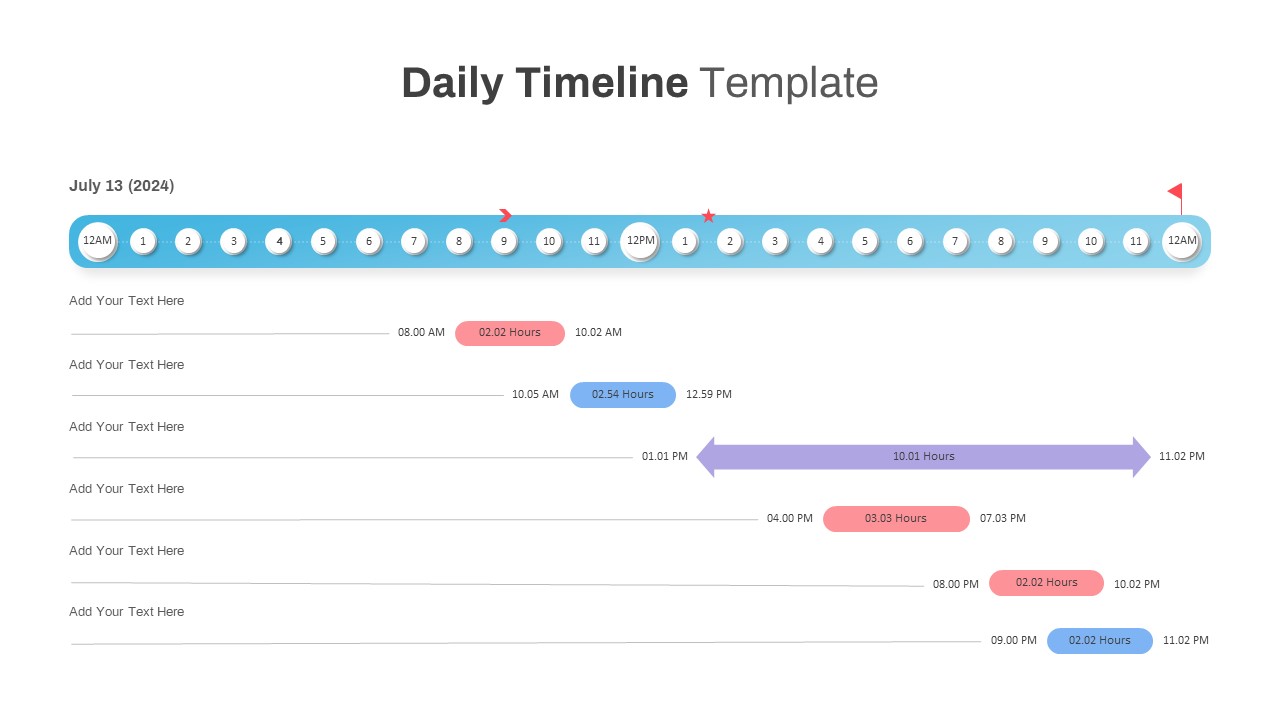
Daily Timeline Template PowerPoint
Timeline PowerPoint Template
Premium
-
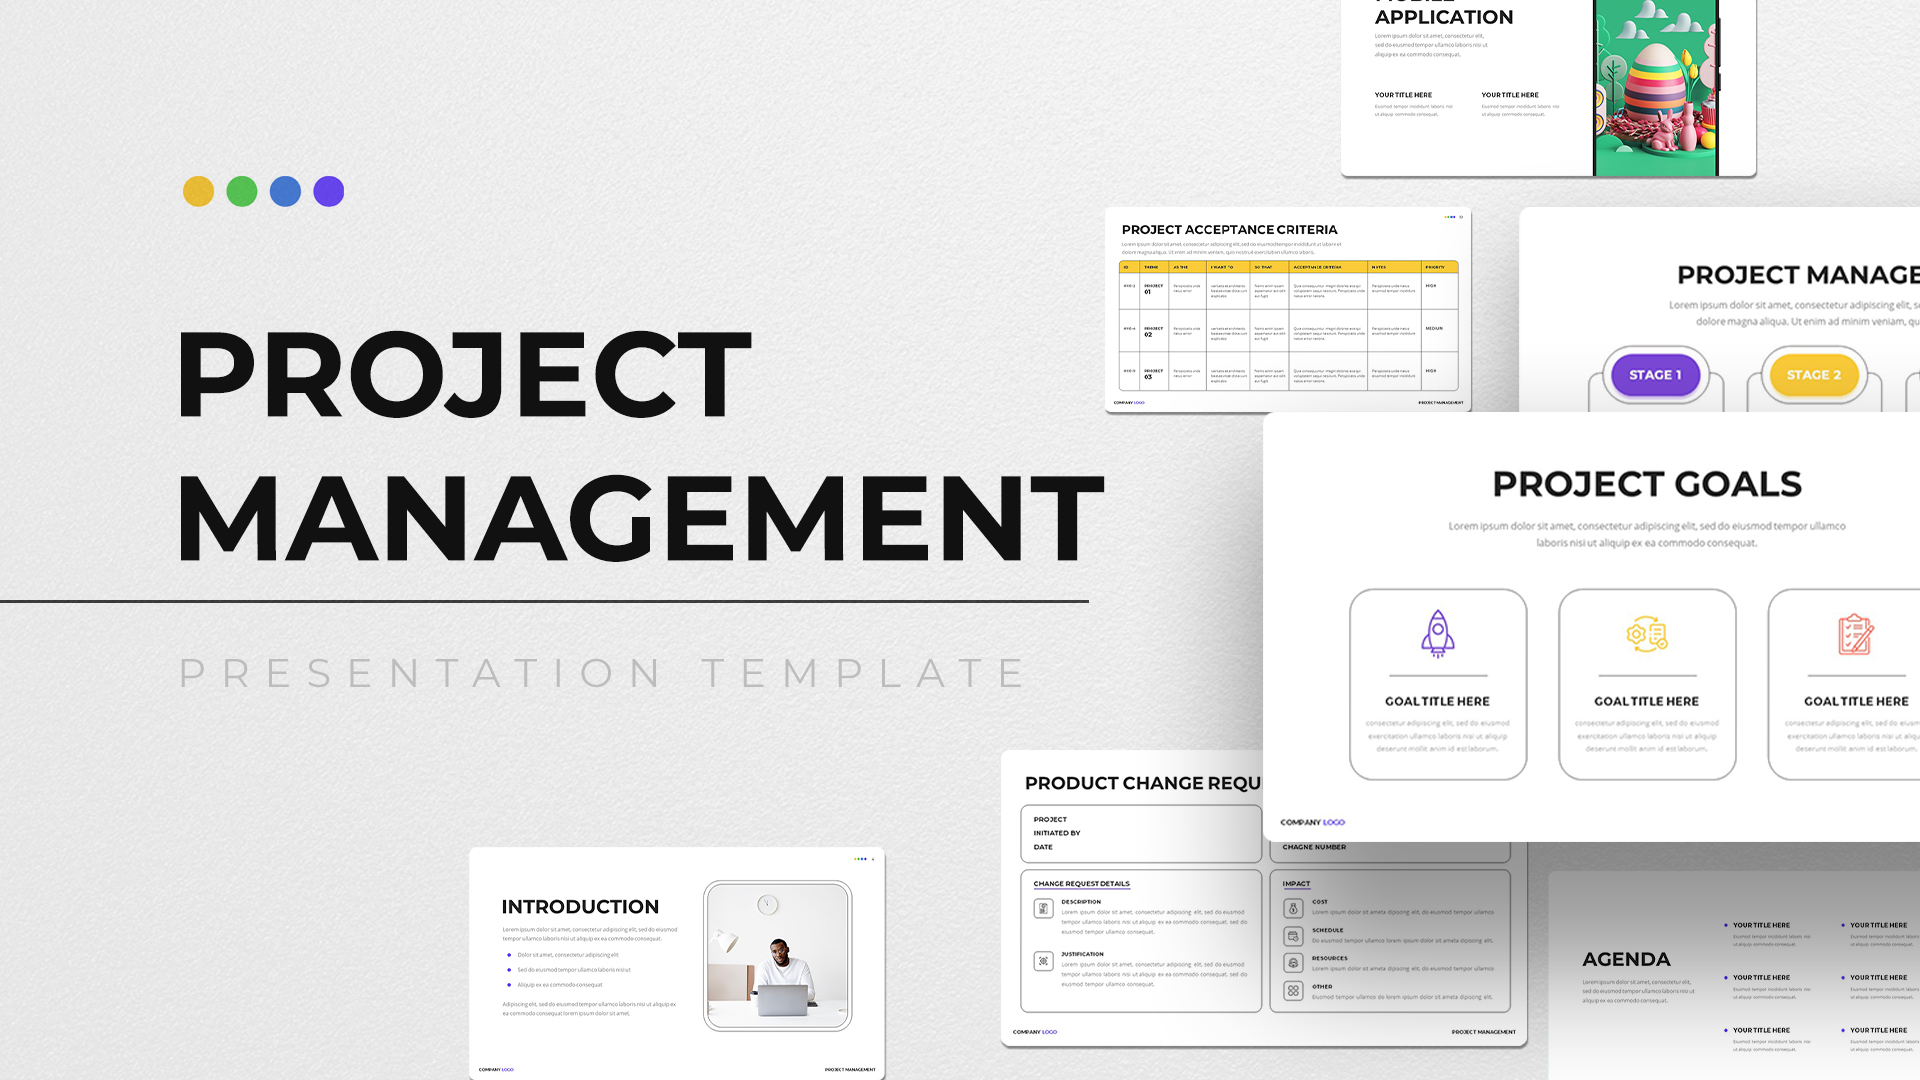
Project Management Presentation Template
PowerPoint Business Templates
Premium
-
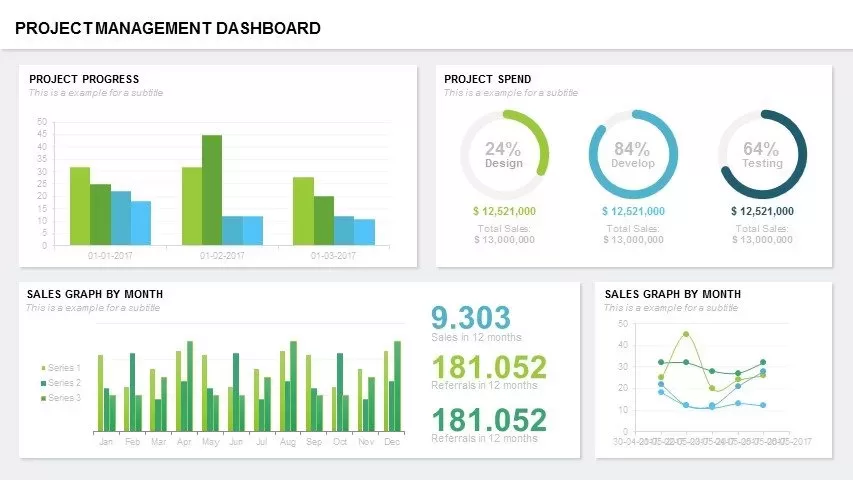
Project Management Dashboard PowerPoint Template and Keynote Template
PowerPoint Templates
Premium
-
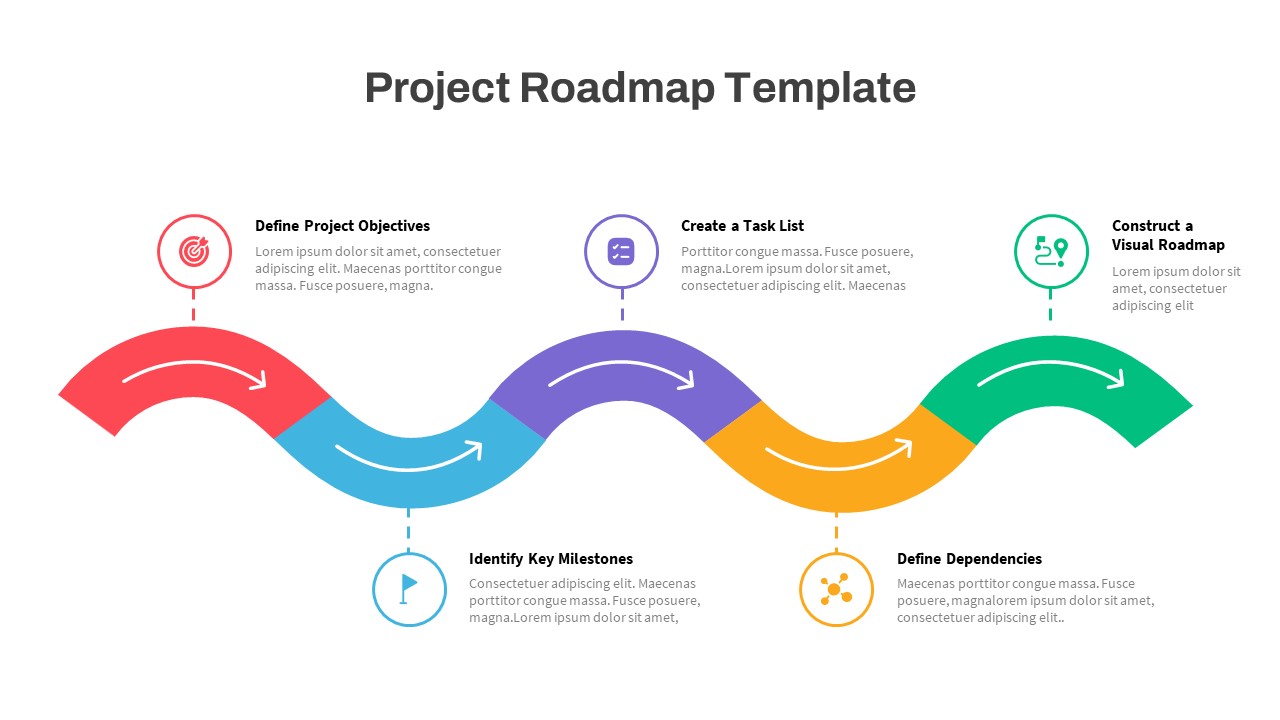
Project Roadmap PowerPoint Template
PowerPoint Templates
Premium
-
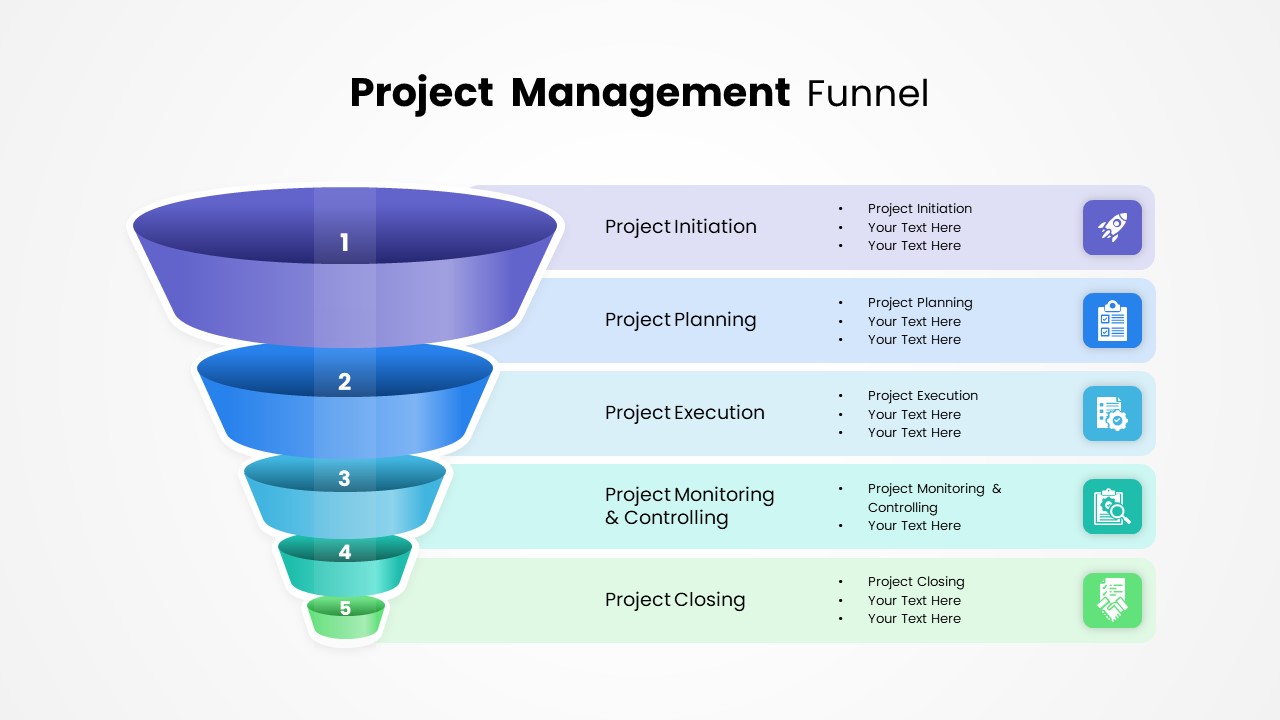
Project Management Funnel Template PowerPoint
Funnel Diagrams
Premium
-
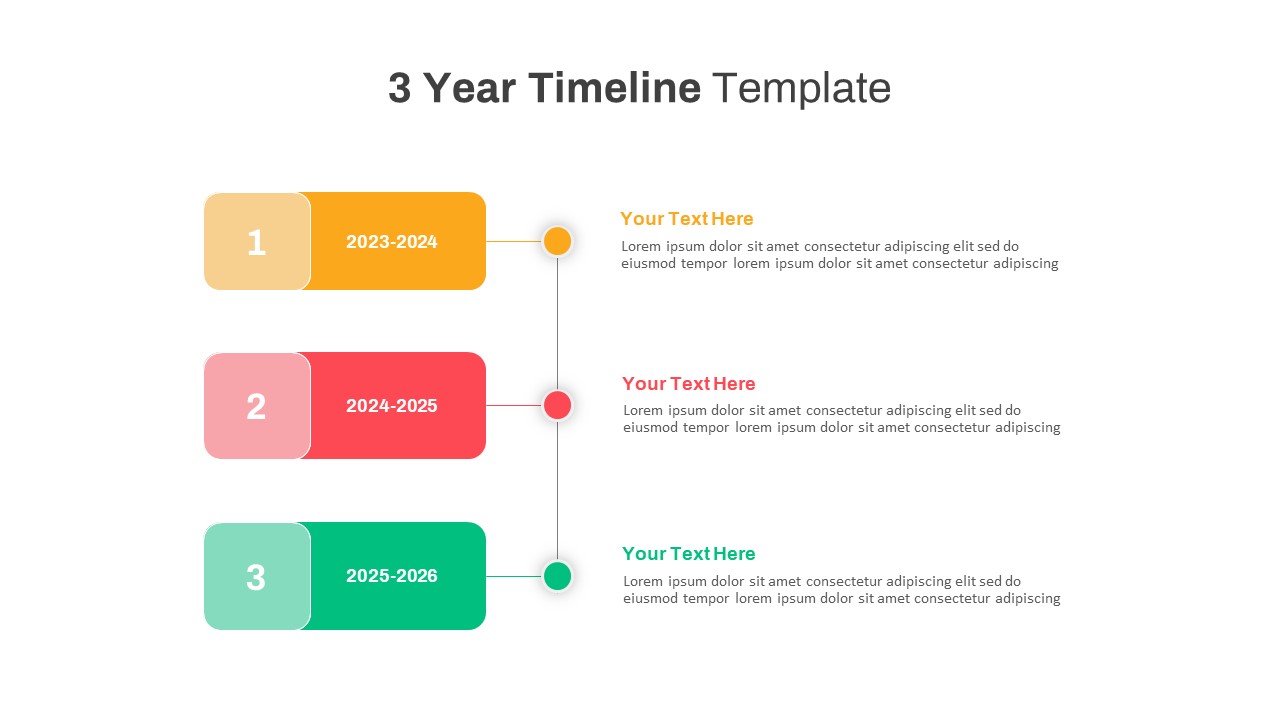
3 Year Timeline PowerPoint Template
Timeline PowerPoint Template
Premium
-
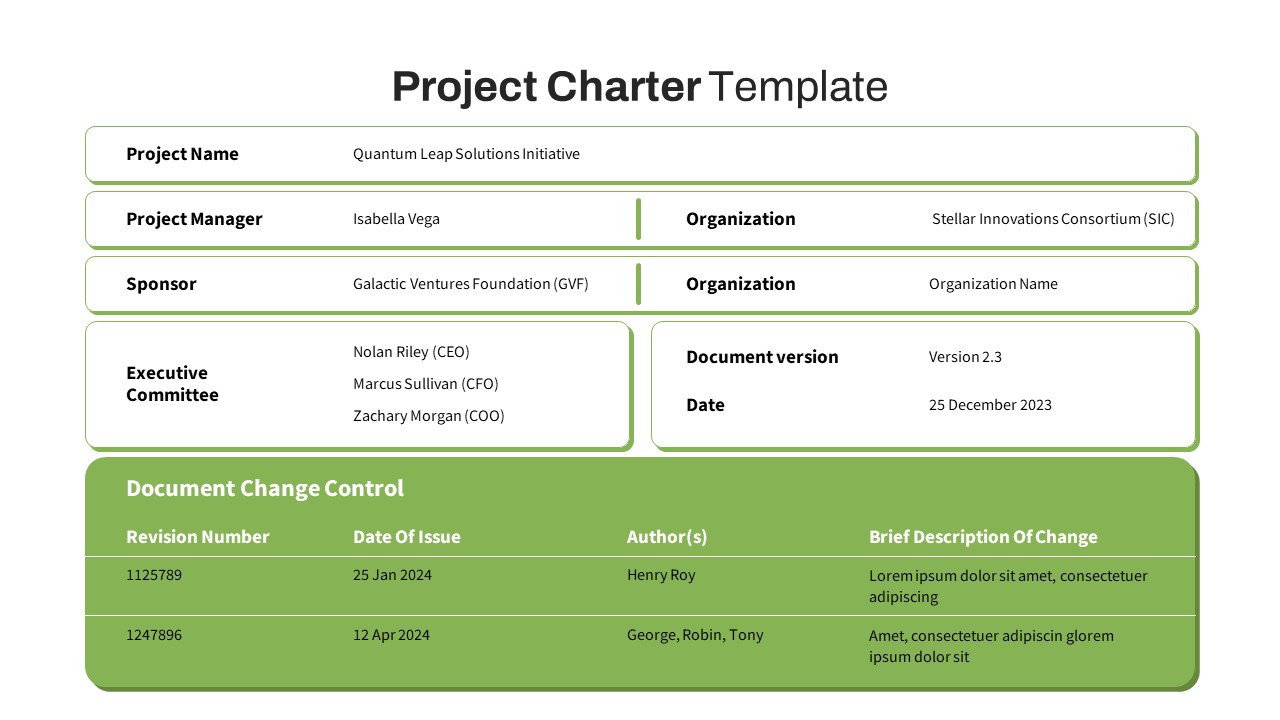
Free Project Charter PowerPoint Template
Free PowerPoint Templates
Free
-
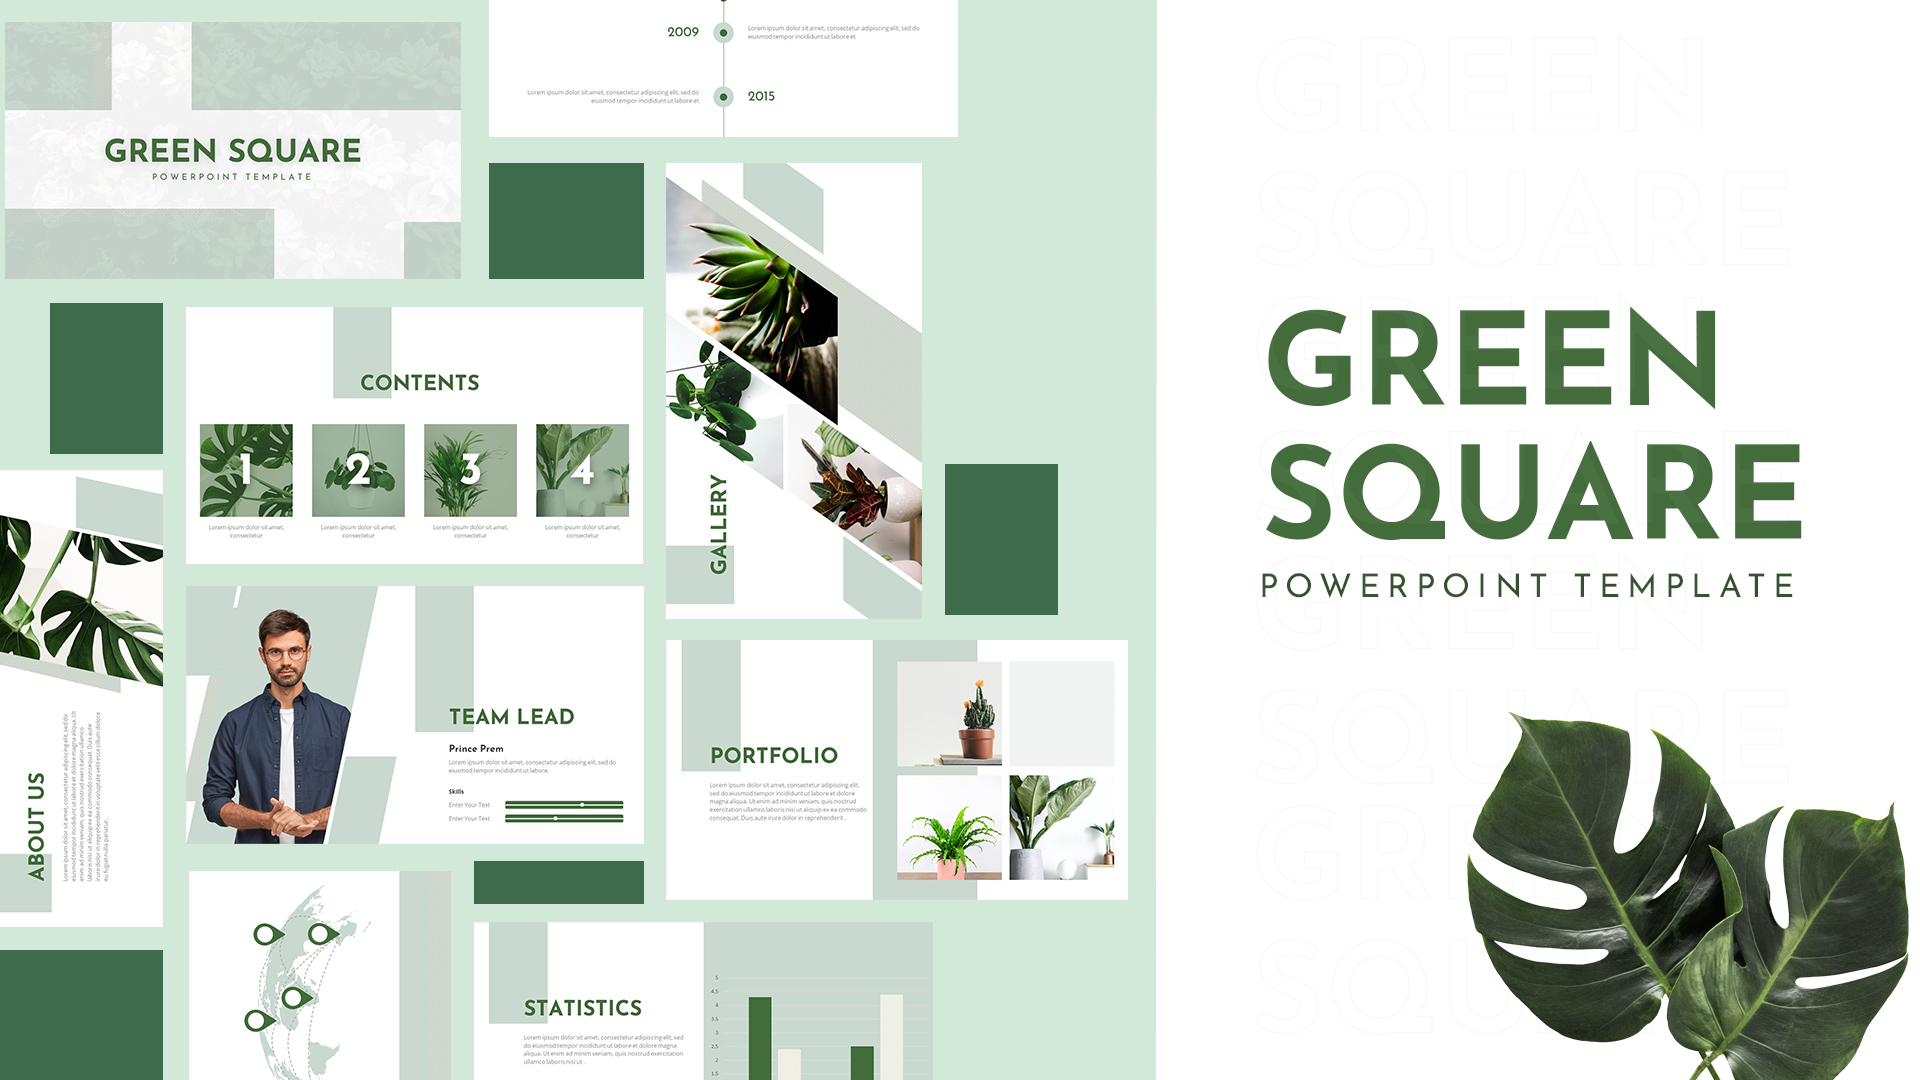
Green Square Business PowerPoint Template
PowerPoint Templates
Premium
-
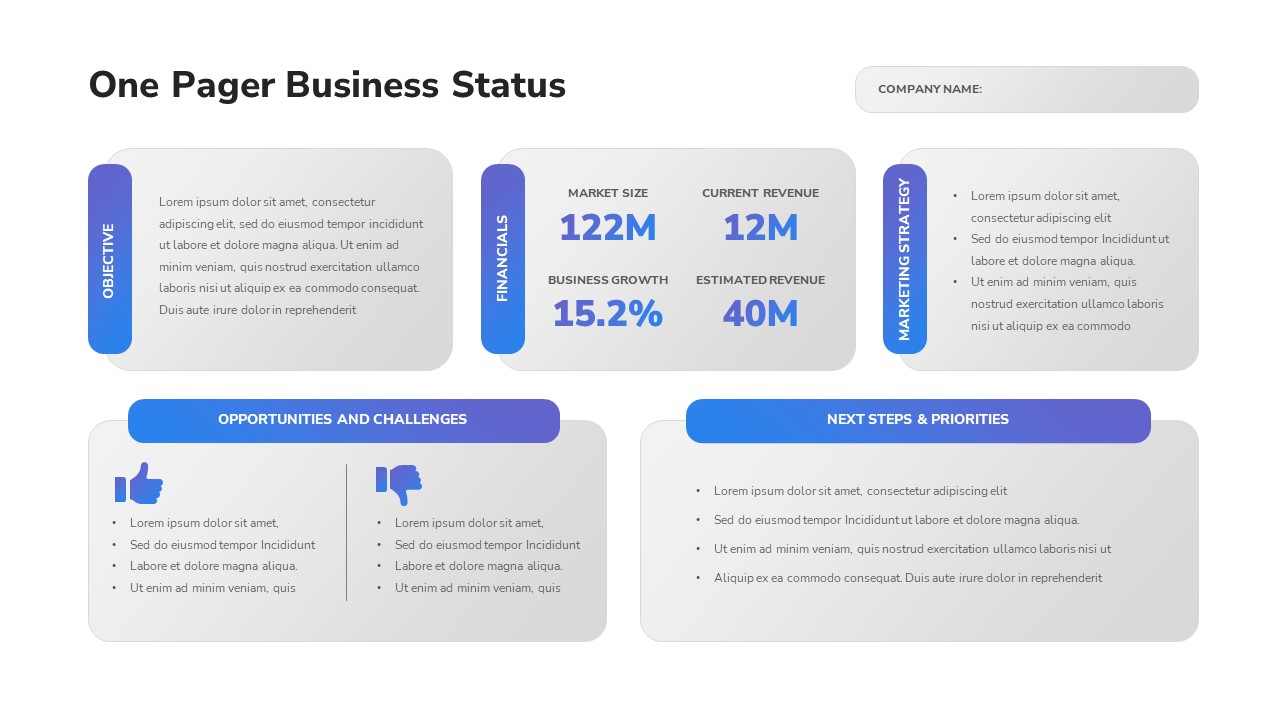
One Pager Business Status PowerPoint Template
Infographic
Premium
-
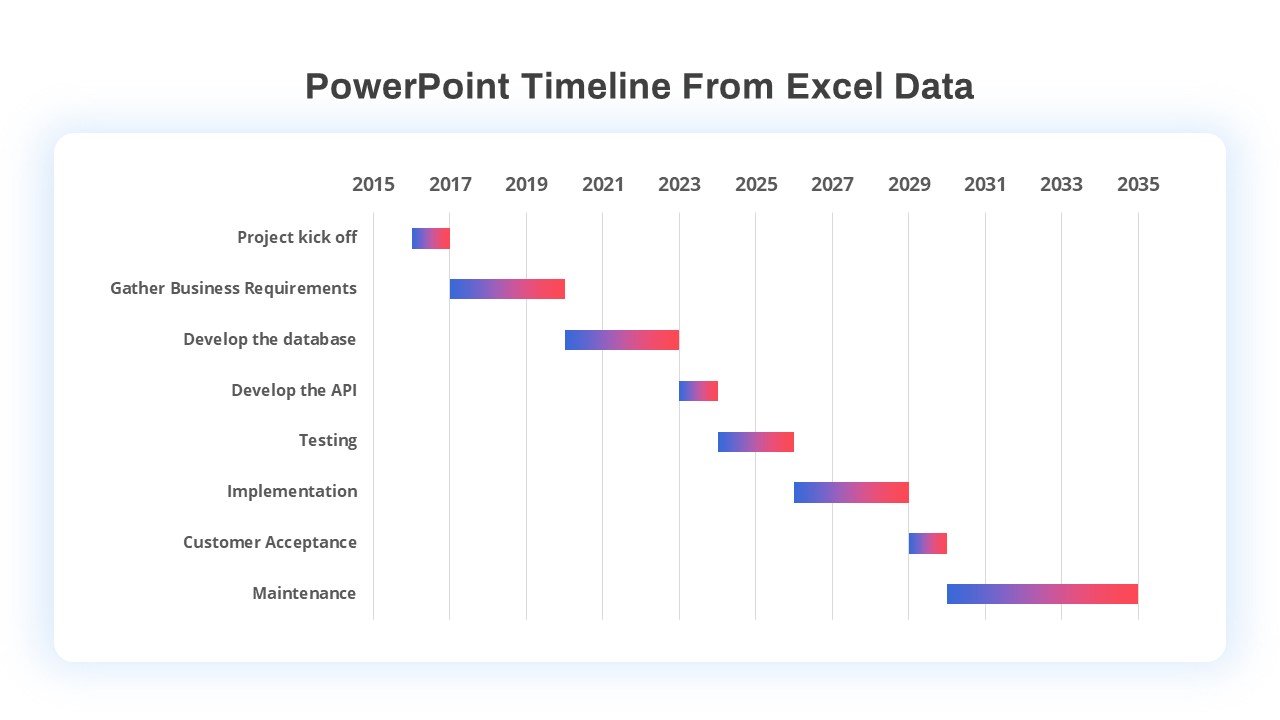
PowerPoint Timeline Template From Excel Data
Timeline PowerPoint Template
Premium
-
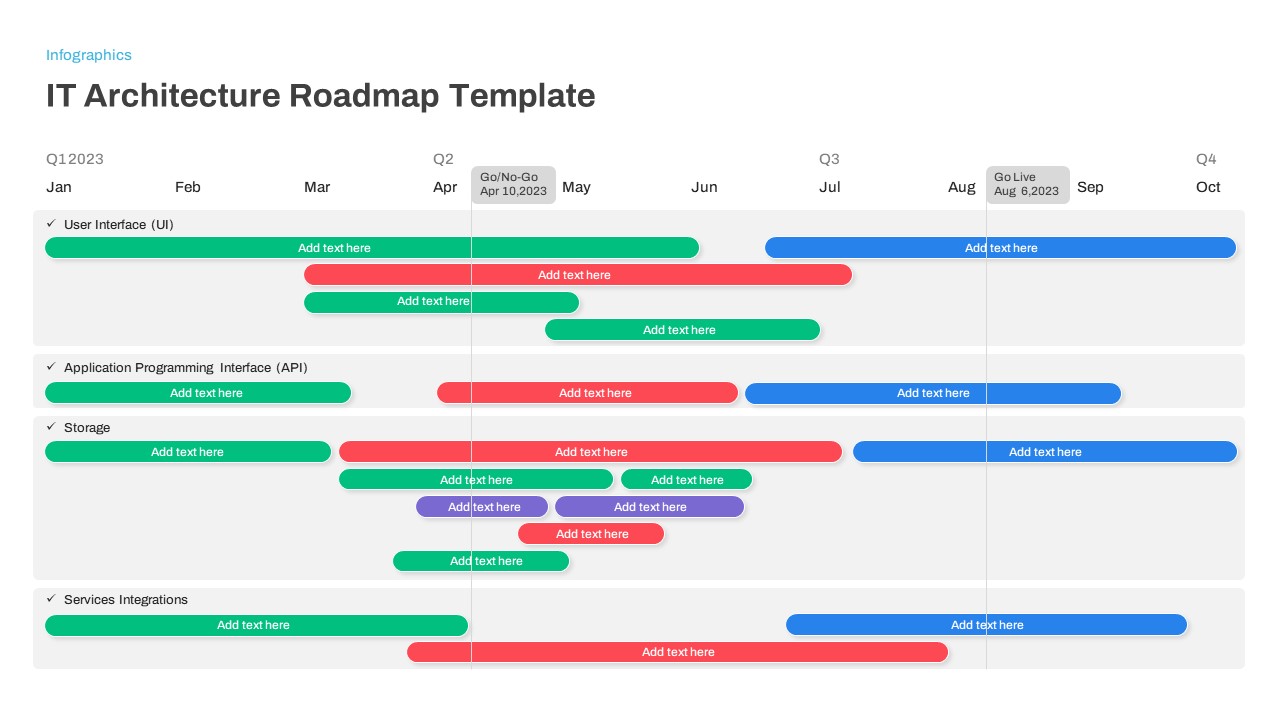
IT Architecture Roadmap PowerPoint Template
PowerPoint Templates
Premium
-
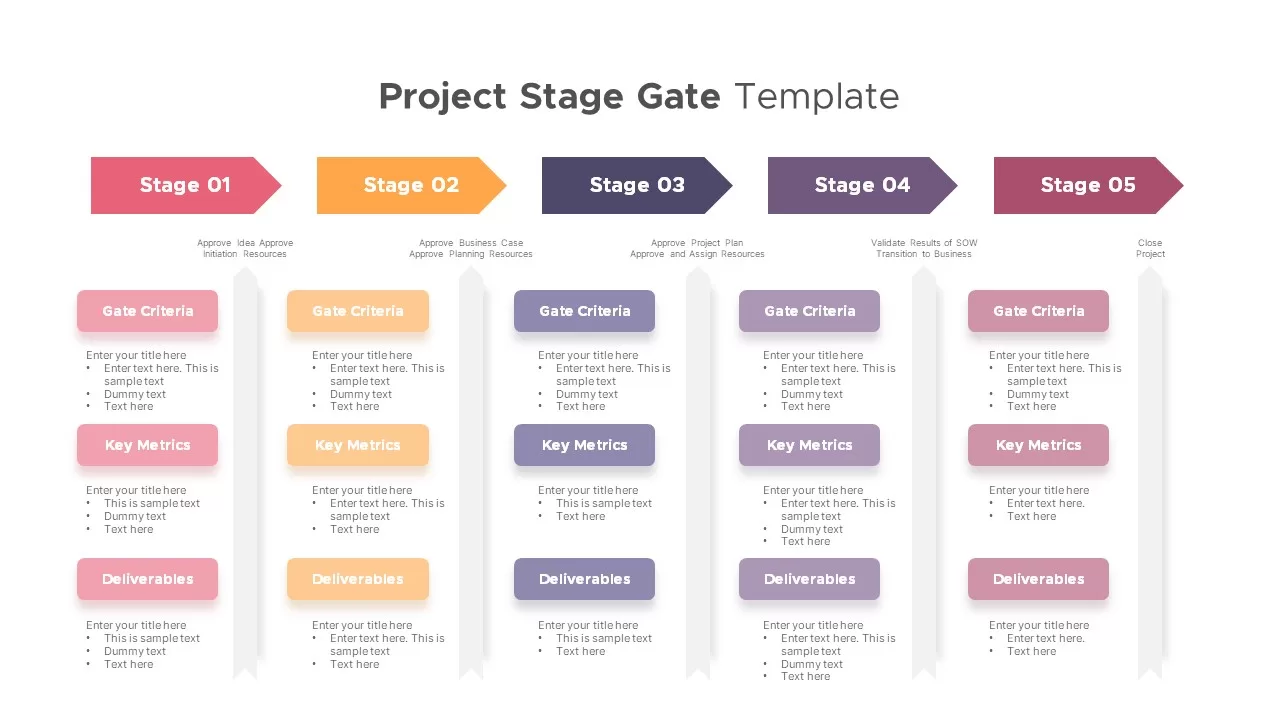
Project Stage Gate Template
PowerPoint Templates
Premium
-
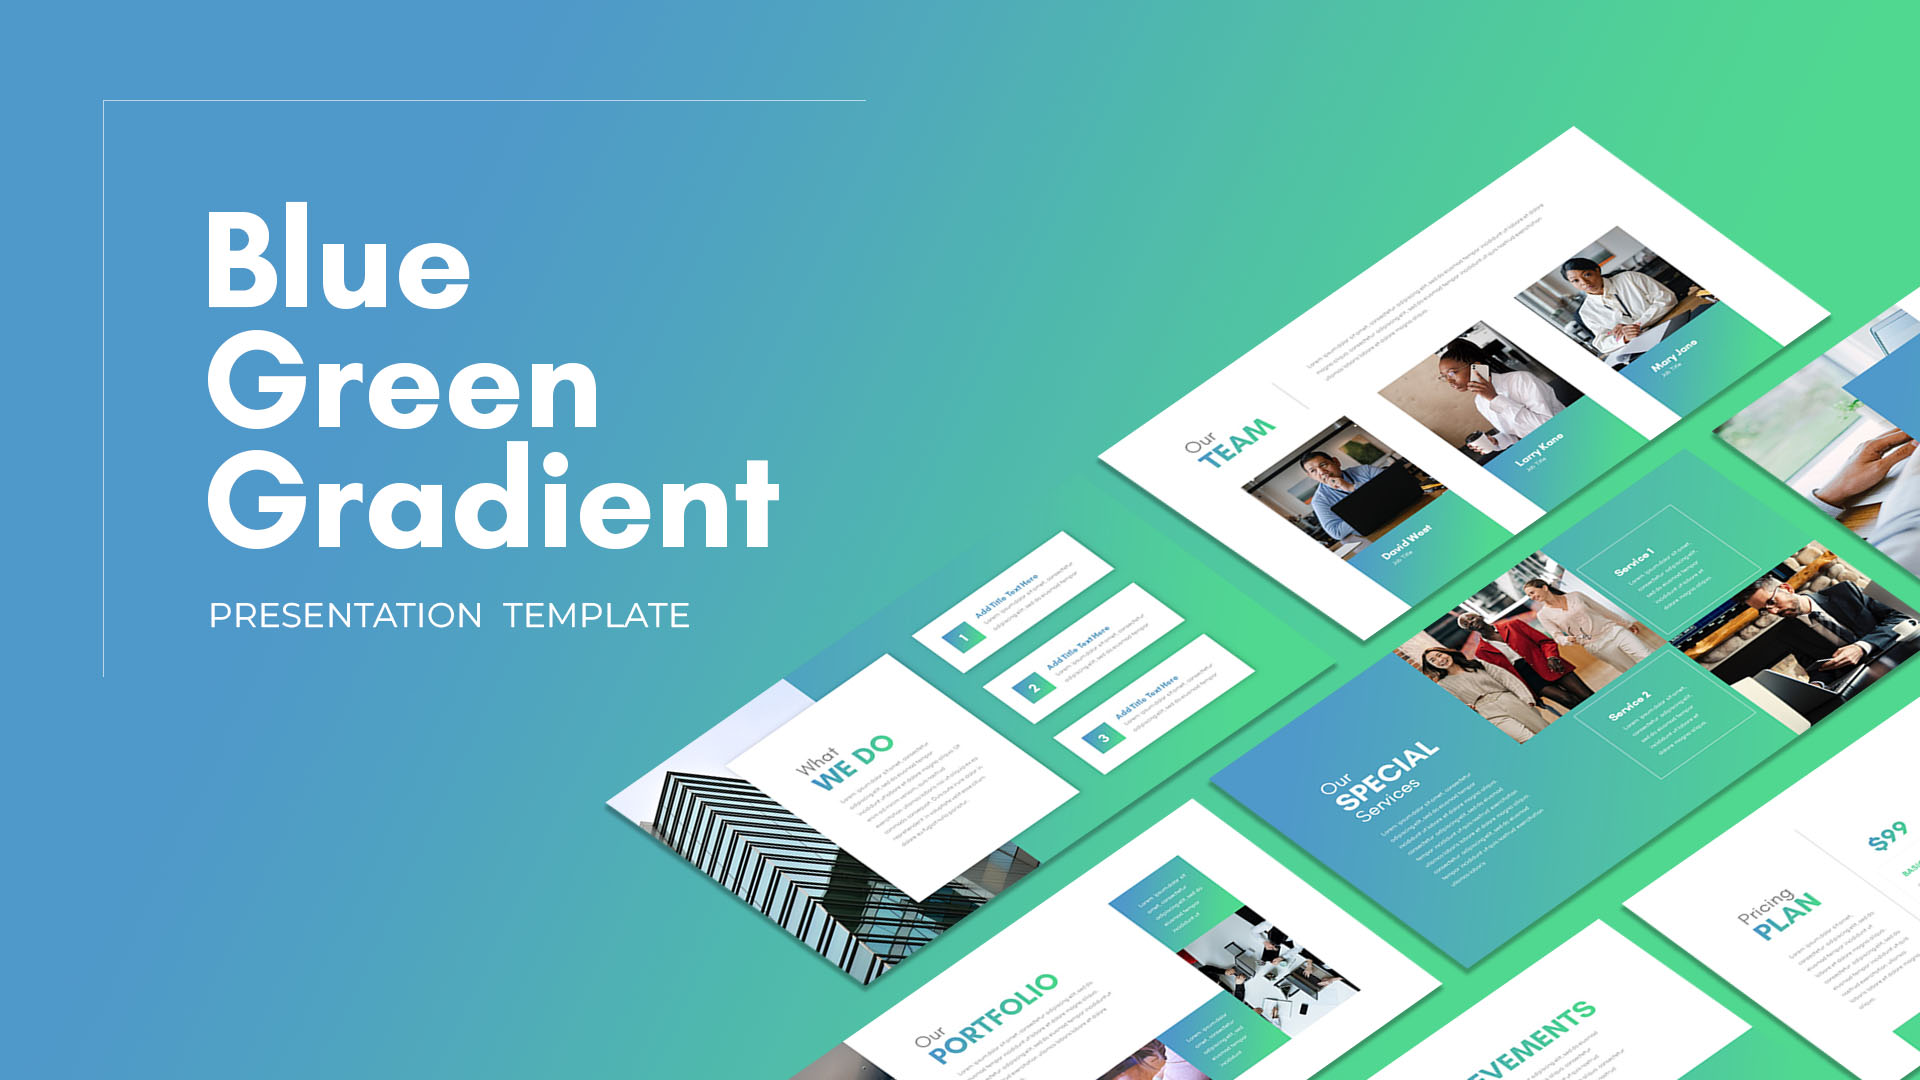
Blue Green Presentation Template
PowerPoint Templates
Premium
-
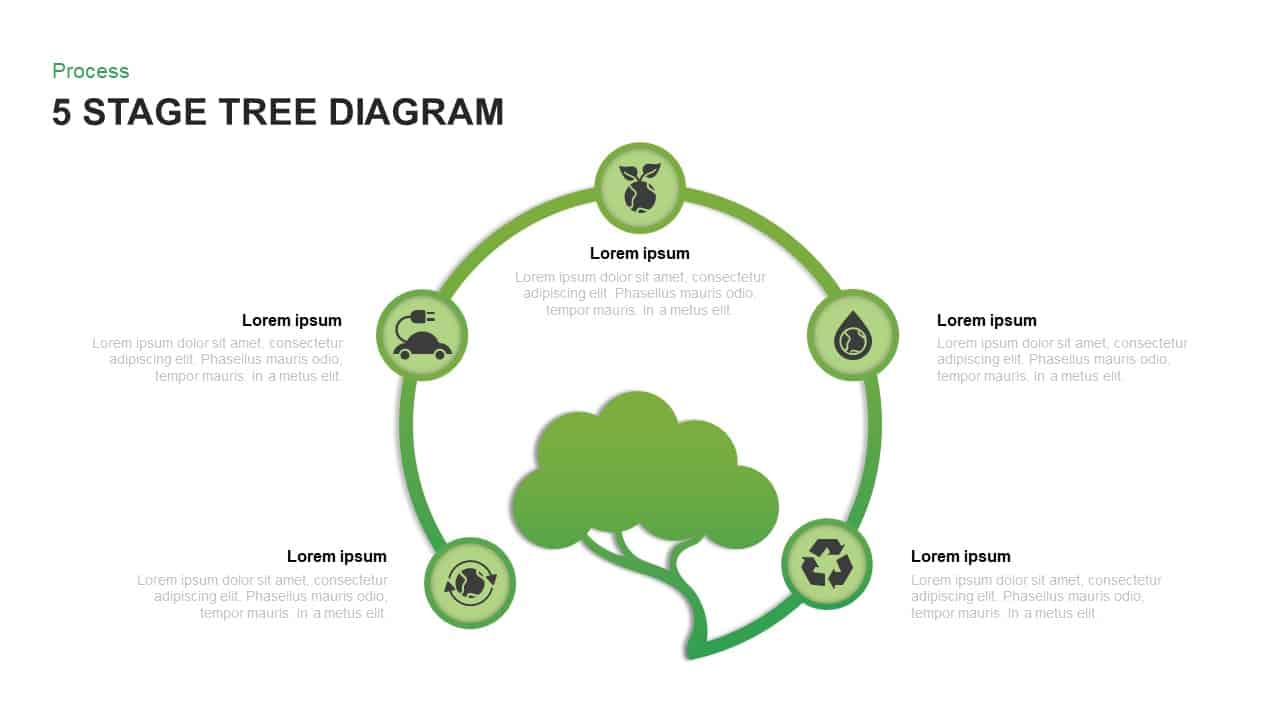
5 Stage Tree Diagram Template for PowerPoint and Keynote
Tree Diagrams
Premium
-
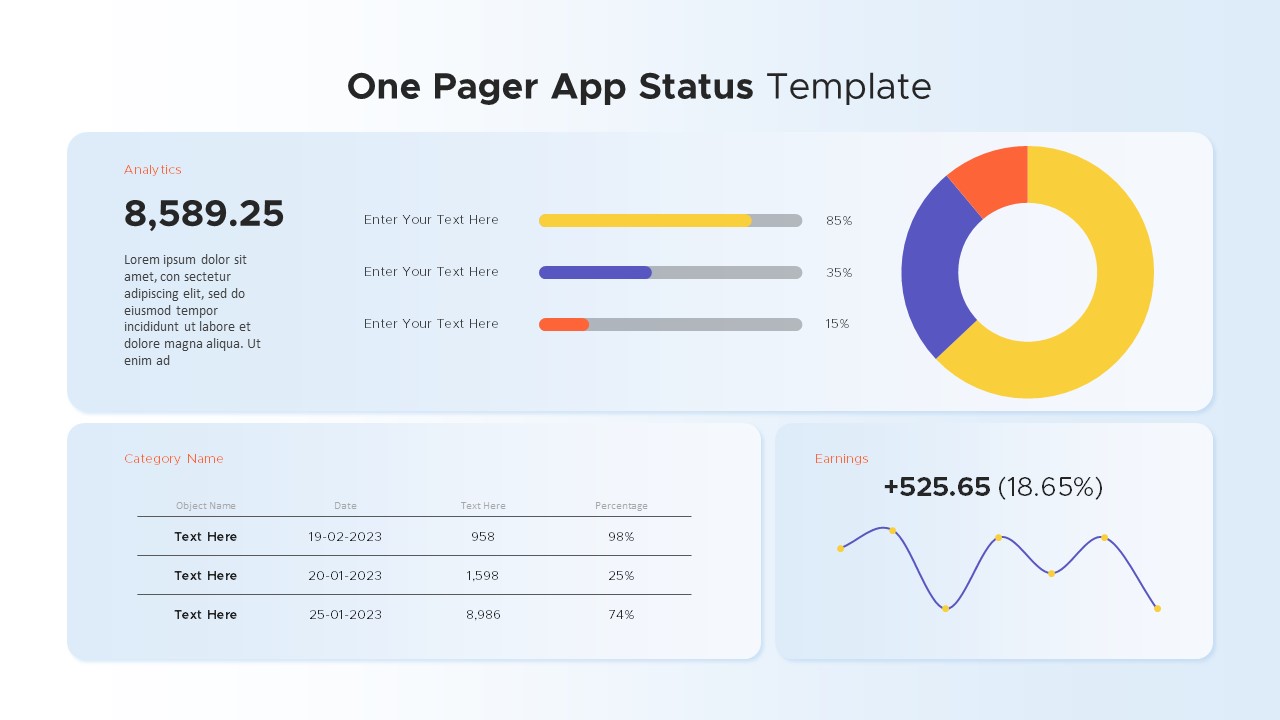
One Pager App Status PowerPoint Template
PowerPoint Charts
Premium
-
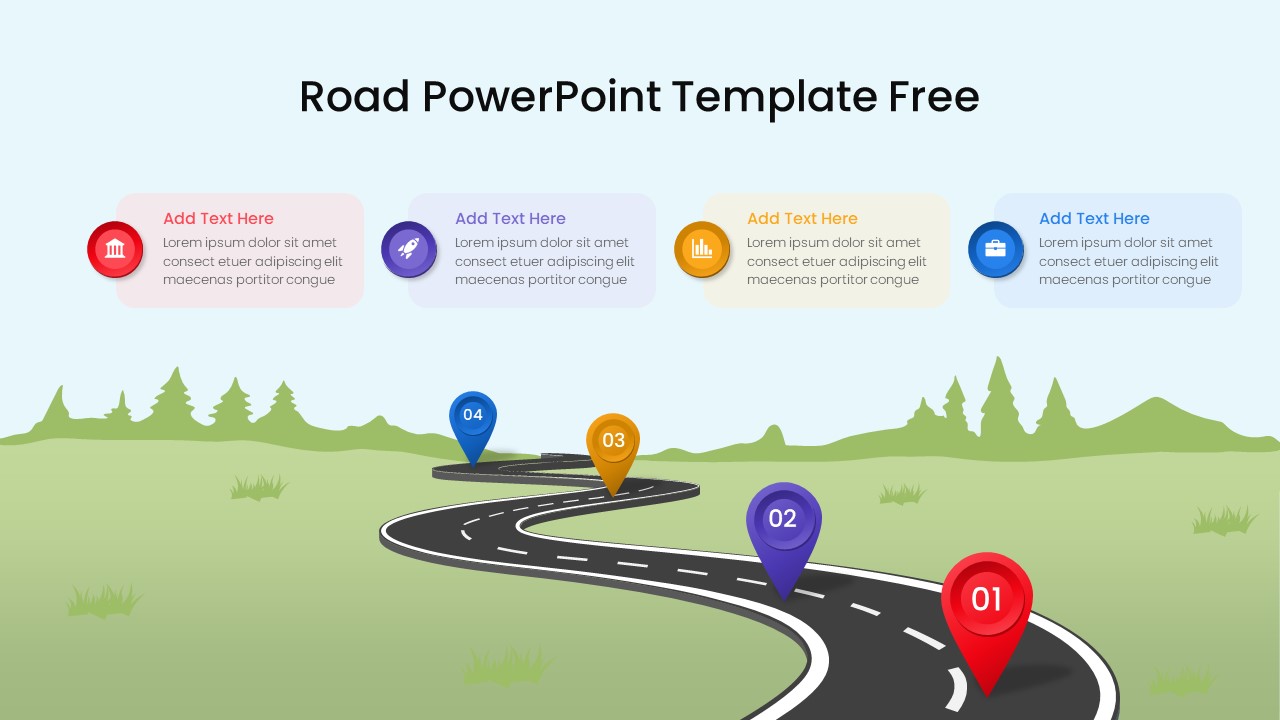
Road Powerpoint Template Free
Roadmap PowerPoint Templates
Free
-
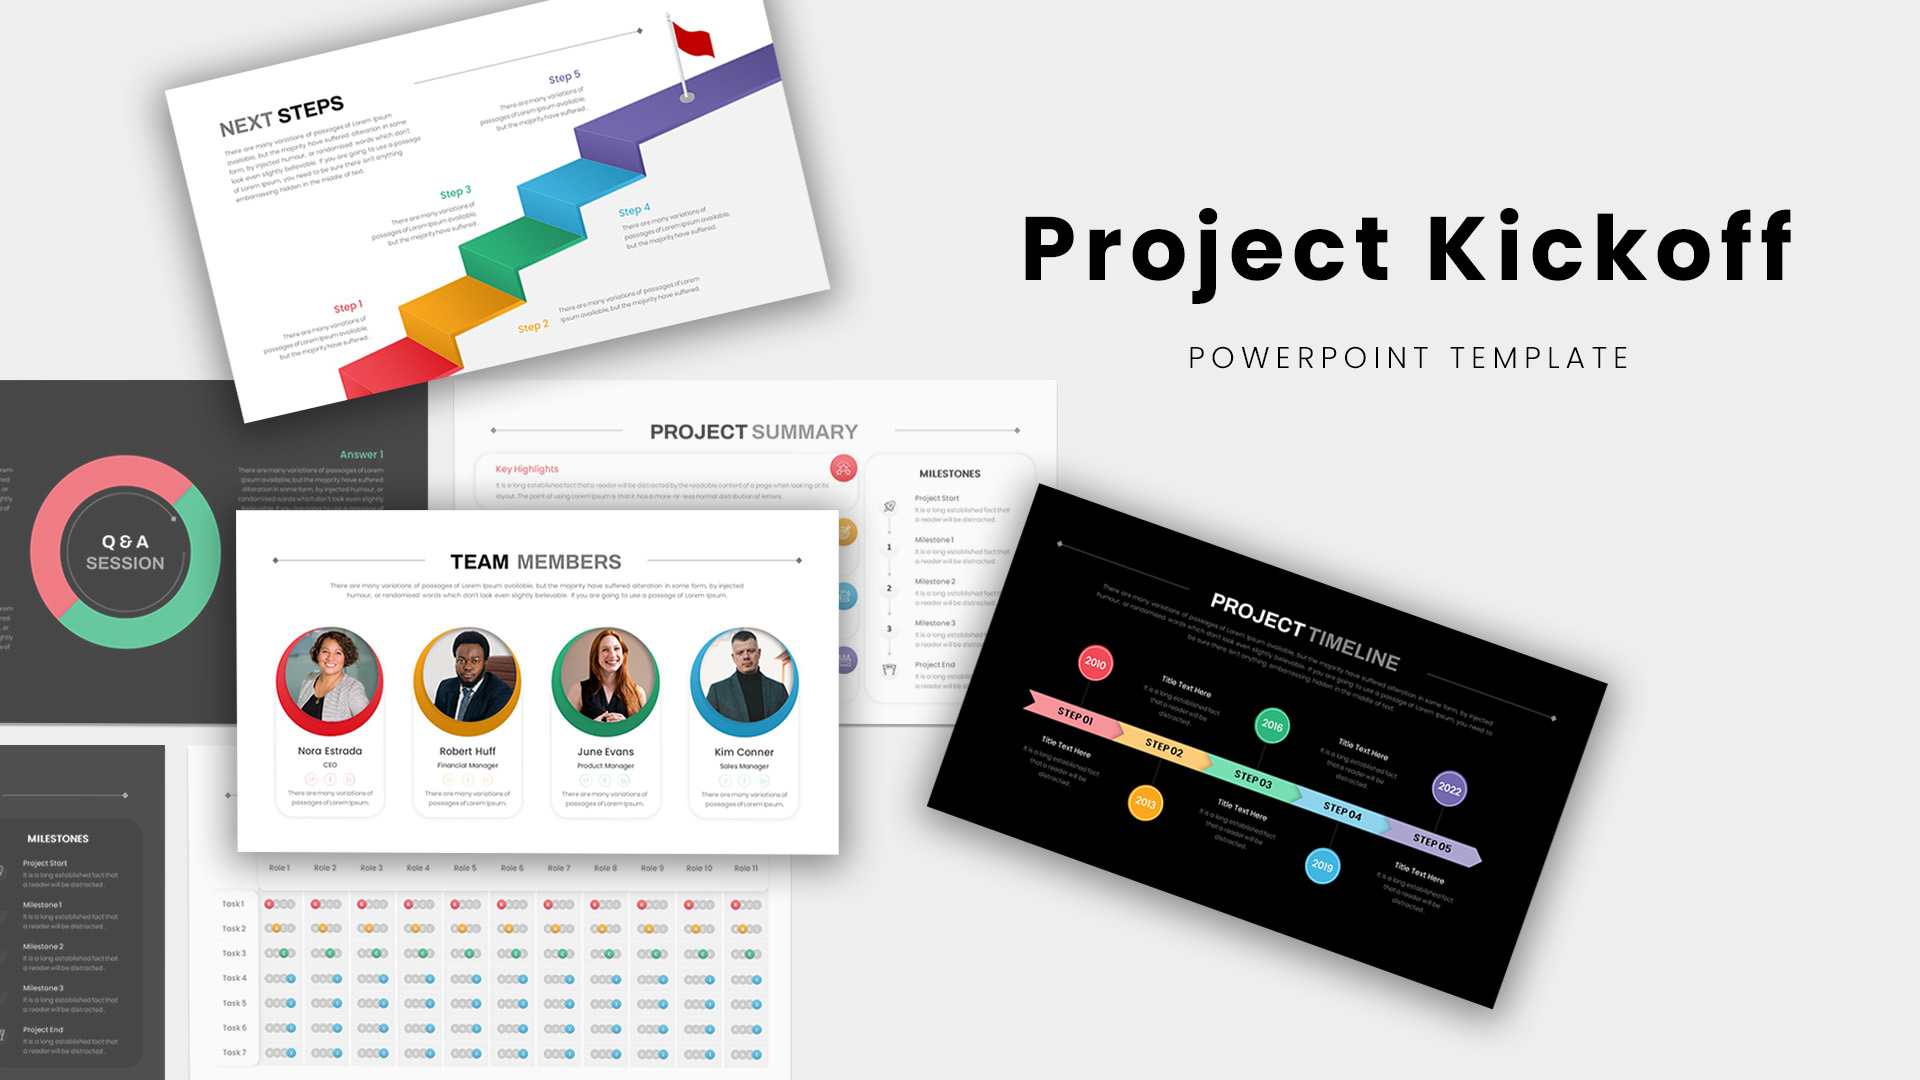
Project Kickoff Meeting Deck PowerPoint Template
PowerPoint Templates
Premium
-
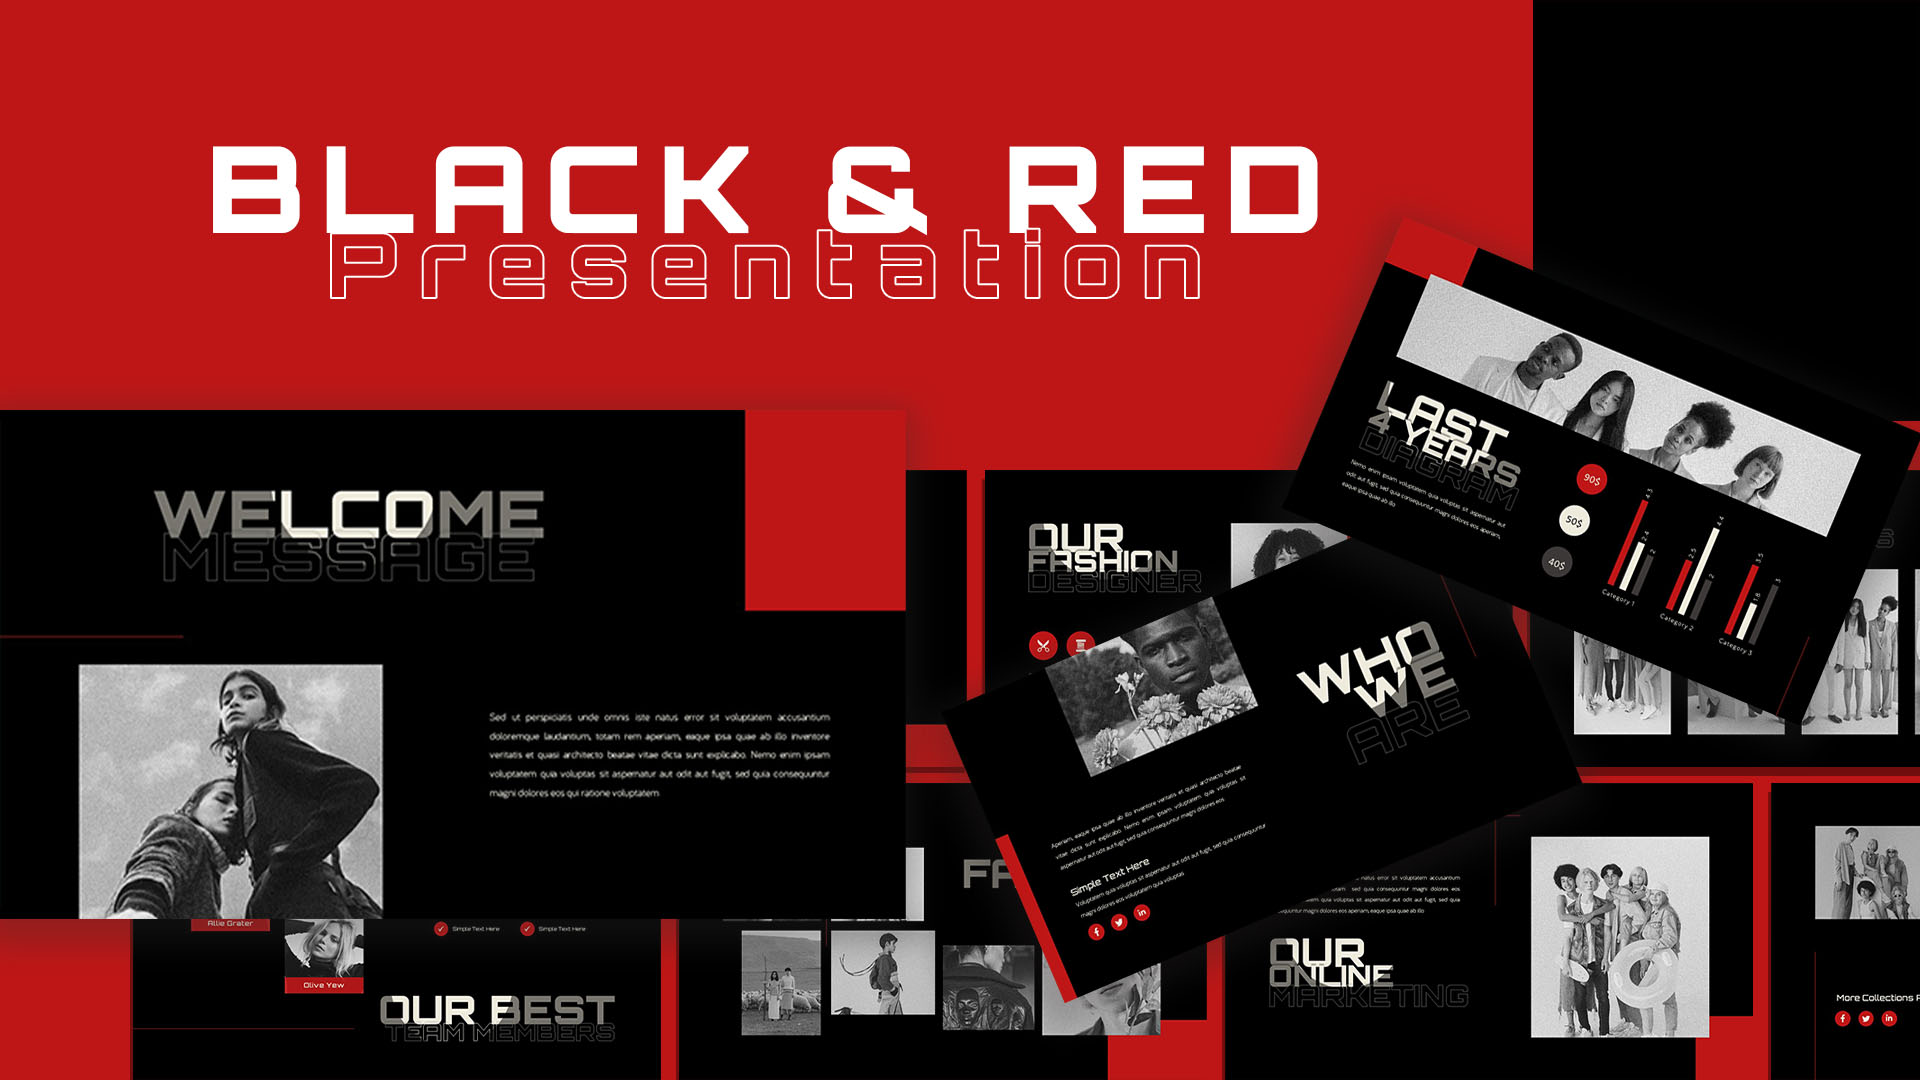
Black and Red Theme PowerPoint Template
PowerPoint Templates
Premium
-
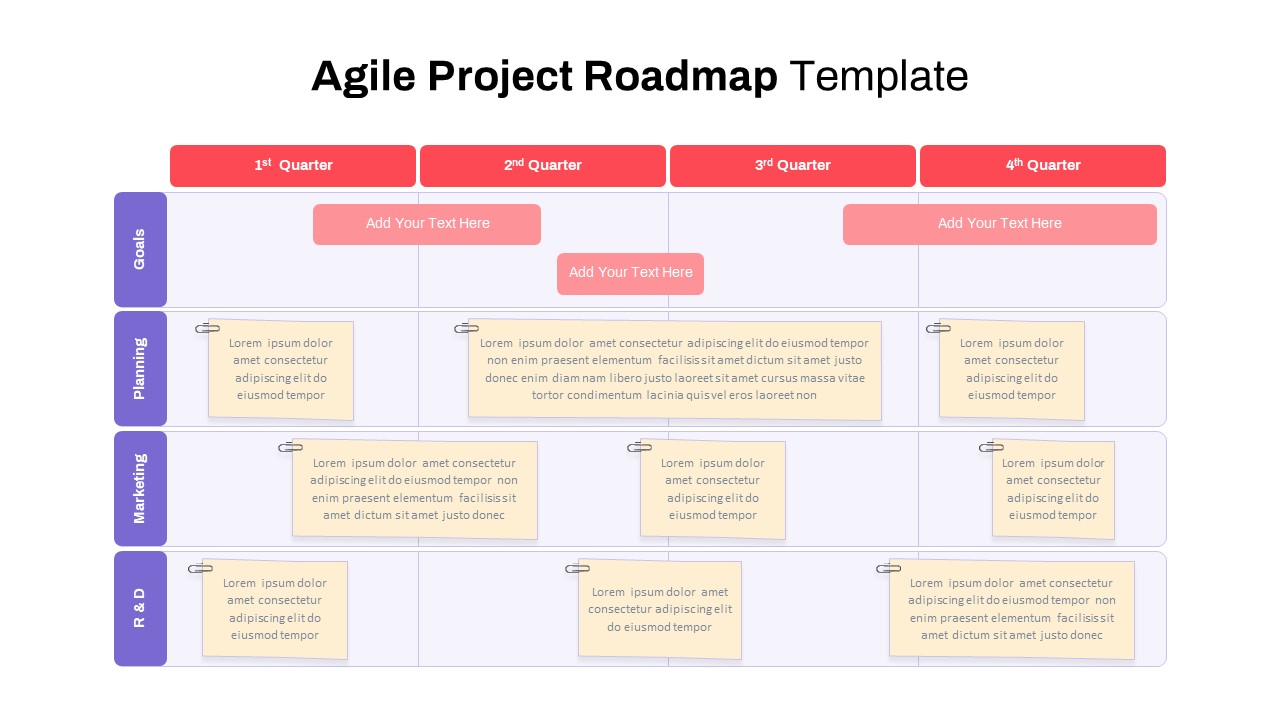
Agile Project Roadmap PowerPoint Template
PowerPoint Templates
Premium
-
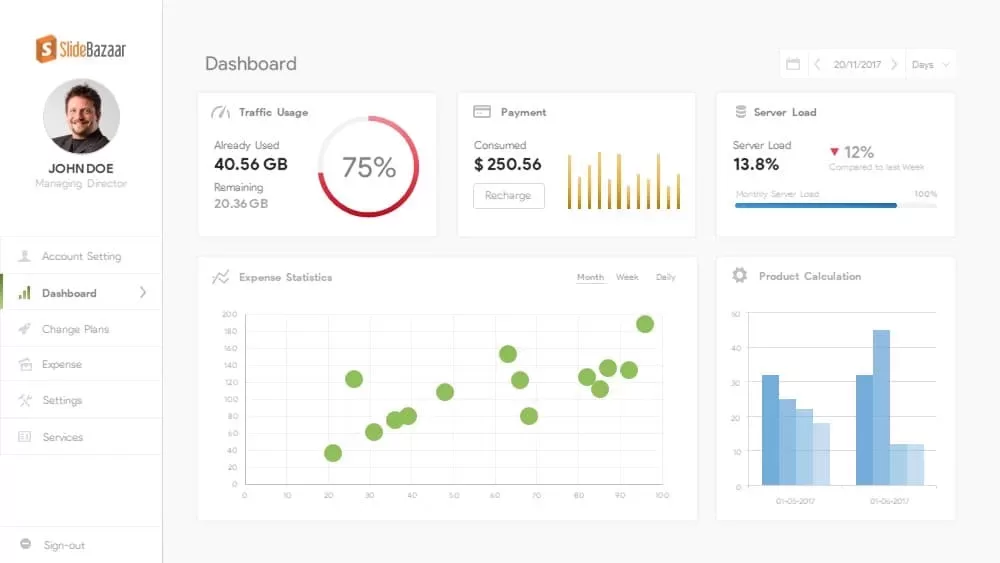
Free Project Dashboard PowerPoint Template & Keynote Slide
Free PowerPoint Templates
Free
-
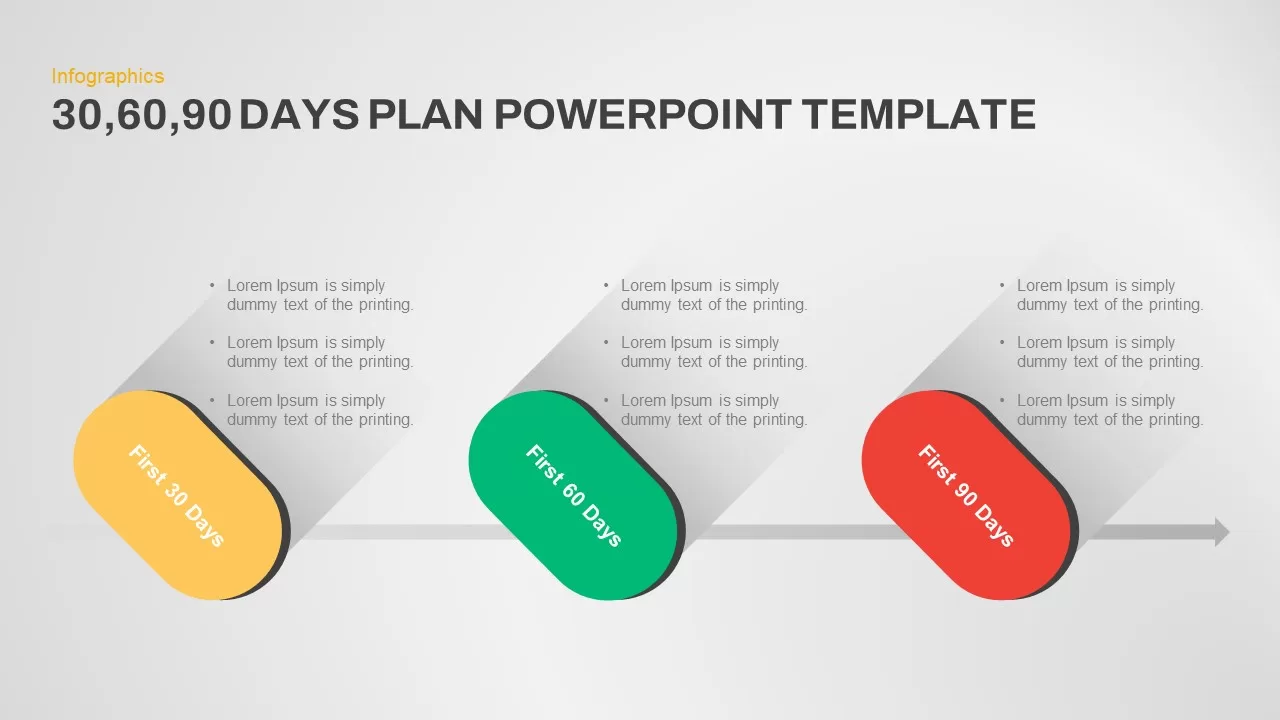
30 60 90 Days Plan Infographics Template
Infographic
Premium
-
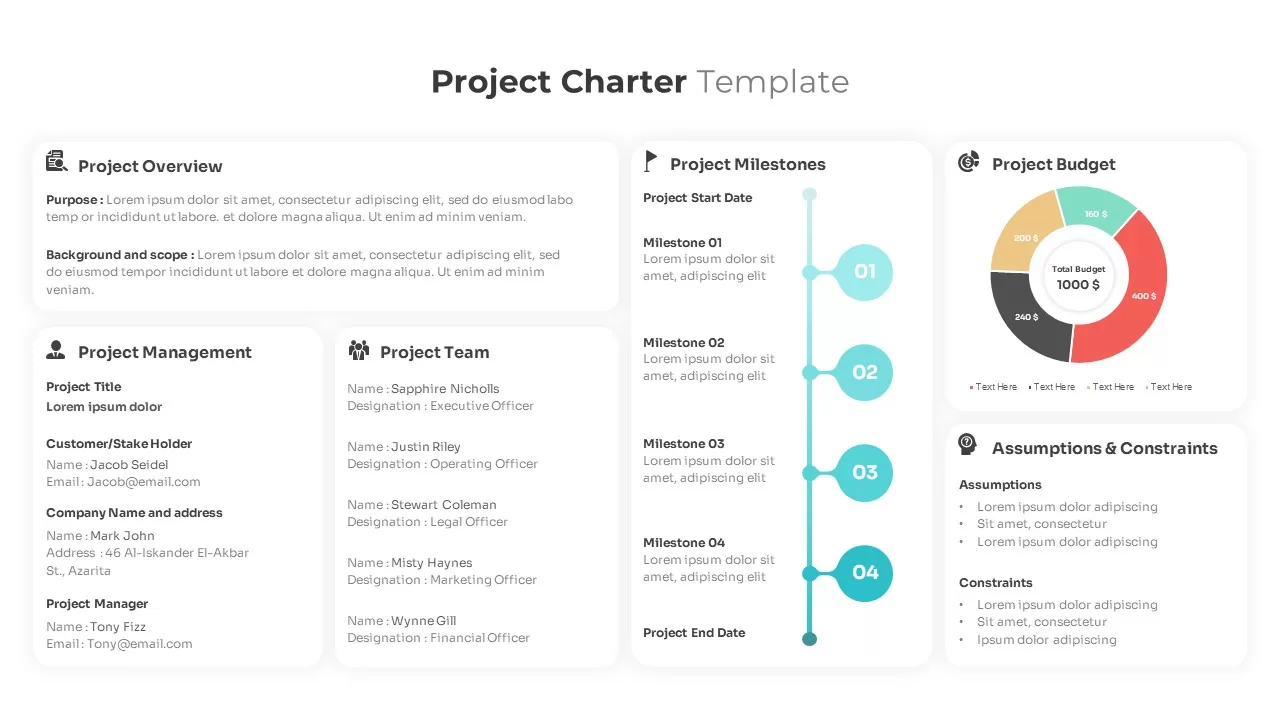
Project Charter Template
Text and Table
Premium
-

Stakeholder Register PowerPoint Template
PowerPoint Templates
Premium
-
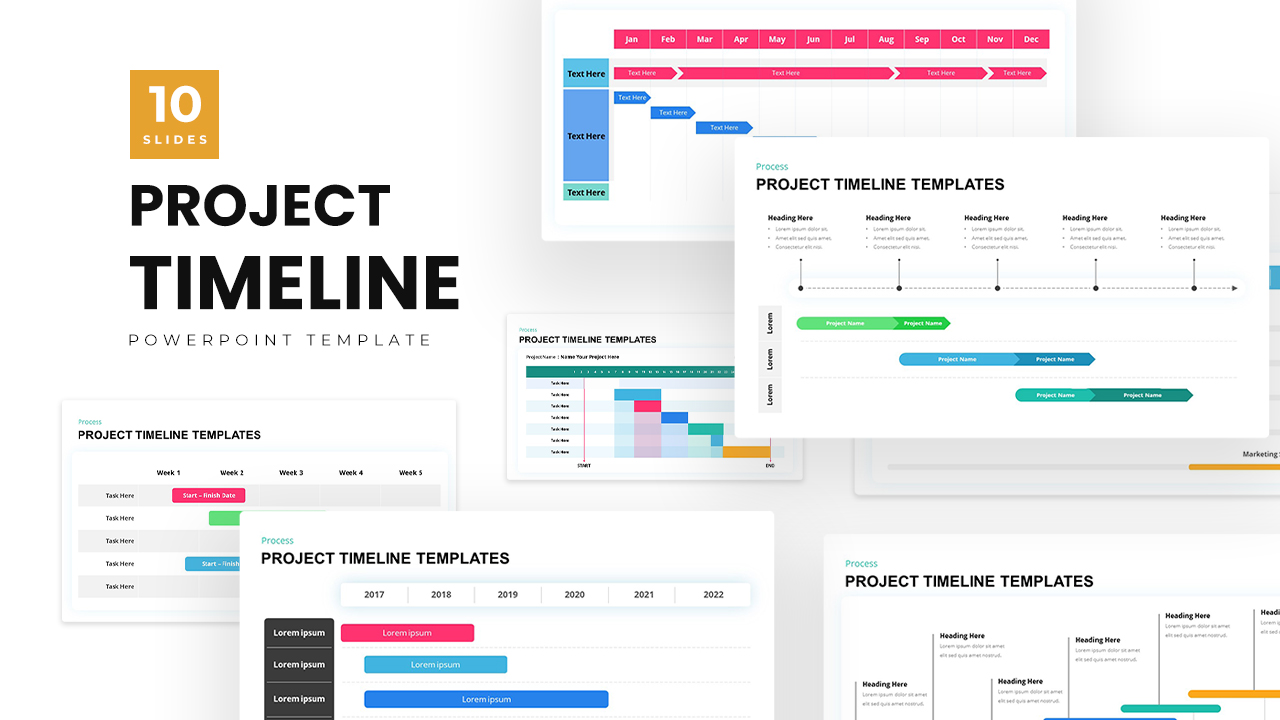
Project Timeline Template PowerPoint
Timeline PowerPoint Template
Premium
-
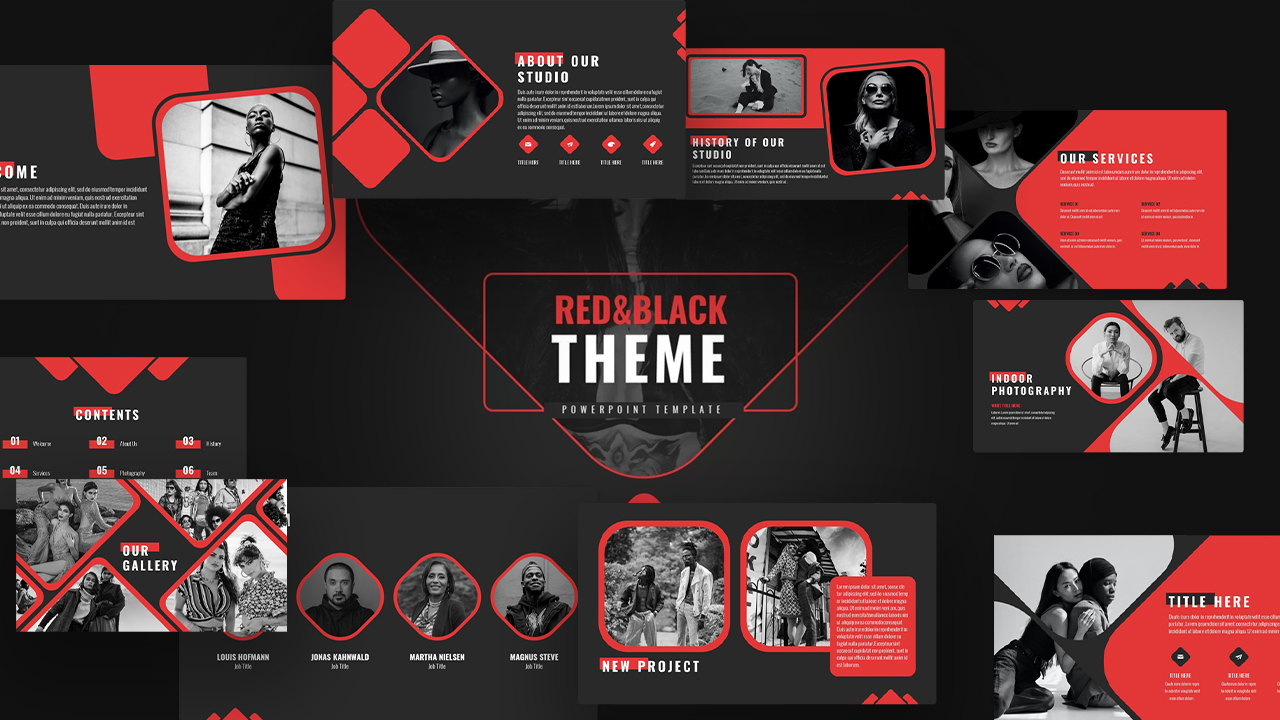
Red and Black PowerPoint Template
PowerPoint Templates
Premium
-
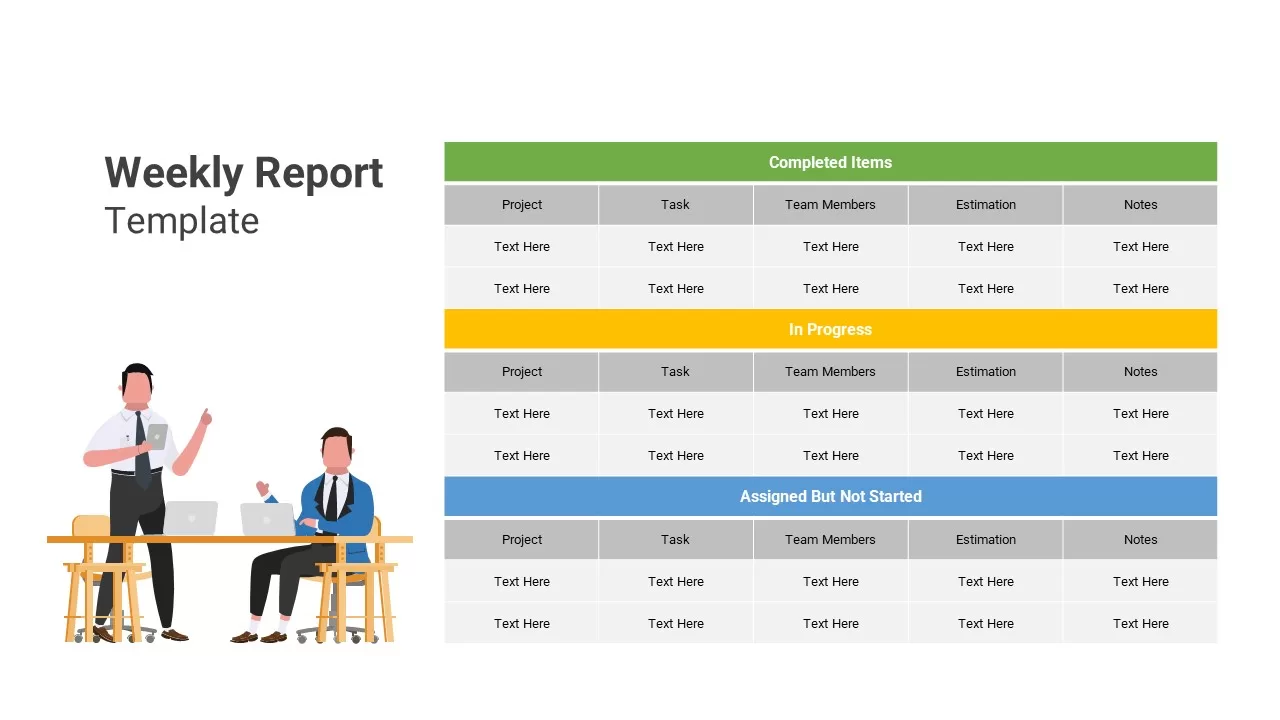
Weekly Report Template
PowerPoint Charts
Premium
-
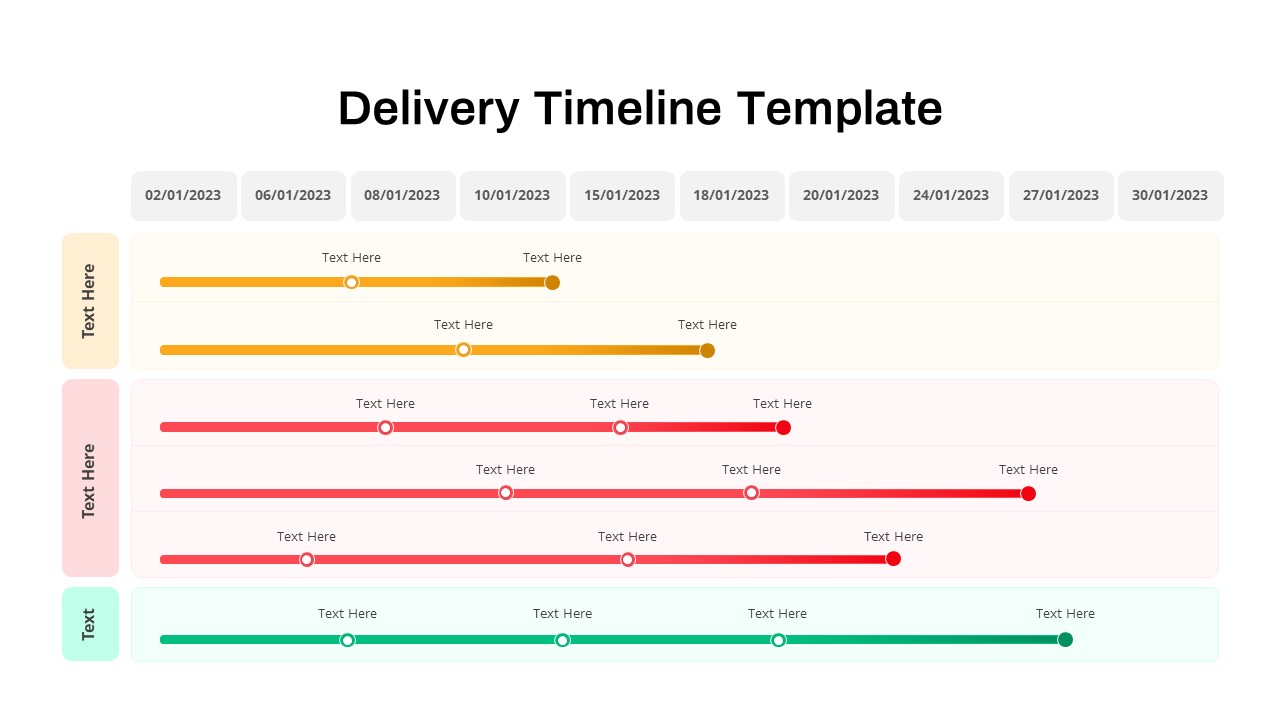
Delivery Timeline PowerPoint Template
PowerPoint Templates
Premium
-
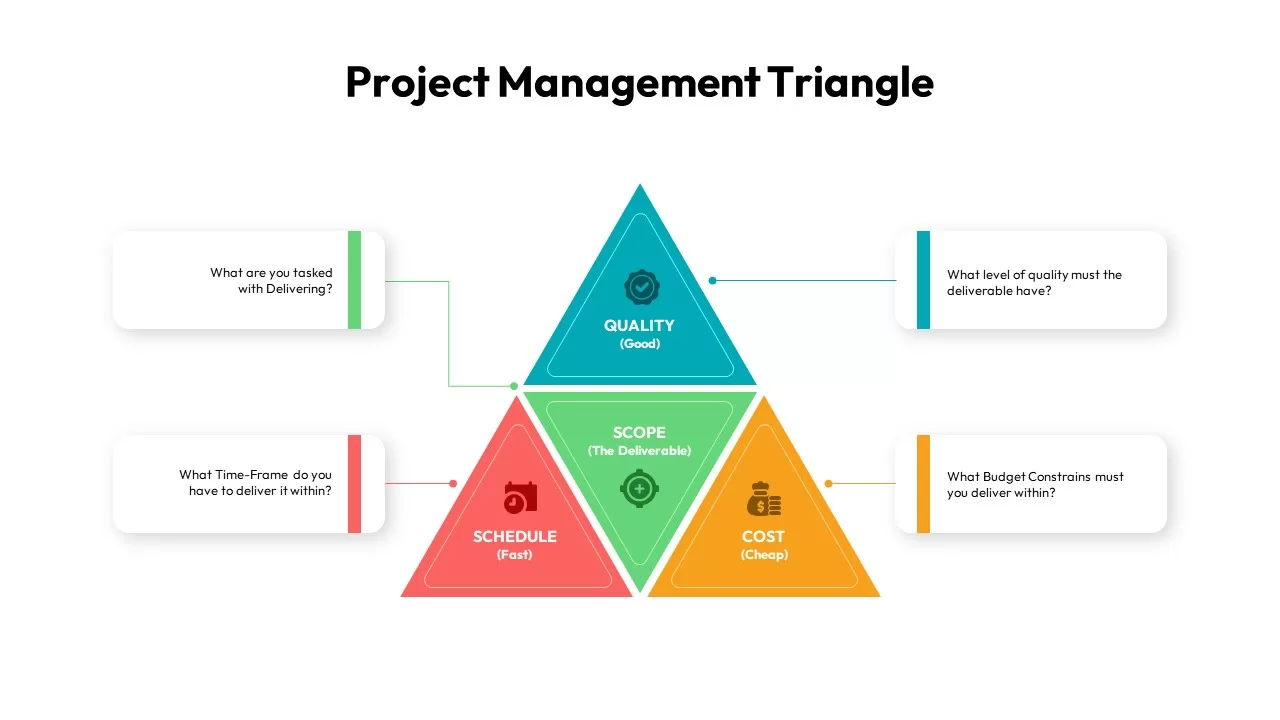
Project Management Triangle
PowerPoint Templates
Premium
-
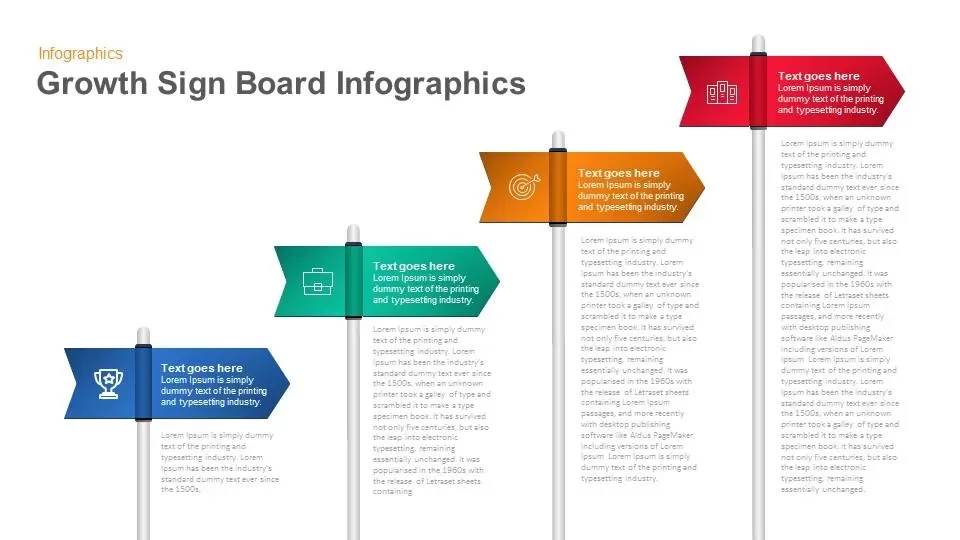
Infographic Growth Sign Board PowerPoint Template and Keynote Slide
Infographic
Premium
-
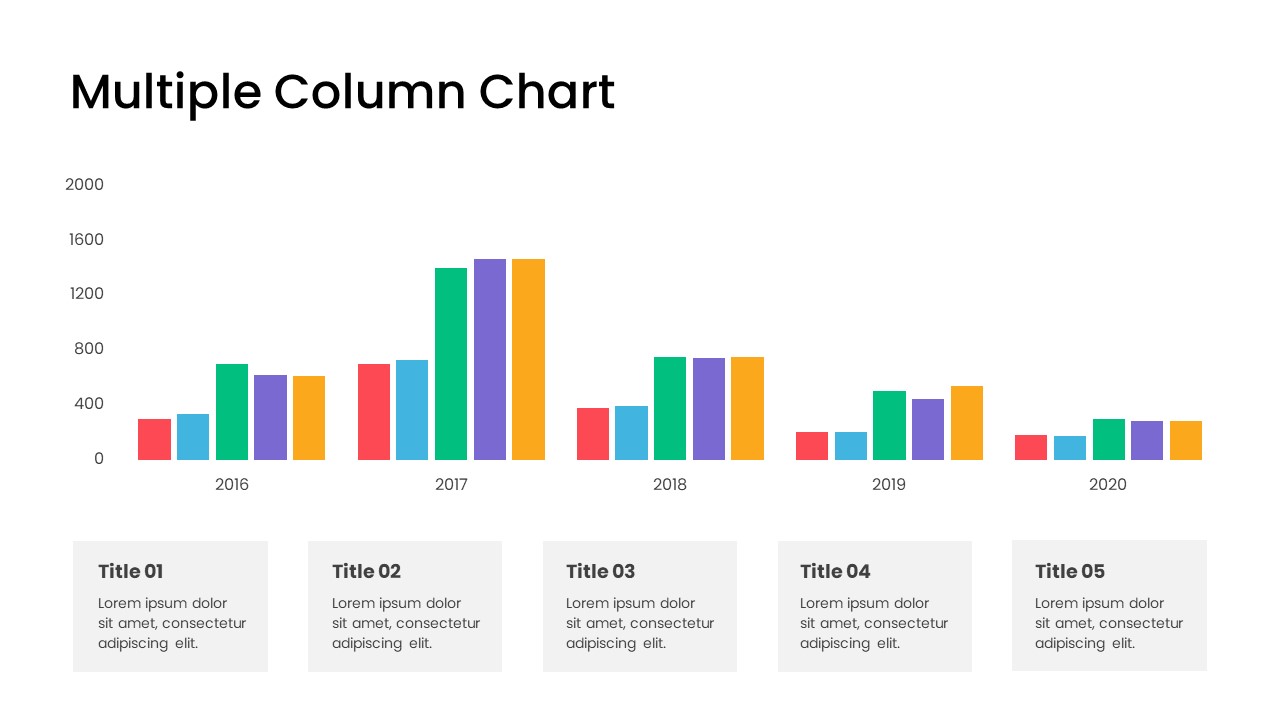
Multiple Column Chart PowerPoint Template
Column and Bar chart
Premium
-
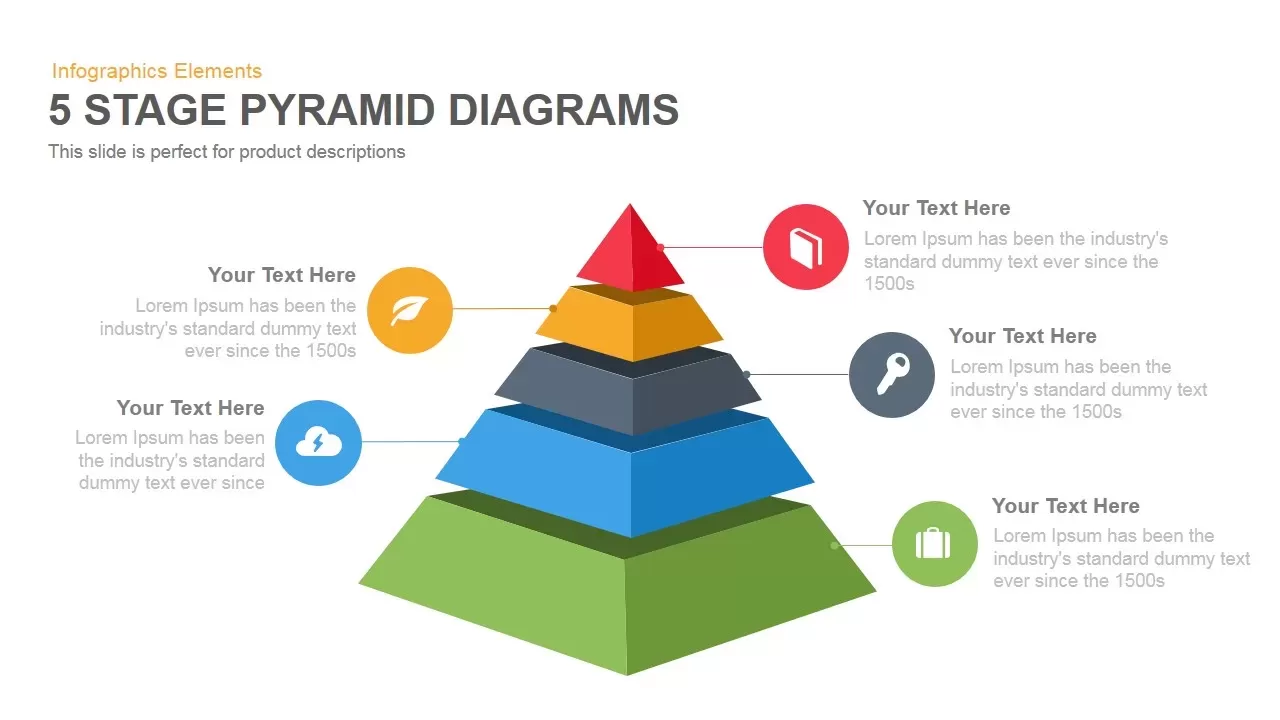
5 Stage Pyramid Diagrams PowerPoint Template and Keynote Slide
Pyramid
Premium
-
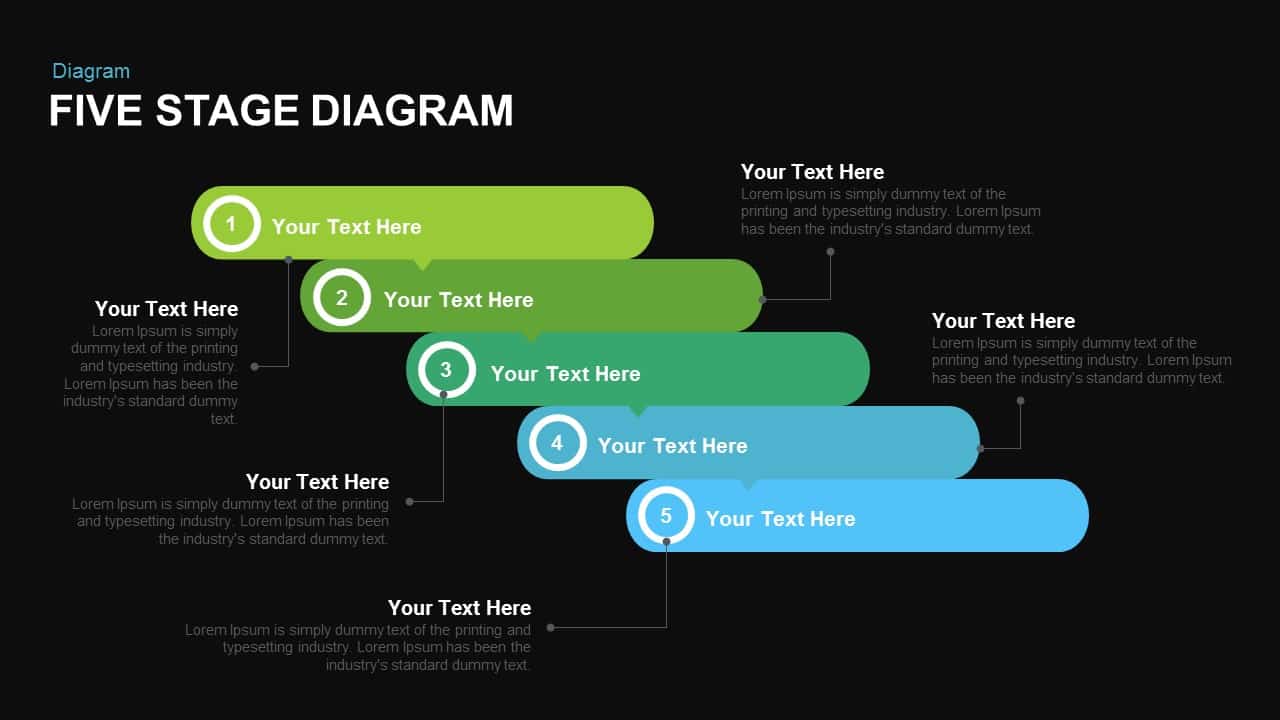
Five Stage Diagram PowerPoint Template and Keynote Slide
Diagrams
Premium
-
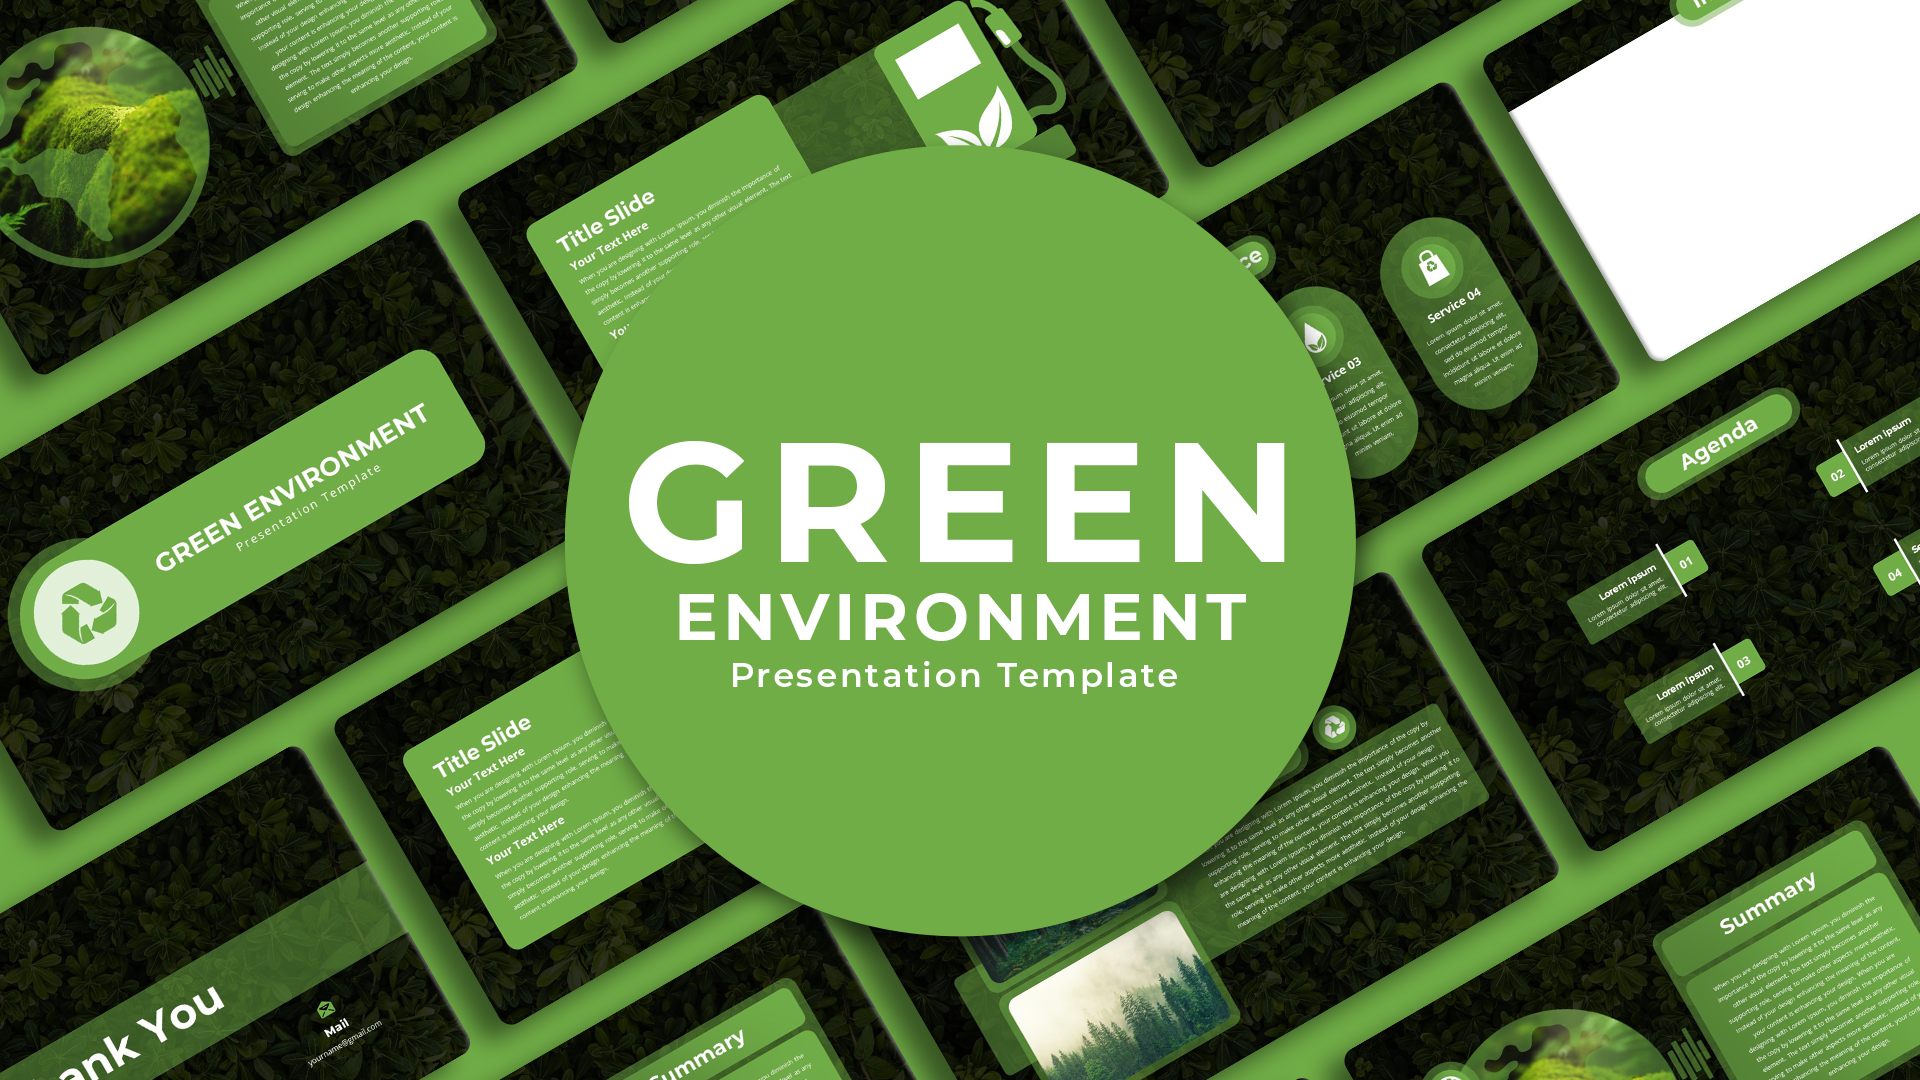
Green Environment PowerPoint Theme
PowerPoint Themes
Premium
-
Project Status Report PowerPoint Template
Text and Table
Premium
-
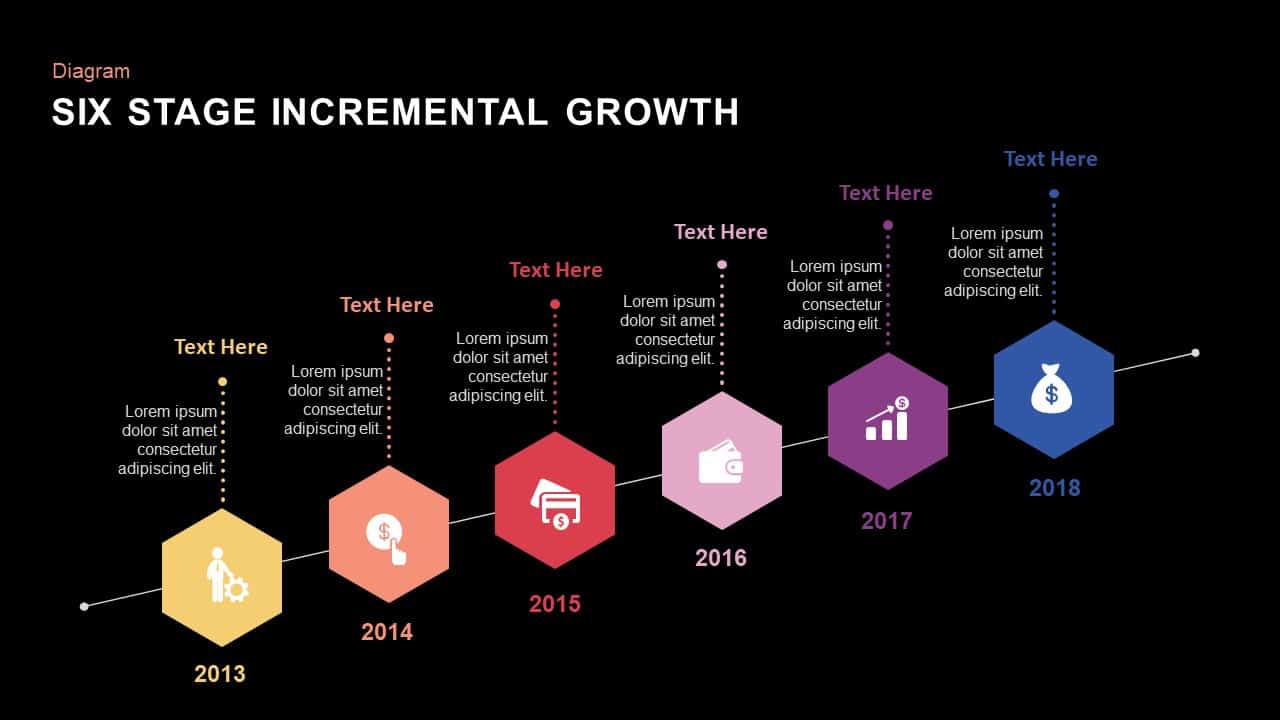
6 Stage Incremental Growth PowerPoint and Keynote Slides
Diagrams
Premium
-
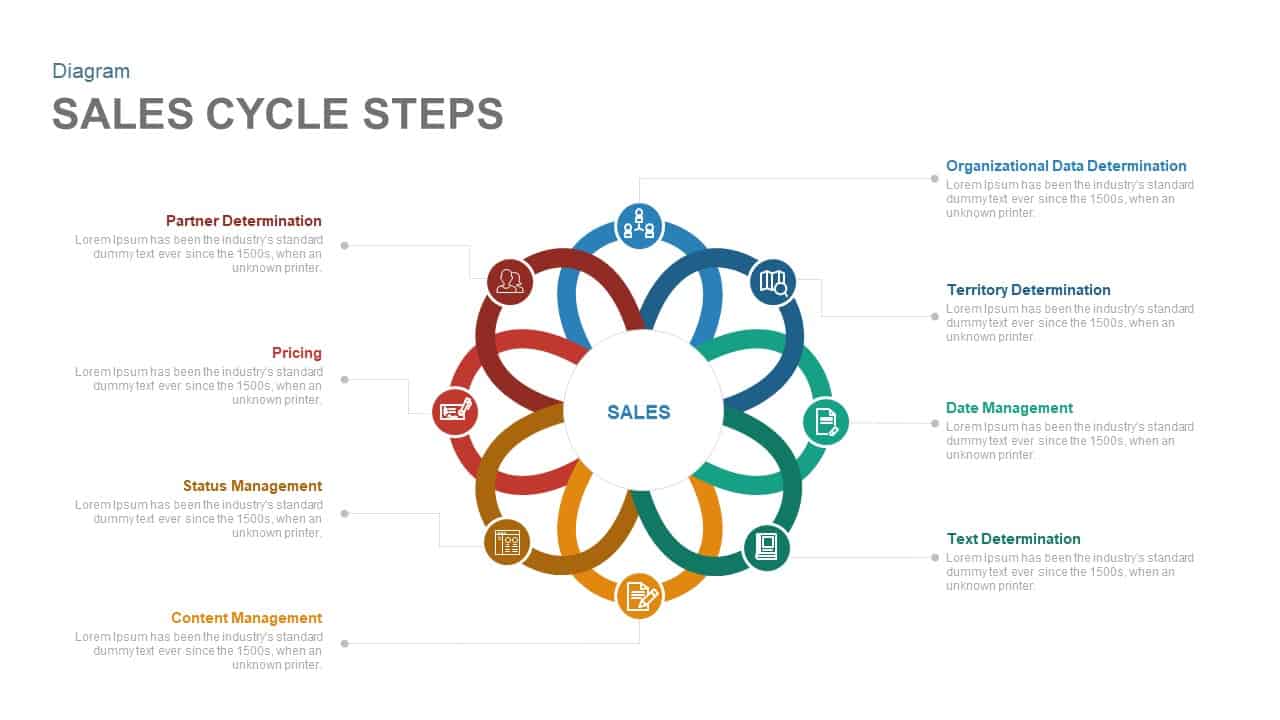
Sales Cycle Steps PowerPoint Template and Keynote Template
Circular Diagrams
Premium
-
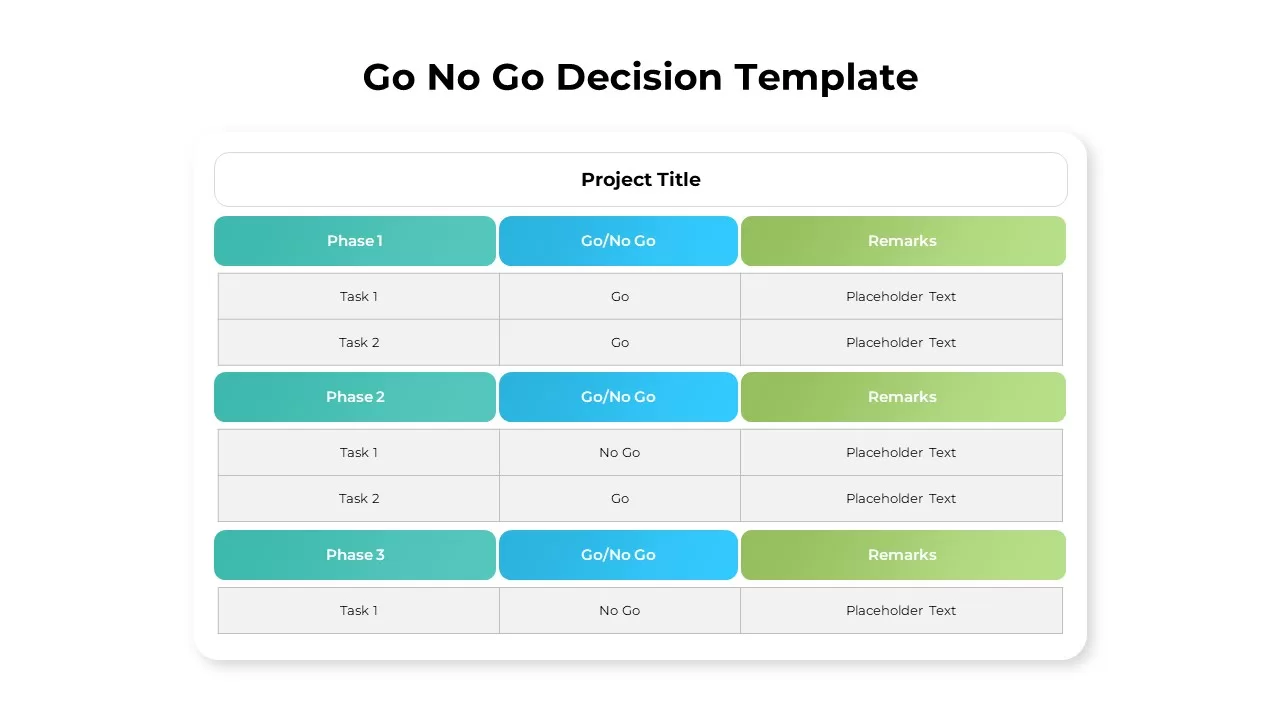
Go No Go Decision Template
Metaphor, Simile & Analogy
Premium
-
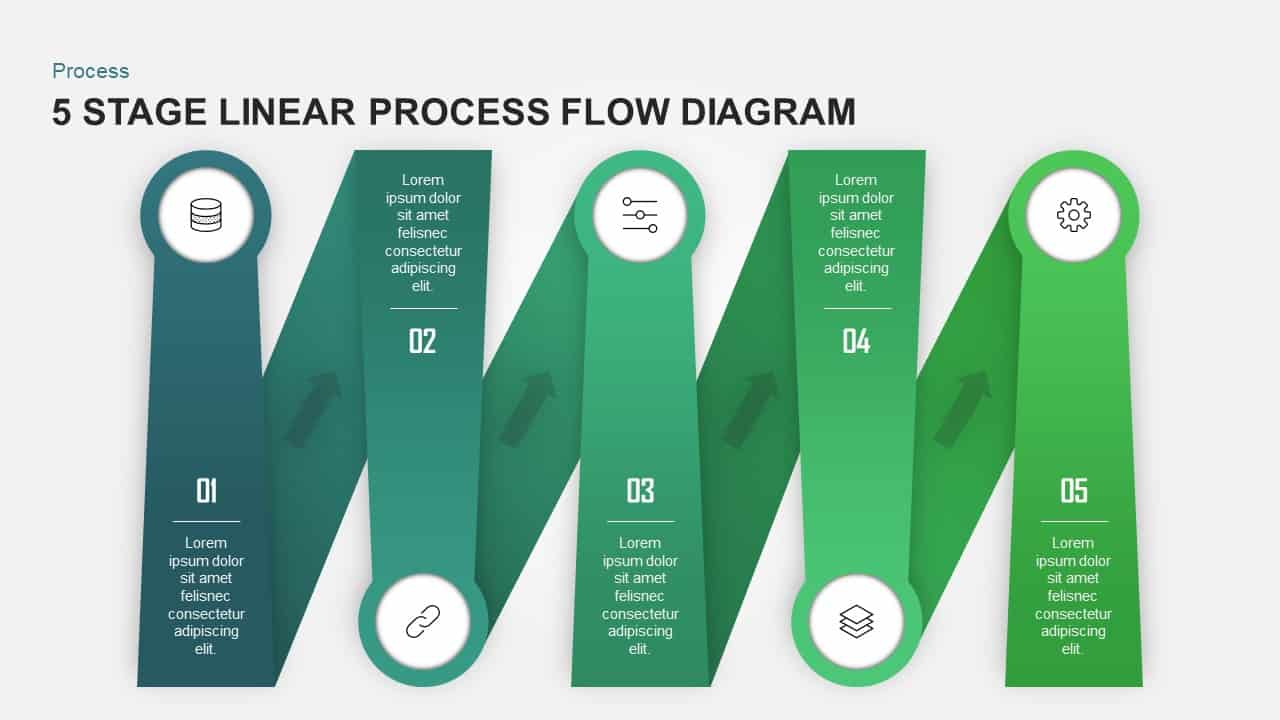
5 Stage Linear Process Flow Diagram for PowerPoint & Keynote
Process Flow Diagrams
Premium
-
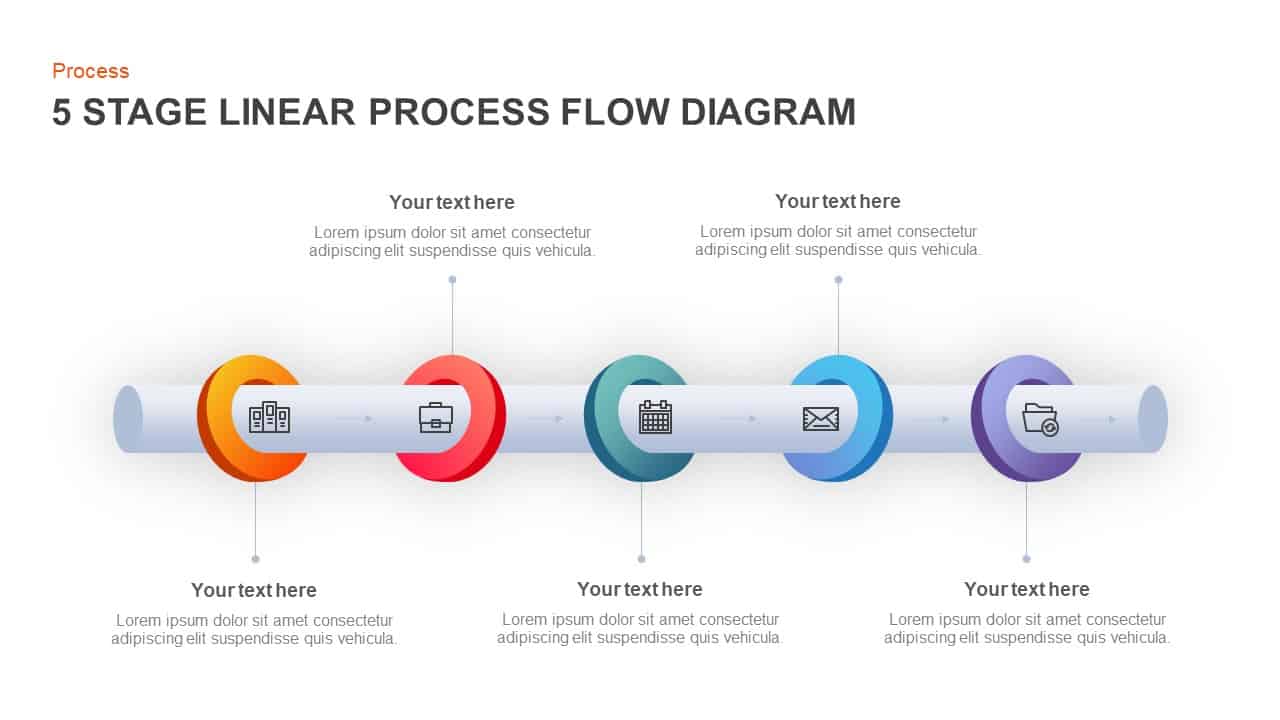
5 Stage Linear Process Diagram for PowerPoint and Keynote
Process Flow Diagrams
Premium
-
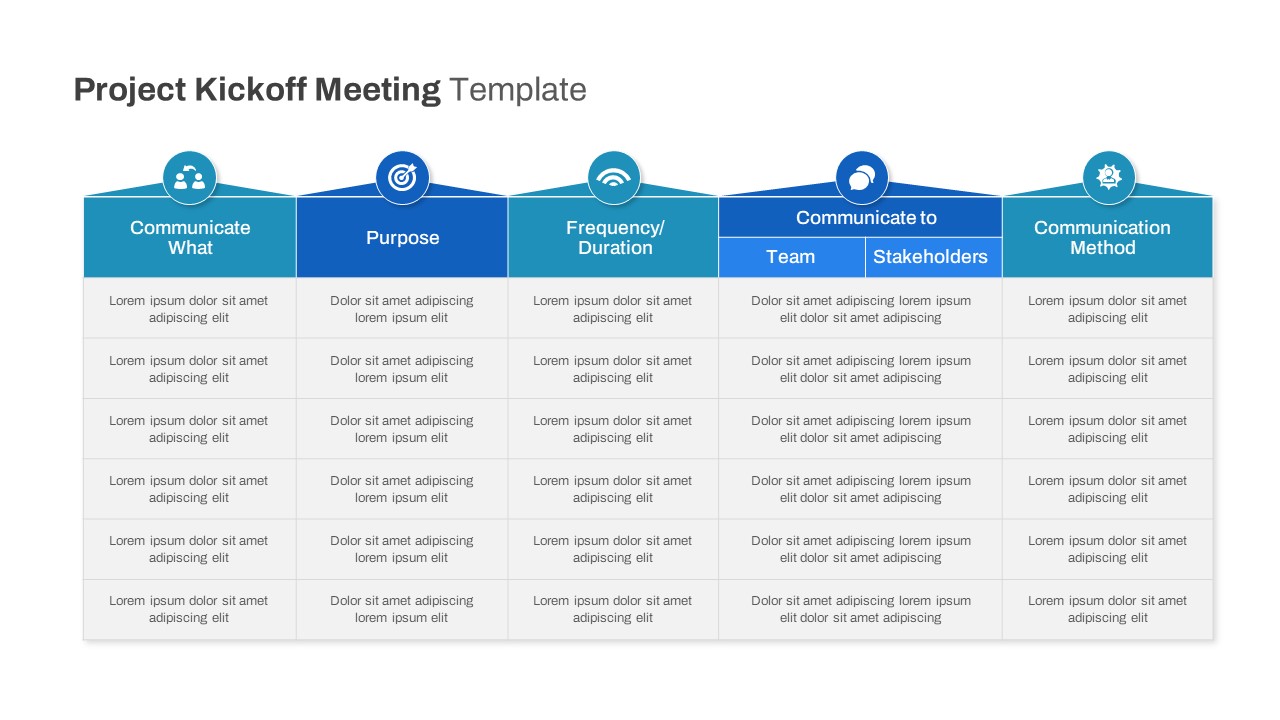
Free Project Kickoff Meeting Template PowerPoint
Free PowerPoint Templates
Free
-
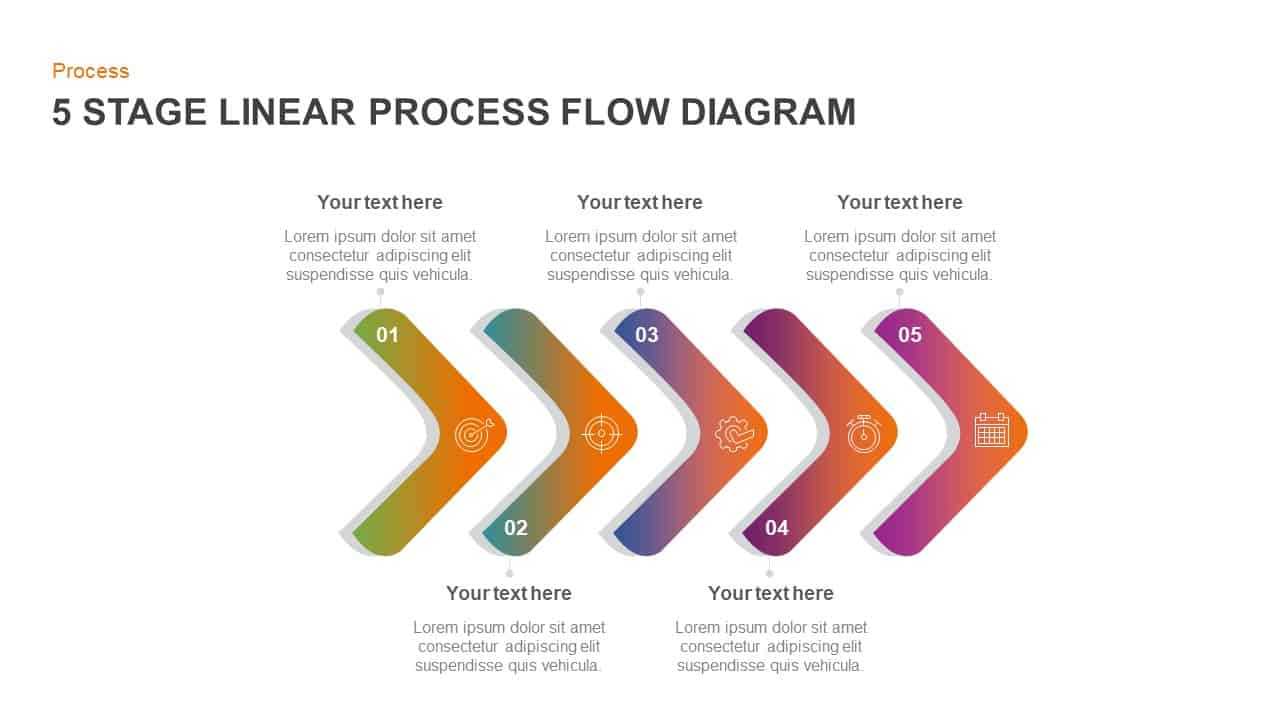
5 Stage Linear Process Flow Diagram for Business Presentation
Process Flow Diagrams
Premium
-
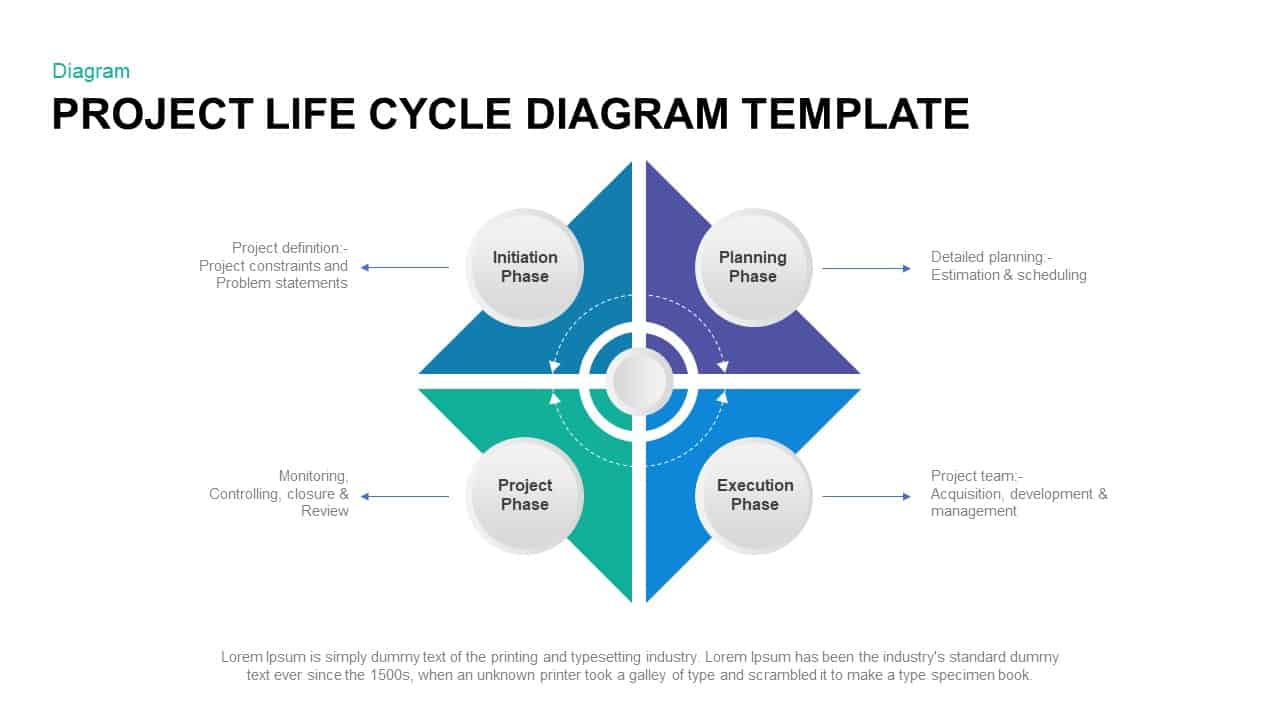
Project Life Cycle Diagram Template
Business Models
Premium
-
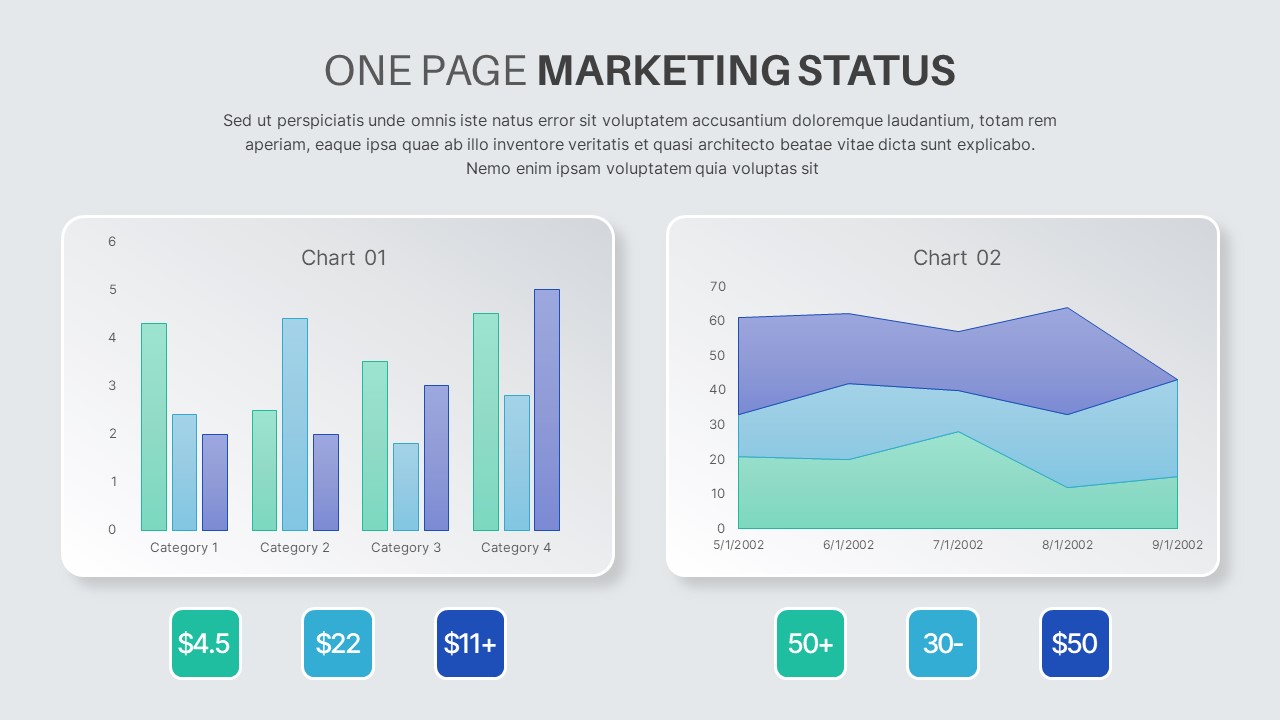
One Pager Marketing Status PowerPoint Template
PowerPoint Templates
Premium
-
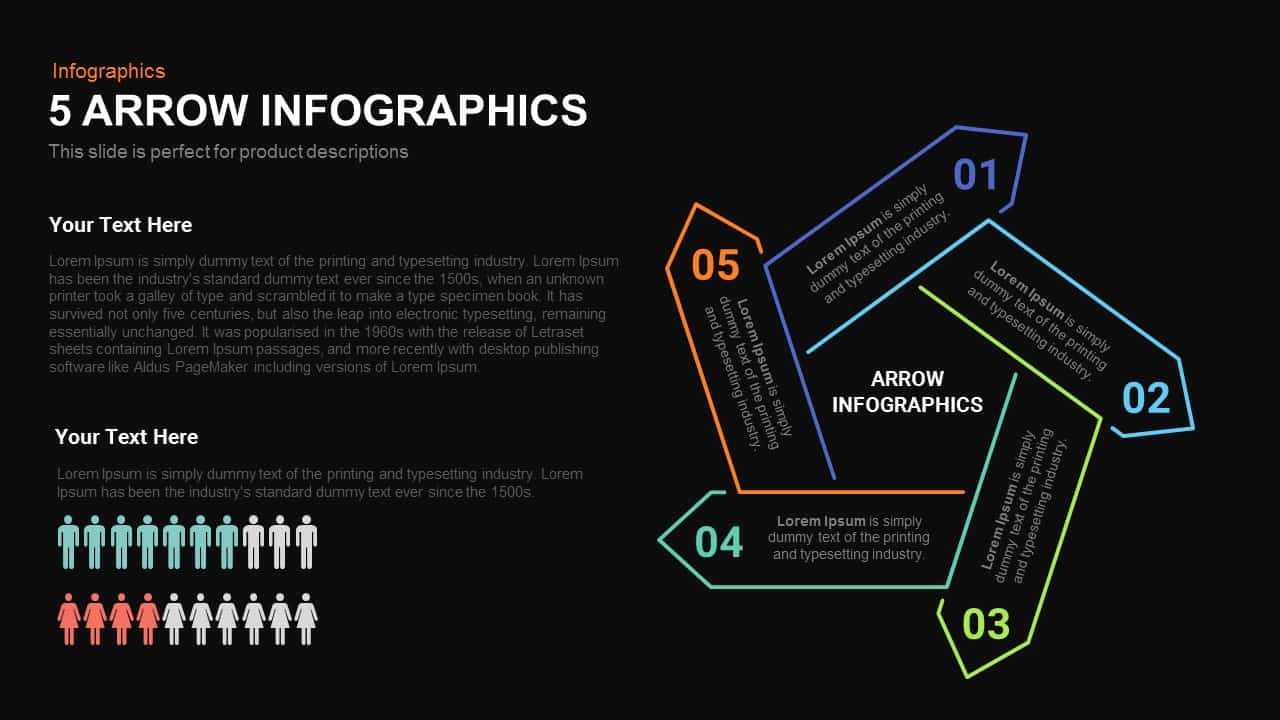
5 Infographics Arrow PowerPoint Template and Keynote Slide
Circular Diagrams
Premium
-
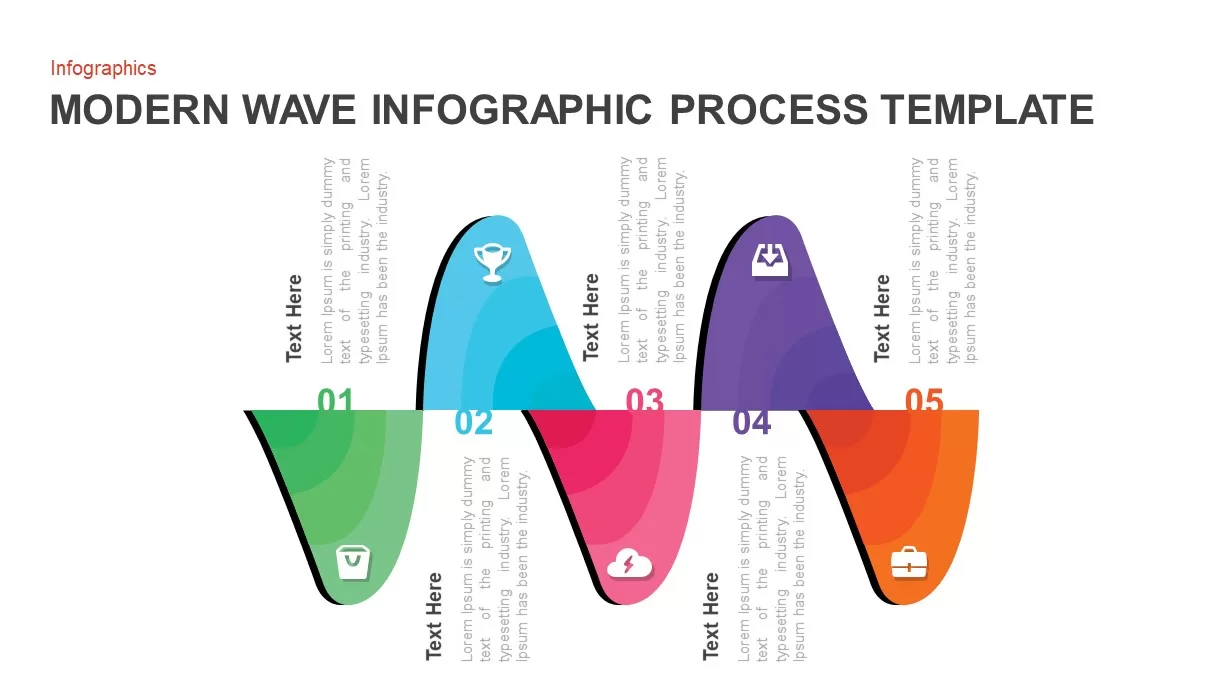
Modern Wave Infographic Process Template
Process Flow Diagrams
Premium
-
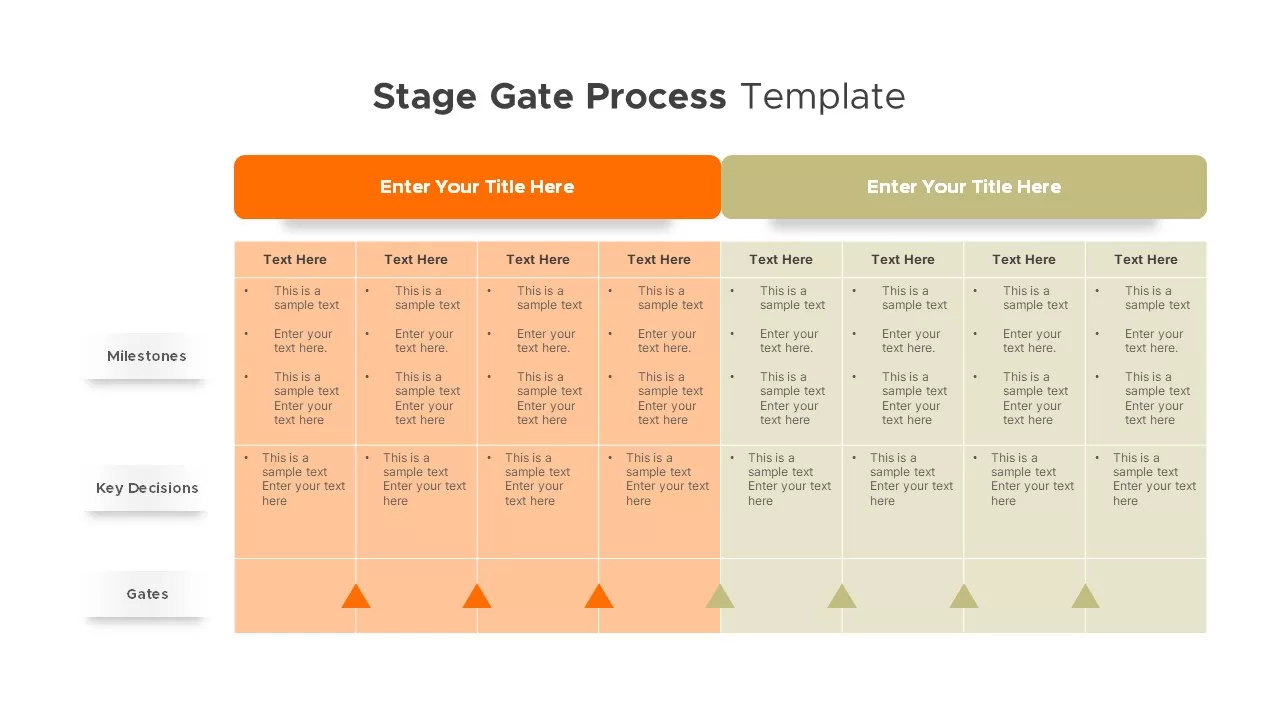
Stage Gate Process Template
PowerPoint Templates
Premium
-
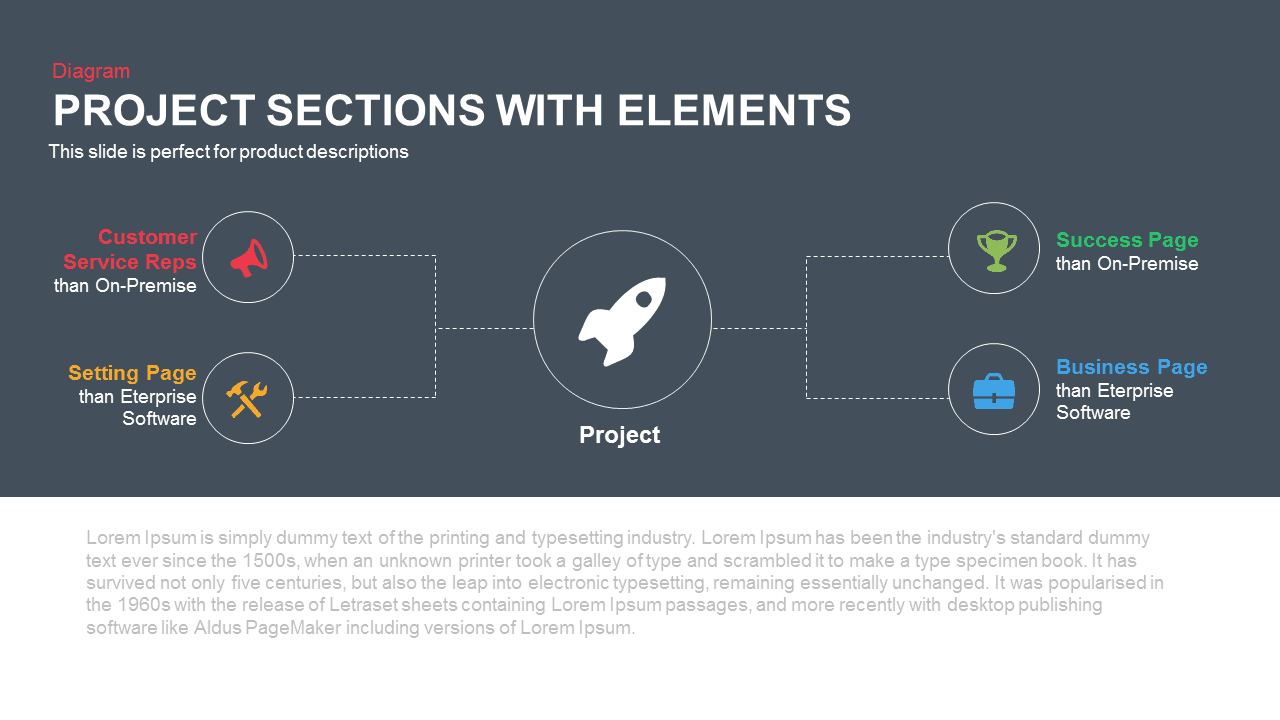
Project Sections with Elements PowerPoint Template and Keynote
Business Models
Premium
-
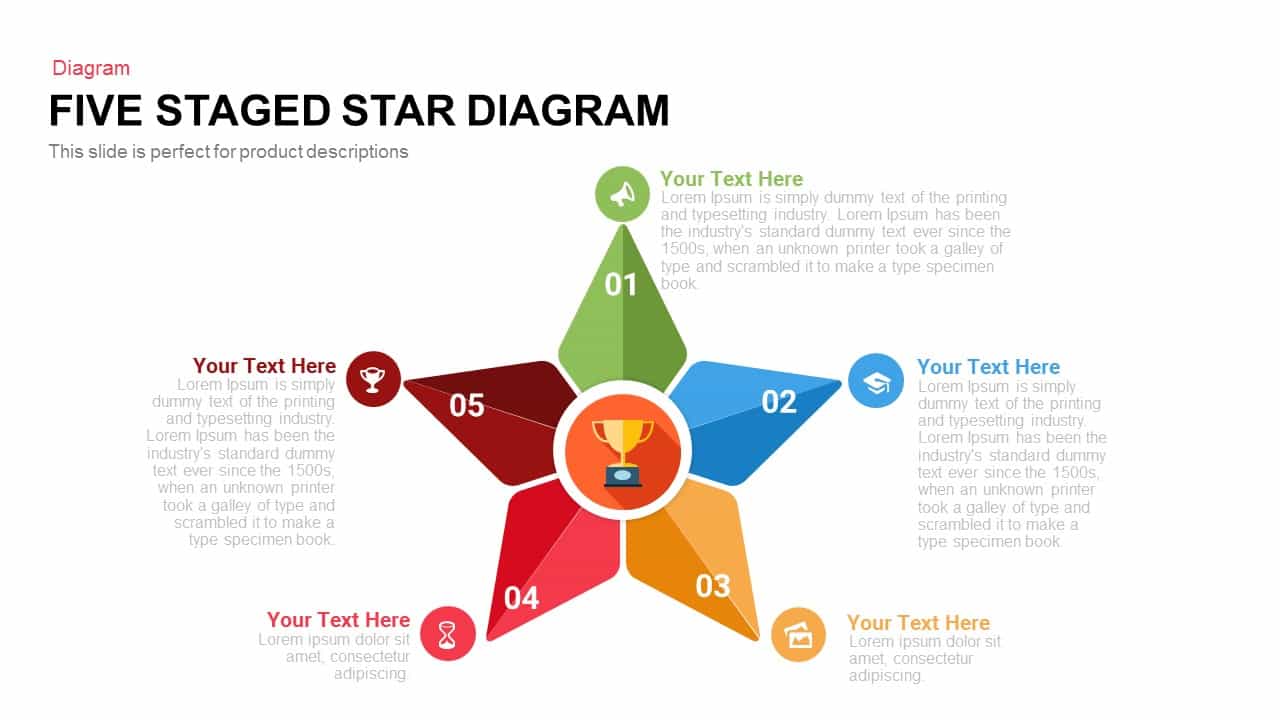
Five Staged Star Diagram Template for Powerpoint and Keynote template
Diagrams
Premium
-
Red Presentation Template
PowerPoint Templates
Premium
-
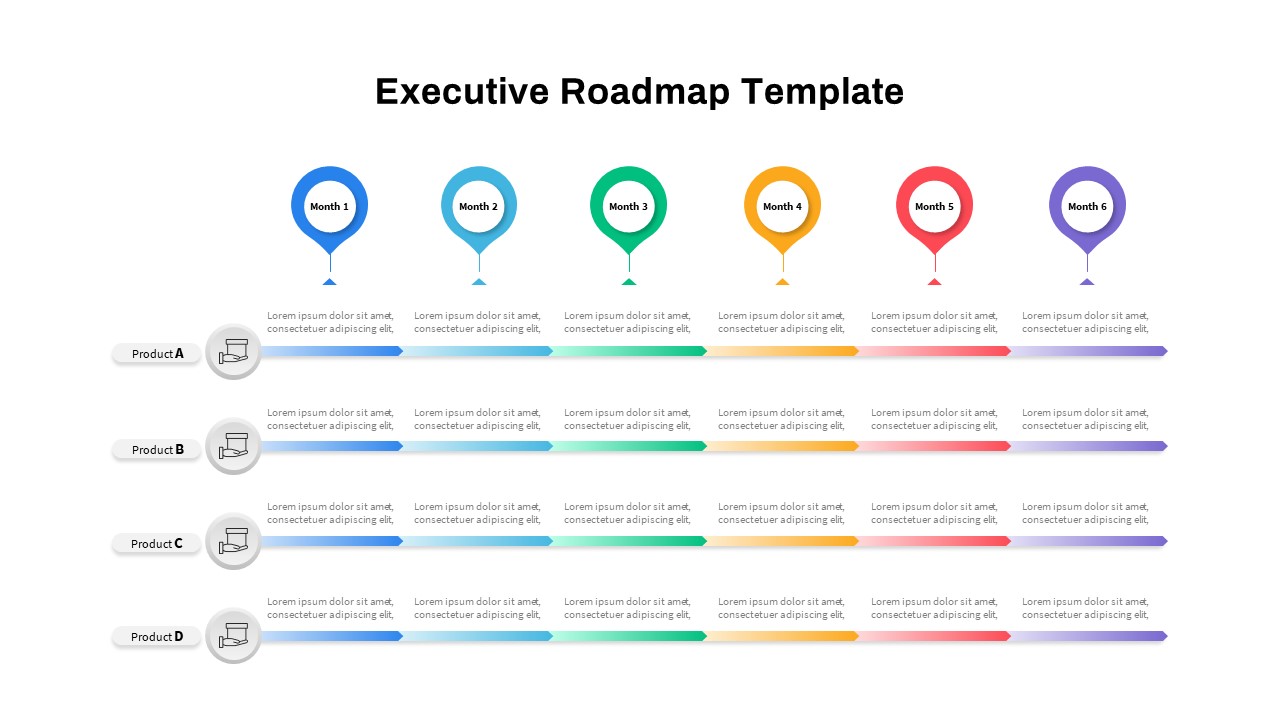
Executive Roadmap PowerPoint Template
PowerPoint Templates
Premium
-
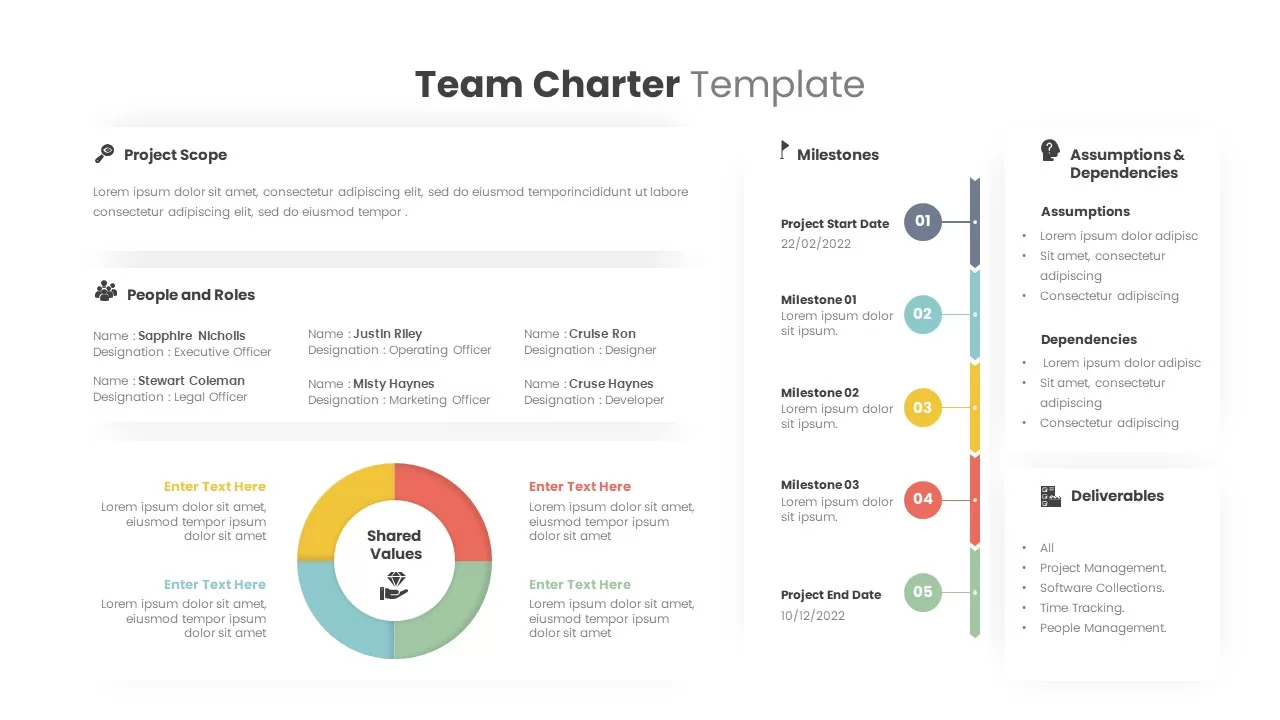
Team Charter Template
Text and Table
Premium
-
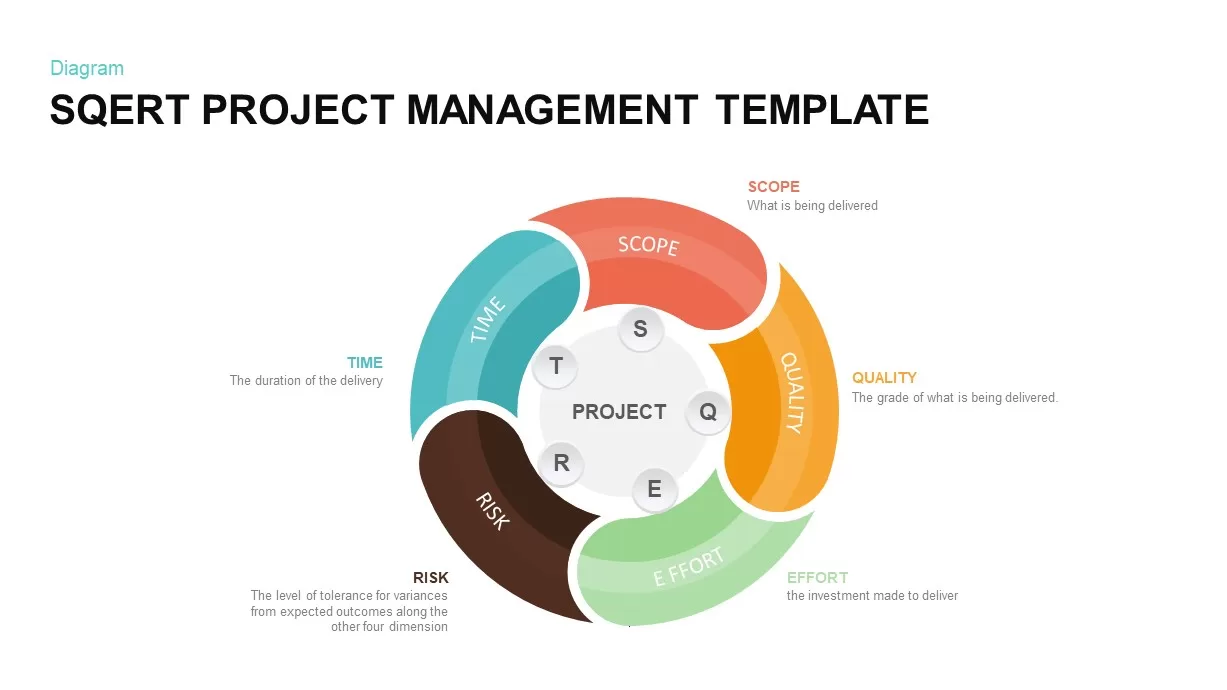
SQERT Project Management Model Template
PowerPoint Templates
Premium
-
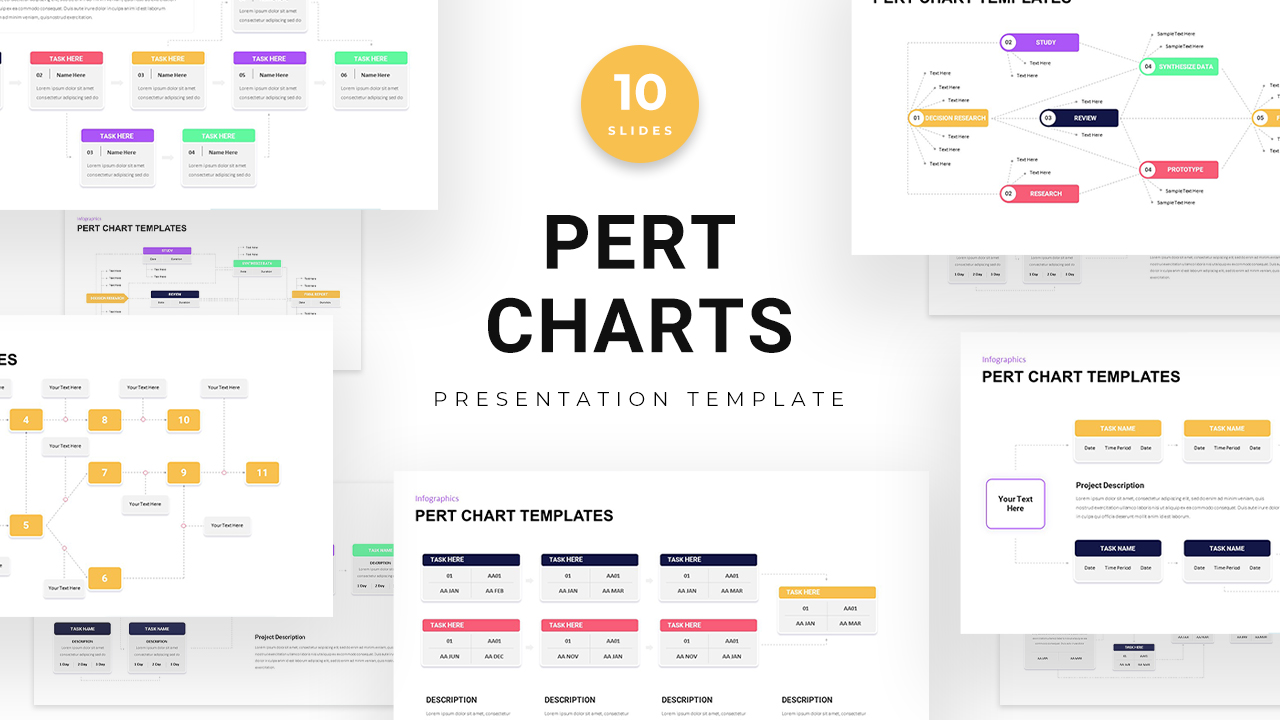
Pert Chart PowerPoint Templates
Diagrams
Premium
-
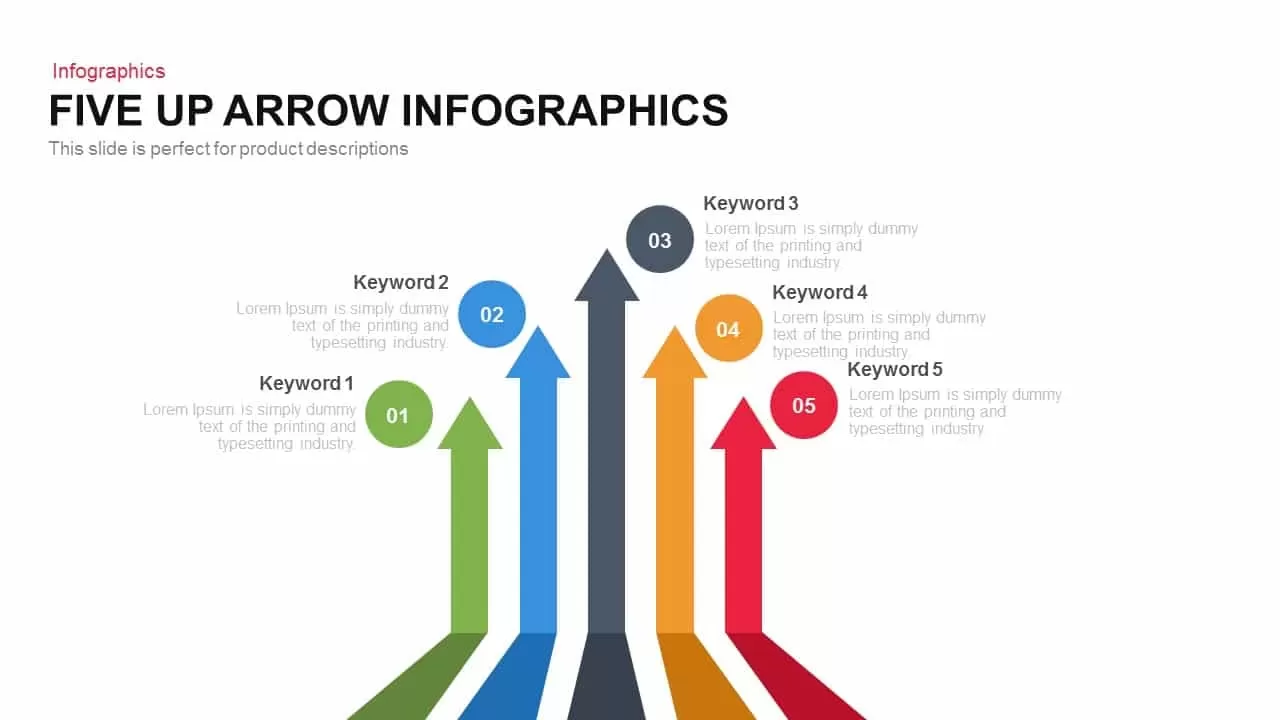
Five Up Infographic Arrow PowerPoint Template and Keynote Slide
Arrow Diagrams
Premium
-
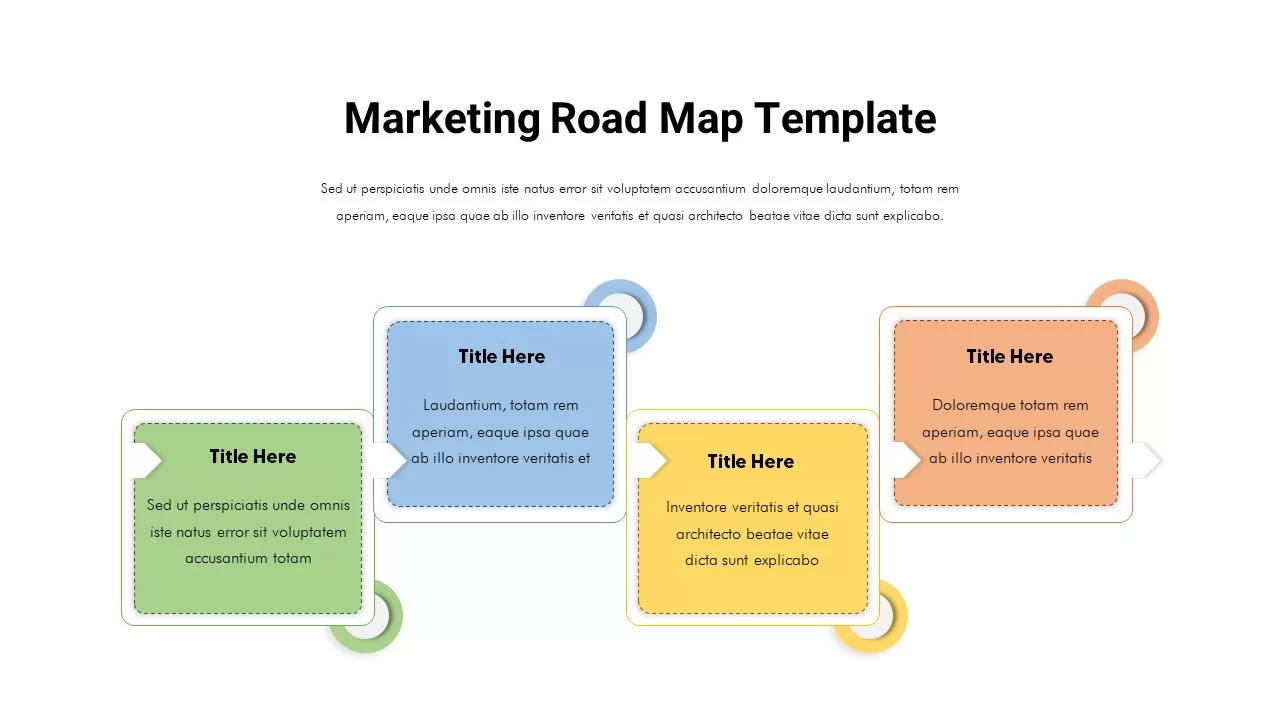
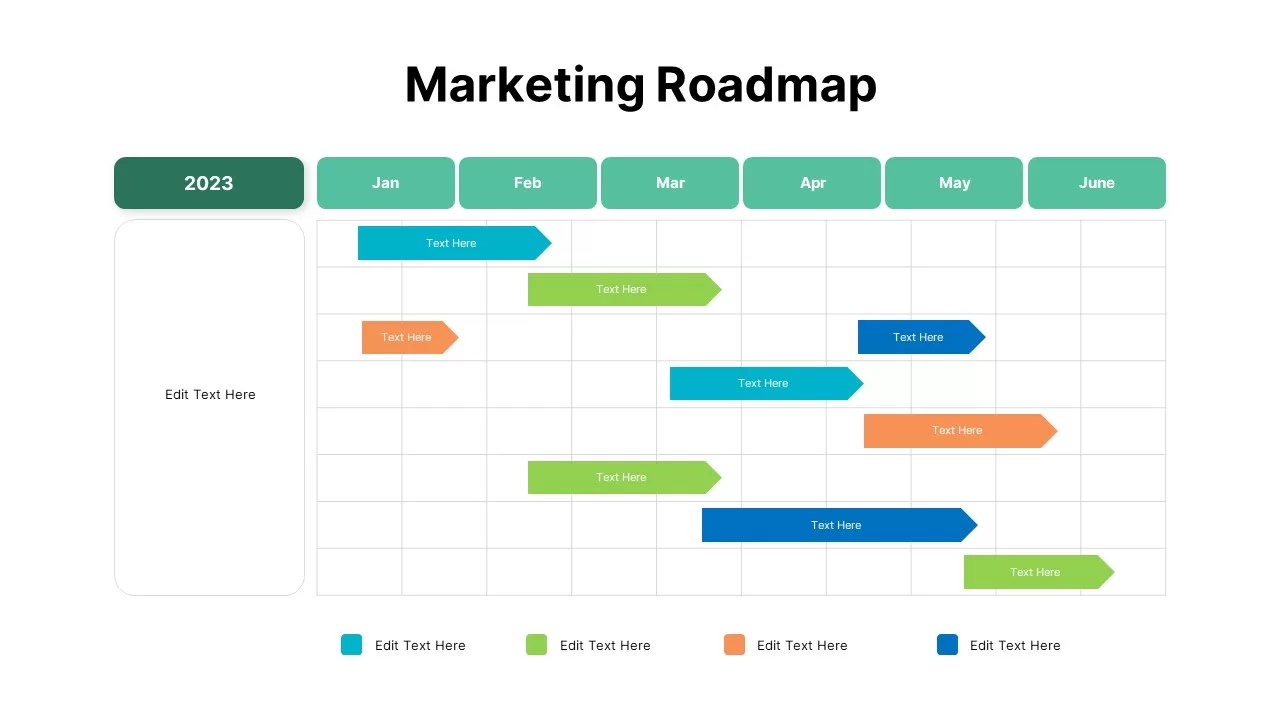
Marketing Roadmap PowerPoint Template
PowerPoint Templates
Premium
-
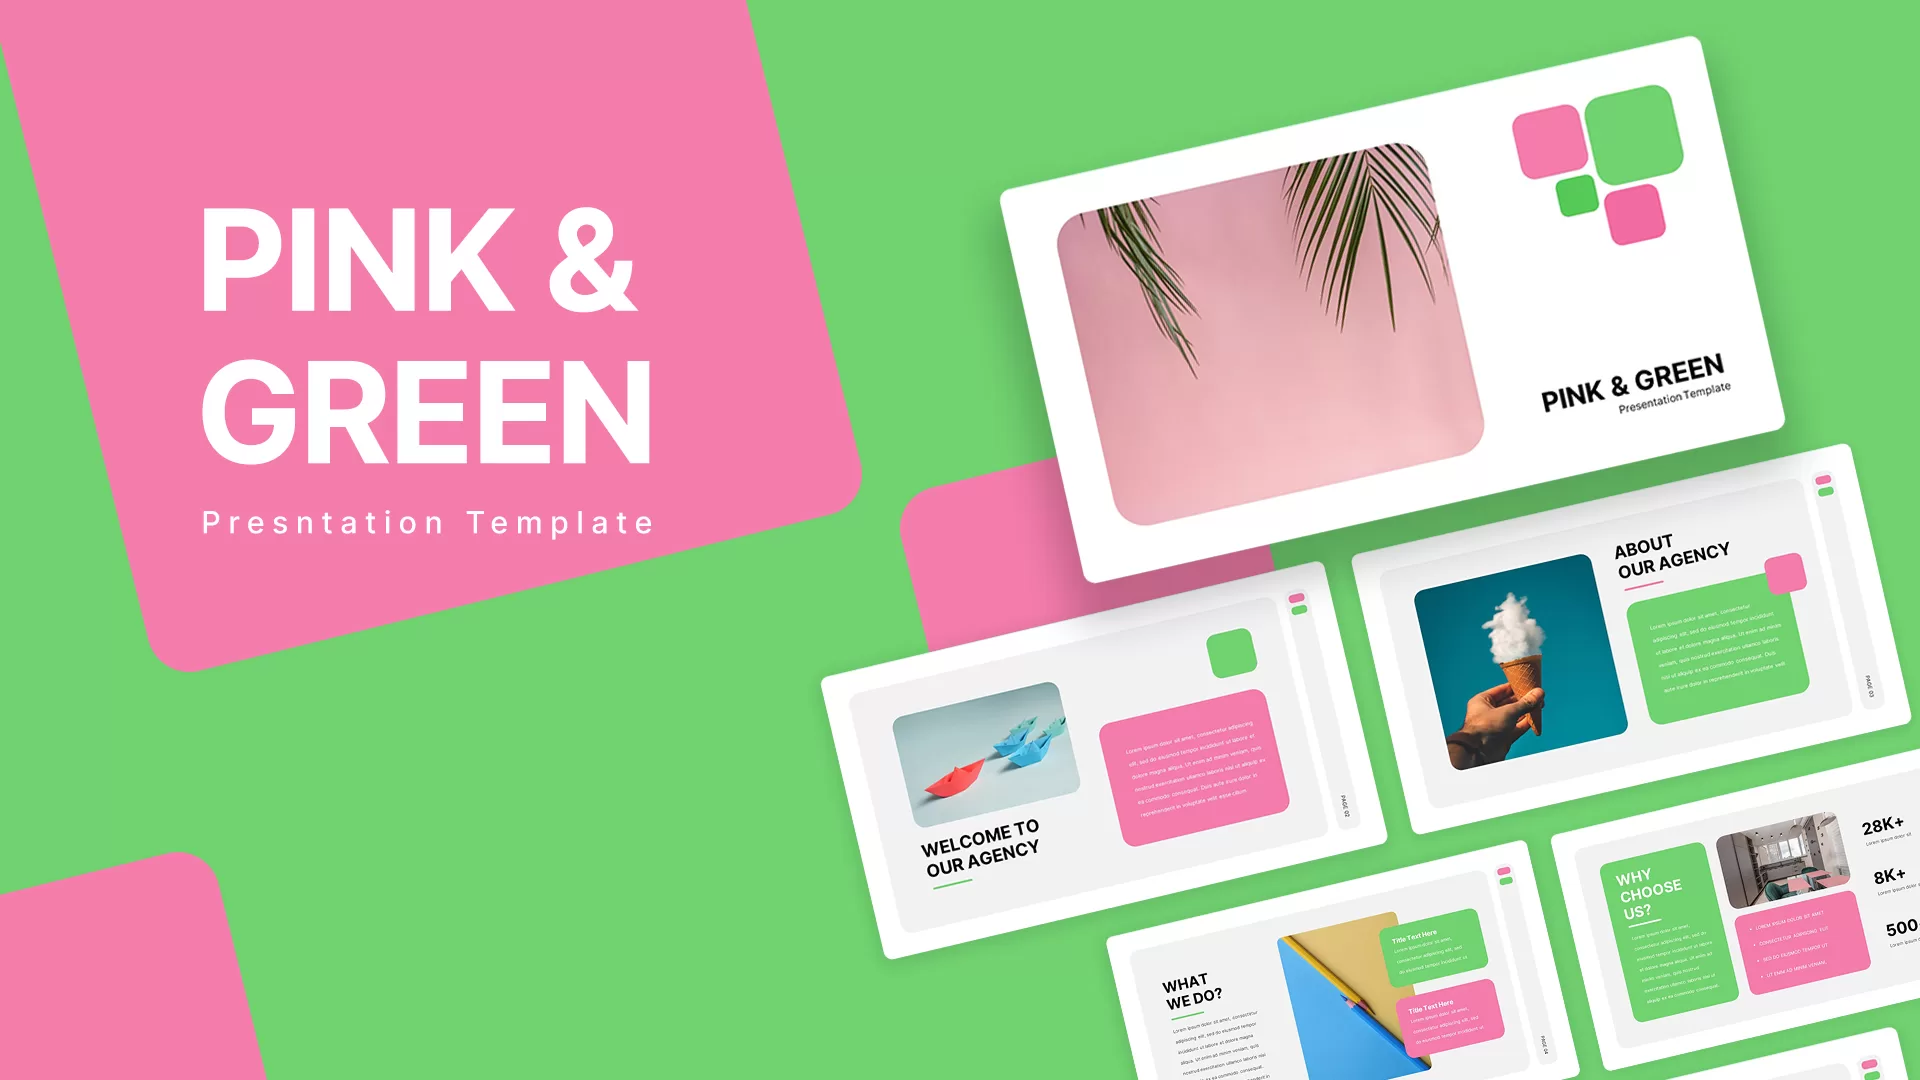
Pink And Green Presentation Template
PowerPoint Business Templates
Premium
-
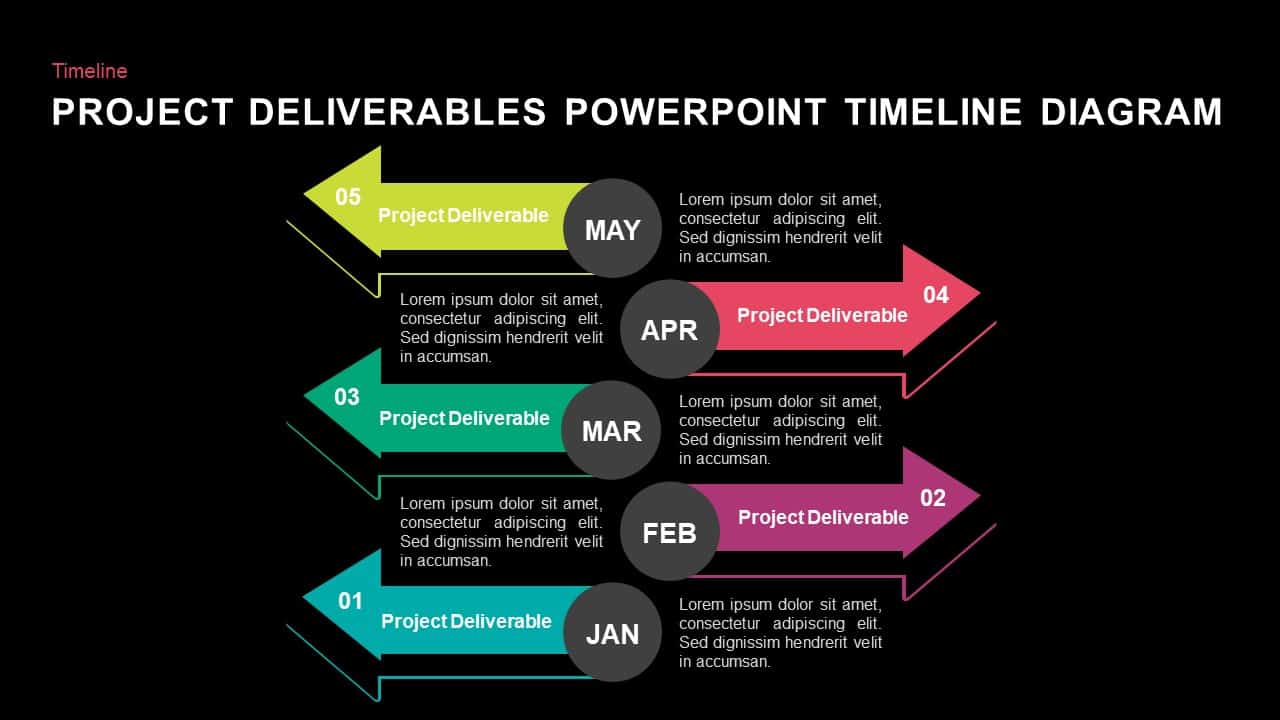
Project Deliverables Timeline Diagram PowerPoint Template and Keynote Slide
Timeline PowerPoint Template
Premium
-
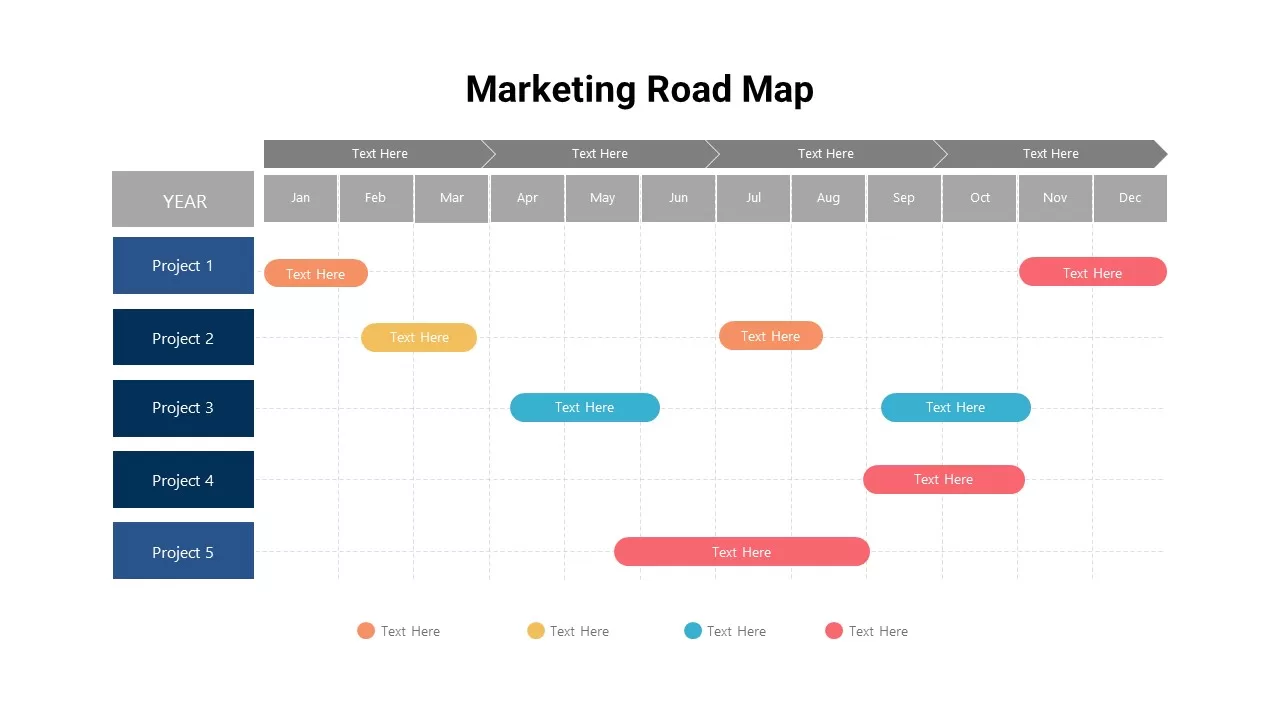
Marketing Roadmap Template
PowerPoint Charts
Premium
-
Marketing Roadmap Template
PowerPoint Templates
Premium
-
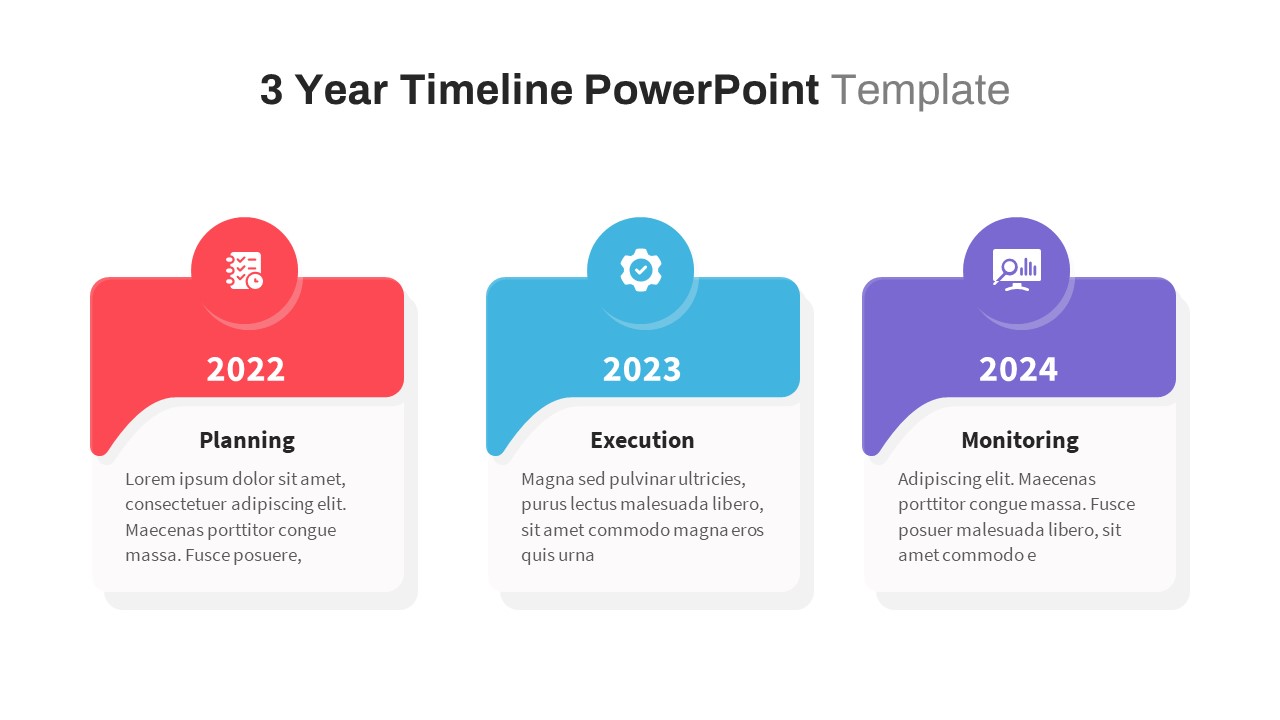
3 Year Timeline PowerPoint Template
PowerPoint Templates
Premium
-
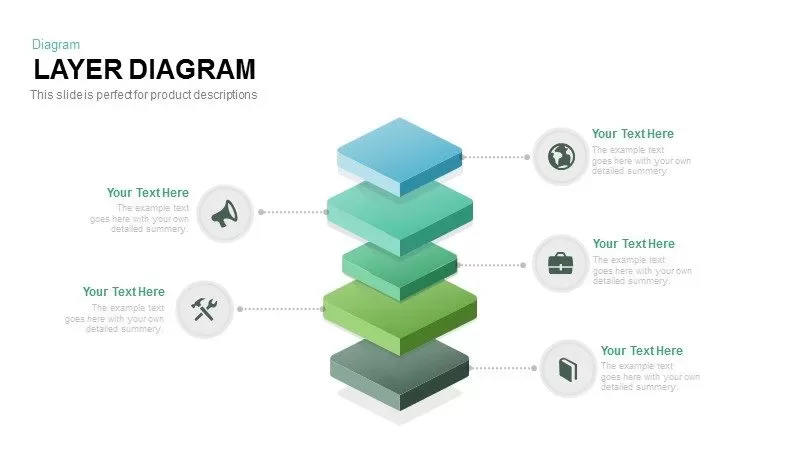
Layer Diagram PowerPoint Template and Keynote Slide
Diagrams
Premium
-
5 Stage Linear Process Flow Diagram Template for PowerPoint and Keynote
Process Flow Diagrams
Premium
-
Project Intake Process Template PowerPoint
PowerPoint Templates
Premium
-
Five Sections Ribbon PowerPoint Template and Keynote Slide
Diagrams
Premium
-
Gear Process Diagram PowerPoint Template and Keynote
Business Models
Premium
-
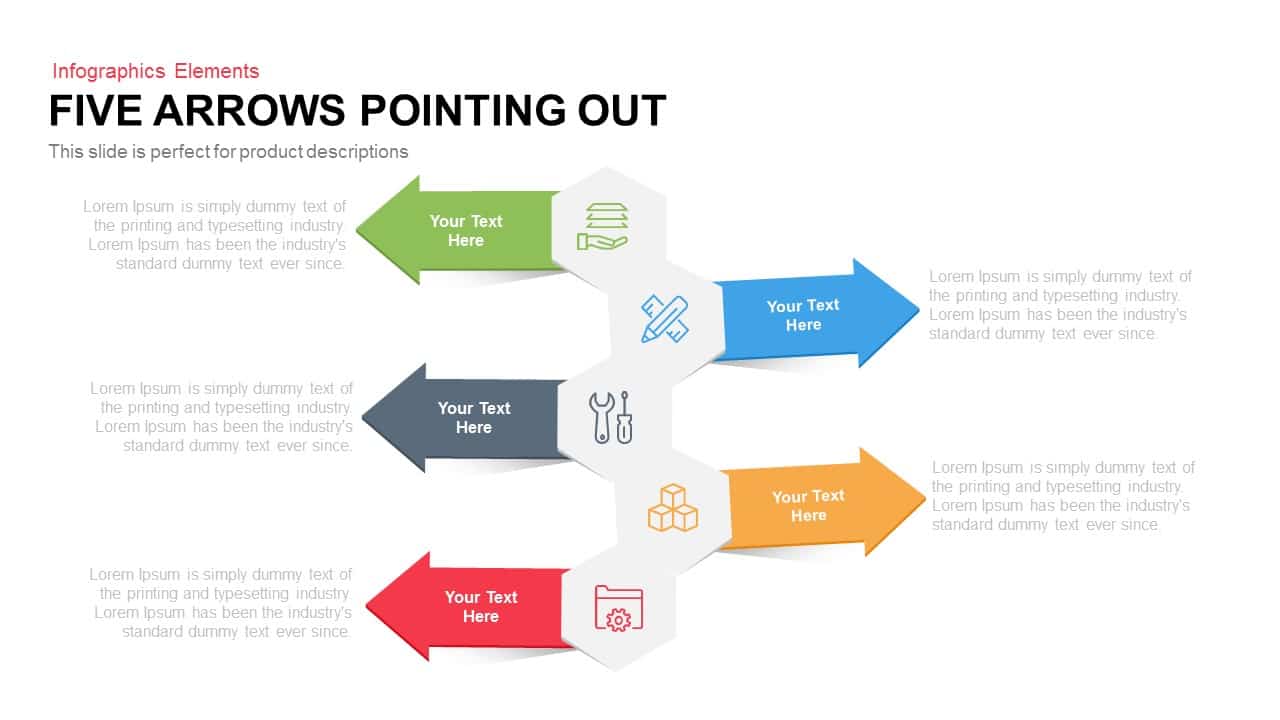
5 Arrows Pointing Out Template for PowerPoint and Keynote
Arrow Diagrams
Premium
-
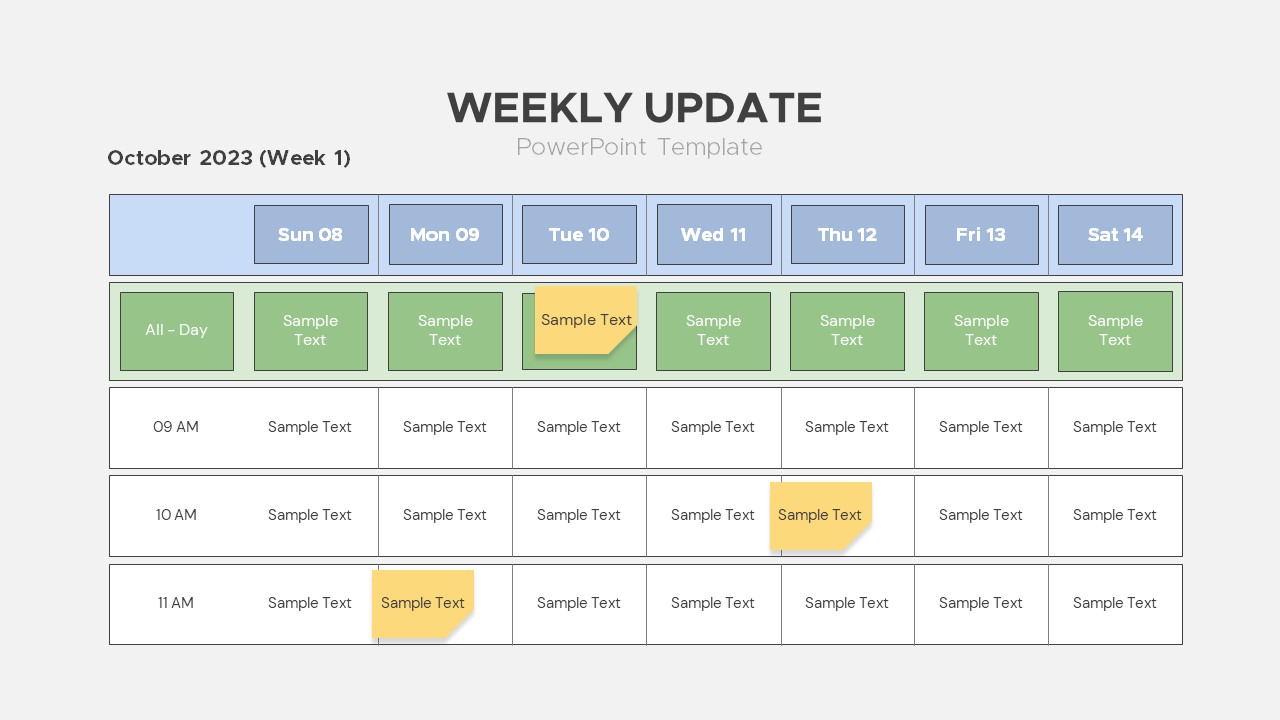
Weekly Update PowerPoint Template
PowerPoint Charts
Premium
-
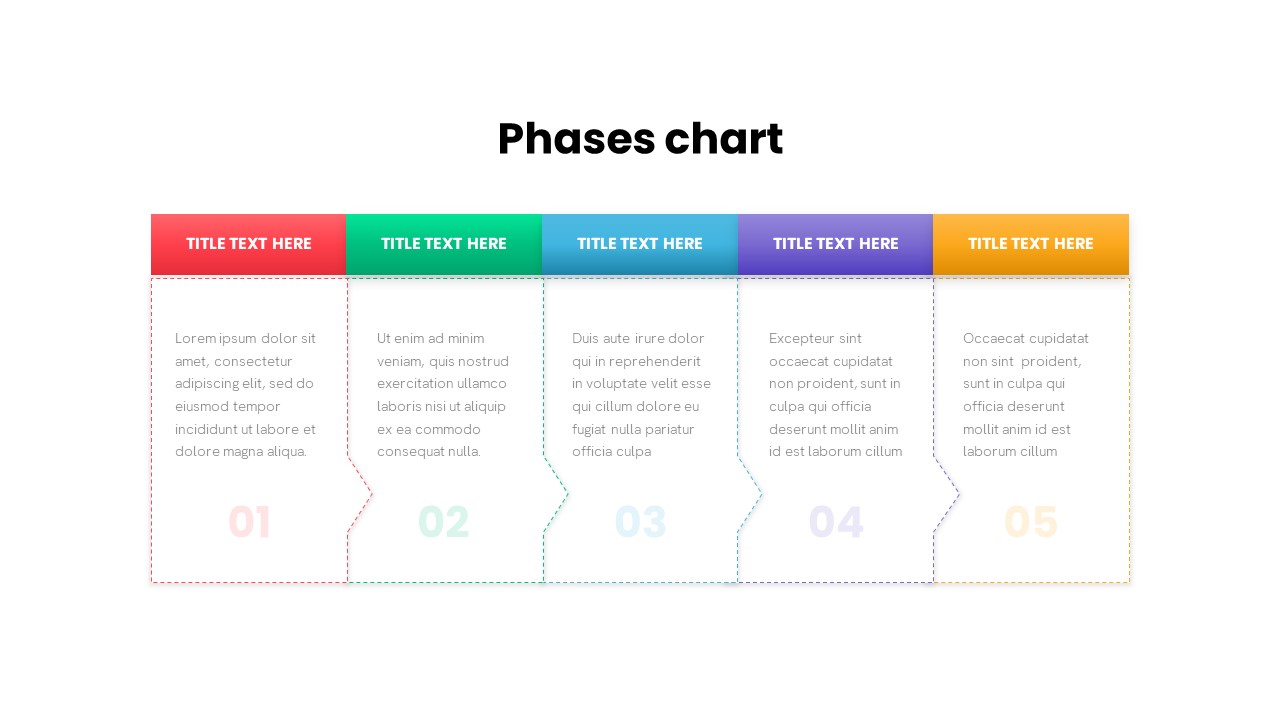
PowerPoint Template With Phases
PowerPoint Templates
Premium
-
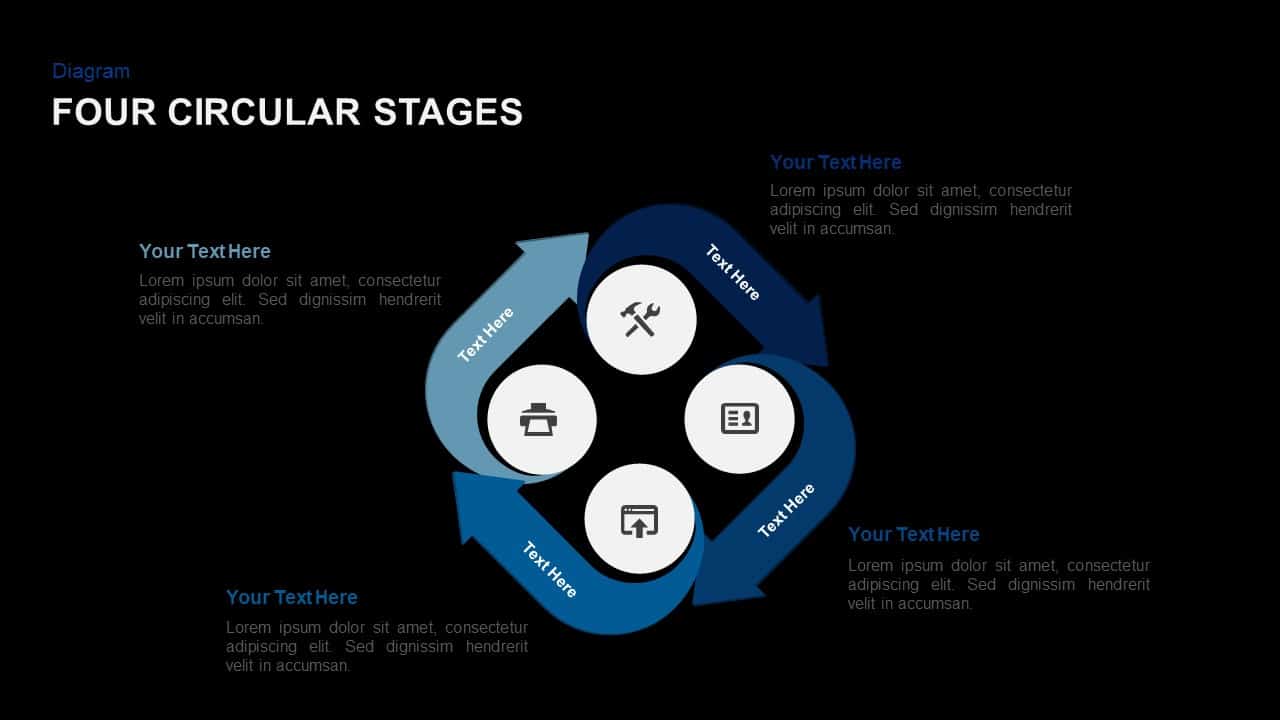
Circular Stages PowerPoint Template and Keynote Slide
Arrow Diagrams
Premium
-
5 Stage Linear Process Flow Diagram PowerPoint Template and Keynote Slide
Process Flow Diagrams
Premium
-
Project Definition Template for PowerPoint
Circular Diagrams
Premium
-
Up Growth Infographics PowerPoint Template and Keynote Slide
Puzzle
Premium
-
Free Infographic Deck Presentation Template
Free PowerPoint Templates
Free
-
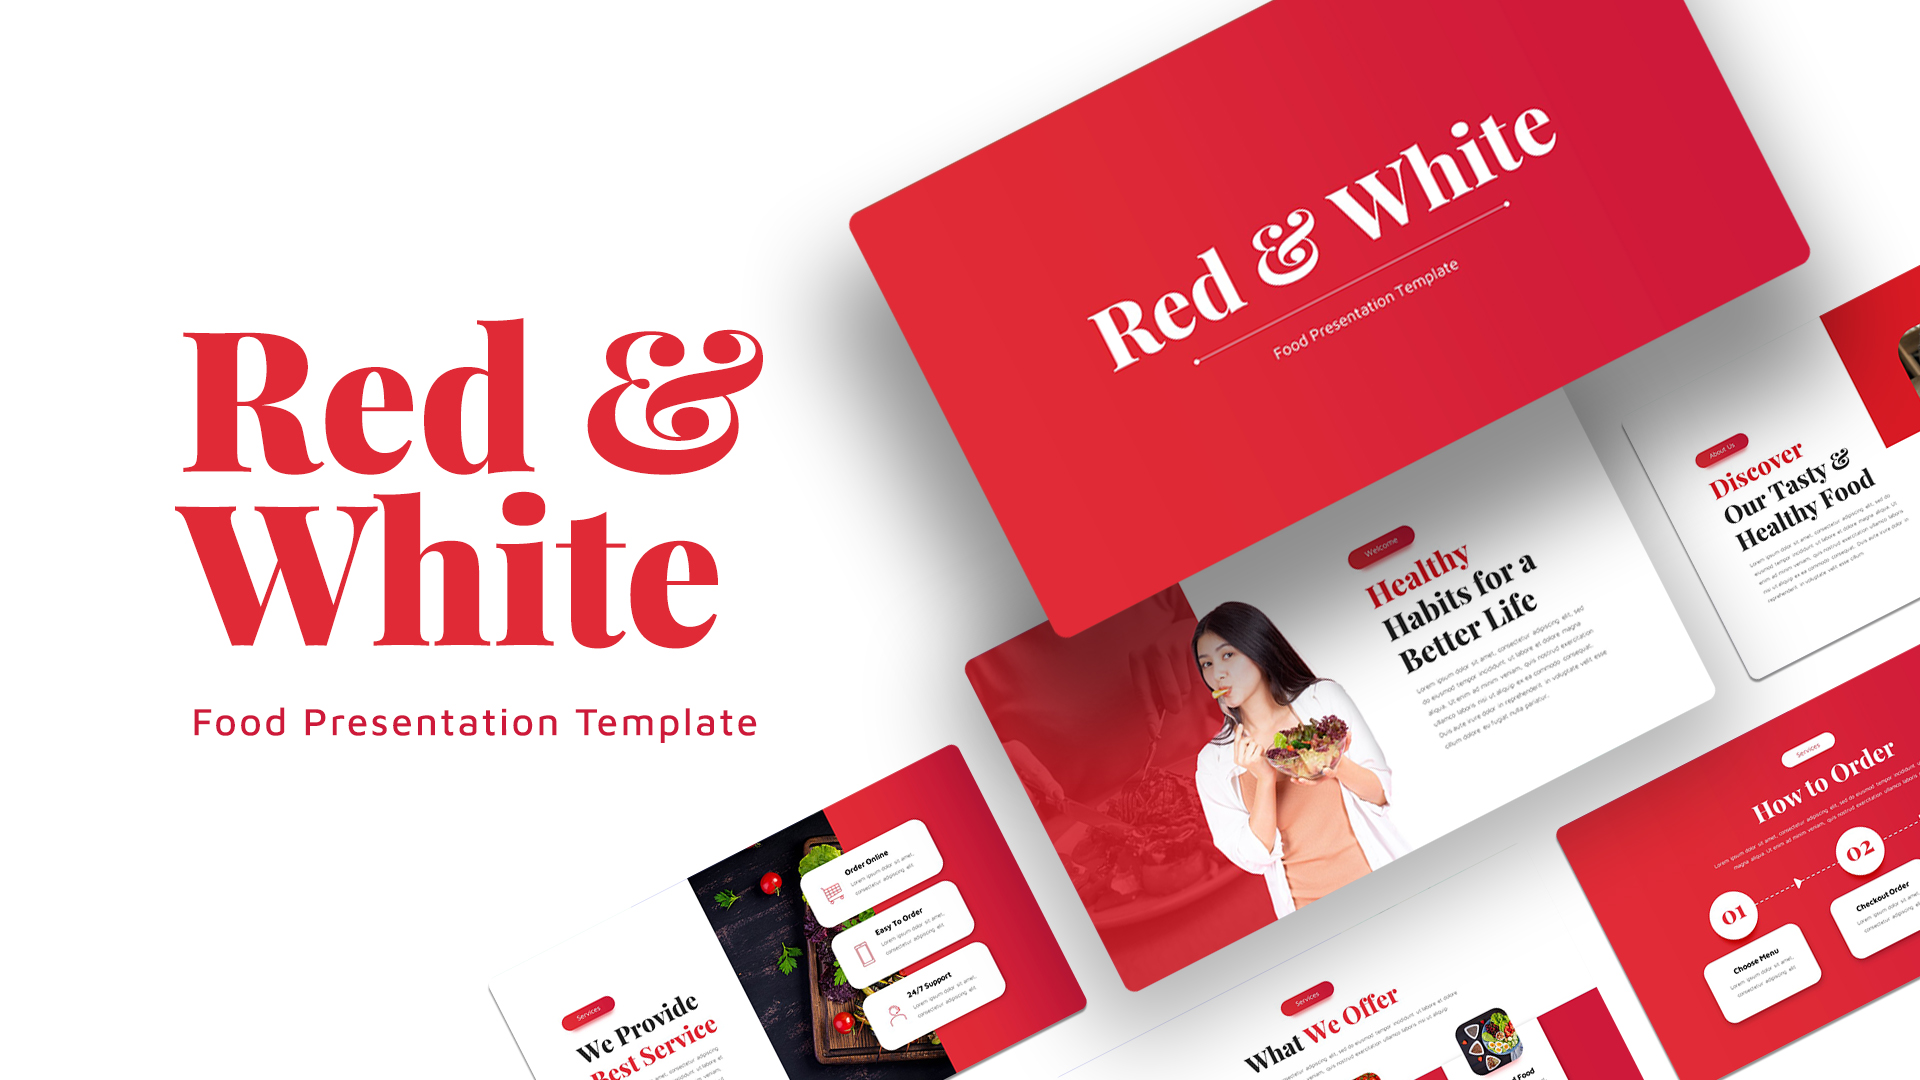
Red White Food PowerPoint Template
PowerPoint Templates
Premium
-
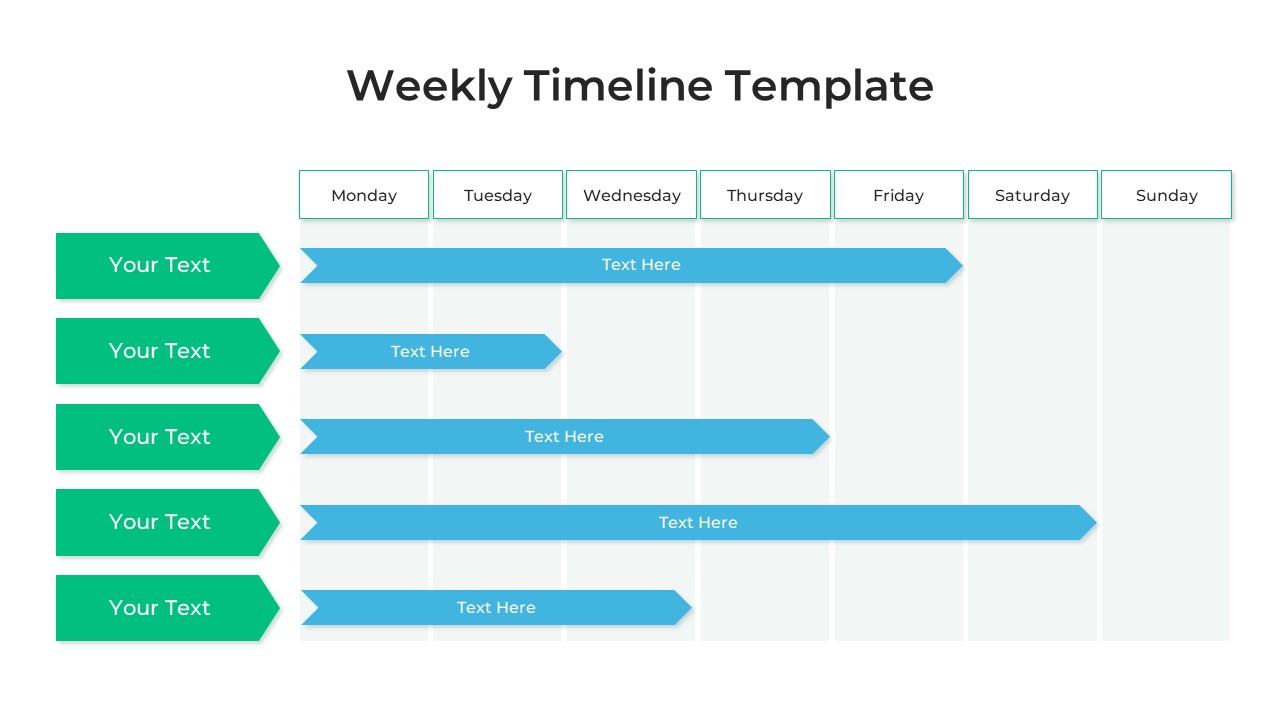
Weekly Timeline PowerPoint Template
Timeline PowerPoint Template
Premium
-
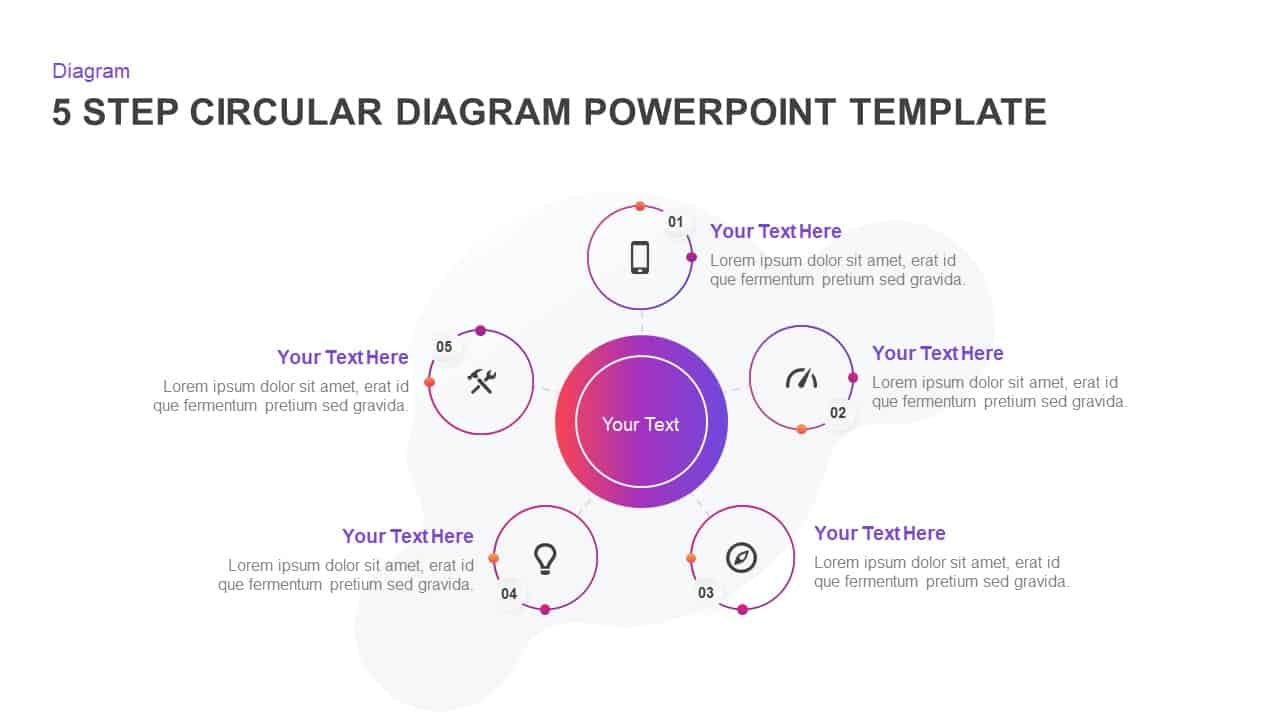
5 Step Creative Circular Diagram Design for PowerPoint & Keynote
Circular Diagrams
Premium
-
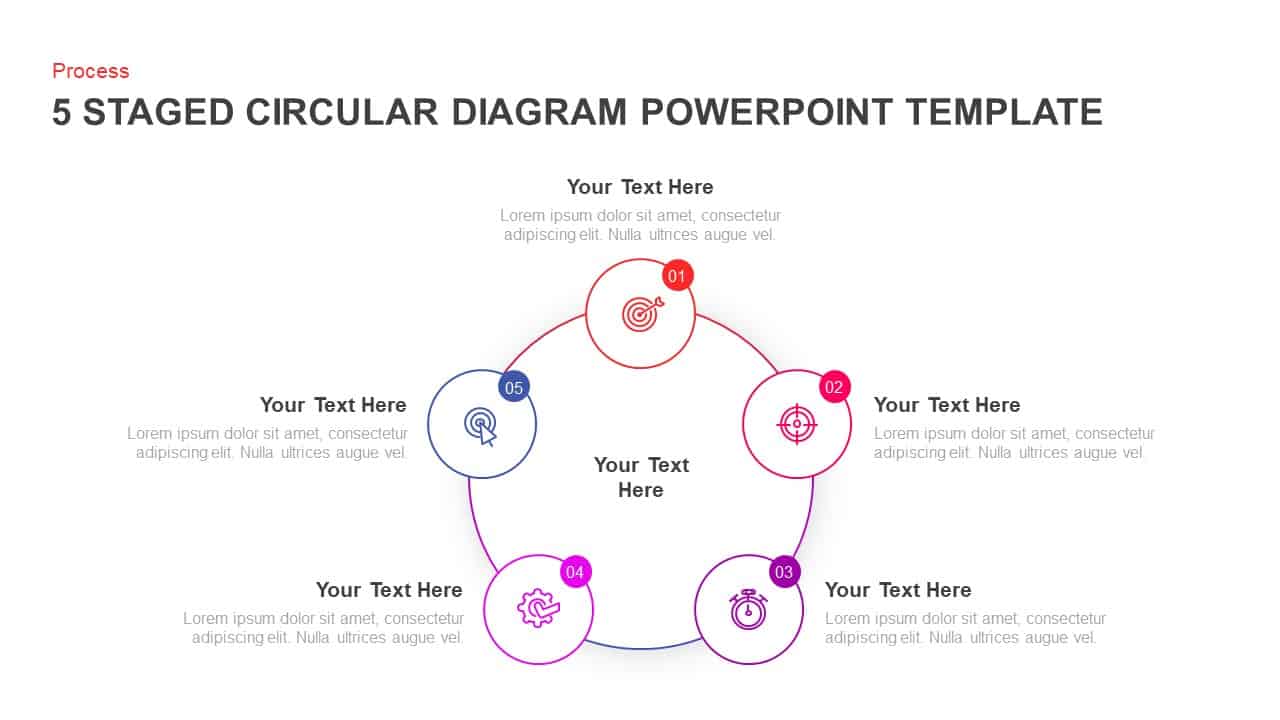
5 Step Creative Circular Diagram Design for PowerPoint and Keynote
Circular Diagrams
Premium
-
Project Scope Template
Infographic
Premium
-
Car Infographic Template
PowerPoint Templates
Premium
-
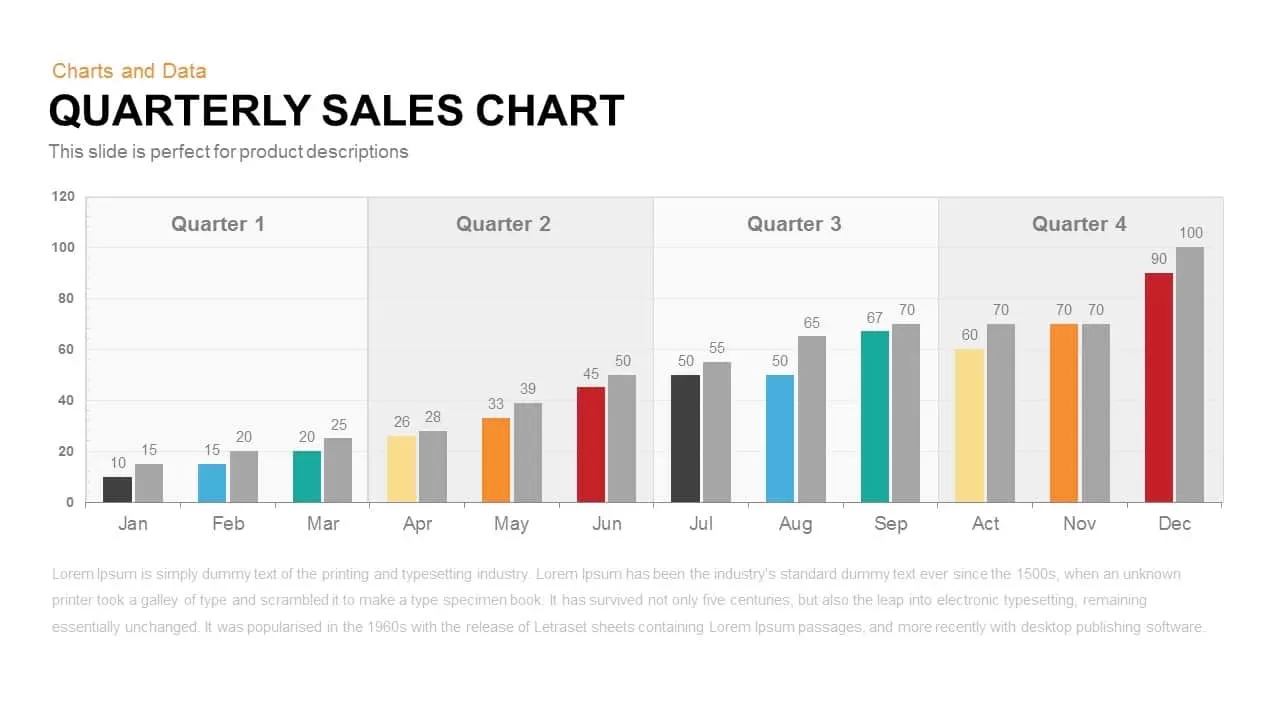
Quarterly Sales Chart PowerPoint Template and Keynote Slide
Column and Bar chart
Premium
-
Stairs & Steps Diagram for PowerPoint and Keynote Template
Diagrams
Premium
-
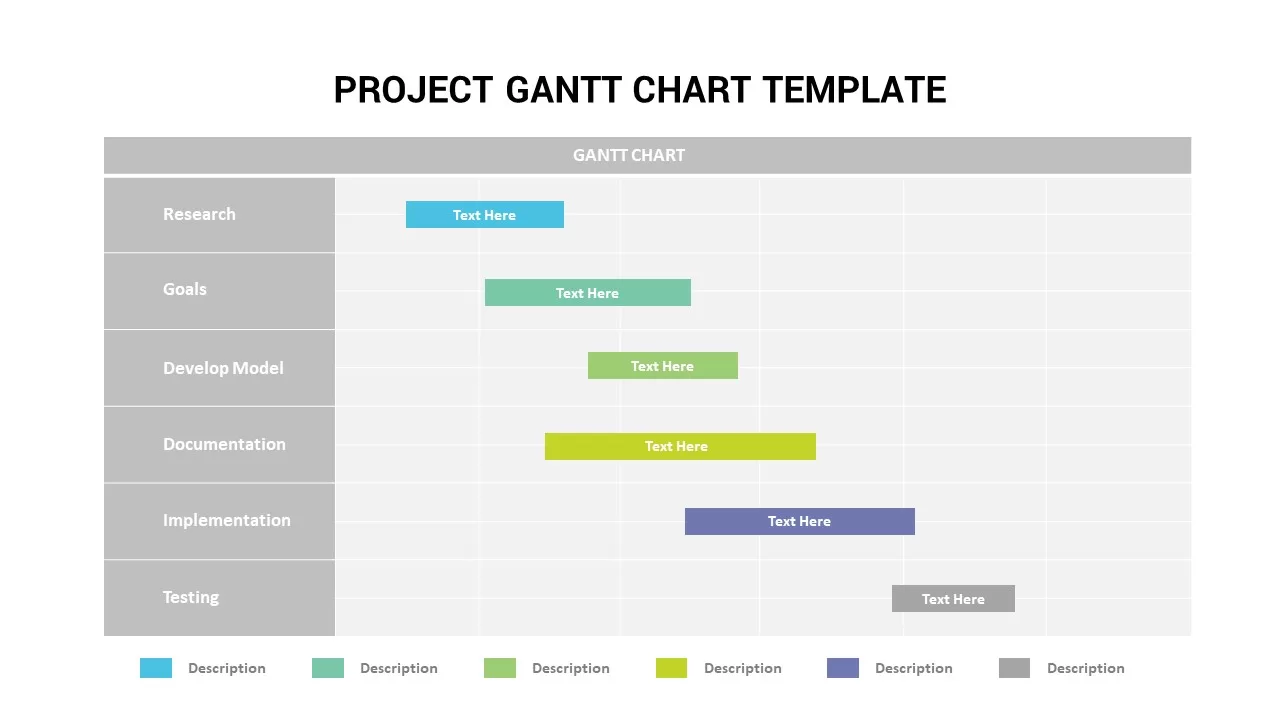
Gantt Chart in PPT Template
Infographic
Premium
-
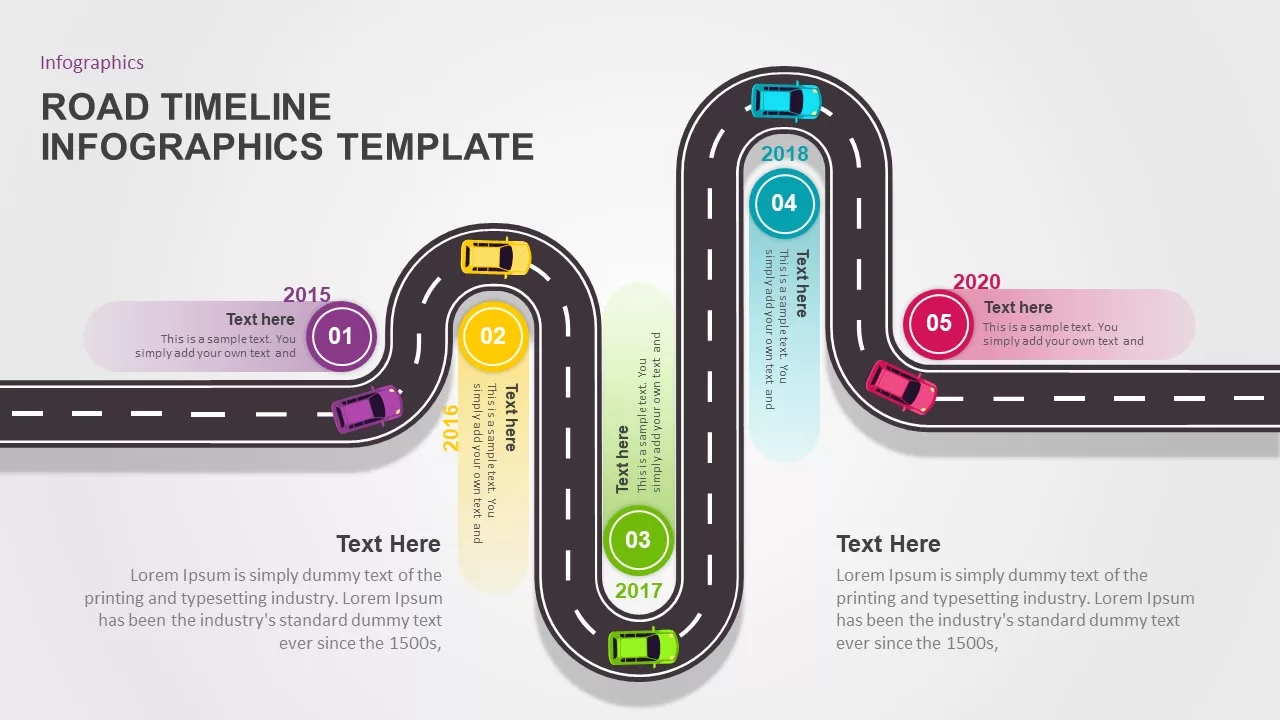
Road Timeline Infographic PowerPoint Template
PowerPoint Templates
Premium
-
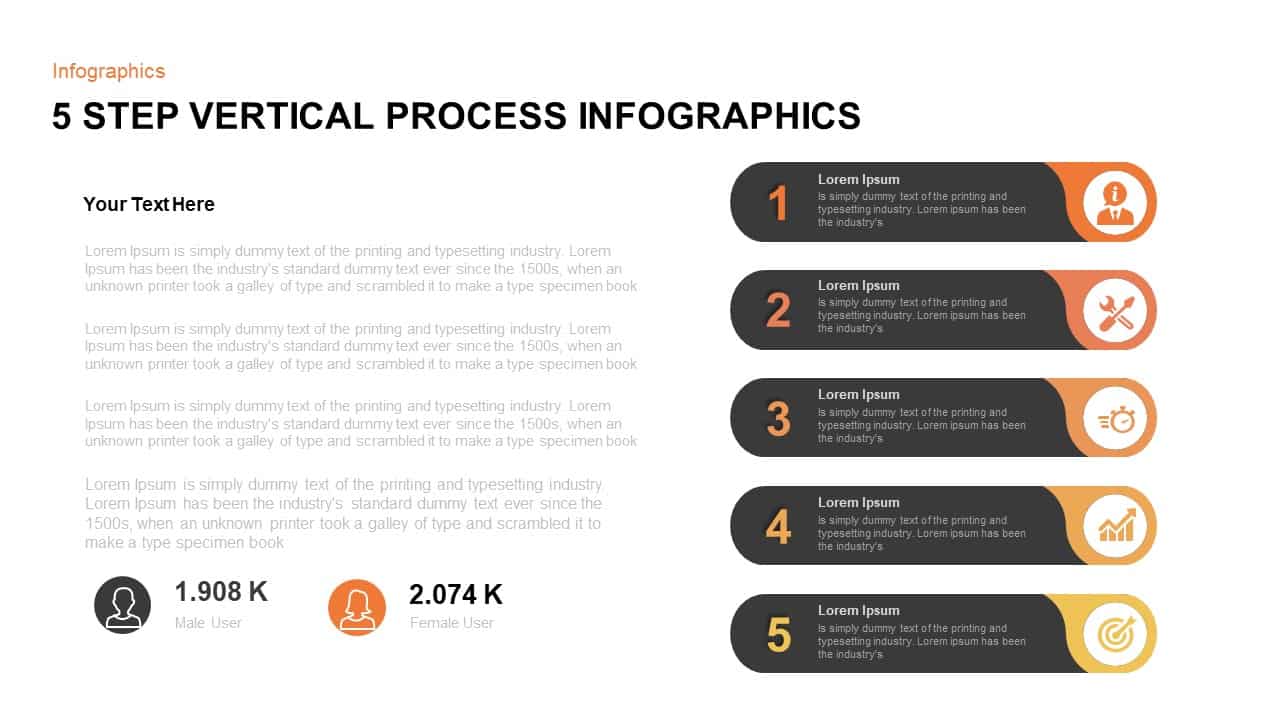
5 Step Infographic Vertical Process Template for PowerPoint
Business Models
Premium