Quarterly Sales Chart PowerPoint Template and Keynote
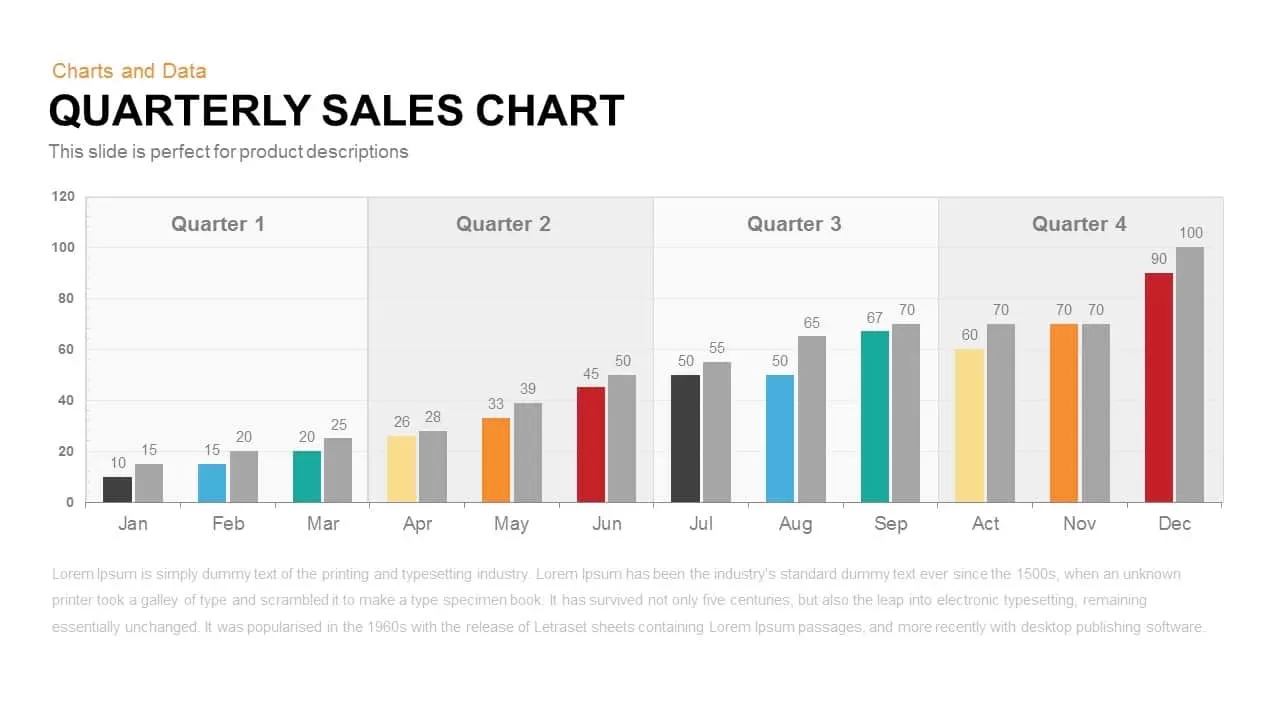
The quarterly sales chart PowerPoint template and keynote slide feature a set of bar charts. The bars are designed with different colors, such as grey, blue, green, yellow, orange and red. The users can show their sales improvement by this clustered sales chart. The unique design makes them stand out against the black-and-white background. The graphics are stimulating and eye-catching to ensure the attention of the audience in the data presentation. This illustration is perfect for the official business presentation. The slow and steady revenue and sales growth can be illustrated using the PowerPoint template.
The quarterly sales chart template for PowerPoint can display different statistical data. The slide may help to show either sales projections or historical sales data. This template can be used to analyze different financial information, by which business managers can make important business decisions. The colour schemes of the data chart can be edited using PowerPoint tools. Besides, the arrangement of clusters is also editable, you can make it show annual or half-yearly trends as well.
Quarterly Sales Chart PowerPoint and Keynote is an important template for most business purposes, it shows the quarterly outcomes the company has achieved over the year. Differentiated as four quarters with three months in each quarter, you can analyze the sales, marketing, financial, advertising, relations, production, logistics or any such factor with this Quarterly Sales Chart PowerPoint template. The template has colorful bars and is accessible in both black and white backgrounds and also has a long text box below the graph to write your remarks, judgments and comparisons in detail. The chart aids in making a statement on the trend developed over the year for any of these factors and then take the right call for successful business operations. The quarterly Sales Graph PowerPoint template & Keynote will be important slide in your presentation as they will help the audience examine and give you a good evaluation. The presenters can download similar statistical templates of charts and data from our library. Also, check out this
sales tree and
sales pipeline presentation.