


Quality Control Presentation Pareto Chart Template
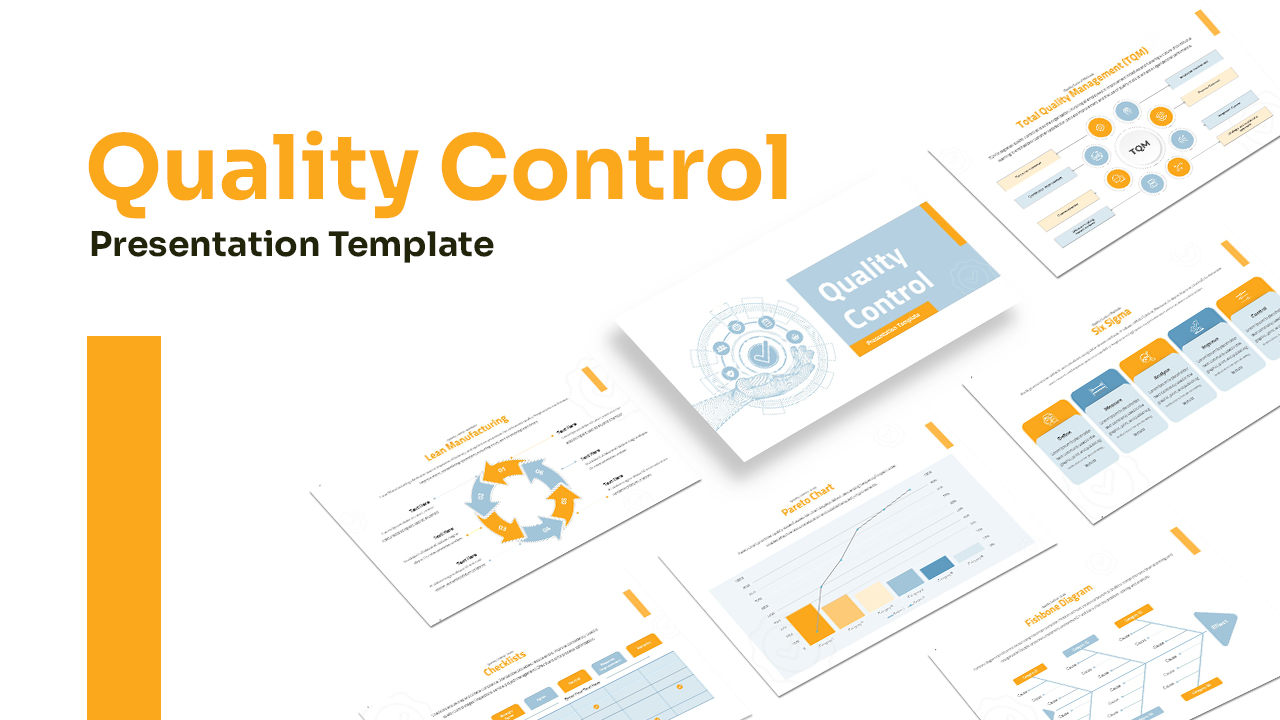
The quality control presentation template offers a complete toolkit for analyzing business problems based on quality issues. It involves different concepts of quality control and methods used to solve quality issues. All the methods and theoretical concepts included in this template are proven techniques that would be successfully applied to different industries, including IT, healthcare, engineering, manufacturing, and government. The presenters can use various PowerPoint shapes, icons, and formats to display quality control measures in an engaging style. The business deck presentation with educational themes offers a plethora of options, such as timelines, circles, tables, graphs, and numerous other creative forms, enabling presenters to deliver compelling and informative content to their audiences. This quality control PowerPoint template serves as an essential tool for anyone seeking to improve quality control processes and mitigate quality issues within their organization. The 18 slides for the quality control presentation allow you to showcase the Quality Control process that ensures products or services meet specific standards by monitoring and testing them throughout the production or delivery process. For this, SlideBazaar designers have compiled a sequence of concepts as follows:
- Title slide for quality control presentation with an image
- Introduction template
- Key elements (quality planning, quality assurance, quality control)
- Quality control methods
- Statistical process control (timeline with infographic icons)
- Six Sigma (define, measure, analyze, improve, control)
- Lean manufacturing (arrow circle slide to show six steps)
- Total quality management (TQM), circle ppt diagram for eight-step presentation
- Quality control tools (master diagram with subheadings)
- Checklist PowerPoint with a table slideshow
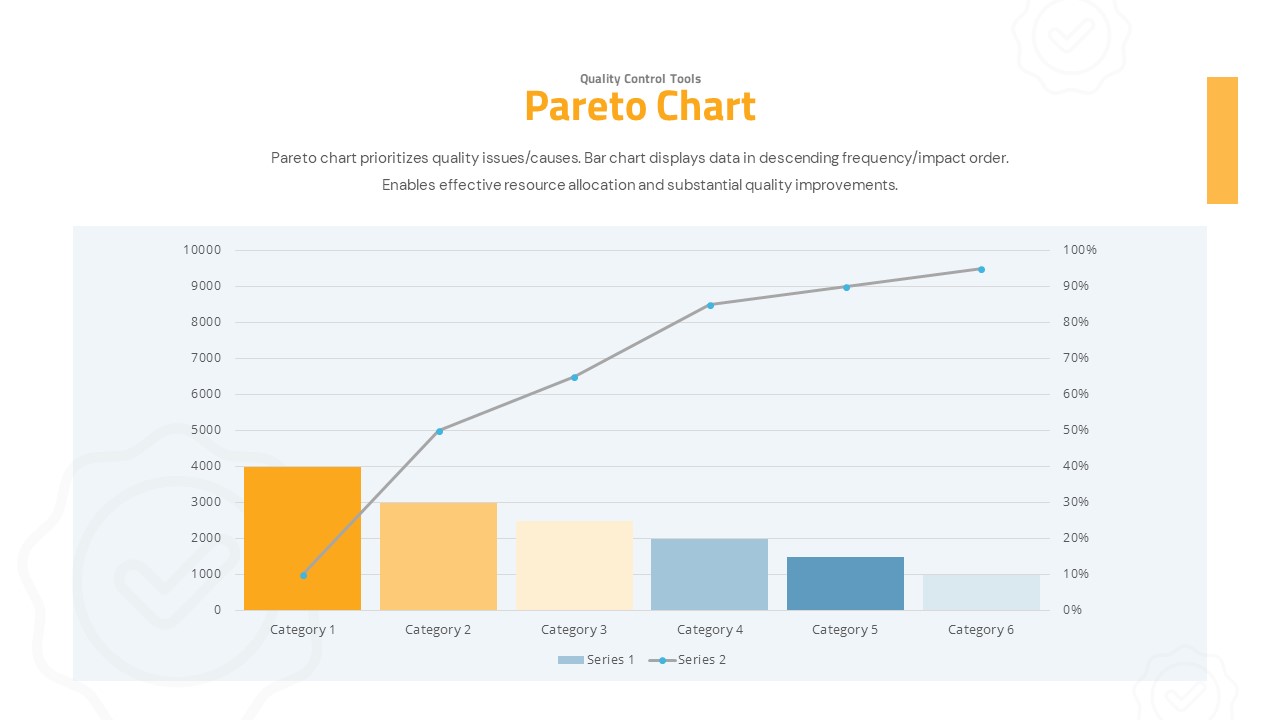
- Pareto chart (ppt line graph with bars on bottom)
- Fishbone diagram
- Control chart (a line graph with X and Y axis)
- Failure mode and effects analysis (table PowerPoint chart)
- QC challenges and solutions
- Impact of quality control: case study presentation slide
- Q&A session with a question mark image
- Thank you presentation slide