


cause and effect fishbone ppt slide
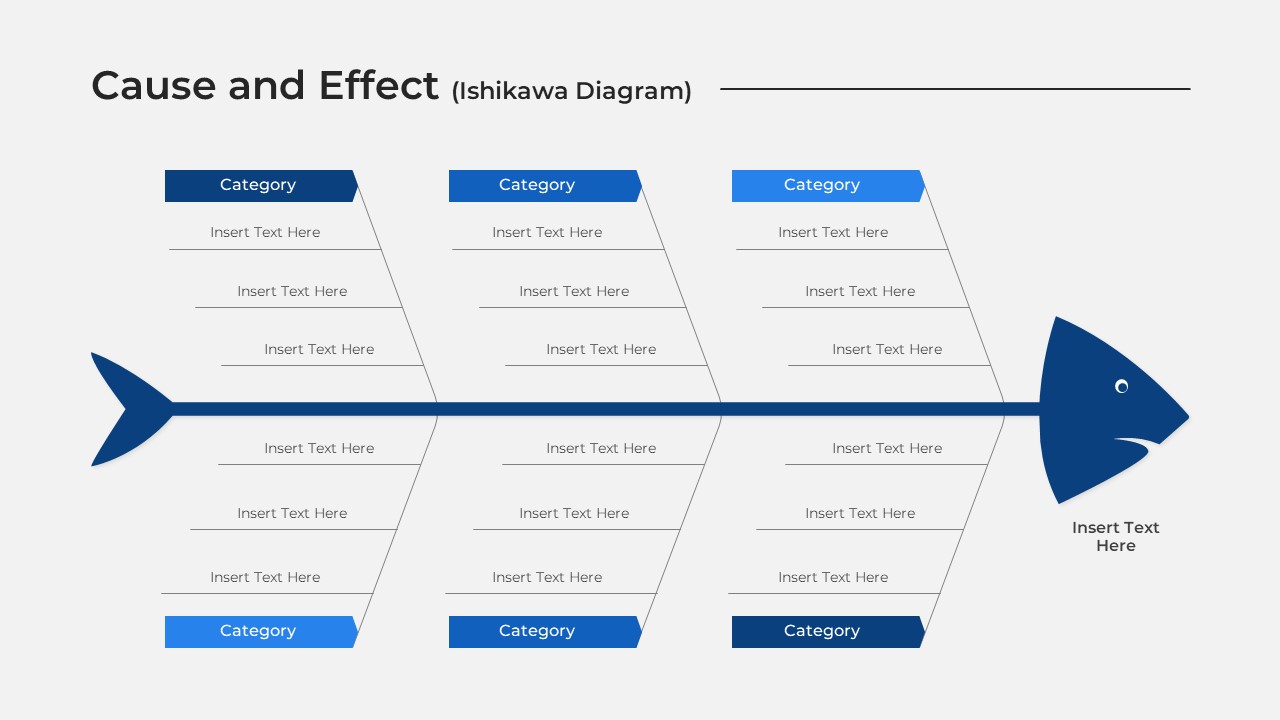
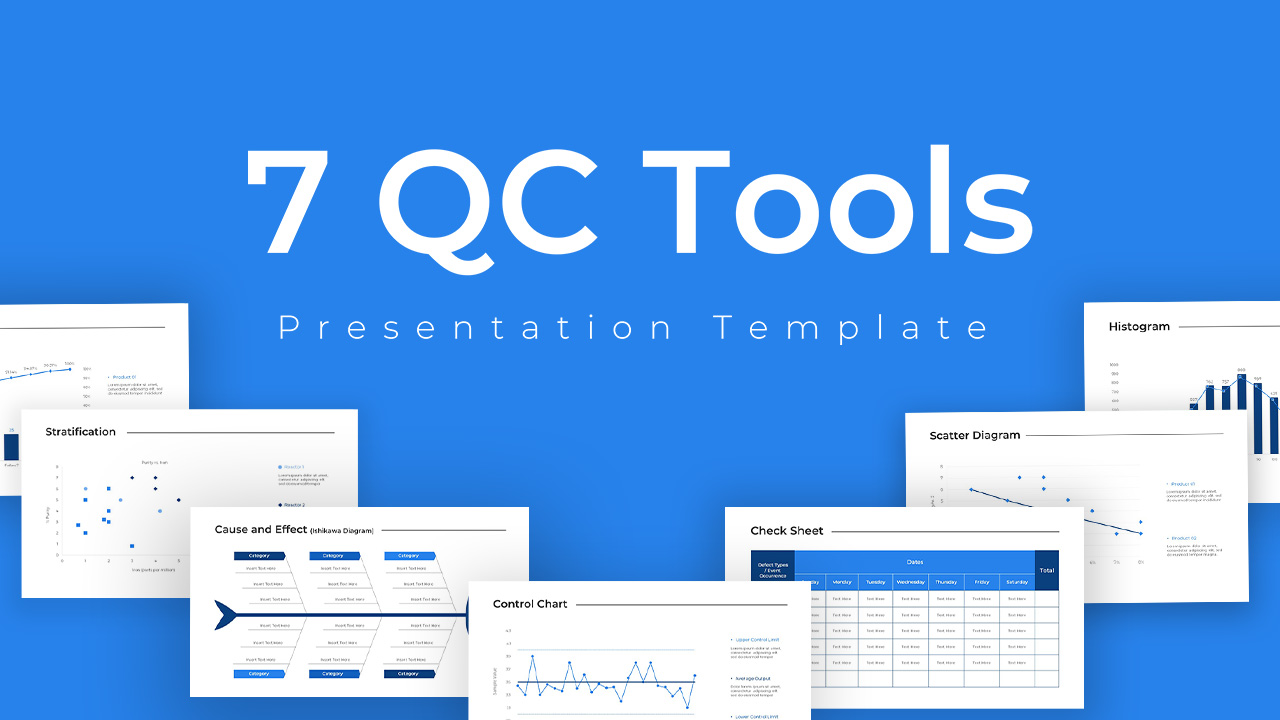
QC Tool PowerPoint Template contains seven tools for analysing business quality issues. Providing quality products and services might be the crucial challenge that every business faces on its journey. So, businesses need quality control measures to stand out in the market. This template offers a 7 qc tool for PowerPoint presentation featuring charts and graphs for quality measurements. The QC Tool PowerPoint features quality control graphs and charts, such as Histogram, Fishbone diagram, Check Sheets, Pareto diagram, Control chart, Scatter diagram, and Stratification chart. These diagrams are carefully designed to ensure a clean and organized appearance for evaluating quality control. The PowerPoint template utilizes a white background design, further enhancing the overall aesthetic of the quality control assessment. These ppt diagrams are fit for tracking and showing internal quality control issues and solutions. 7 slides for QC comprised of the following data-driven charts. Cause and effect PowerPoint: This fishbone diagram allows you present QC by showing the cause-and-effect relationship of the variables. After all, it is a root causes analysis tool. Check Sheet: Check sheets are relevant for QC as they enable systematic data collection and analysis, helping identify patterns, defects, or abnormalities. They provide a visual representation of data, aiding in quality control decision-making and process improvement efforts. Histogram: Histograms are vital for Quality Control (QC) as they provide a visual representation of data distribution, helping identify anomalies, patterns, and variations in processes or products efficiently. Pareto Diagram: Pareto diagrams are relevant for quality control (QC) as they help identify and prioritize the most significant factors or issues contributing to defects or quality problems in a process or system. This Pareto diagram PowerPoint will show data with a bar chart and a line graph together. Scatter Diagram: Scatter diagrams are important for quality control (QC) as they help analyse the relationship between two variables, enabling the identification of potential correlations or patterns that impact quality and inform improvement efforts. Control Chart: This PowerPoint control chart is a statistical tool used in quality control to monitor and track the performance of a process over time. It graphically displays data points collected from the process, along with control limits, to determine whether the process is stable or exhibiting variations. Stratification Chart: A PowerPoint stratification chart can be used in QC to categorize data into groups for analysis and identification of patterns or trends. Download PowerPoint tool kit for QC now!