Home » Pyramid Area Chart Template for PowerPoint and Keynote
Pyramid Area Chart Template for PowerPoint and Keynote
- Version
- Download 78
- File Size 0.00 KB
- File Count 1
- Create Date October 11, 2017
- Last Updated November 15, 2023
Pyramid Area Chart Template for PowerPoint and Keynote
Pyramid Area Chart PowerPoint Template
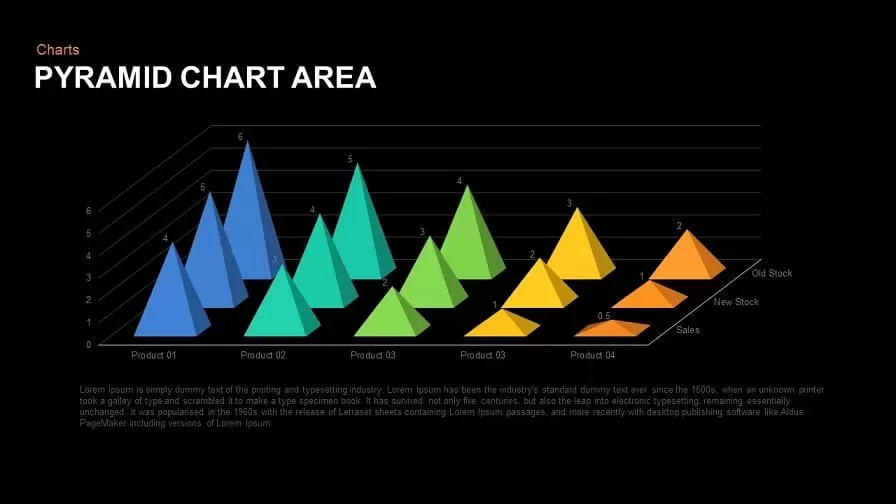
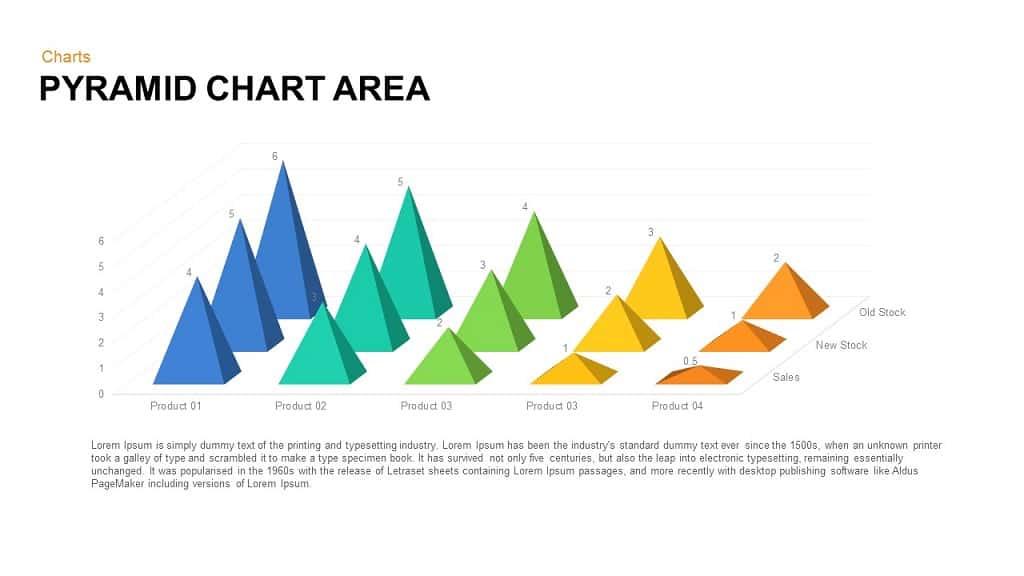
Plotting of values in a graph may be part of the usual lengthy arithmetic operation. But with our Pyramid area chart PowerPoint template, an entertaining factor can be found while graphing the values in the presentation. In Egyptian culture, the pyramid is examined as a strange. But in current time, the pyramid has evolved to be a crucial PowerPoint shape. Pyramid chart template is an effective tool for modeling a relationship between quantitative and qualitative data. Pyramid can show hierarchical, interconnected or proportional relationships. Pyramid chart can display statistical data like never before. Usual charts or graphs use bars, arrows, cylinders. But instead of typical designs Slidebazaar has added pyramid to make the template standout and can grasp the maximum light as possible. The pyramid chart template creates a non-intimidating atmosphere in the meeting which enables the audience to interact and to retain the report quickly.
Our pyramid area chart template is ideal for comparing three products, services, values. The presenter can make five comparisons at a time, the tip of the pyramid marks, the bottom of the pyramid occupies more space, so it enables the audience to differentiate the analysis easily. The design of a pyramid chart area template is one of a kind and will surely encourage the audience to pay focus on statistical data. The design strikes the mind of the audience which turns it out to be a remarkable experience. The pyramids are arranged in a way that it adds a virtual effect to the template. Bottom of the template is combined with text areas where the presenter can add a brief description of the presentation. The template is crafted using PowerPoint shapes, so customizations of the template can be done in few clicks. The rich color scheme gives an artistic touch to the template. The noticeable color scheme allows the audience to remembers the facts and data. The presenter can perform market analysis, competitor’s analysis, product comparisons, etc. Now present your data and create catchy reports using our pyramid chart area template.
Attached Files
| File |
|---|
| https://premiumdownloads.s3.amazonaws.com/SB00809-pyramid-chart-area.zip |
Login to download this file
Add to favorites
Add to collection
-
Category
-
Item ID
SB00809 -
Rating
0.0
(0 reviews)
Related Templates
-

Nature PowerPoint Presentation Template
PowerPoint Business Templates
Premium
-

Free Vertical PowerPoint Template
PowerPoint Business Templates
Free
-

Research Proposal PowerPoint Template
PowerPoint Templates
Premium
-

Sales Deck Free PowerPoint Template
PowerPoint Templates
Free
-

Cab Service PowerPoint Template
PowerPoint Templates
Premium
-

Free Nursing Capstone PowerPoint Deck
PowerPoint Templates
Free
-

VET Clinic PowerPoint Template
PowerPoint Templates
Premium
-

Gym PowerPoint Template
PowerPoint Templates
Premium
-

Free Space Minimal Deck Template
PowerPoint Templates
Free
-

Free Physical Education PowerPoint Template Deck
Free PowerPoint Templates
Free
-

Travel Agency PowerPoint Template
PowerPoint Templates
Premium
-

IoT Presentation Template
PowerPoint Templates
Premium
-

Effective Communication PowerPoint Template
PowerPoint Templates
Premium
-

Graph Paper PowerPoint Template Deck
PowerPoint Templates
Premium
-

PowerPoint Quiz With Timer
PowerPoint Templates
Premium
-
Macroeconomics PowerPoint Template
PowerPoint Templates
Premium
-

Free Economics PowerPoint Template
Free PowerPoint Templates
Free
-

Free Army PowerPoint Template
PowerPoint Templates
Free
-

Free Aviation PowerPoint Template
Free PowerPoint Templates
Free
-
Customer Experience Loyalty PowerPoint Deck Template
PowerPoint Templates
Premium
-

Free Charity PowerPoint Template Deck
PowerPoint Templates
Free
-
5 Levels 3D Pyramid Template for PowerPoint and Keynote
Business Models
Premium
-

Animated Agriculture PowerPoint Deck Template
PowerPoint Templates
Premium
-

Free Real Estate Listing PowerPoint Template
Free PowerPoint Templates
Free
-

Free University Presentation PowerPoint Template
PowerPoint Templates
Free
-

Free Cartoon PowerPoint Template
Free PowerPoint Templates
Free
-
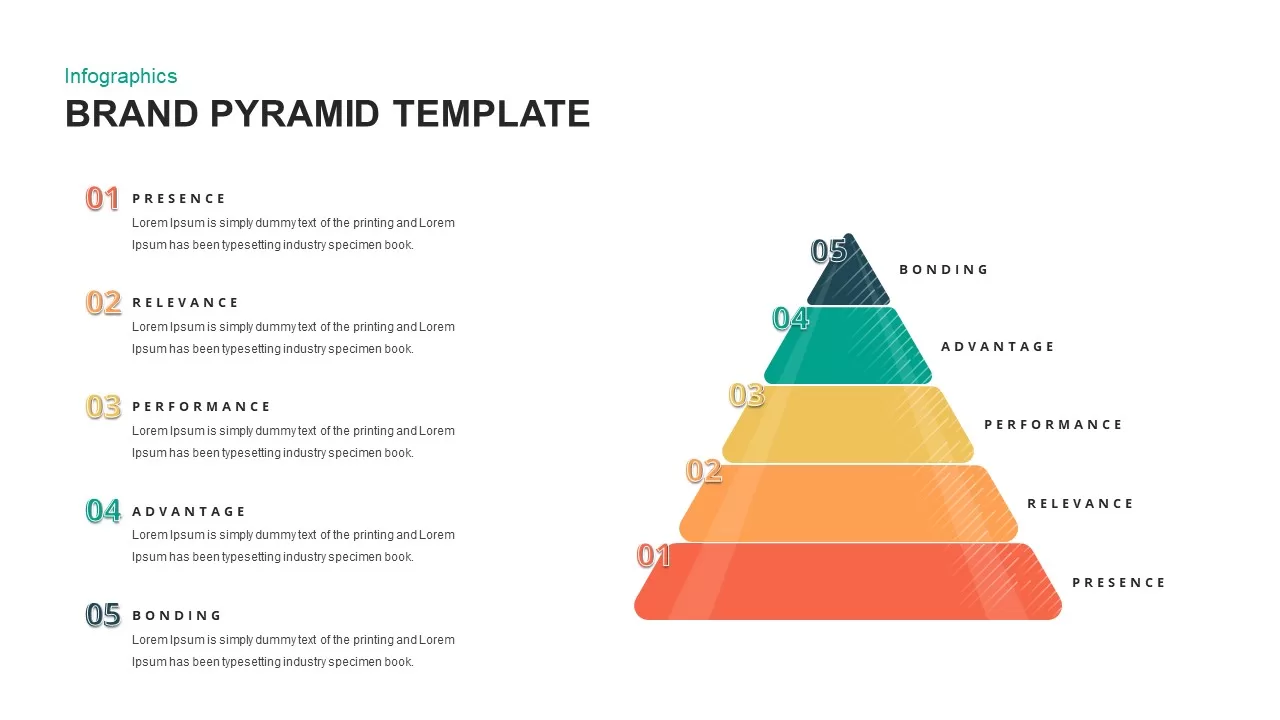
Brand Pyramid PowerPoint Template
Pyramid
Premium
-

Free Book Review PowerPoint Template
Free PowerPoint Templates
Free
-

Free Event Planning PowerPoint Template
Free PowerPoint Templates
Free
-
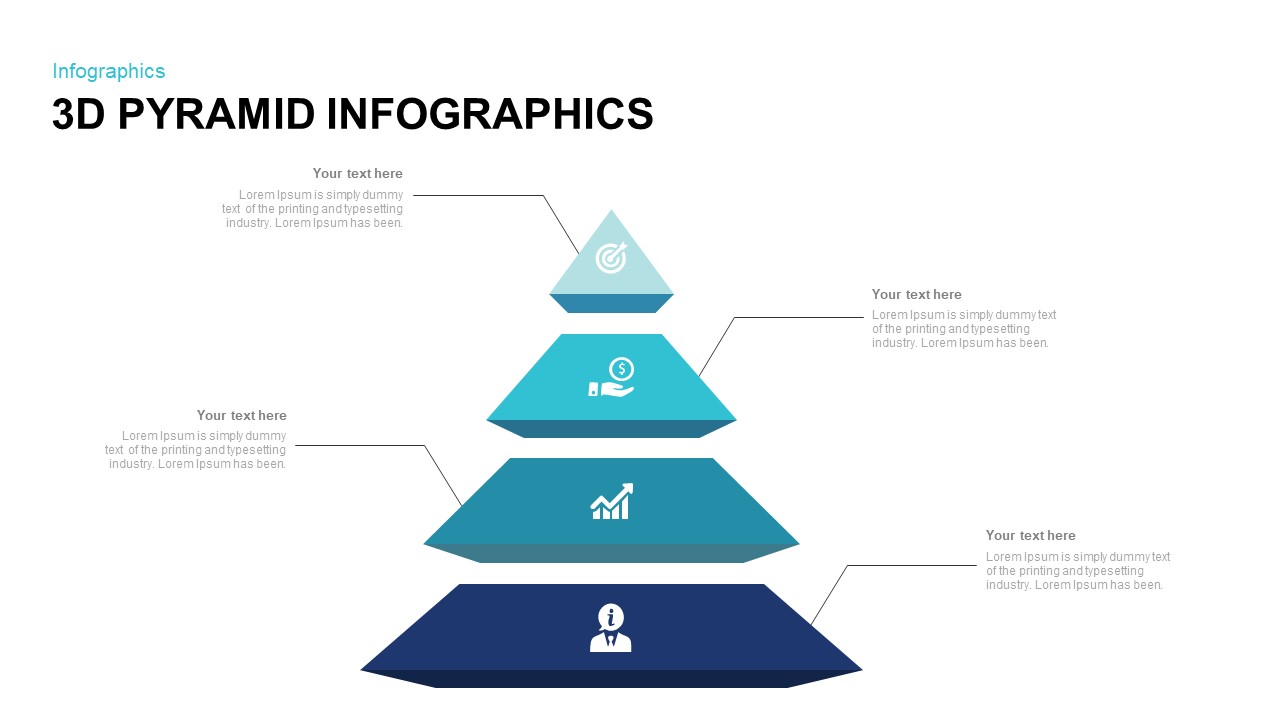
3D Pyramid Infographic Template for PowerPoint
Pyramid
Premium
-

Global Warming Infographic PowerPoint Template Deck
PowerPoint Templates
Premium
-

Data Science PowerPoint Template
PowerPoint Templates
Premium
-
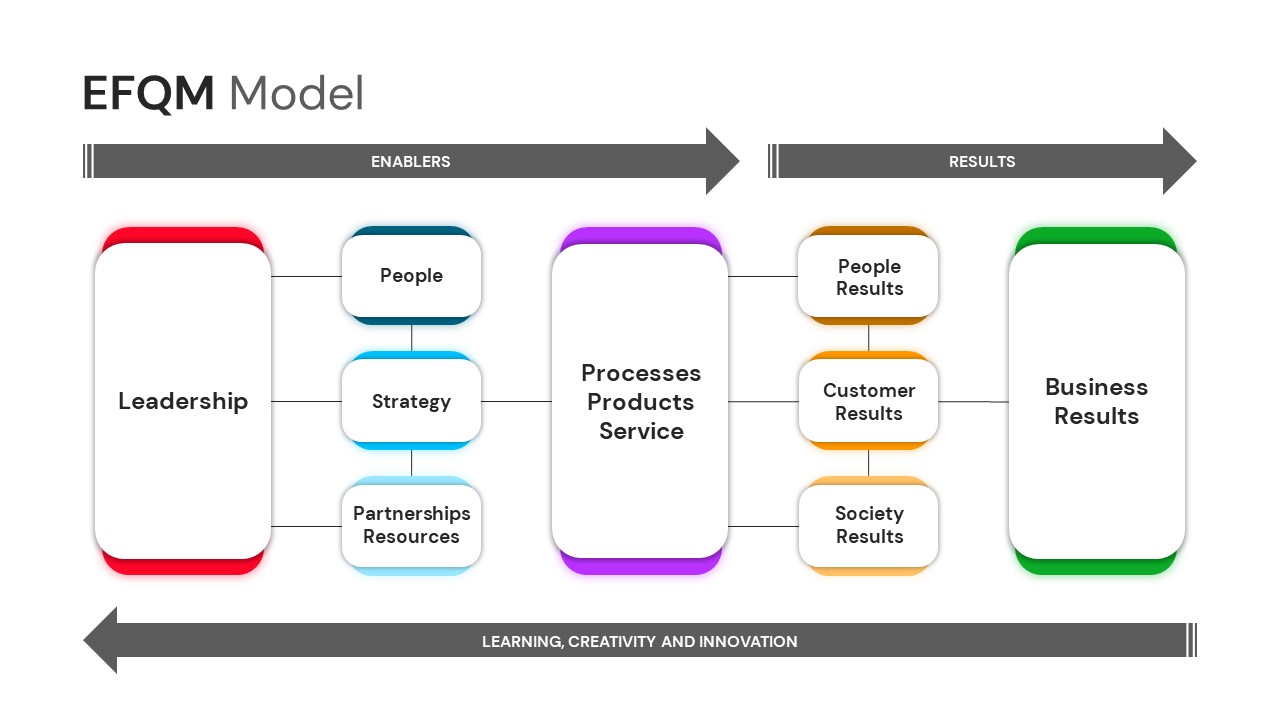
EFQM Model PowerPoint Template
PowerPoint Templates
Premium
-

Real Estate PowerPoint Theme
PowerPoint Themes
Premium
-

Free Dunder Mifflin Paper Company Pitch Deck
Free PowerPoint Templates
Free
-
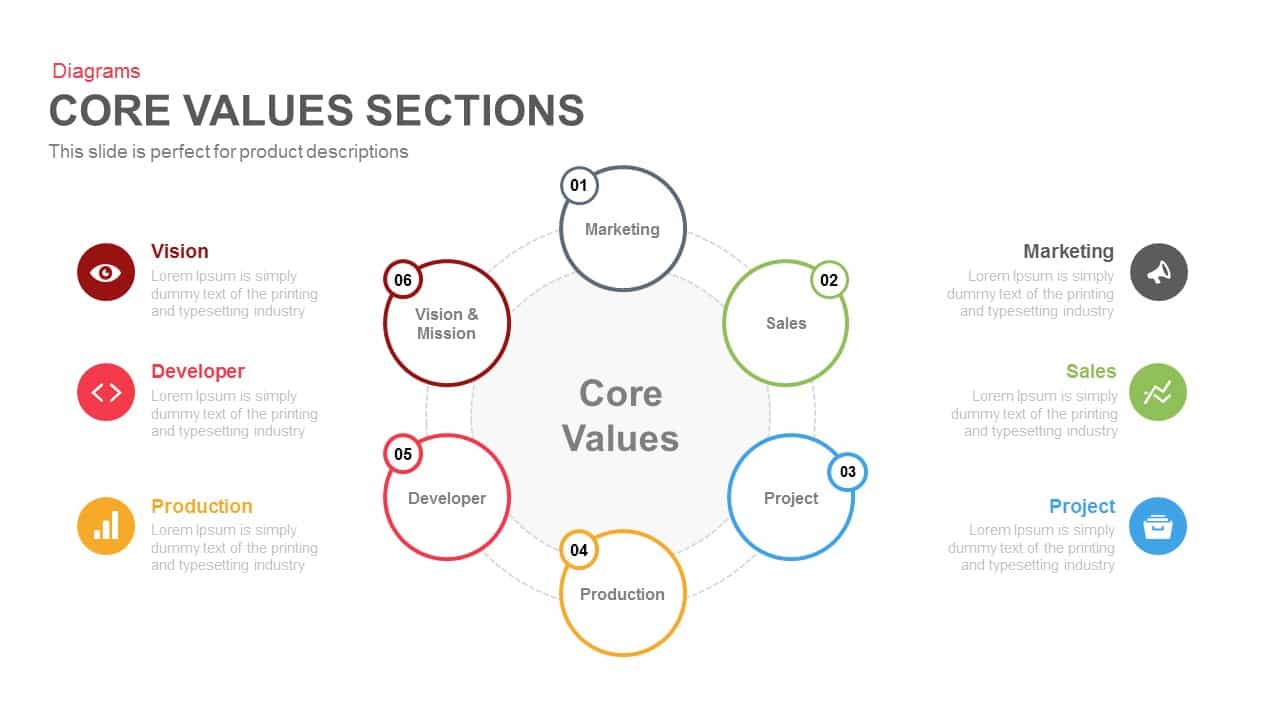
Core Values Sections PowerPoint Template and Keynote
Business Models
Premium
-
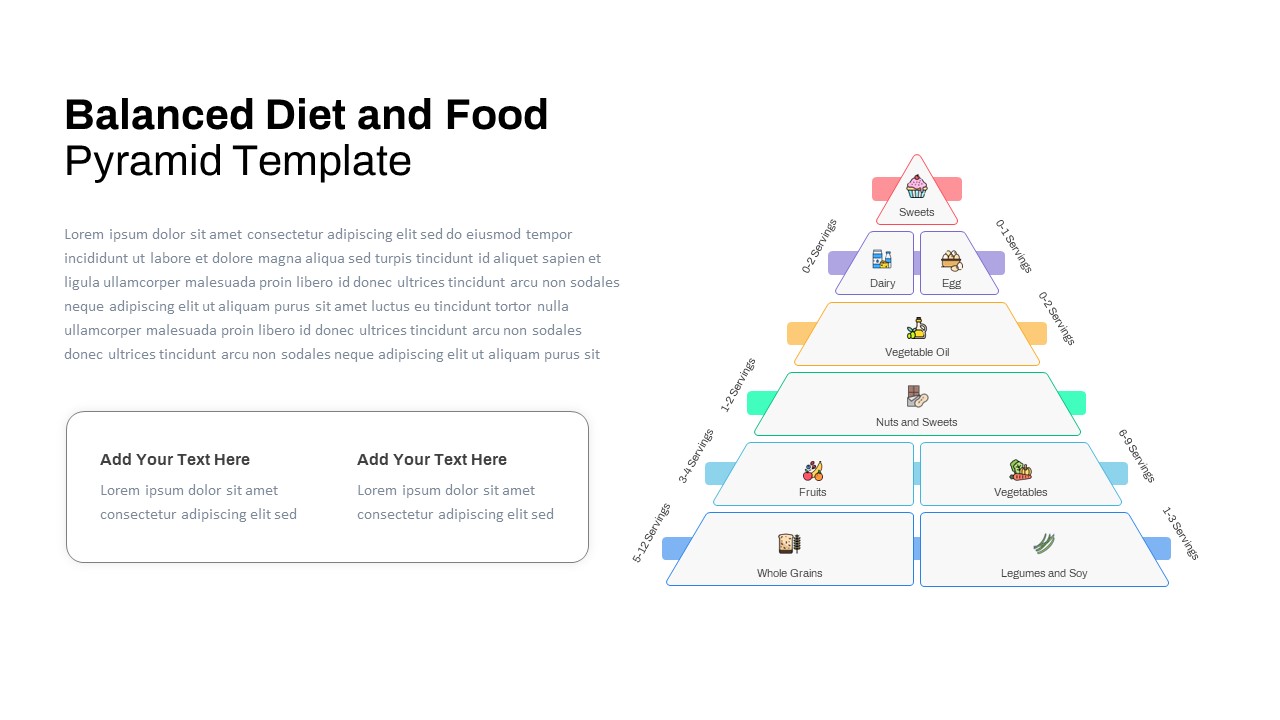
Free Balanced Diet Food Pyramid Template
Pyramid
Free
-

Annual Report PowerPoint Template and Keynote
PowerPoint Templates
Premium
-
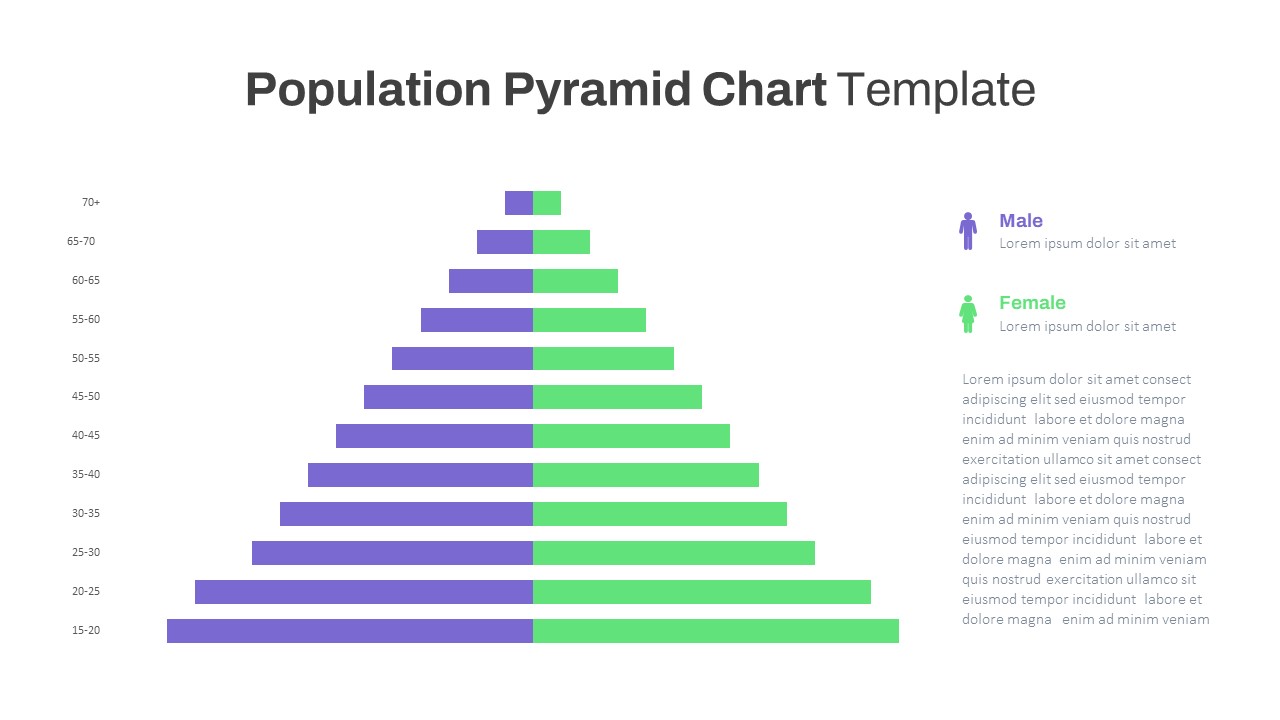
Population Pyramid Chart PowerPoint Template
PowerPoint Templates
Premium
-
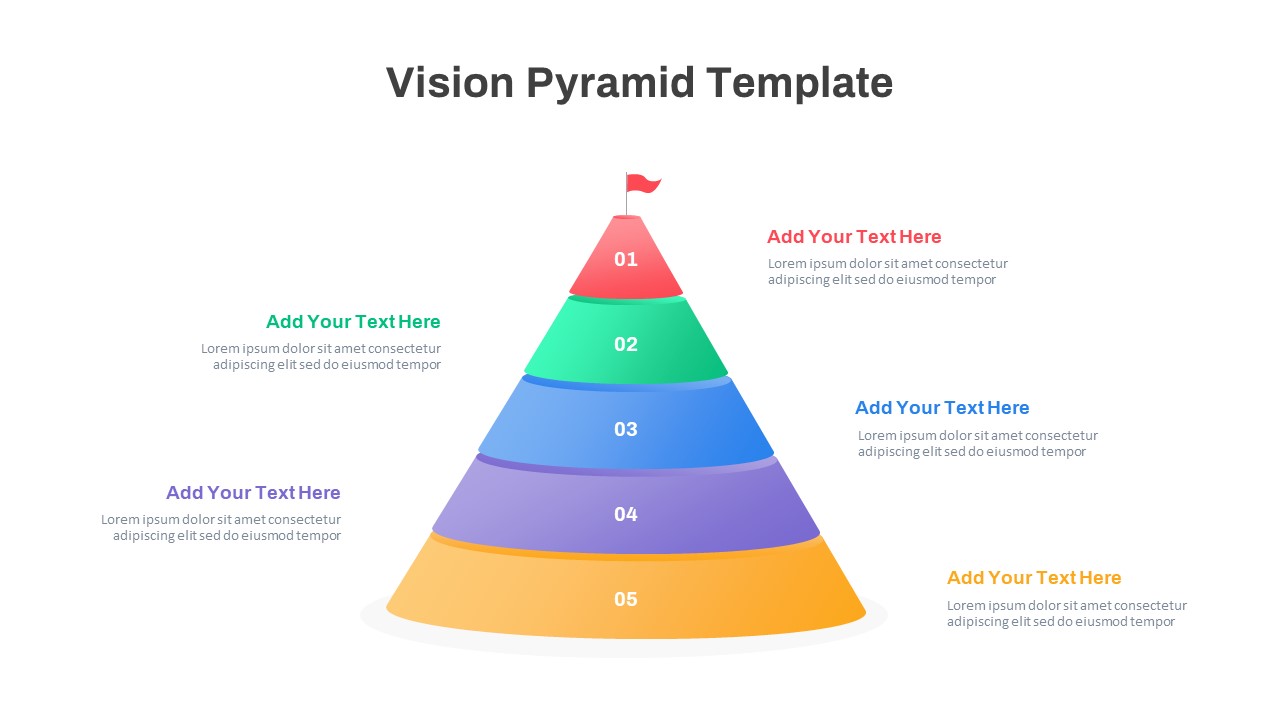
Vision Pyramid PowerPoint Template
Pyramid
Premium
-
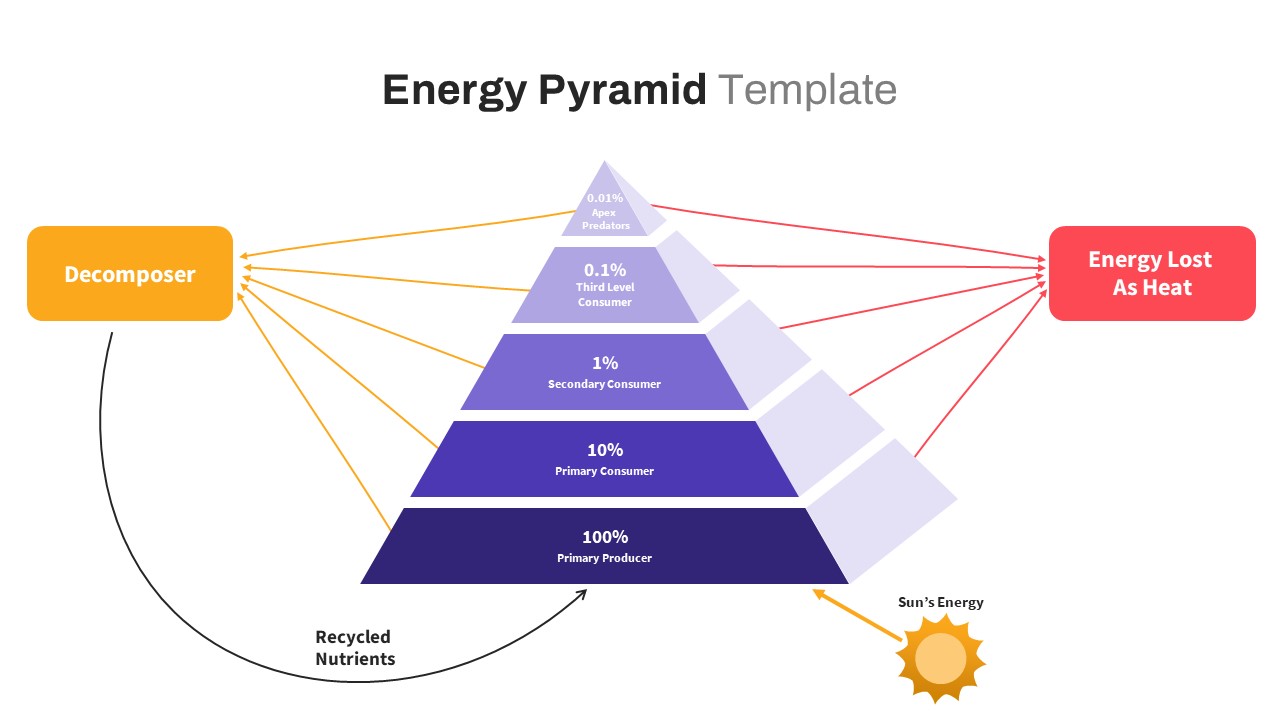
Free Energy Pyramid Template
Pyramid
Free
-

Area Chart PowerPoint Template
PowerPoint Charts
Premium
-
5 Stage Pyramid Diagrams PowerPoint Template and Keynote Slide
Pyramid
Premium
-
Creative Bar Chart Analysis PowerPoint Template and Keynote
Column and Bar chart
Premium
-
Stakeholder Register PowerPoint Template
PowerPoint Templates
Premium
-
Five Staged Pyramid PowerPoint template and Keynote Slide
Pyramid
Premium
-
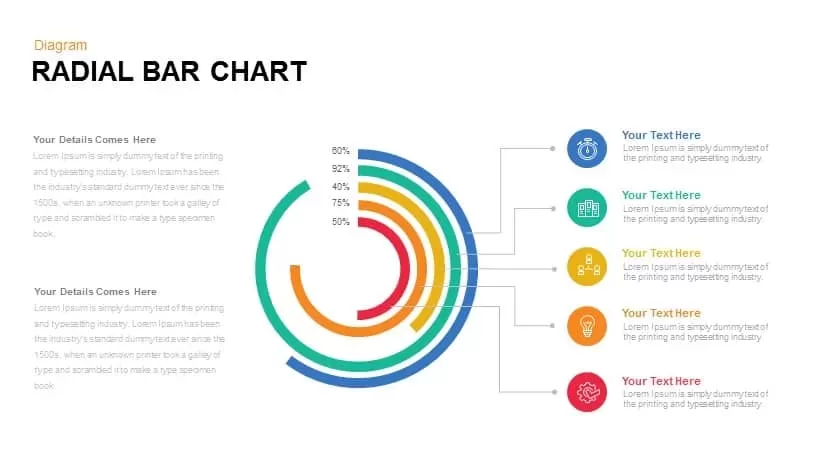
Radial Bar Chart PowerPoint Templates and Keynote Slides
PowerPoint Charts
Premium
-
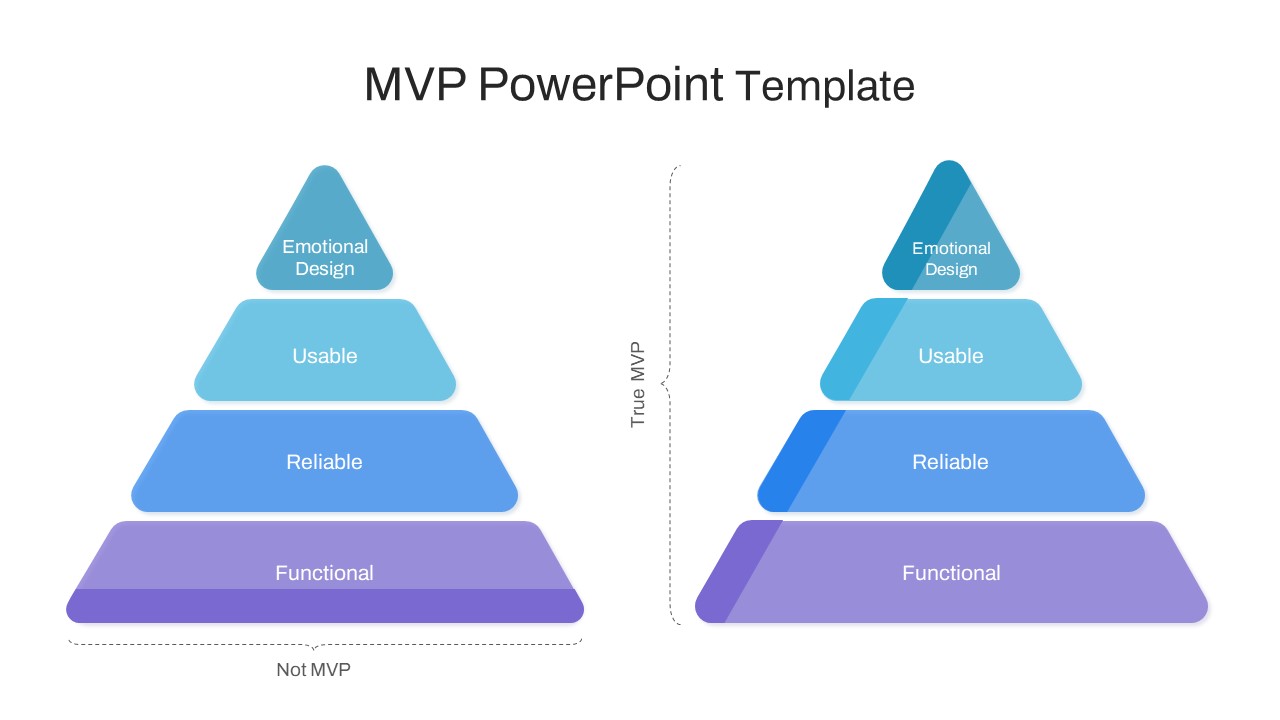
MVP Pyramid PowerPoint Template
Pyramid
Premium
-

Data Bar Chart Template for PowerPoint and Keynote
Column and Bar chart
Premium
-
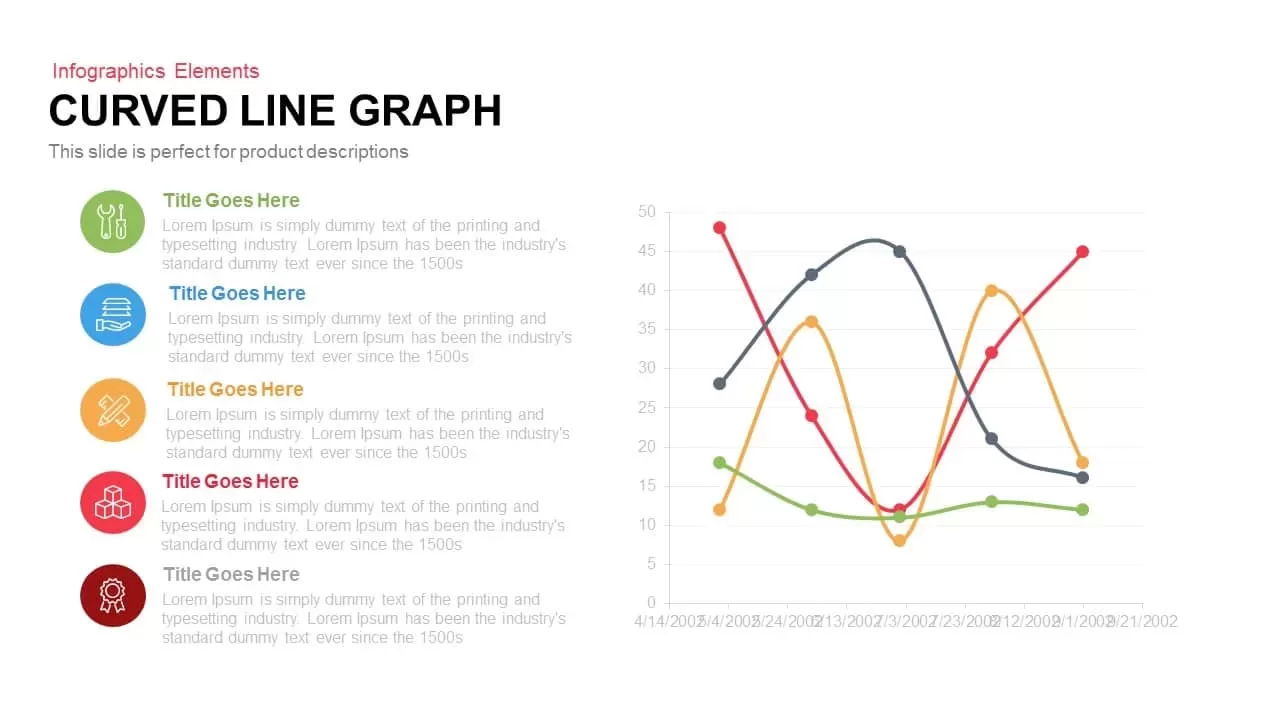
Curved Line Graph PowerPoint Template and Keynote Slide
Curves and Lines
Premium
-

Data Over Time Line Chart PowerPoint Template
PowerPoint Charts
Premium
-
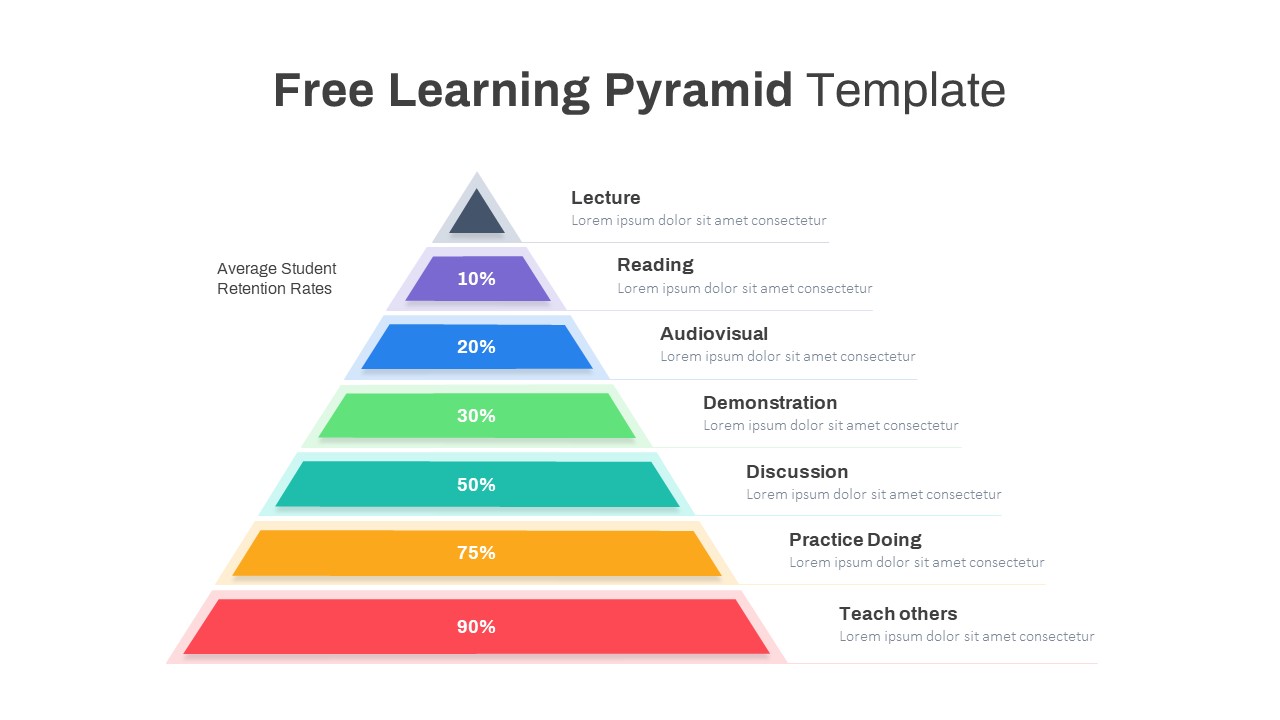
Free Learning Pyramid PowerPoint Template
Pyramid
Free
-
Stage Pyramid Diagram PowerPoint Template and Keynote
3D Shapes
Premium
-
5 Stage Infographics Pyramid Diagram Template for PowerPoint and Keynote
Pyramid
Premium
-
Food Pyramid PowerPoint Template
Pyramid
Free
-
3D Column Chart for PowerPoint and Keynote Presentation
PowerPoint Charts
Premium
-

Clustered Column Chart PowerPoint Template
PowerPoint Charts
Premium
-
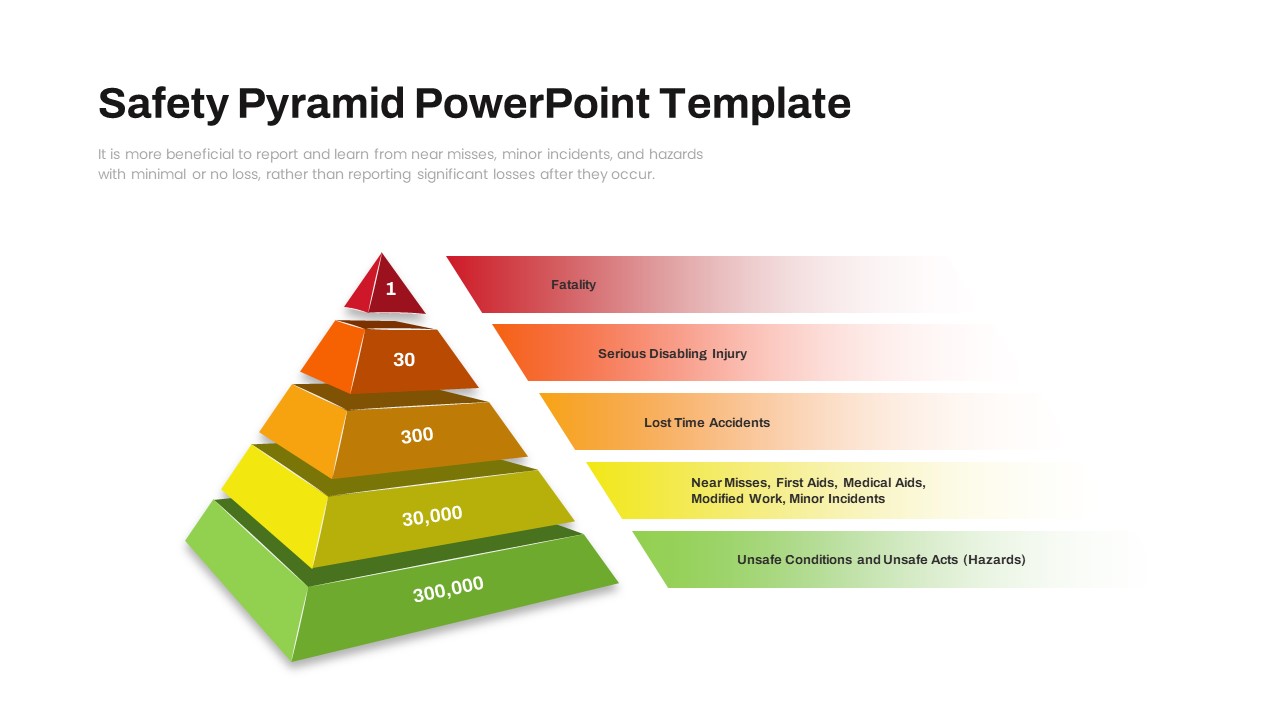
Safety Pyramid PowerPoint Template
Pyramid
Premium
-

Free AI Artificial Intelligence PowerPoint Template
PowerPoint Templates
Free
-
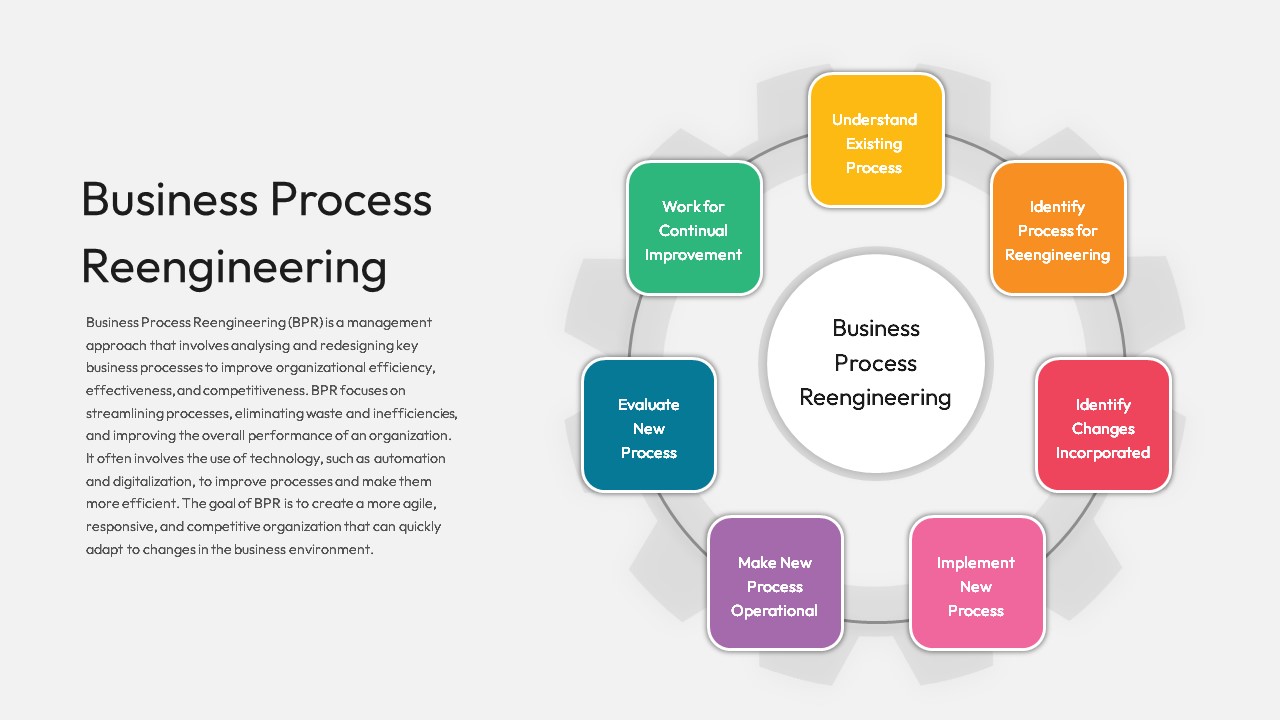
Business Process Reengineering Template
PowerPoint Templates
Premium
-

Animated Upcoming Event Poster PowerPoint Template
PowerPoint Templates
Premium
-
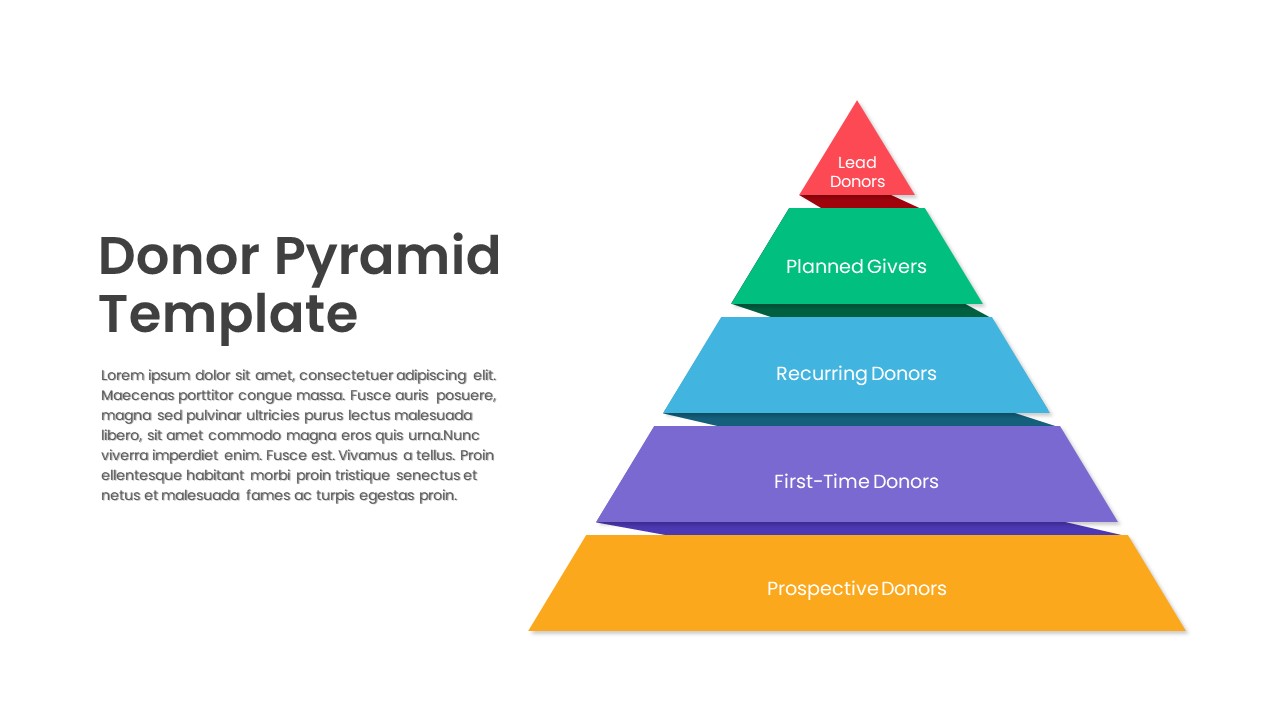
Donor Pyramid PowerPoint Template
Pyramid
Premium
-
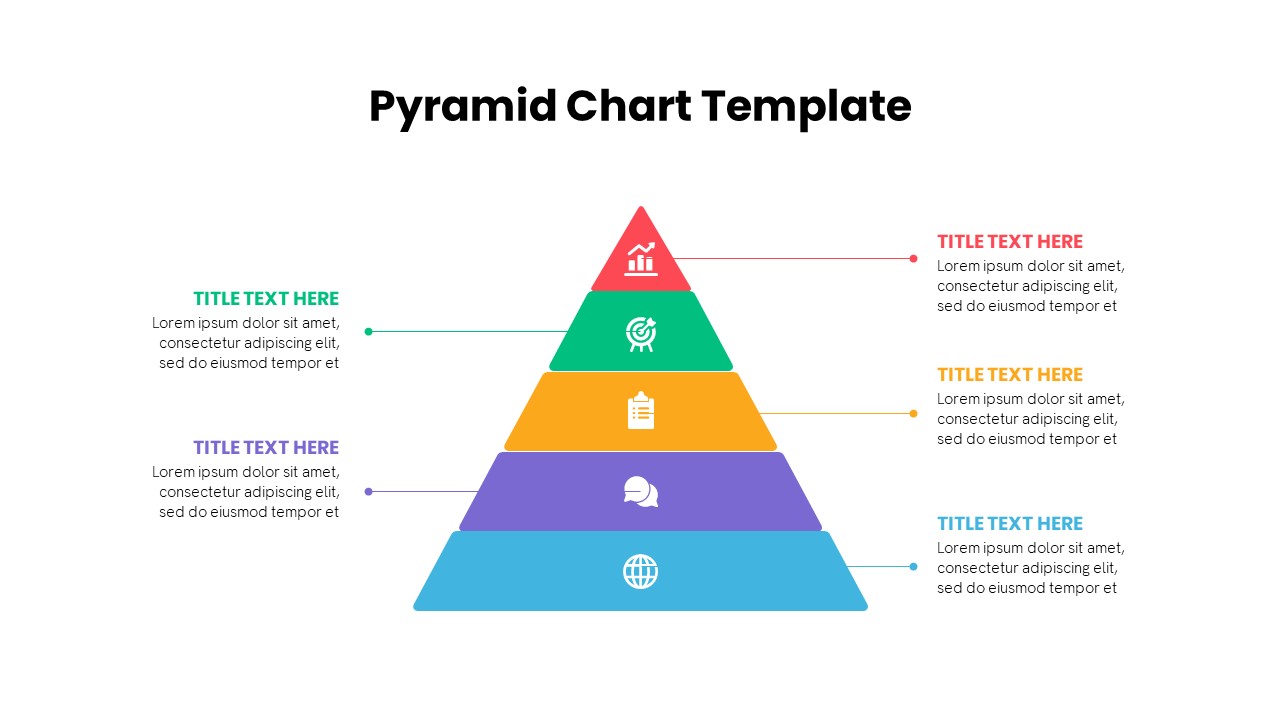
Pyramid Chart PowerPoint Template
PowerPoint Templates
Premium
-

Free Charts and Graphs PowerPoint Template
PowerPoint Templates
Free
-
3D Pyramid PowerPoint Template with Cubes
3D Shapes
Premium
-
Split Representation Donut Chart Template for PowerPoint and Keynote
Keynote Templates
Premium
-
Curry’s Client Pyramid PowerPoint Template
PowerPoint Templates
Premium
-
Evolution Line Chart PowerPoint Template
PowerPoint Templates
Premium
-
Strategy Pyramid PowerPoint Template
PowerPoint Business Templates
Premium
-
Cone Chart Data PowerPoint Template
Column and Bar chart
Premium
-
Pyramid Infographic Free PowerPoint and Keynote template
Pyramid
Free
-
Goal Achievement Pyramid Template for PowerPoint and Keynote
Diagrams
Premium
-
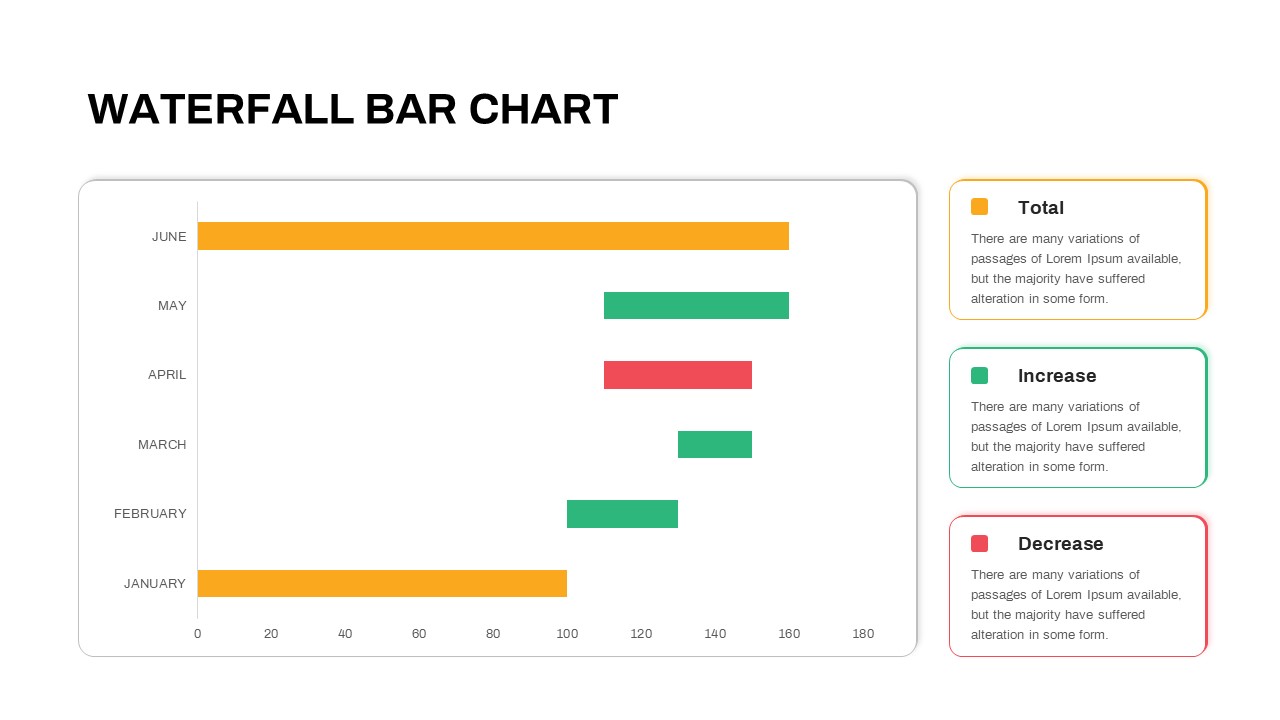
Waterfall Bar Chart PowerPoint Template
PowerPoint Charts
Premium
-
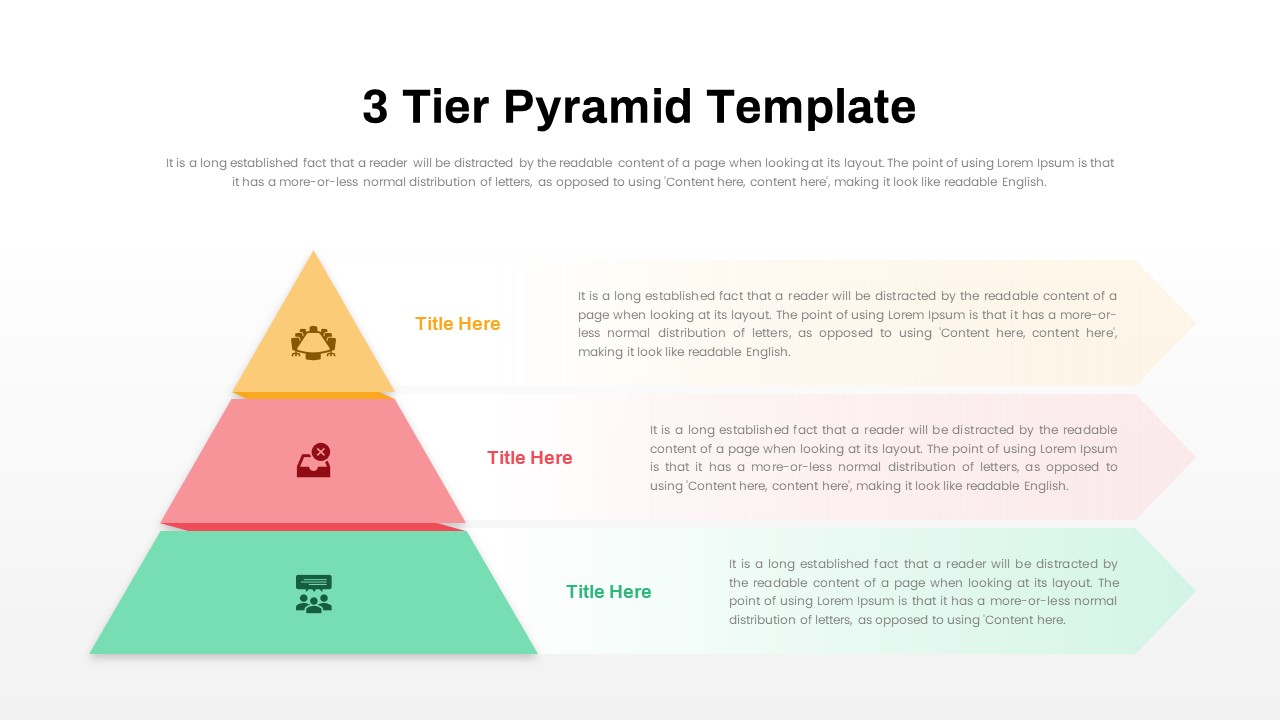
3 Tier Pyramid PowerPoint Template
Pyramid
Premium
-
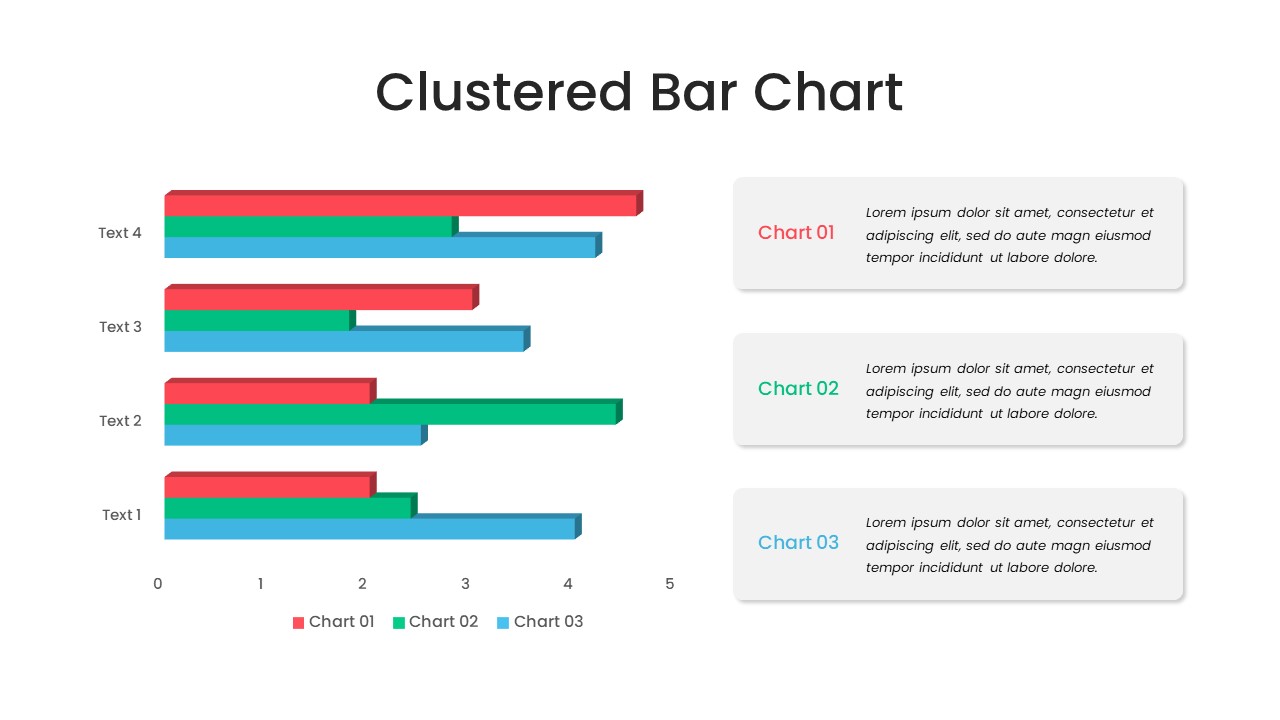
Clustered Bar Chart PowerPoint Template
Column and Bar chart
Premium
-
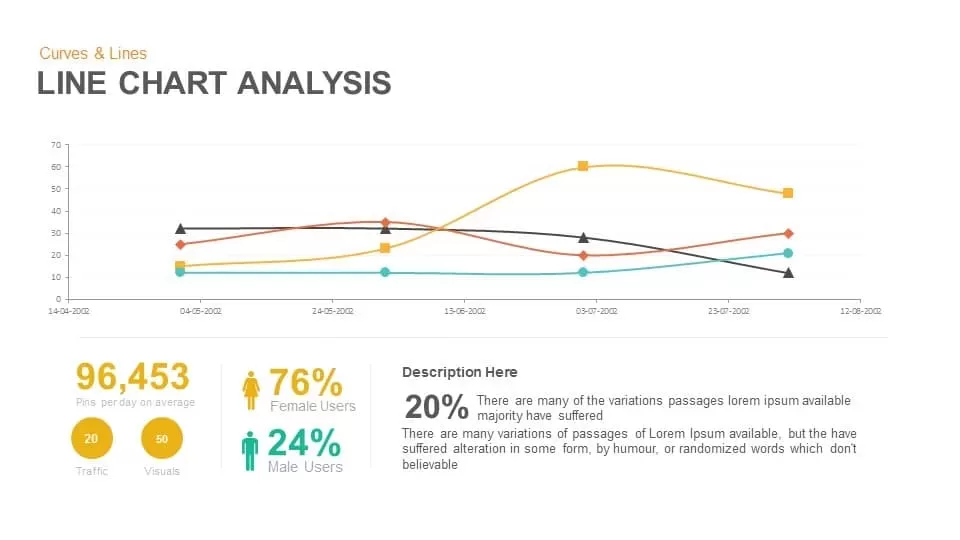
Line Chart Analysis PowerPoint Template and Keynote Slide
Curves and Lines
Premium
-

Open Door Policy PowerPoint Template
PowerPoint Templates
Premium
-
5 Staged Infographic Pyramid PowerPoint Template and Keynote
Pyramid
Premium
-
4 Stage Pyramid Diagram Template for PowerPoint and Keynote
Pyramid
Premium
-
Pyramid Of CSR Template
Pyramid
Premium
-
Simple Scatter Chart PowerPoint Template
PowerPoint Charts
Premium
-
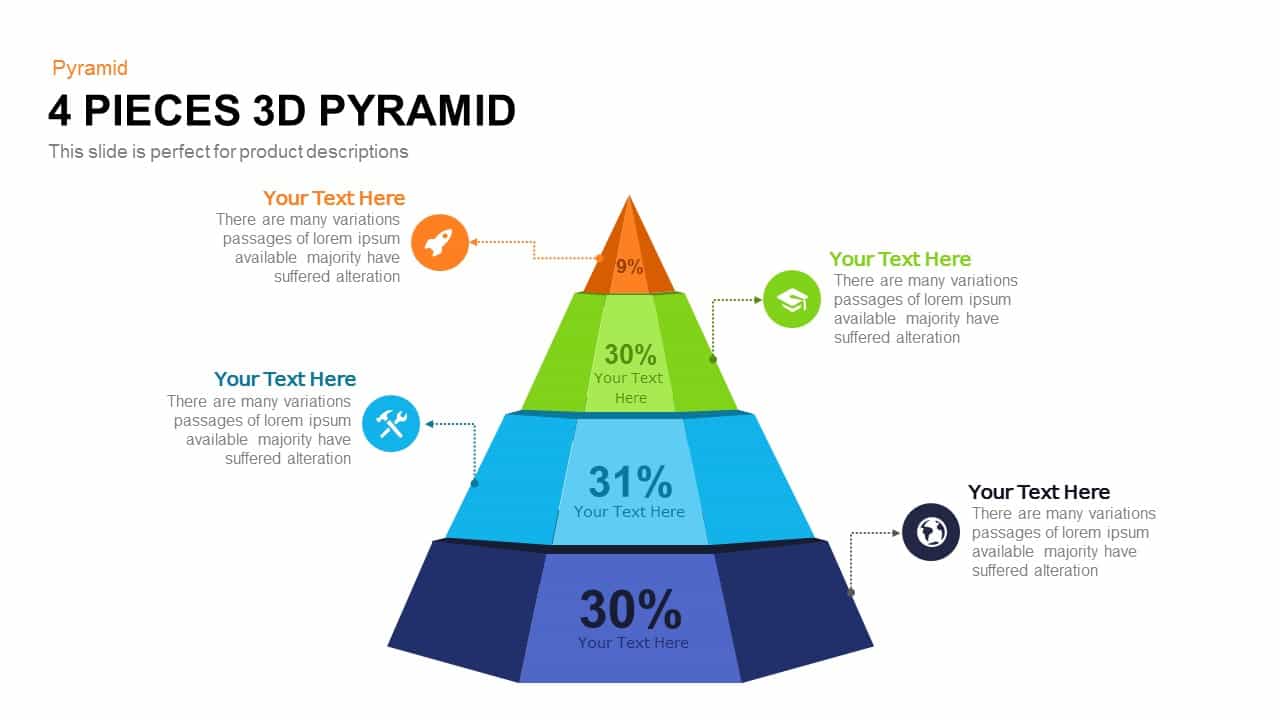
4 Pieces 3d Pyramid PowerPoint Template and Keynote Slide
Pyramid
Premium
-
8 Section Donut Chart PowerPoint Template and Keynote Slide
Circular Diagrams
Premium
-
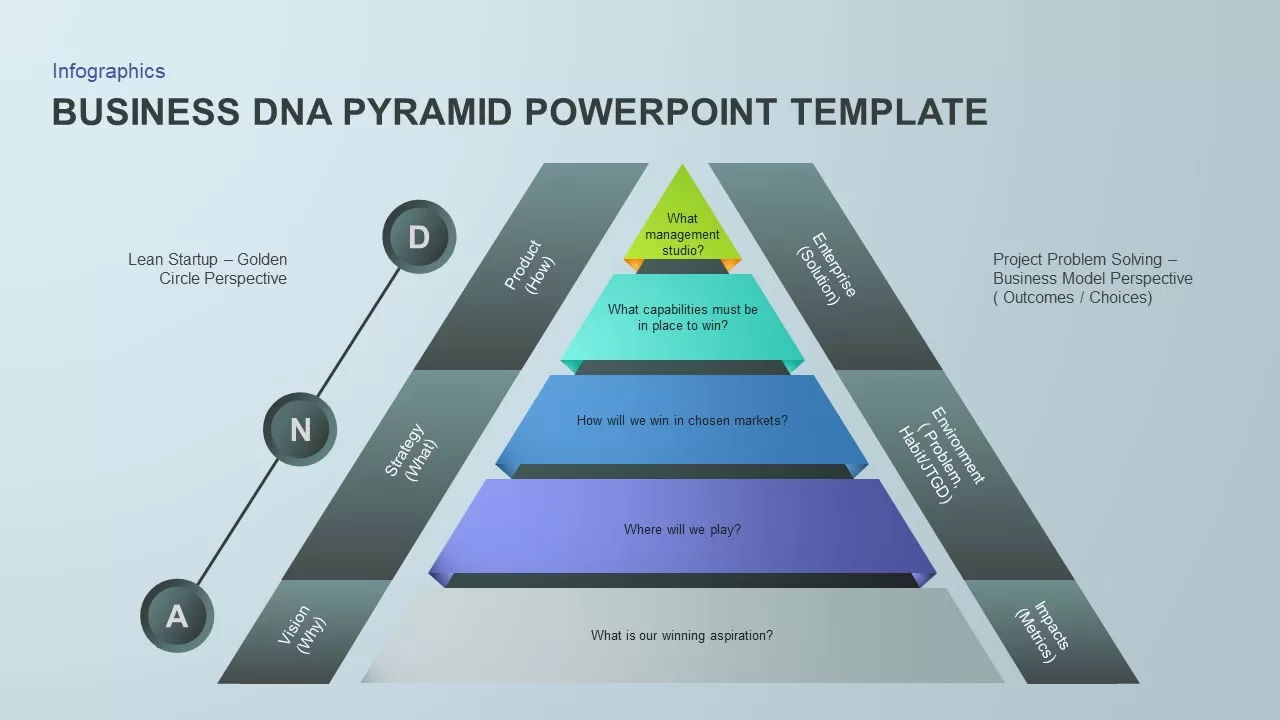
Business DNA Pyramid PowerPoint Template
Pyramid
Premium
-

Creative Bar Chart Data Analysis PowerPoint Template and Keynote
Infographic
Premium
-
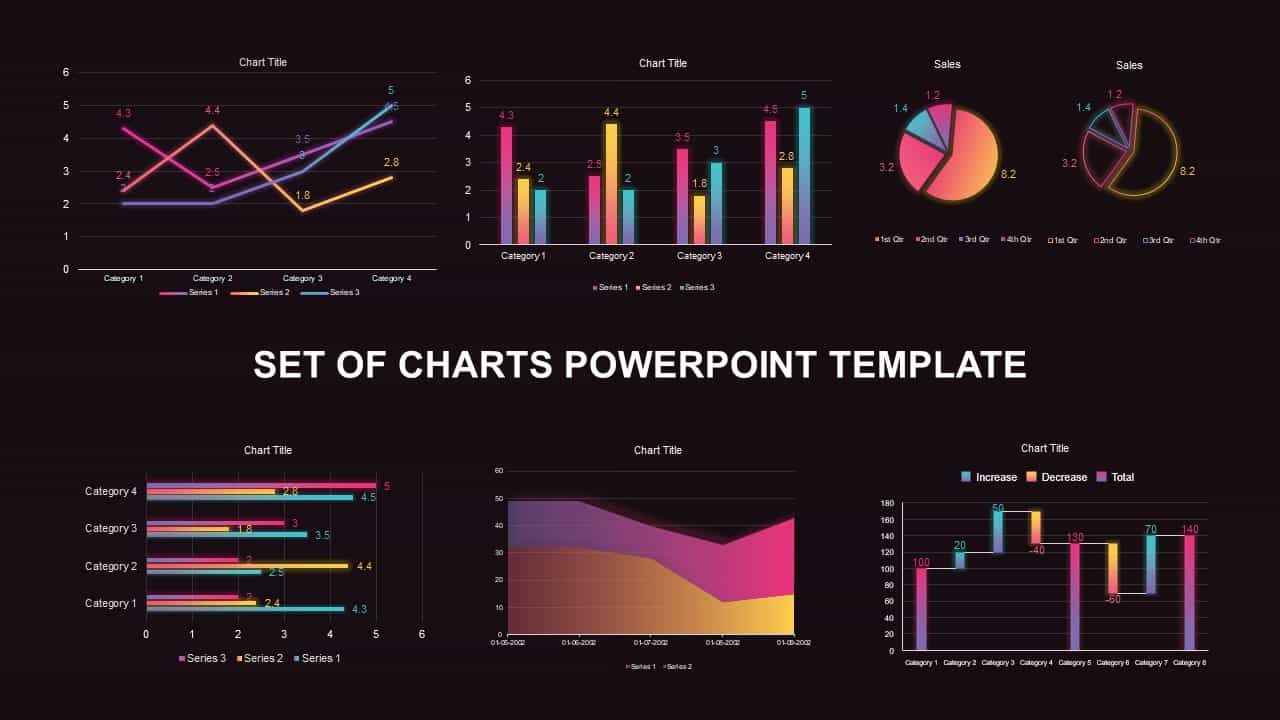
Set of Chart PowerPoint Template and Keynote Diagram
PowerPoint Charts
Premium
-

Pencil Bar Chart PowerPoint Template and Keynote Slide
Column and Bar chart
Premium
-

X Y Bubble Chart PowerPoint Template
PowerPoint Charts
Premium
-
Combination Chart PowerPoint Template
PowerPoint Charts
Premium
-
Arrow Line Chart PowerPoint Template
Arrow Diagrams
Premium
-
7 Level Pyramid Template for PowerPoint and Keynote
Business Models
Premium
-
Polynomial Combination Chart PowerPoint Template and Keynote Slide
Column and Bar chart
Premium
-
3 D Funnel Template
Funnel Diagrams
Premium
-

Segmented Scatter Chart PowerPoint Template
PowerPoint Charts
Premium
-
Free 3d Pie Chart PowerPoint Template & Keynote slide
Pie & Donut
Free
-
4 Step Core Values PowerPoint Template
Business Models
Premium
-

Biotechnology PowerPoint Presentation Template
PowerPoint Templates
Premium
-
Lencioni Trust Pyramid PowerPoint Template
Pyramid
Premium
-
Product Market Fit Pyramid PowerPoint Template
Pyramid
Premium
-
Proportional Area Chart PowerPoint Template
PowerPoint Templates
Premium


