


Project Management Dashboard PowerPoint Template and Keynote Template
- Version
- Download 1586
- File Size 0.00 KB
- File Count 1
- Create Date February 1, 2017
- Last Updated November 14, 2023
Project Management Dashboard PowerPoint Template and Keynote Template
Project Management Dashboard Powerpoint Template and Keynote Template
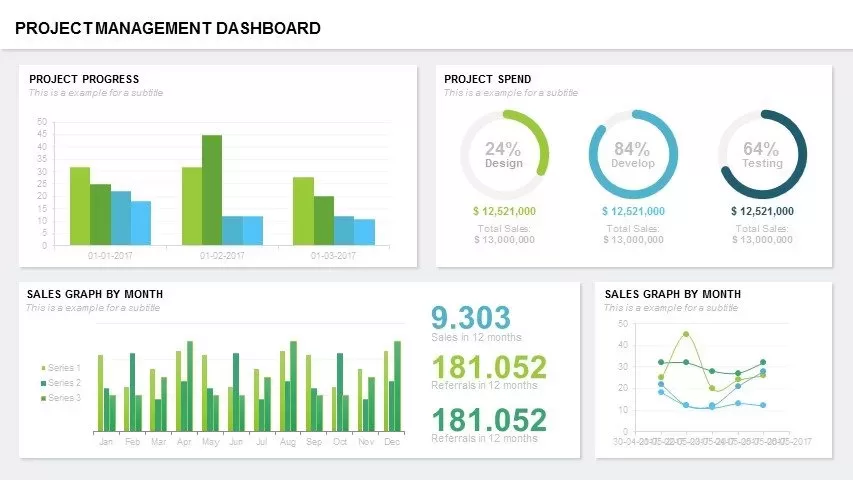
PROJECT MANAGEMENT DASHBOARD POWERPOINT TEMPLATE is a powerpoint and keynote presentation design that can help to monitor the exact status of an ongoing project. A valuable tool for project managers, proprietors, and team leaders. Within a short time span, it can display project reports, current tasks, on-hold projects, completion status or percentage of work done and other necessary information. Project management dashboard conveys an overall summary of the project that is crucial for its progress. This may include stages, status, workload, financial allocation for employees, project launch date, etc. The template comprises four unique slides that support the project manager to summarize the development of an ongoing project. A presenter can use these four distinct slides to show project status. The dashboard contains; bar chart, donut chart, Gantt chart and linear arrow diagram, which will show the duration and completion of each activity. On an operational level, it may be useful as an application which will show weekly and monthly progress because the user can customize the figure and data more conveniently. The project management dashboard PowerPoint template is ultimately perfect for corporate, and team presentation that emphasizes time management and risk management.
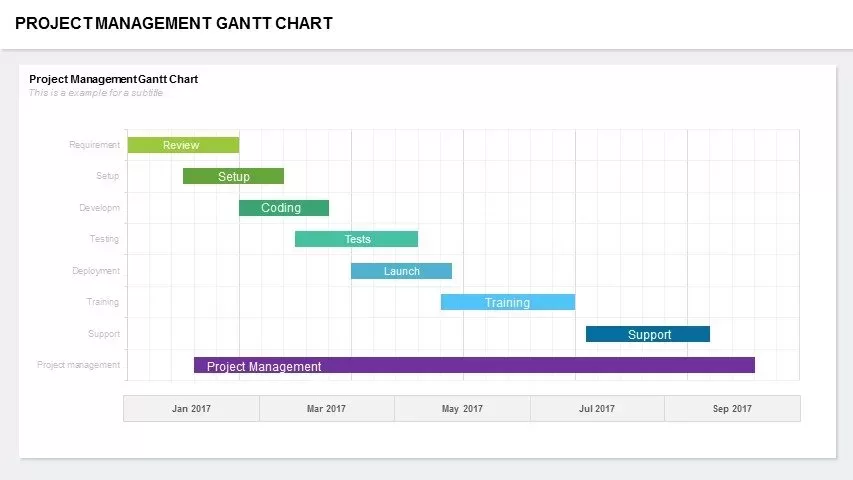
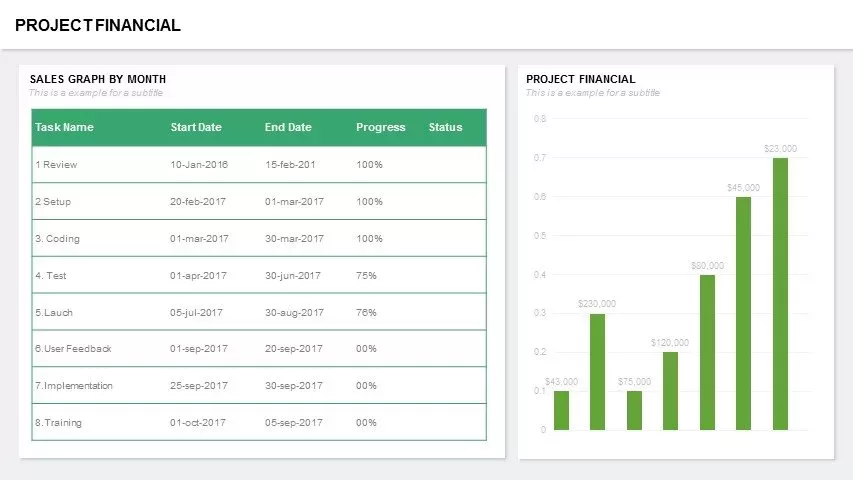
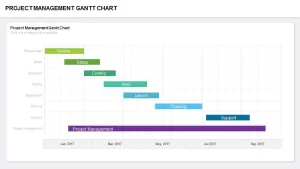
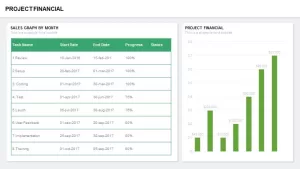
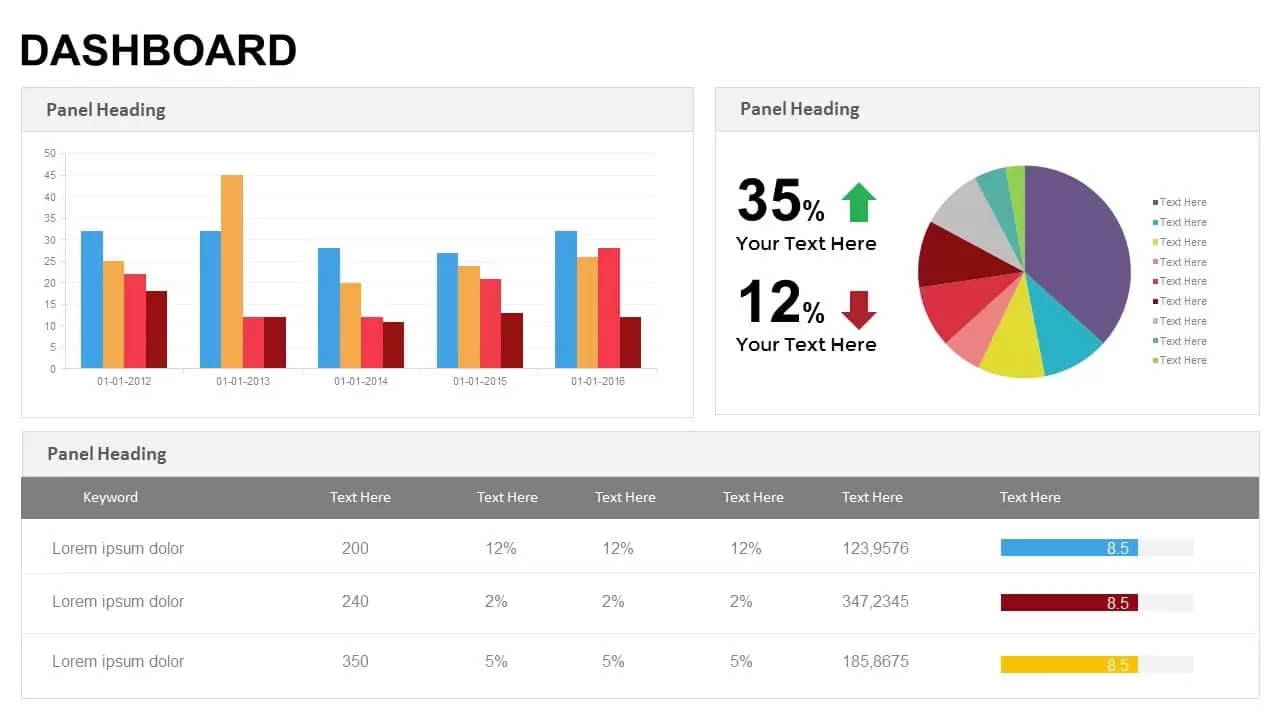
The Project Management Dashboard Powerpoint Template uses a beautiful theme to present with each of its slides designed in a perfect way using the best color combinations and neat dashboard features. Each slide in this template gives a different view. The first slide represents a set of four graphical representations that includes a project process bar chart, a project expenditure pie chart, a monthly sales bar graph, and a monthly sales line graph. The second slide represents a table infographic containing the monthly sales data along with a bar graph which displays the project financing. The third slide represents the project management Gantt chart that shows the different stages of the project and also narrates the time taken to complete each of those project stage and total project completion time. And, the last slide that has used an arrow chart that represents the timeline infographics of each step covered in the project management. All this together make up a perfect template for a project management dashboard along with which you can make easy customizations according to your convenience.
Attached Files
| File |
|---|
| https://premiumdownloads.s3.amazonaws.com/SB00666-Project-Management-Dashboard.zip |
Login to download this file
Add to favorites
Add to collection
-

Item ID
SB00666 -

Related Templates
-
Free Project Dashboard PowerPoint Template & Keynote Slide
Free PowerPoint Templates
Free
-
Website Performance Dashboard PowerPoint Template and Keynote
Infographic
Premium
-
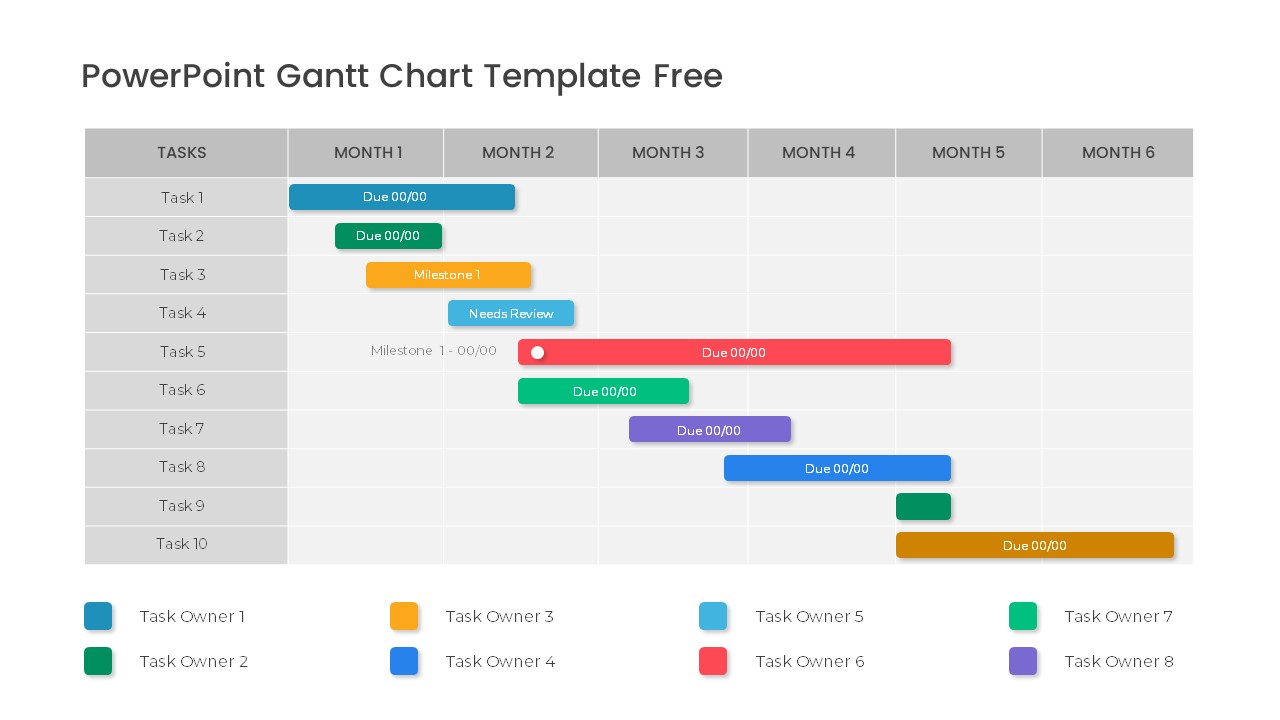
Free PowerPoint Gantt Chart Template
PowerPoint Charts
Free
-

Sales Dashboard Template for PowerPoint and Keynote
Infographic
Premium
-

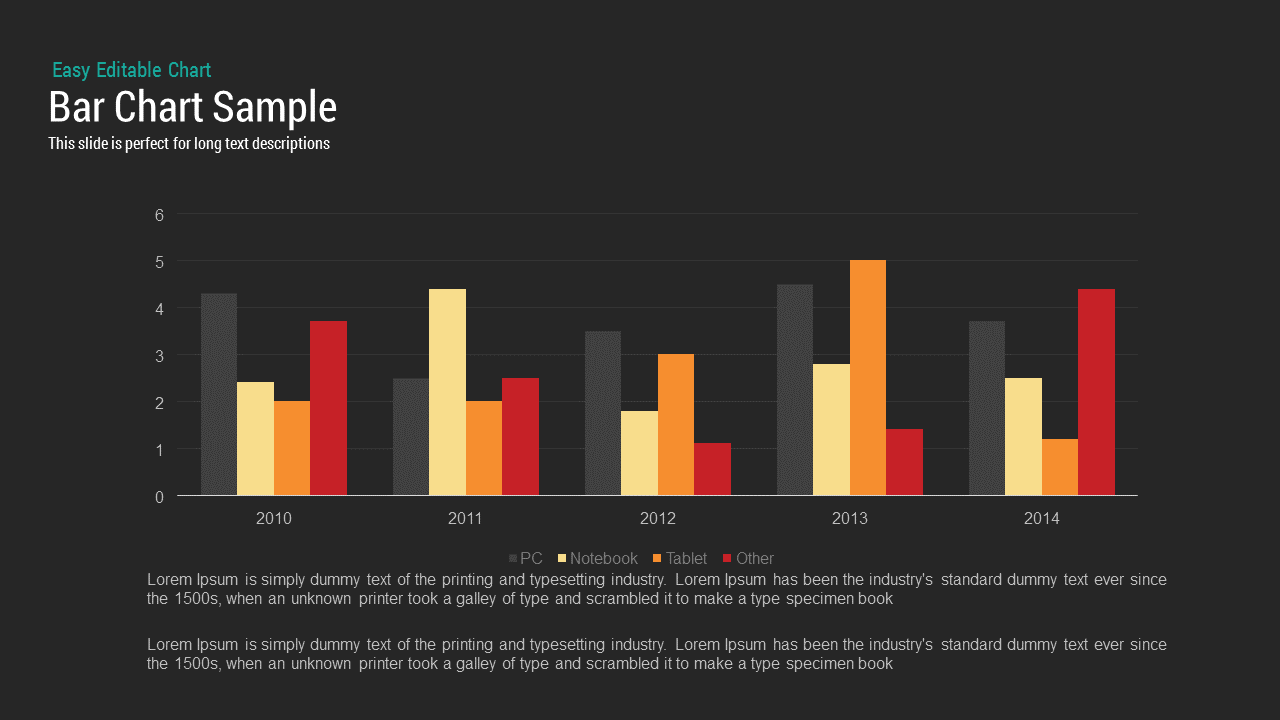
Creative Bar Chart Data Analysis PowerPoint Template and Keynote
Infographic
Premium
-
Dashboard Powerpoint Templates and Keynote template
Keynote Templates
Premium
-

Pencil Bar Chart PowerPoint Template and Keynote Slide
Column and Bar chart
Premium
-
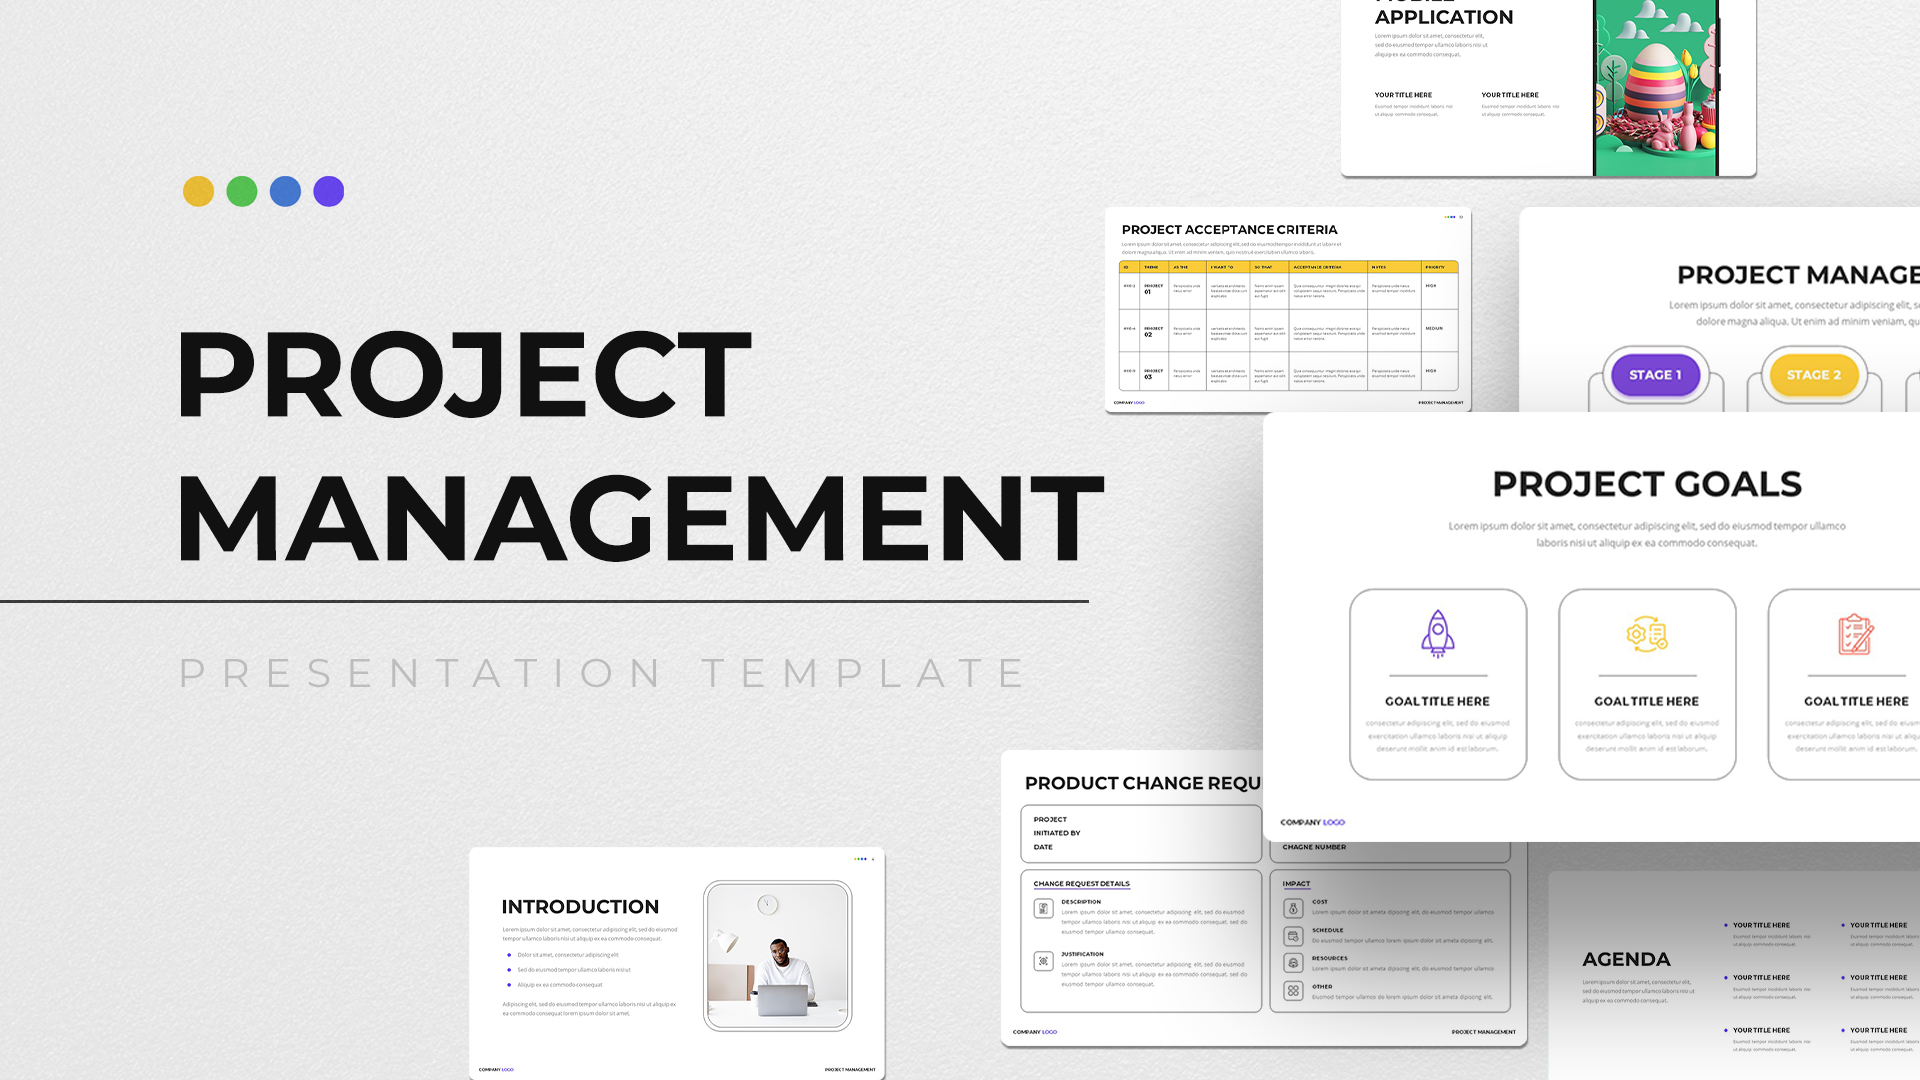
Project Management Presentation Template
PowerPoint Business Templates
Premium
-
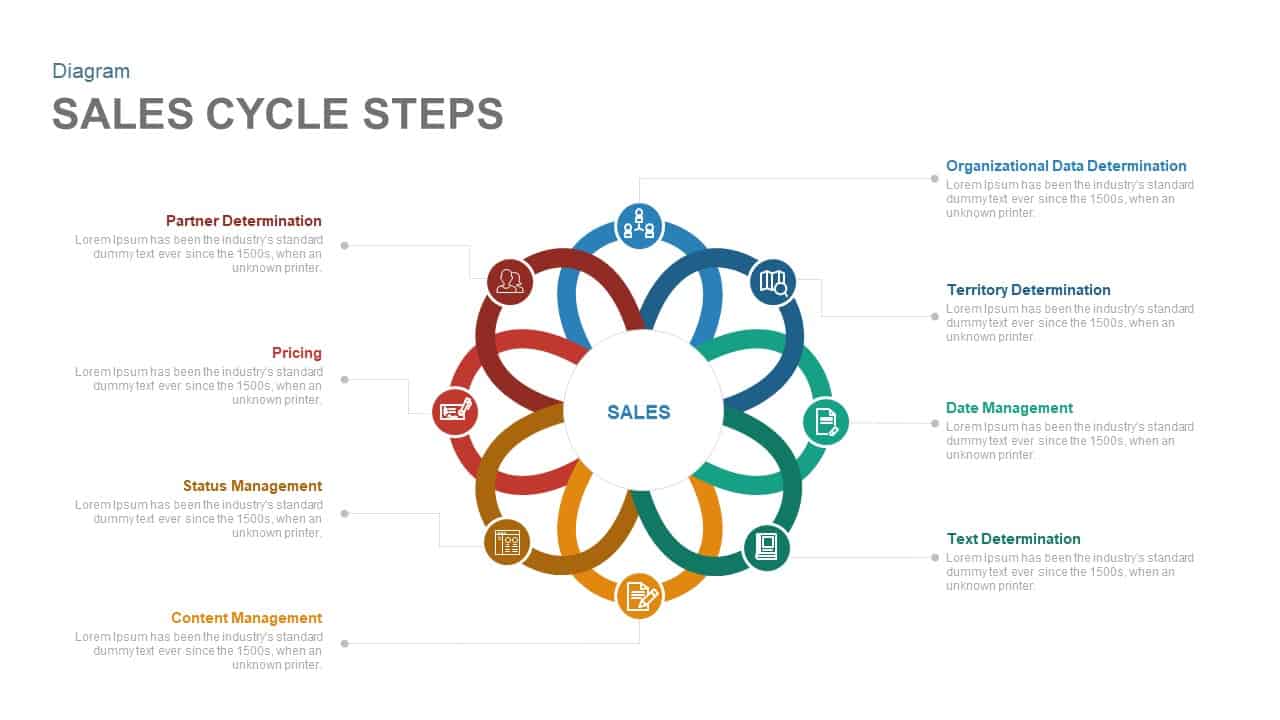
Sales Cycle Steps PowerPoint Template and Keynote Template
Circular Diagrams
Premium
-
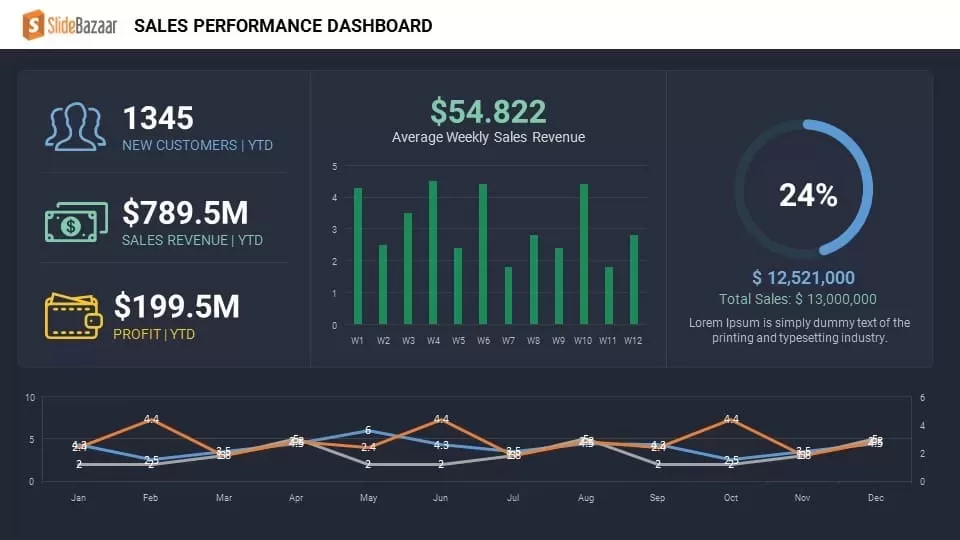
Sales Performance Dashboard Keynote and PowerPoint template
PowerPoint Charts
Premium
-
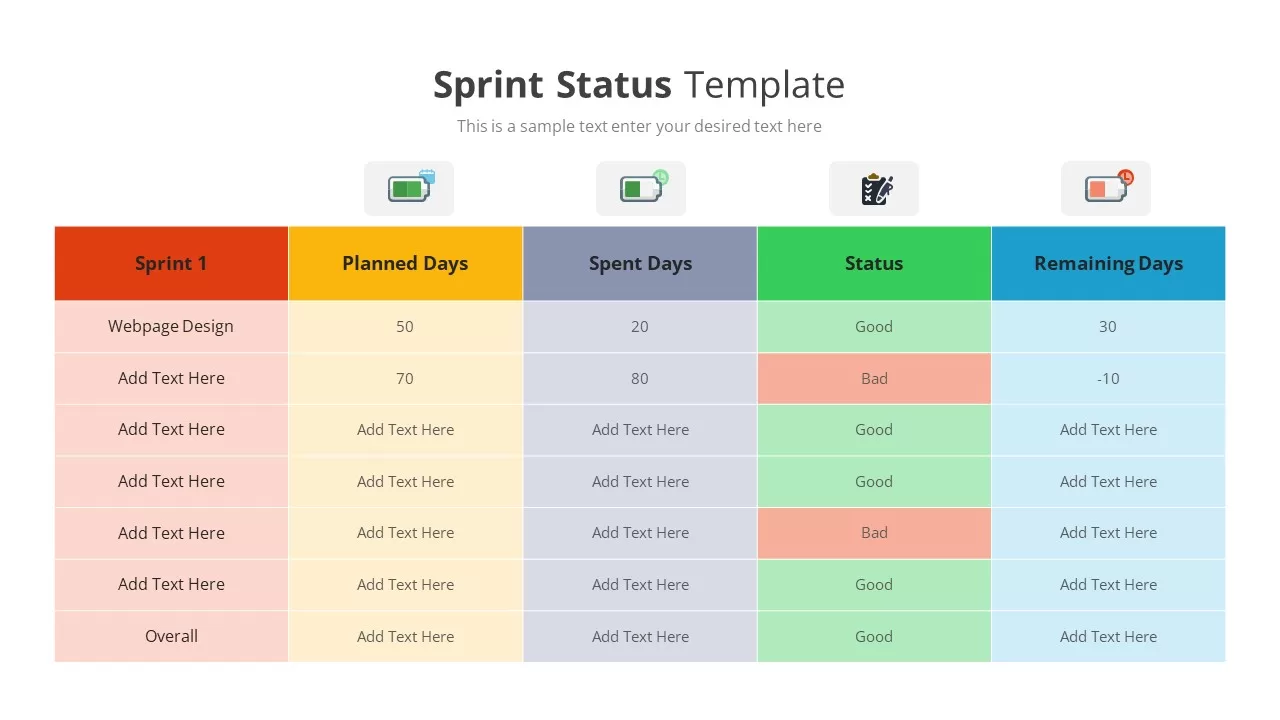
Sprint Status Template
Text and Table
Premium
-
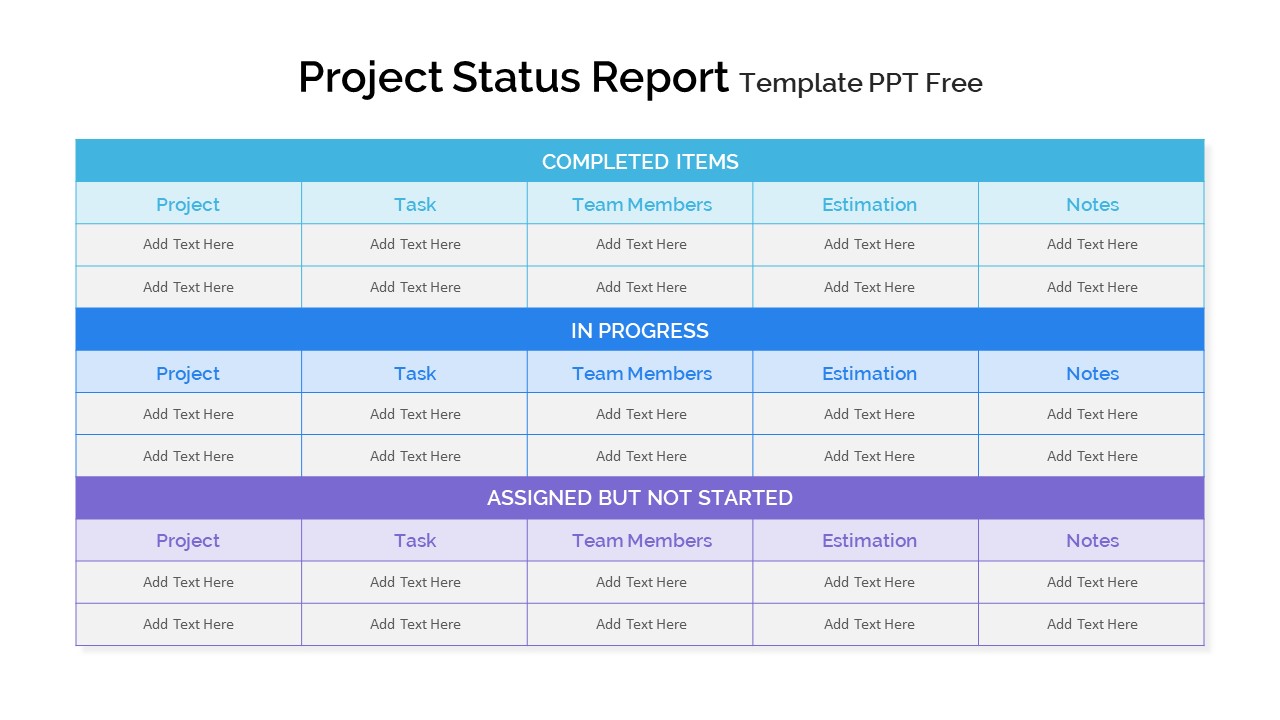
Project Status Report PowerPoint Template Free
PowerPoint Templates
Free
-
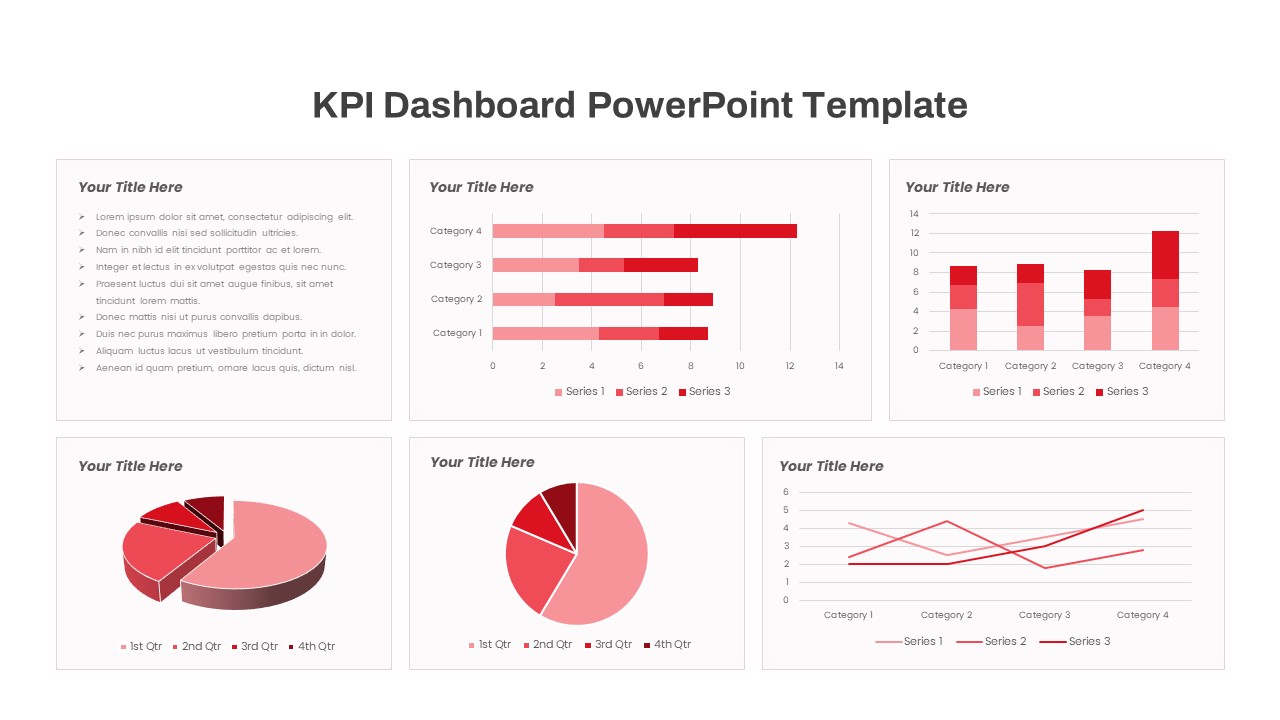
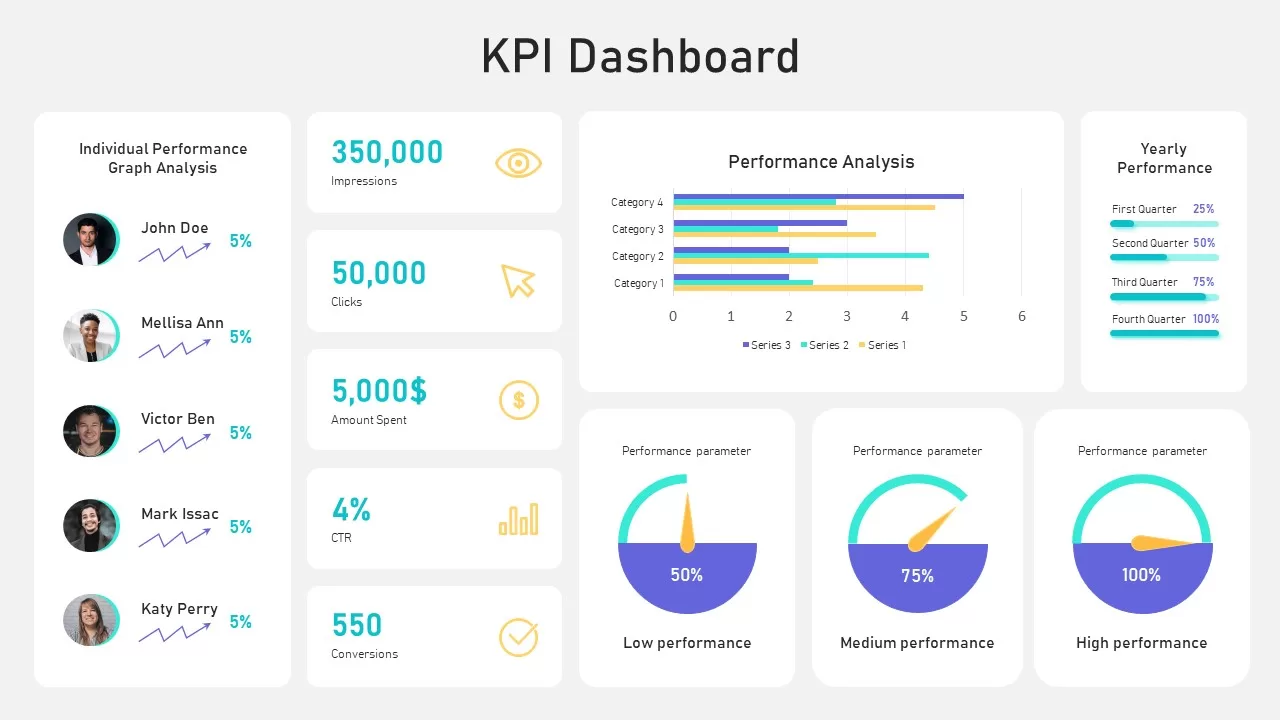
Free KPI Dashboard PowerPoint Template
PowerPoint Templates
Free
-
Free Weekly Status Report PowerPoint Template
PowerPoint Templates
Free
-
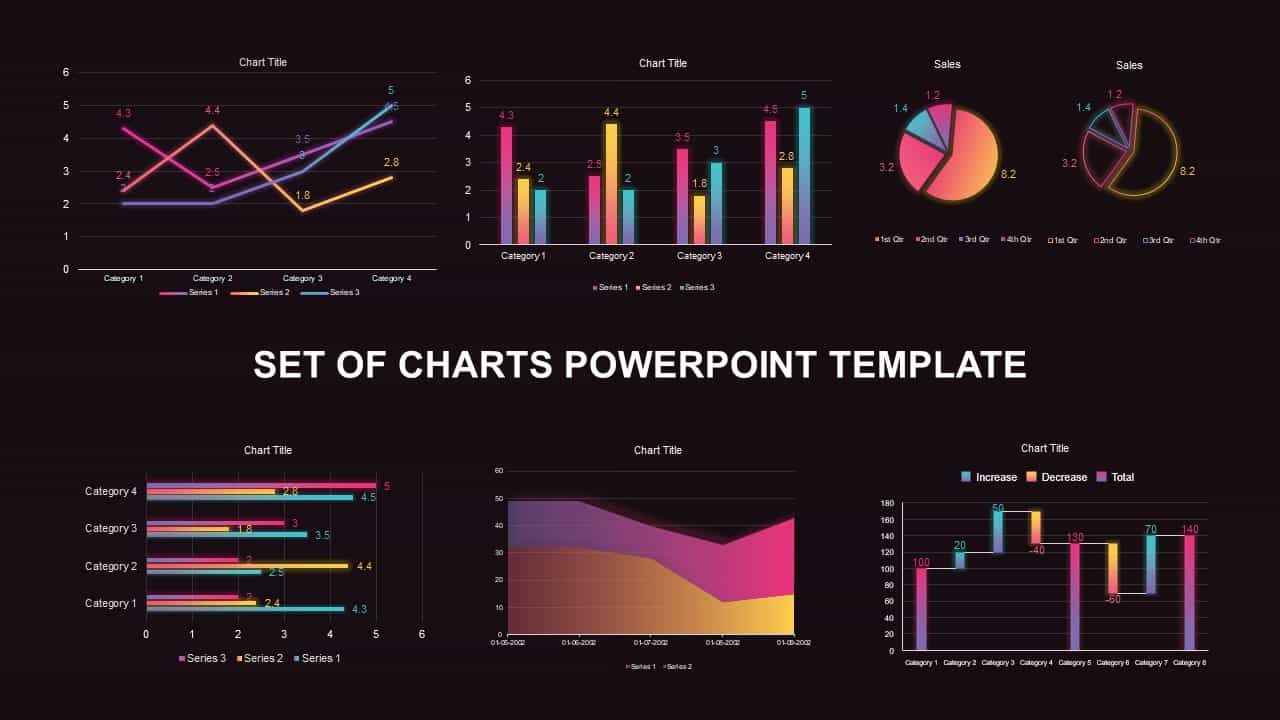
Set of Chart PowerPoint Template and Keynote Diagram
PowerPoint Charts
Premium
-
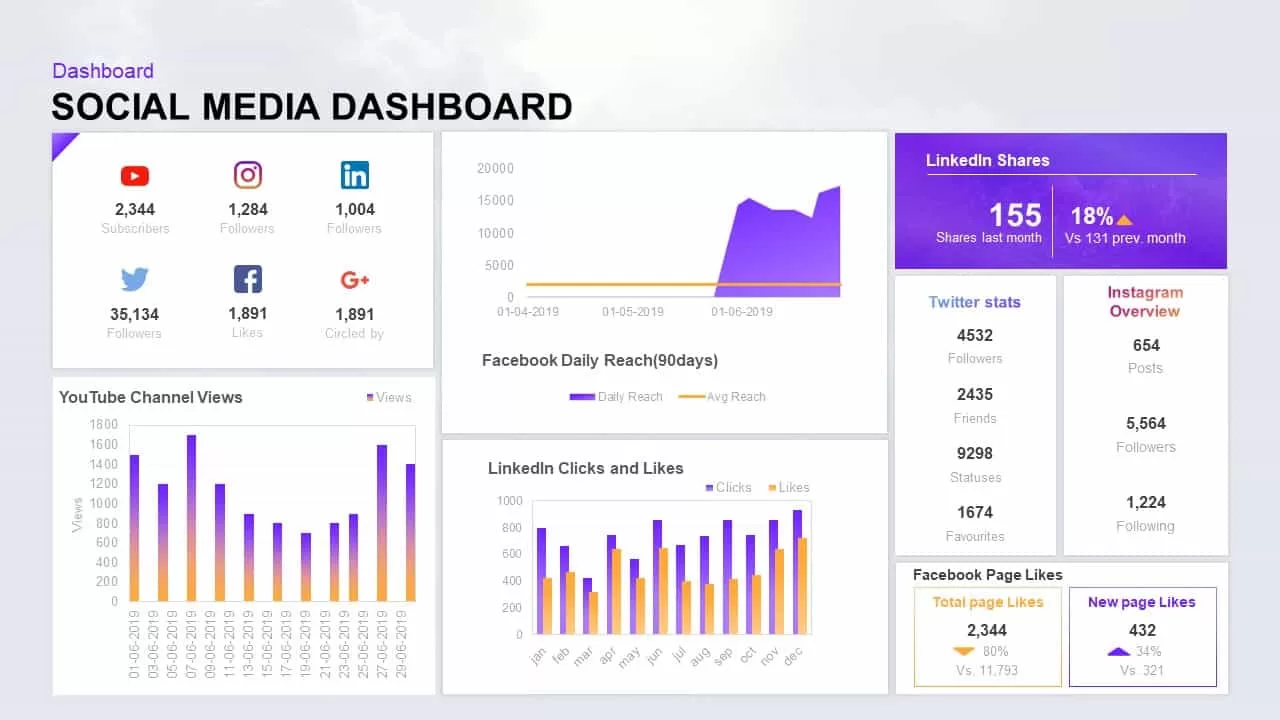
Social Media Dashboard Template for PowerPoint Presentation
Social Media
Premium
-
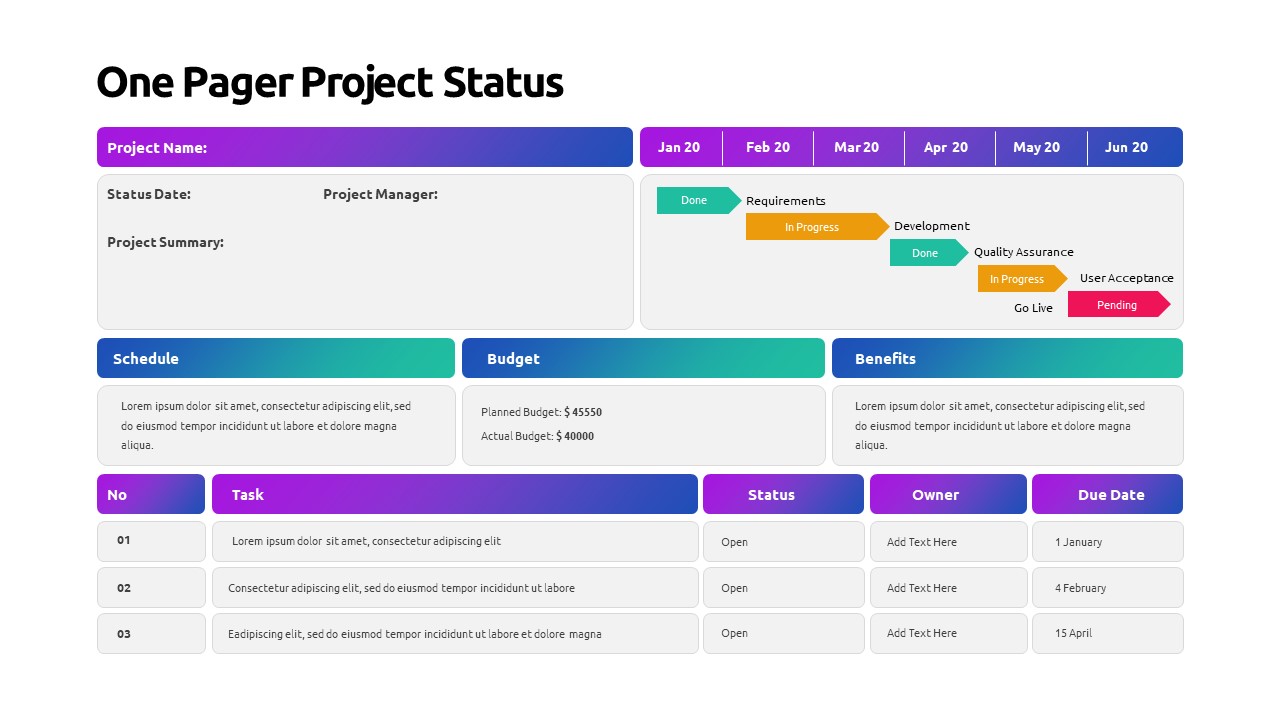
One Pager Project Status PowerPoint Template
PowerPoint Templates
Premium
-
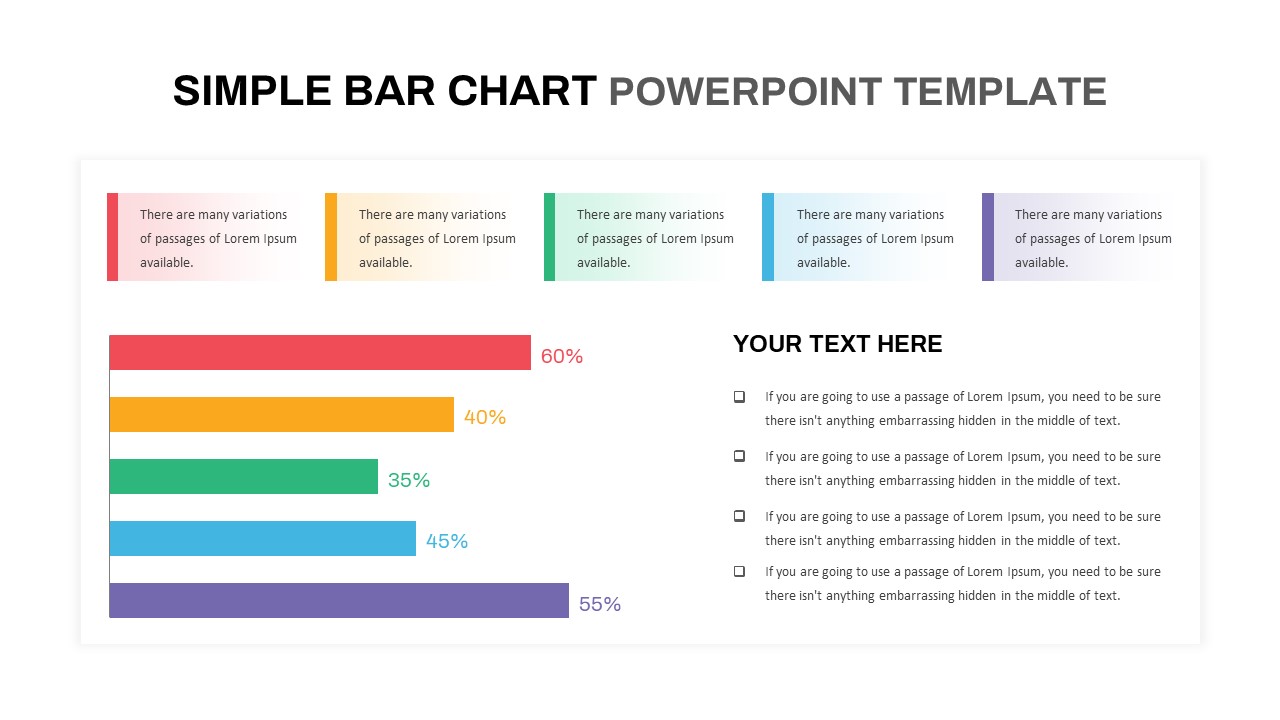
Simple Bar Chart PowerPoint Template
Column and Bar chart
Premium
-

Dashboard Template for PowerPoint Presentation
PowerPoint Charts
Premium
-
Sales Process PowerPoint Template
PowerPoint Templates
Premium
-
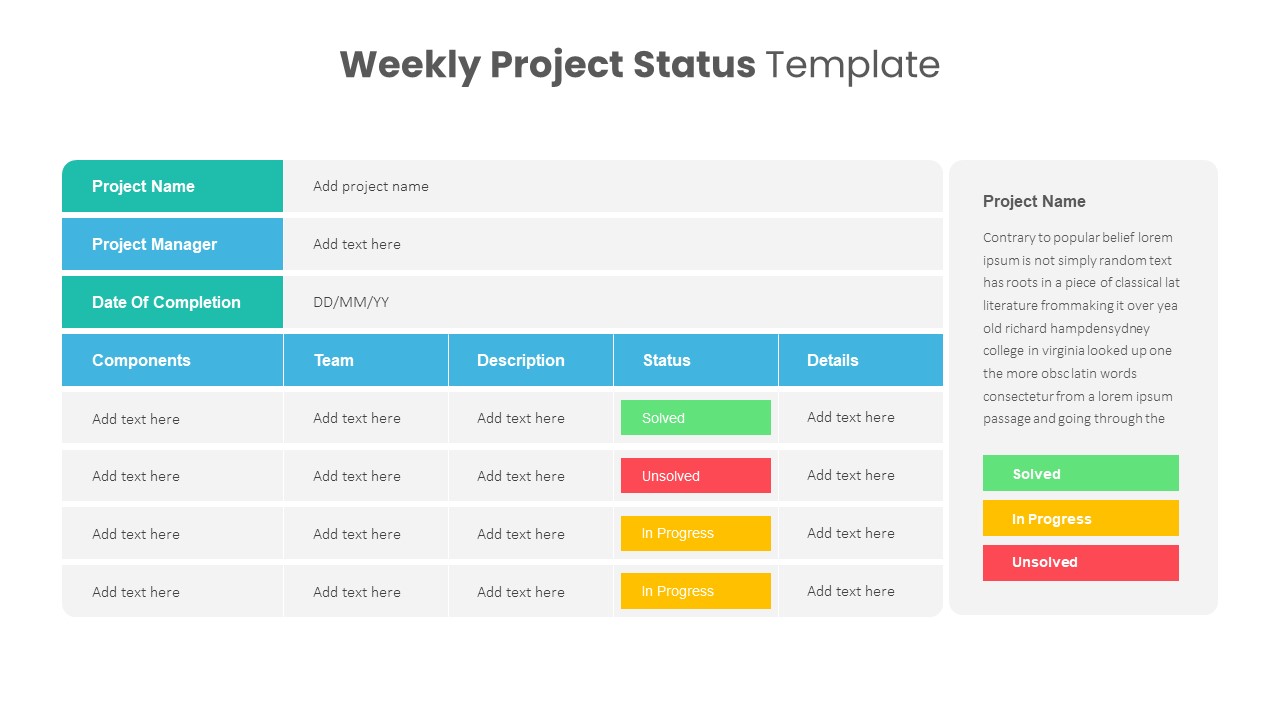
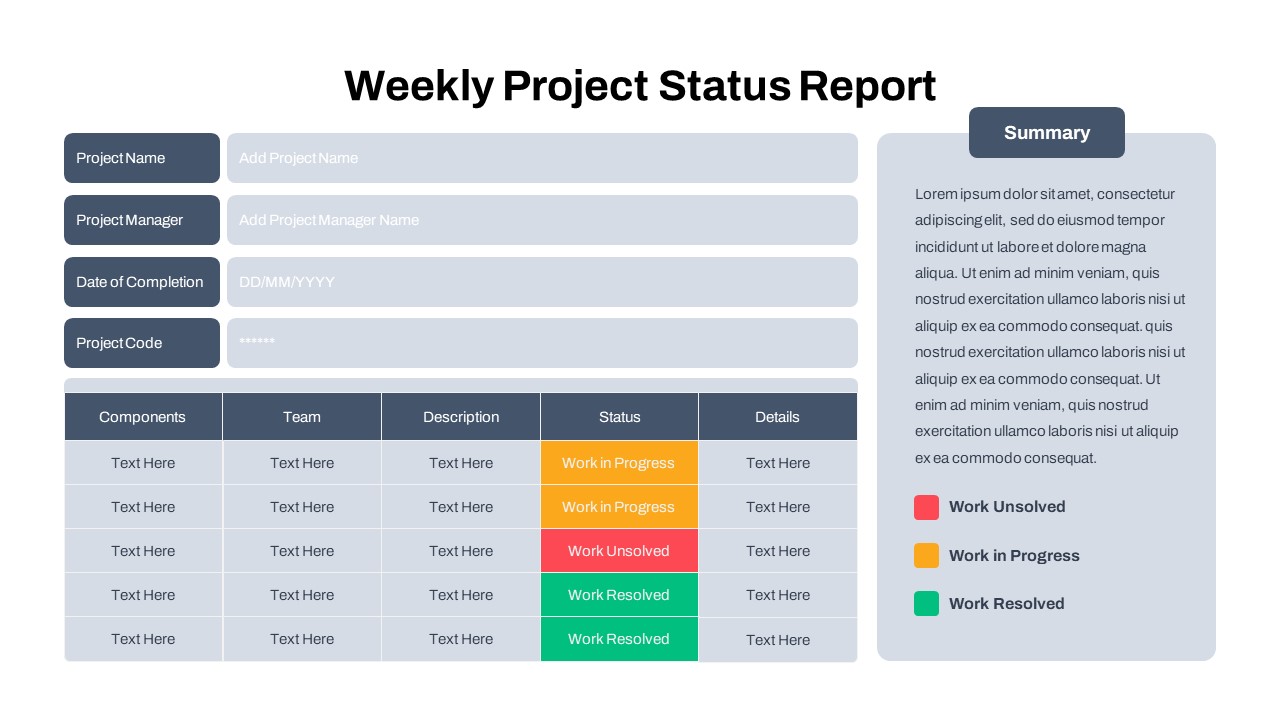
Weekly Project Status Template
PowerPoint Templates
Premium
-
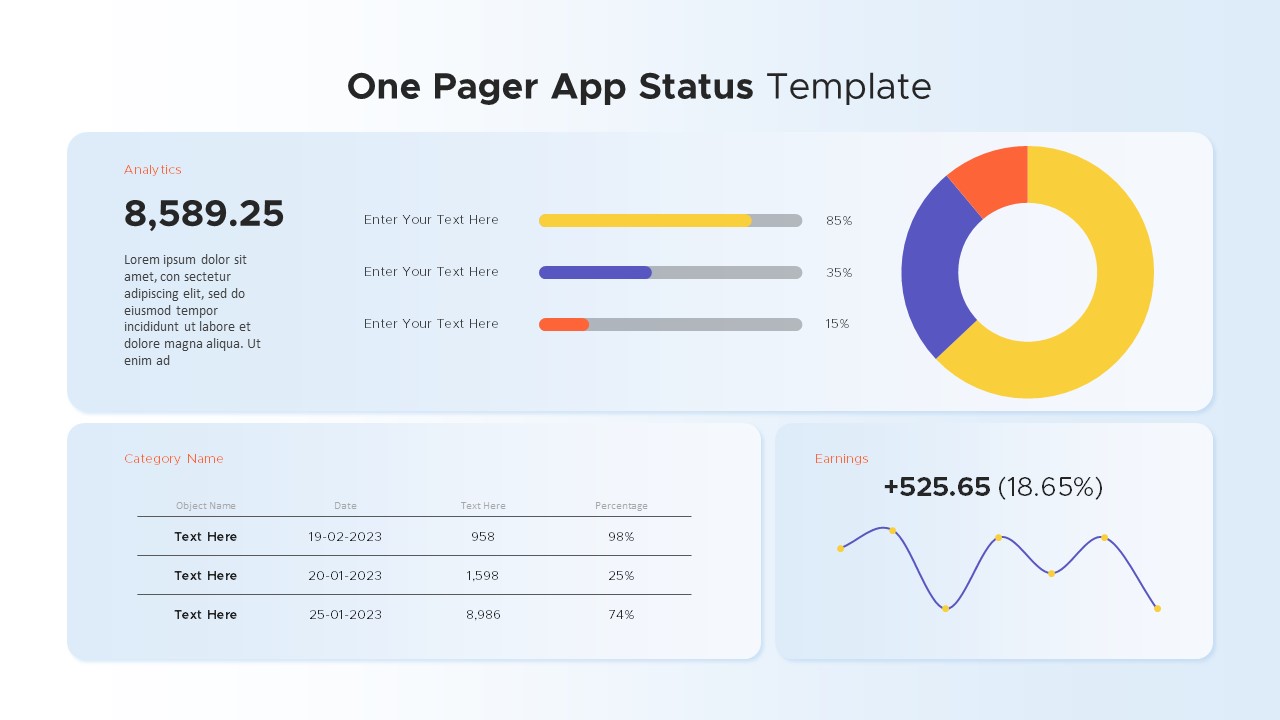
One Pager App Status PowerPoint Template
PowerPoint Charts
Premium
-
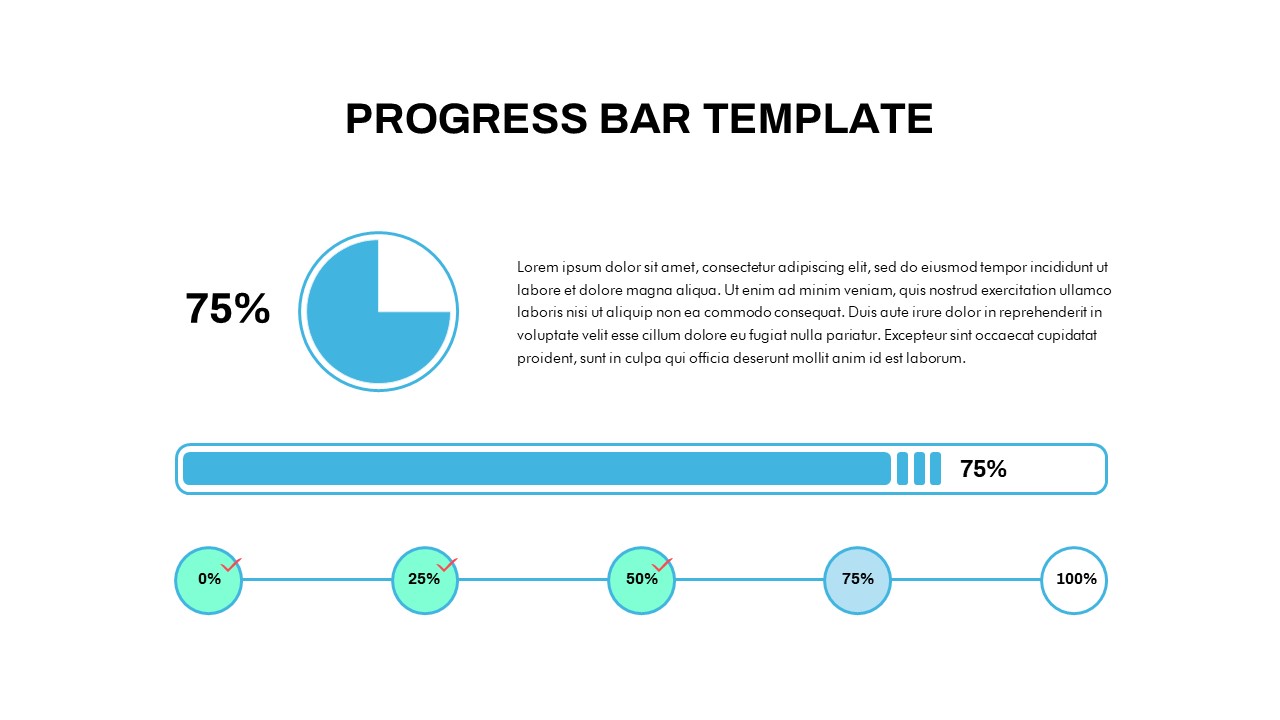
Progress Bar Chart PowerPoint Template
PowerPoint Templates
Premium
-
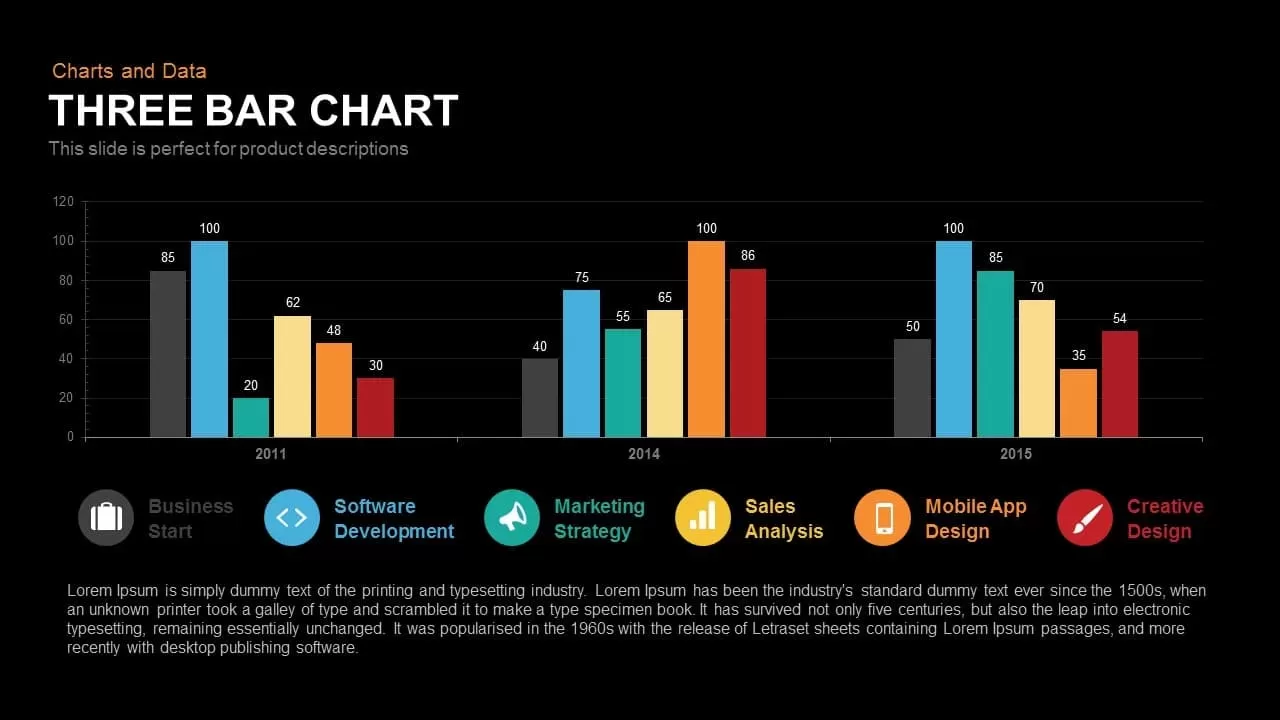
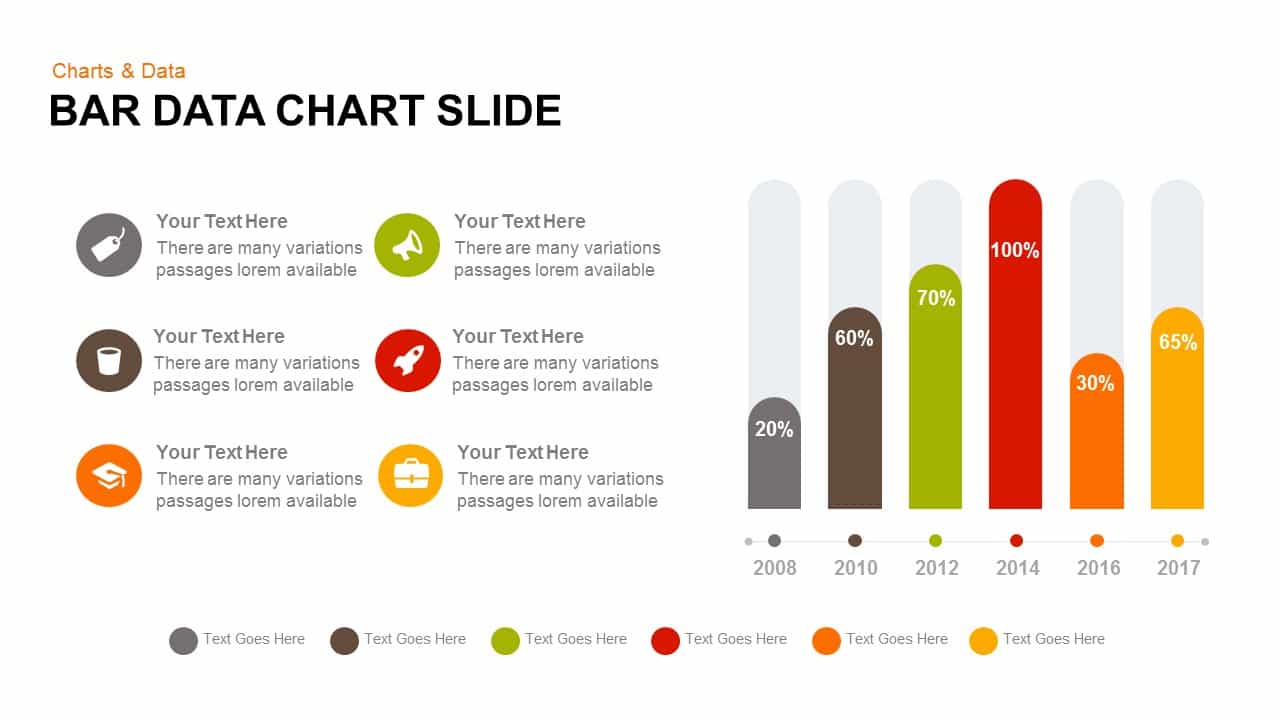
3 Bar Chart PowerPoint Template and Keynote Slide
Column and Bar chart
Premium
-
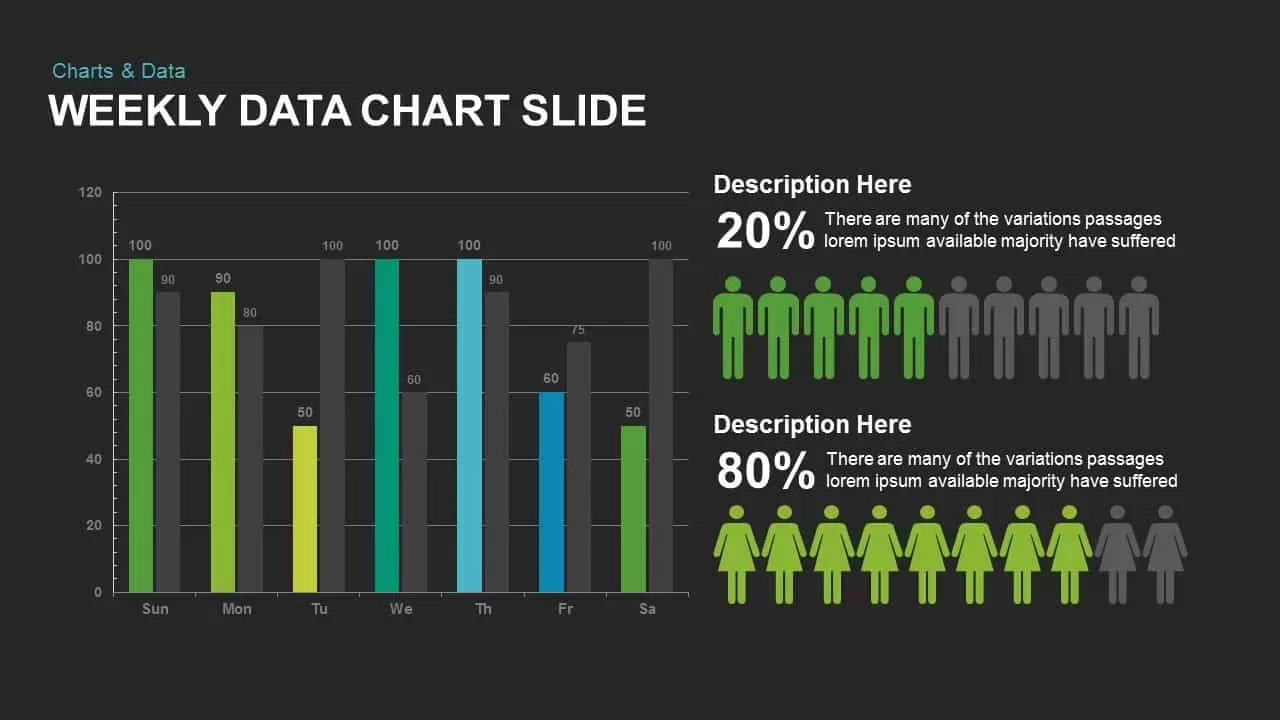
Weekly Data Charts PowerPoint Presentation Template and Keynote Slide
Infographic
Premium
-
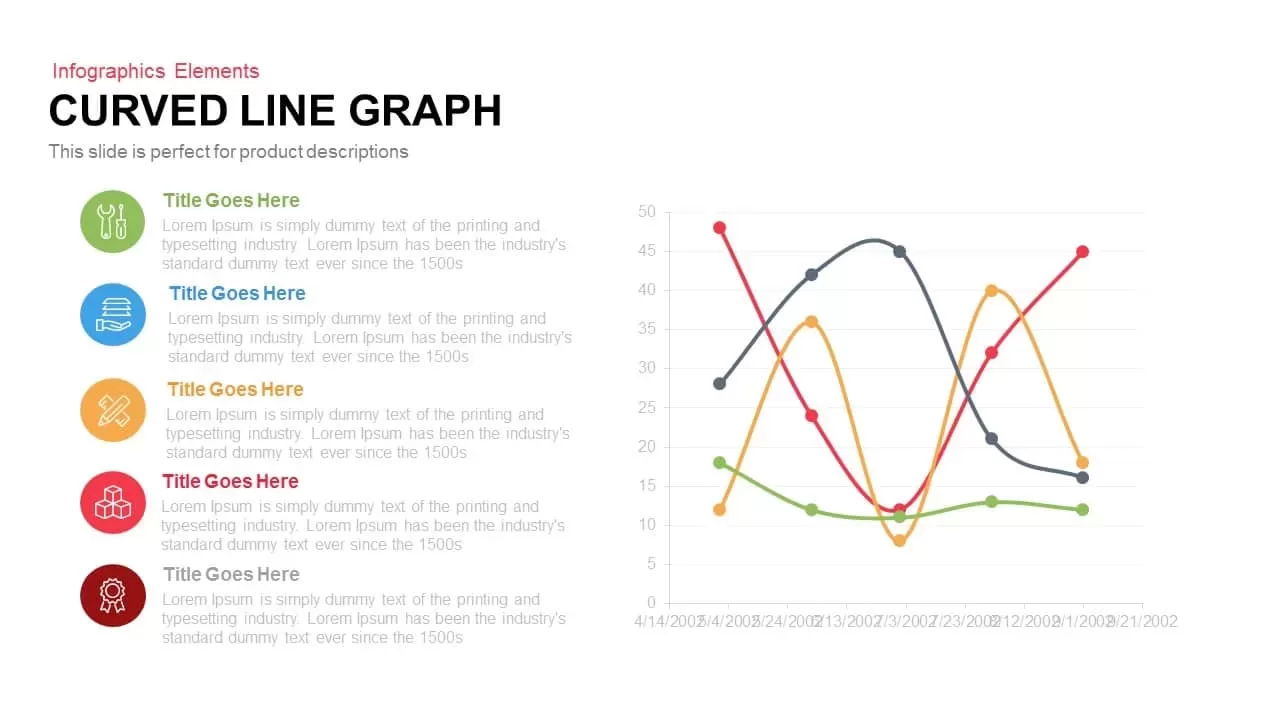
Curved Line Graph PowerPoint Template and Keynote Slide
Curves and Lines
Premium
-
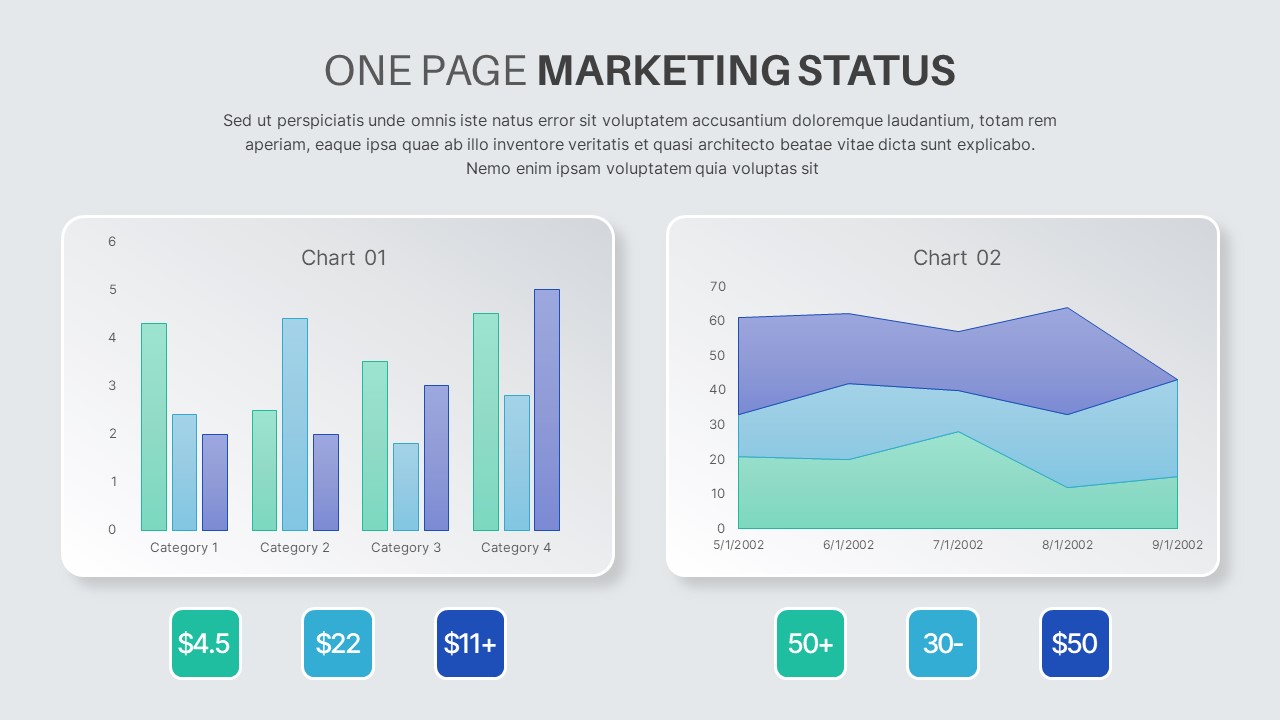
One Pager Marketing Status PowerPoint Template
PowerPoint Templates
Premium
-

Radial Bar Chart PowerPoint Templates and Keynote Slides
PowerPoint Charts
Premium
-
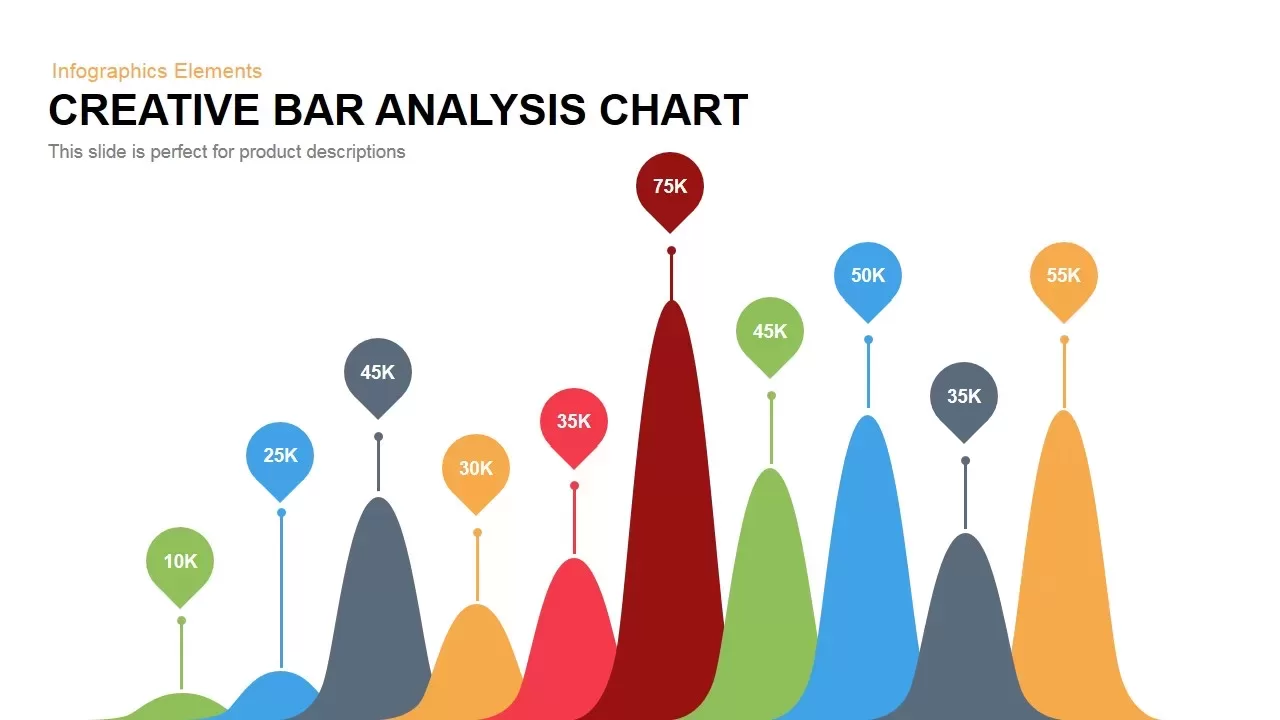
Creative Bar Chart Analysis PowerPoint Template and Keynote
Column and Bar chart
Premium
-
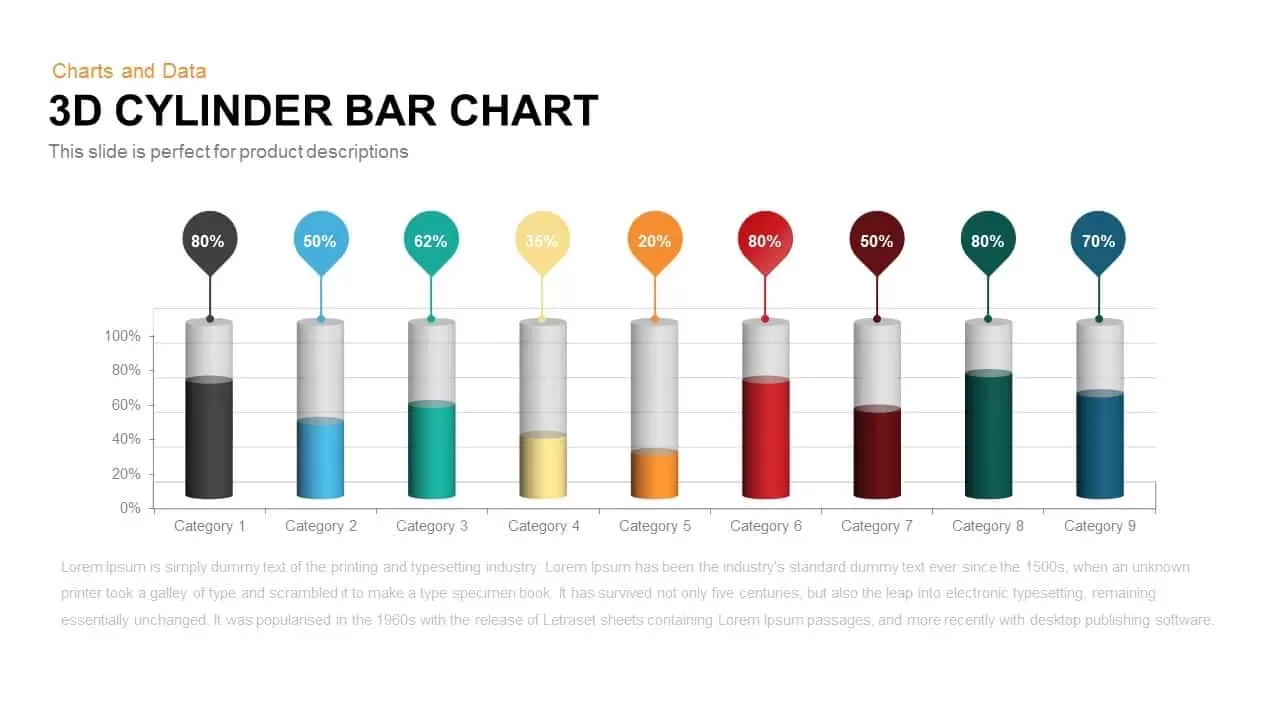
3D Cylinder Bar Chart PowerPoint Template and Keynote Slide
Column and Bar chart
Premium
-

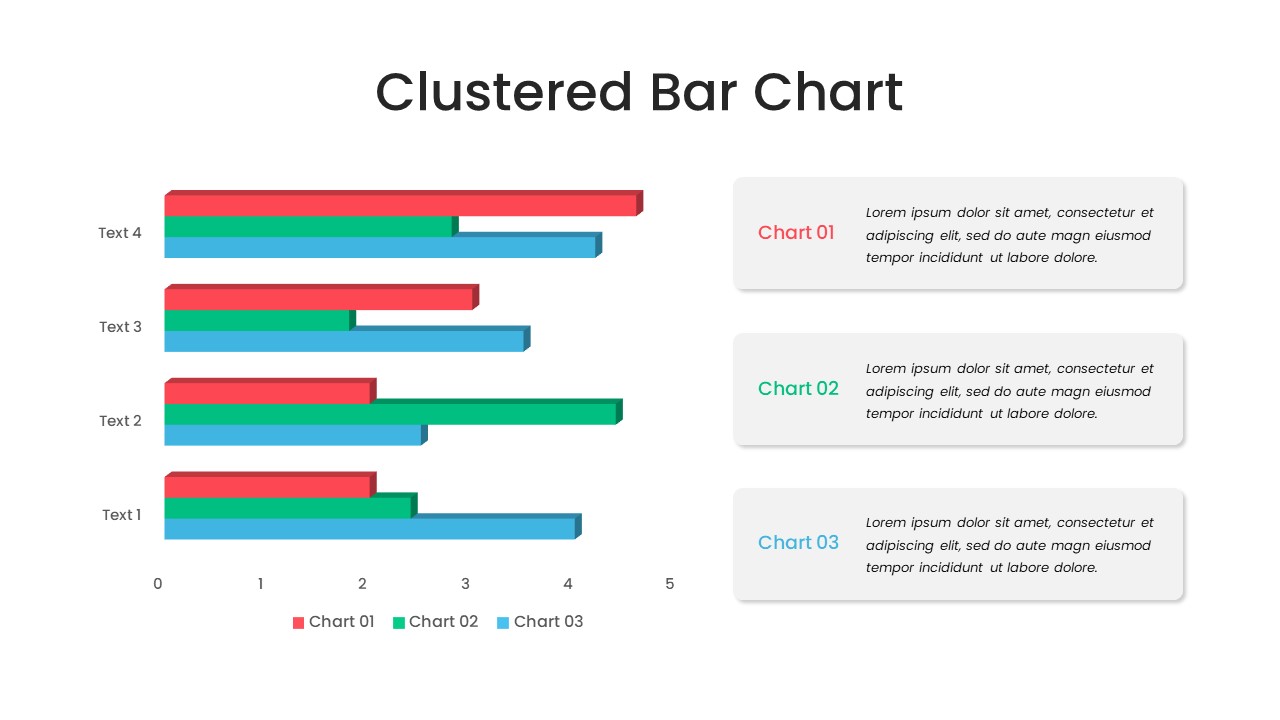
Animated Clustered Bar Chart PowerPoint Template
PowerPoint Charts
Premium
-
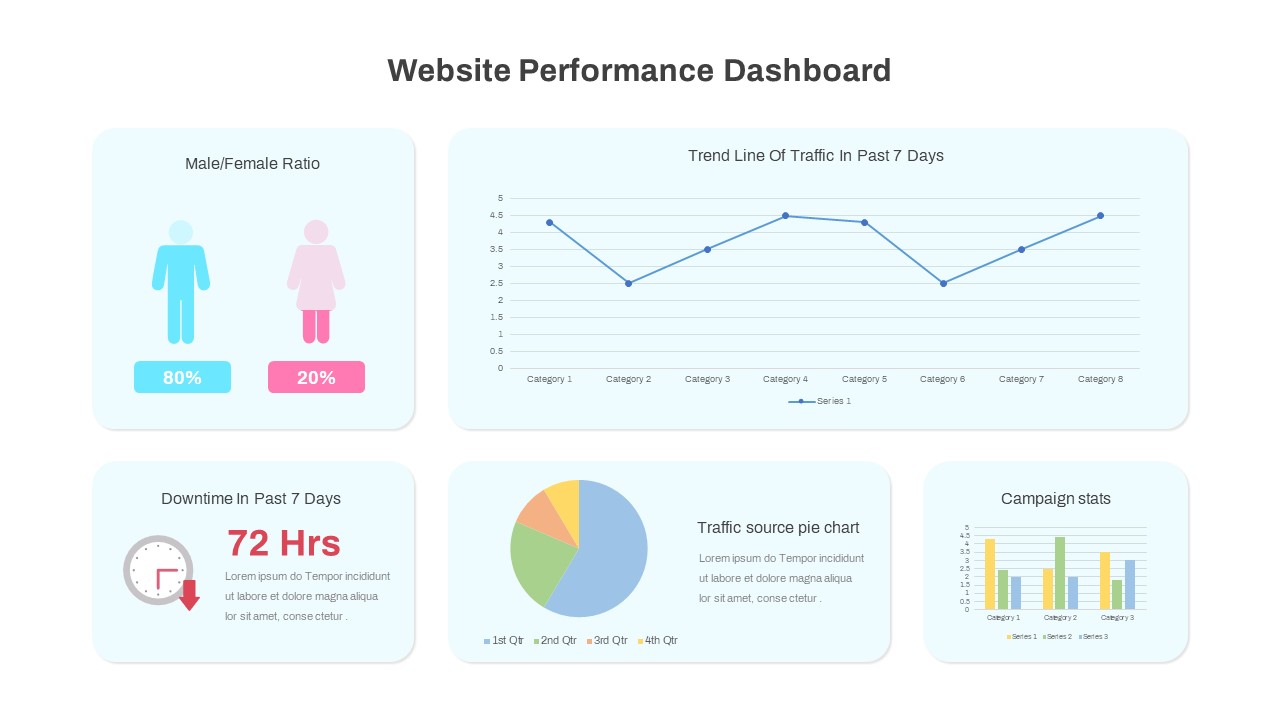
Website Performance Dashboard
PowerPoint Templates
Premium
-
Cylinder Bar Chart PowerPoint Template and Keynote Slide
Column and Bar chart
Premium
-
For and Against Vote Count Bar Chart for PowerPoint Presentation
Column and Bar chart
Premium
-
3d Bar Graph PowerPoint Template and Keynote Slide
Diagrams
Premium
-
Radial Bar Chart Template for PowerPoint and Keynote
Circular Diagrams
Premium
-
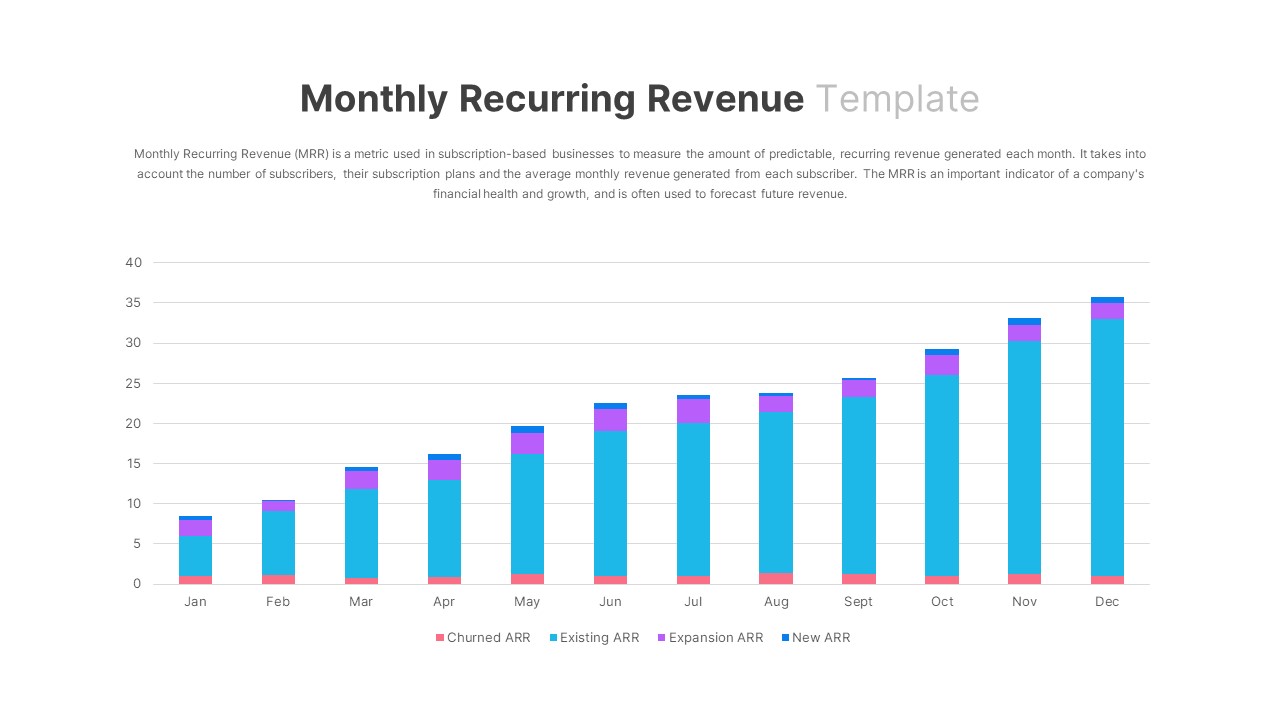
Monthly Recurring Revenue PowerPoint Template
PowerPoint Templates
Premium
-
KPI Slide for PowerPoint
Infographic
Premium
-
Sales Report Presentation PowerPoint Template
Business Models
Premium
-
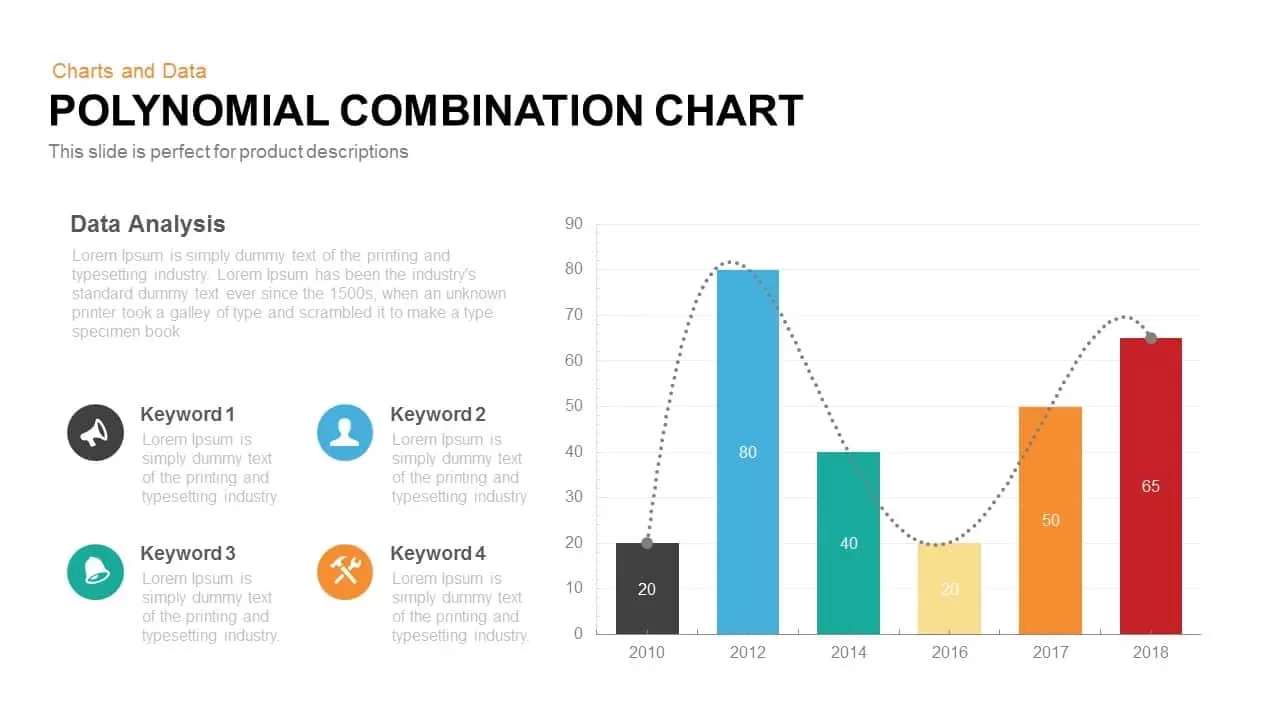
Polynomial Combination Chart PowerPoint Template and Keynote Slide
Column and Bar chart
Premium
-
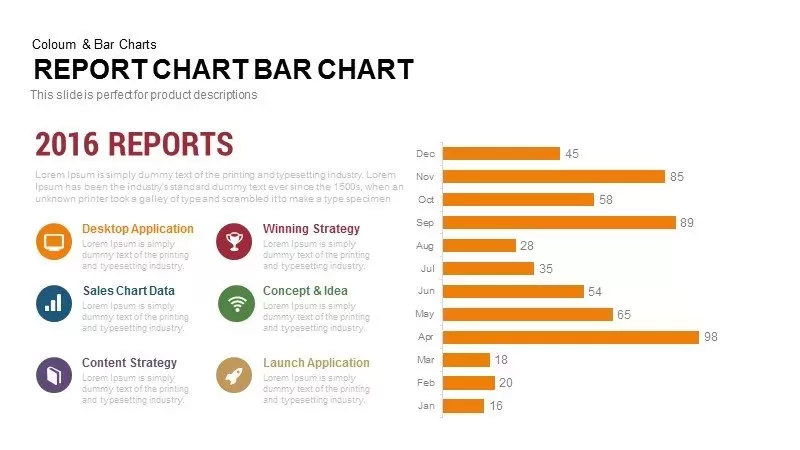
Report Bar Chart PowerPoint Template and Keynote
Column and Bar chart
Premium
-
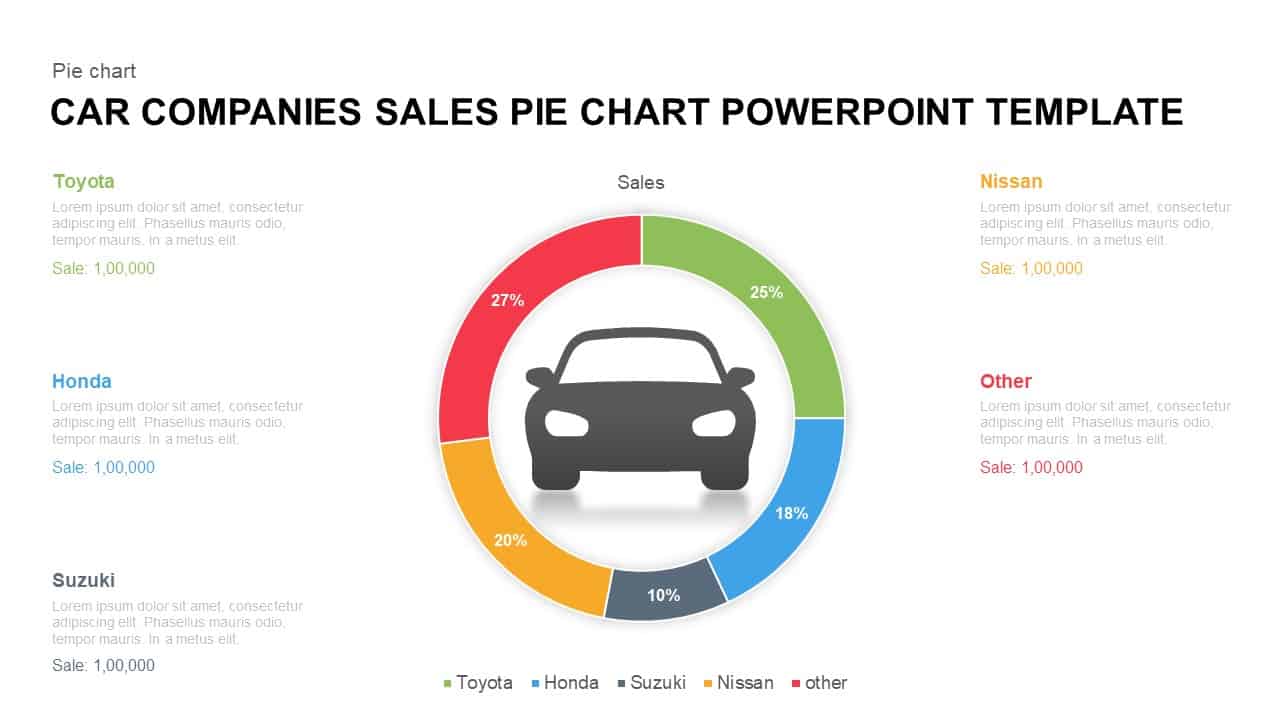
Car Companies Sales Pie Chart Template for PowerPoint & Keynote
Column and Bar chart
Premium
-
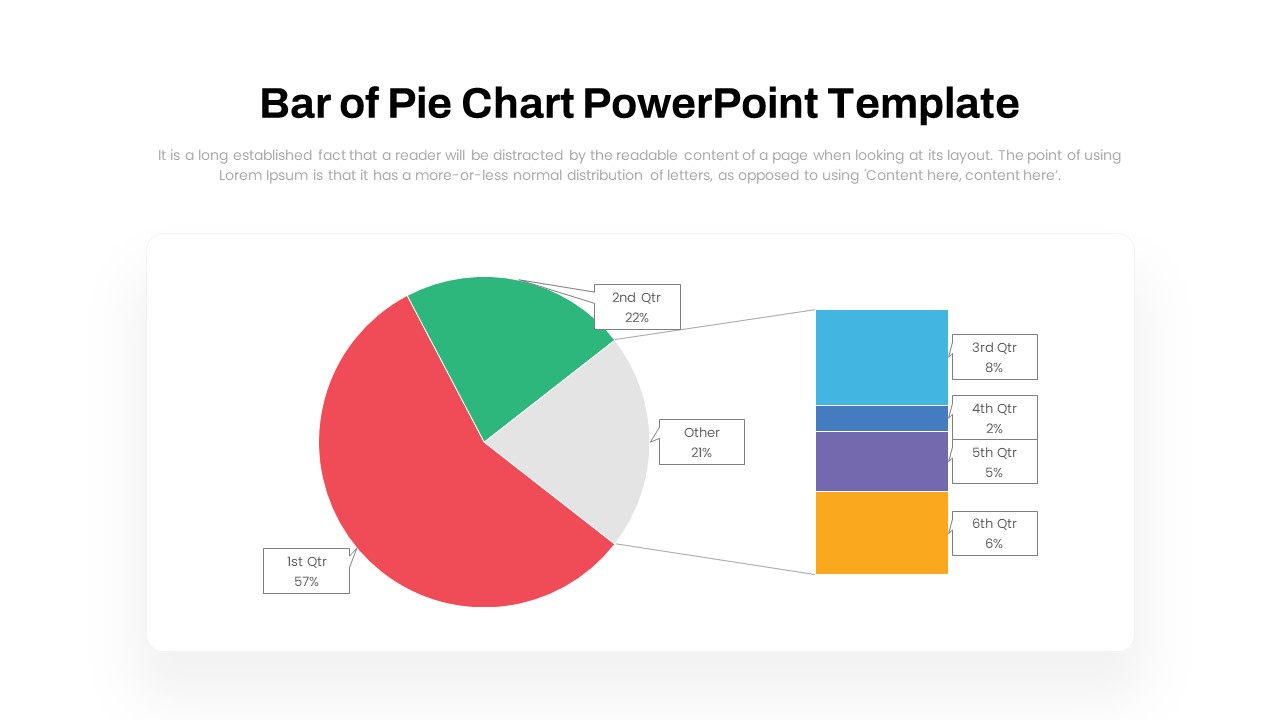
Bar of Pie Chart PowerPoint Template
PowerPoint Templates
Premium
-
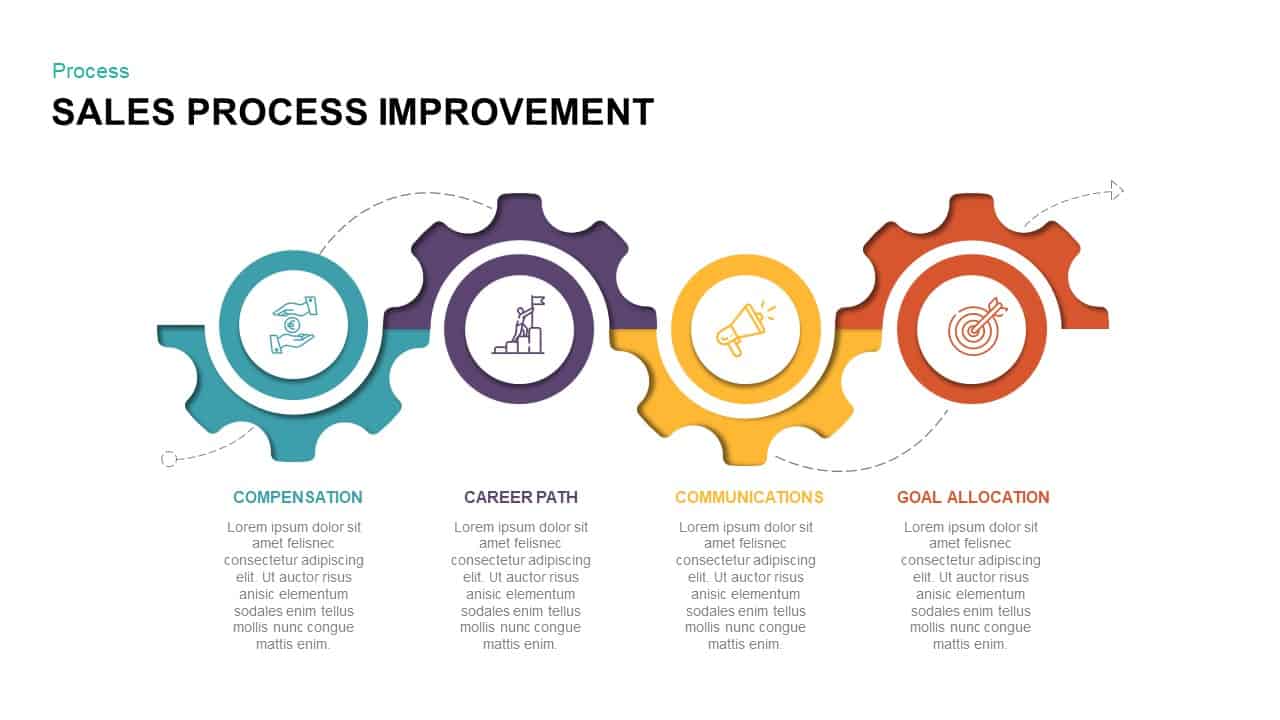
Sales Process Improvement Template for PowerPoint & Keynote
Process Flow Diagrams
Premium
-
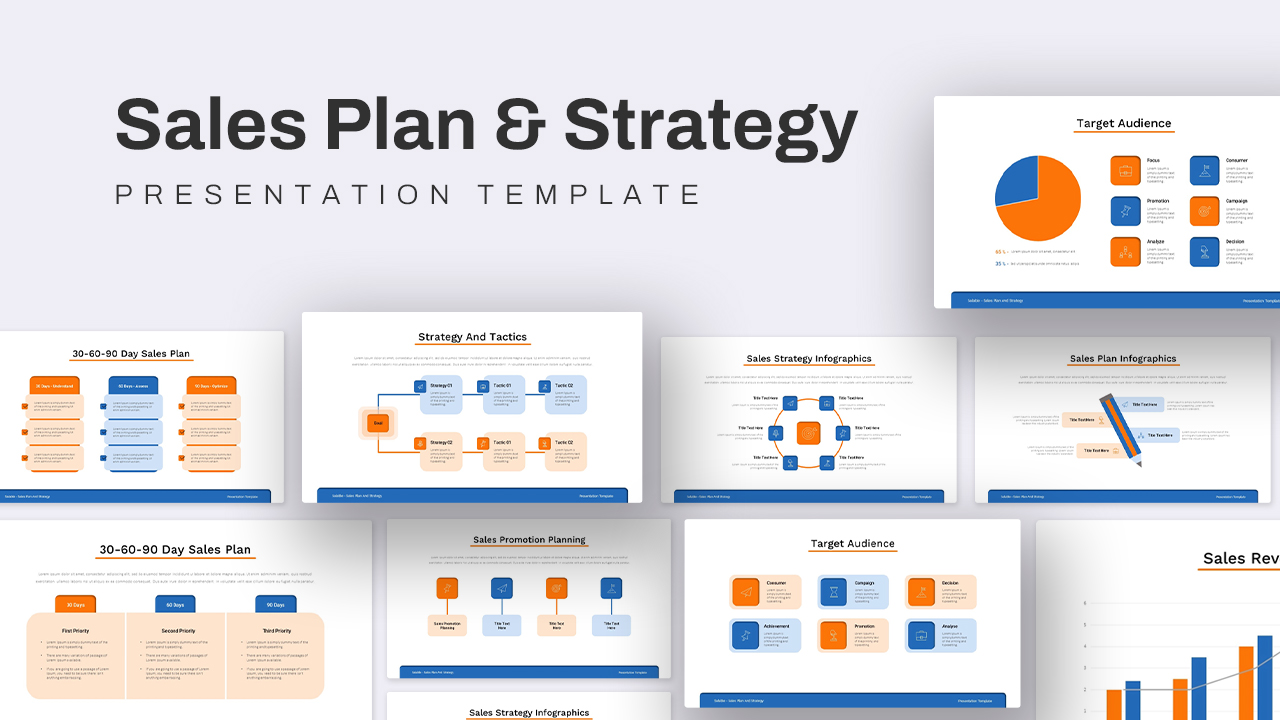
Sales Plan and Strategy Presentation Template
PowerPoint Templates
Premium
-
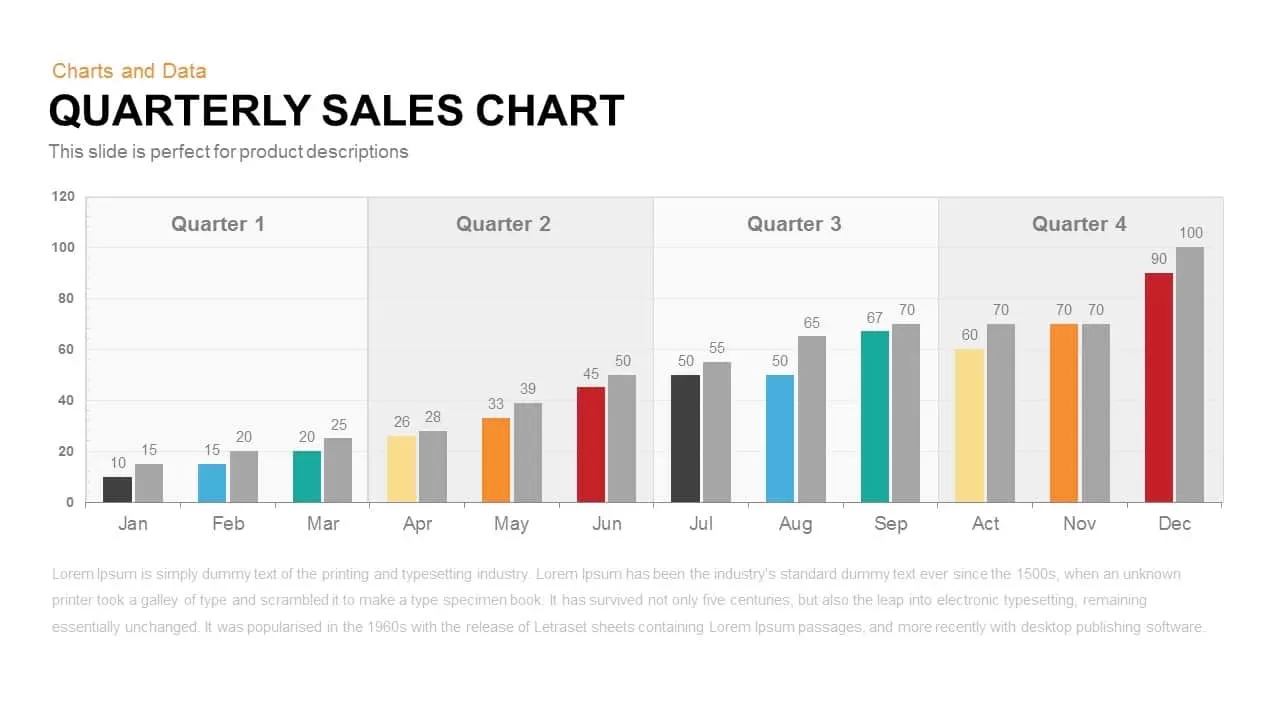
Quarterly Sales Chart PowerPoint Template and Keynote Slide
Column and Bar chart
Premium
-

Combination Chart PowerPoint Template
PowerPoint Charts
Premium
-
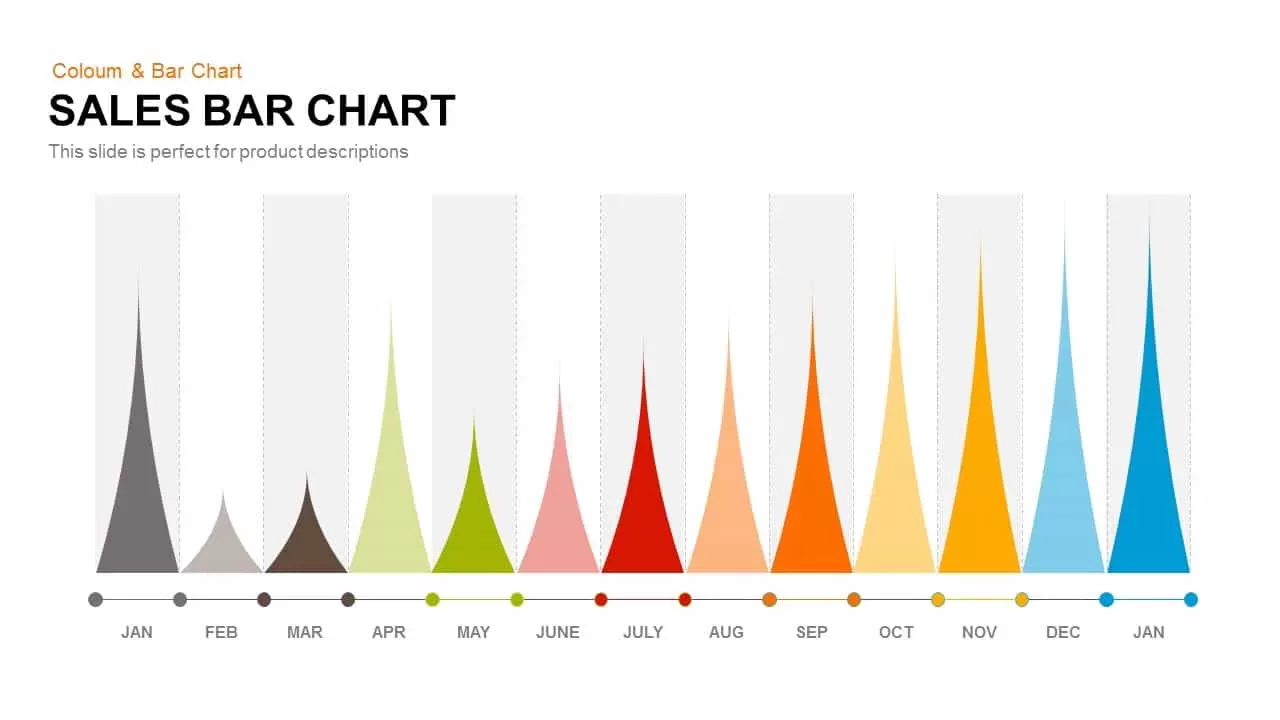
Sales Bar Chart Template for PowerPoint and Keynote
Column and Bar chart
Premium
-
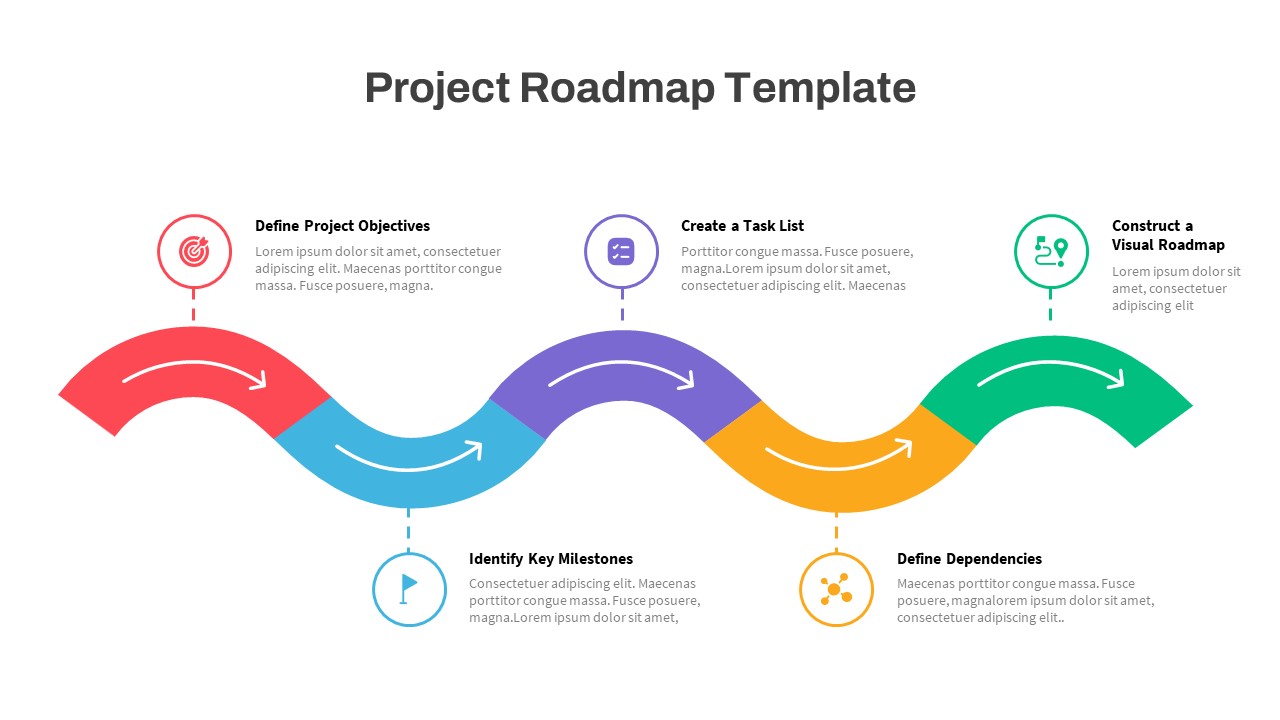
Project Roadmap PowerPoint Template
PowerPoint Templates
Premium
-
Data Bar Chart Template for PowerPoint and Keynote
Column and Bar chart
Premium
-
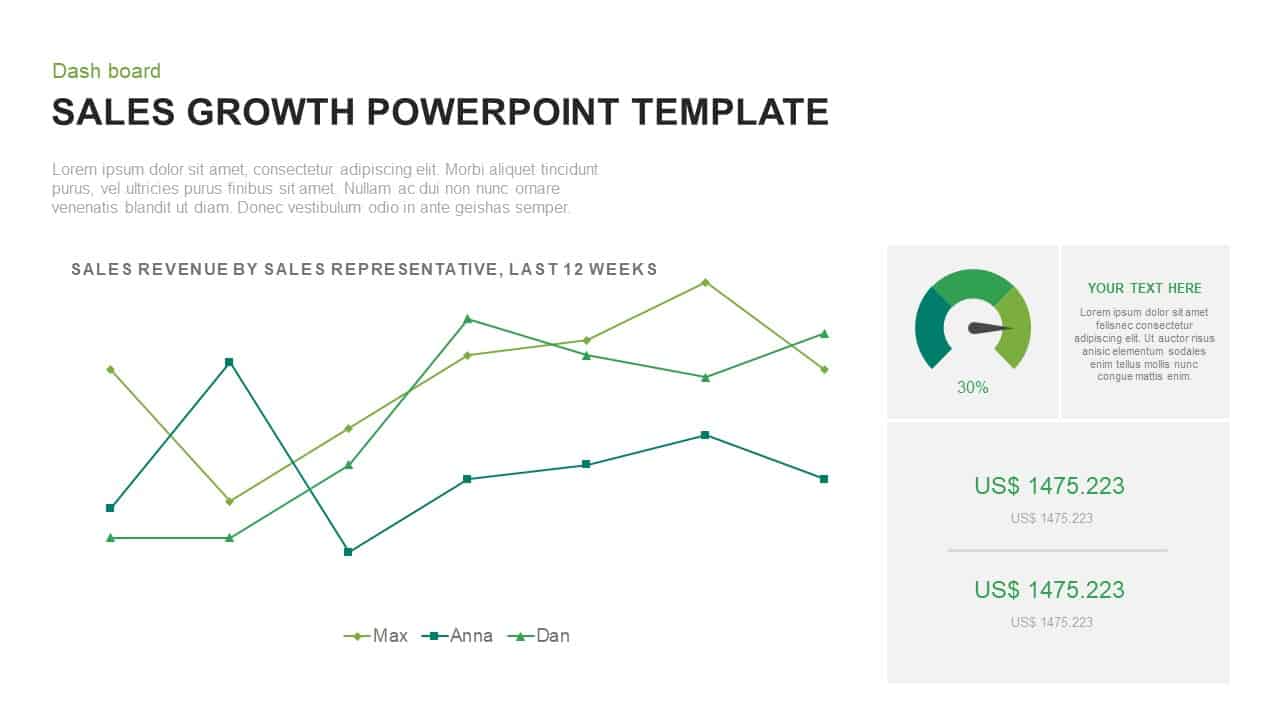
Sales Growth PowerPoint Presentation Template
Curves and Lines
Premium
-
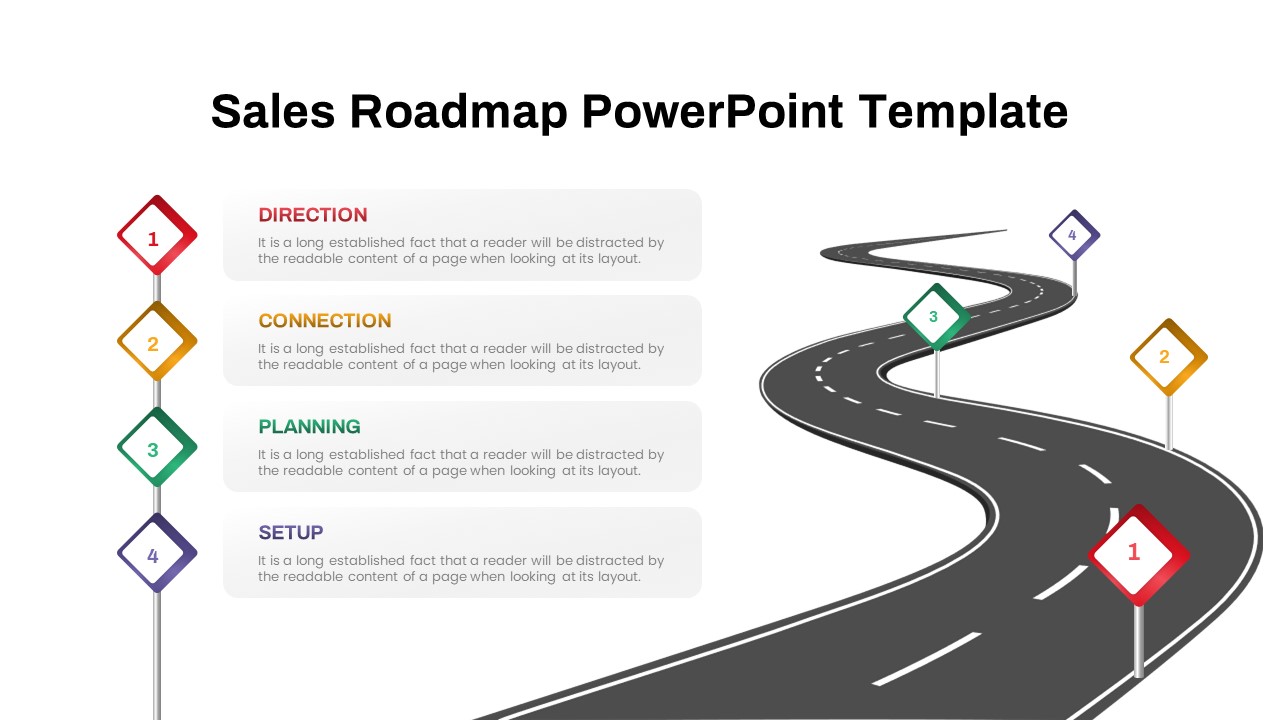
Sales Roadmap PowerPoint Template
PowerPoint Business Templates
Premium
-
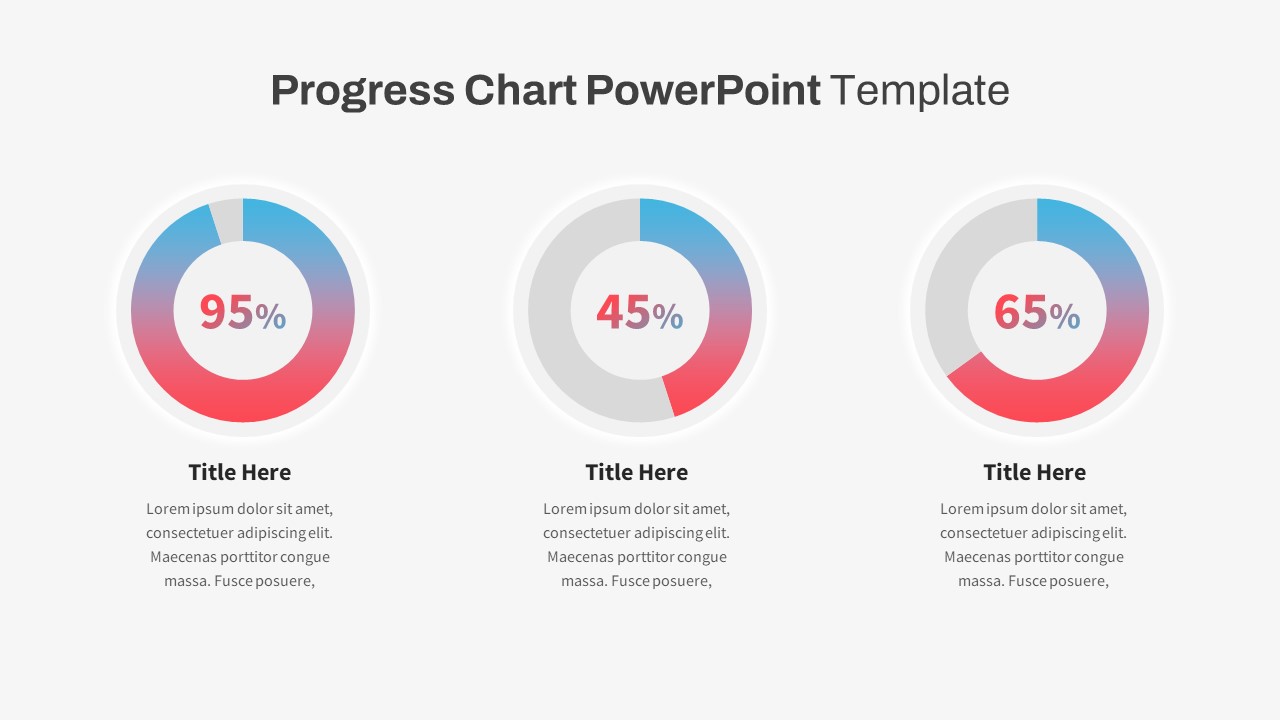
Progress Chart PowerPoint Template
PowerPoint Templates
Premium
-
Sample Bar Chart Template for PowerPoint and Keynote Presentation
Column and Bar chart
Premium
-

Monthly Report PowerPoint Template Free
PowerPoint Templates
Free
-
Clustered Bar Chart PowerPoint Template
Column and Bar chart
Premium
-
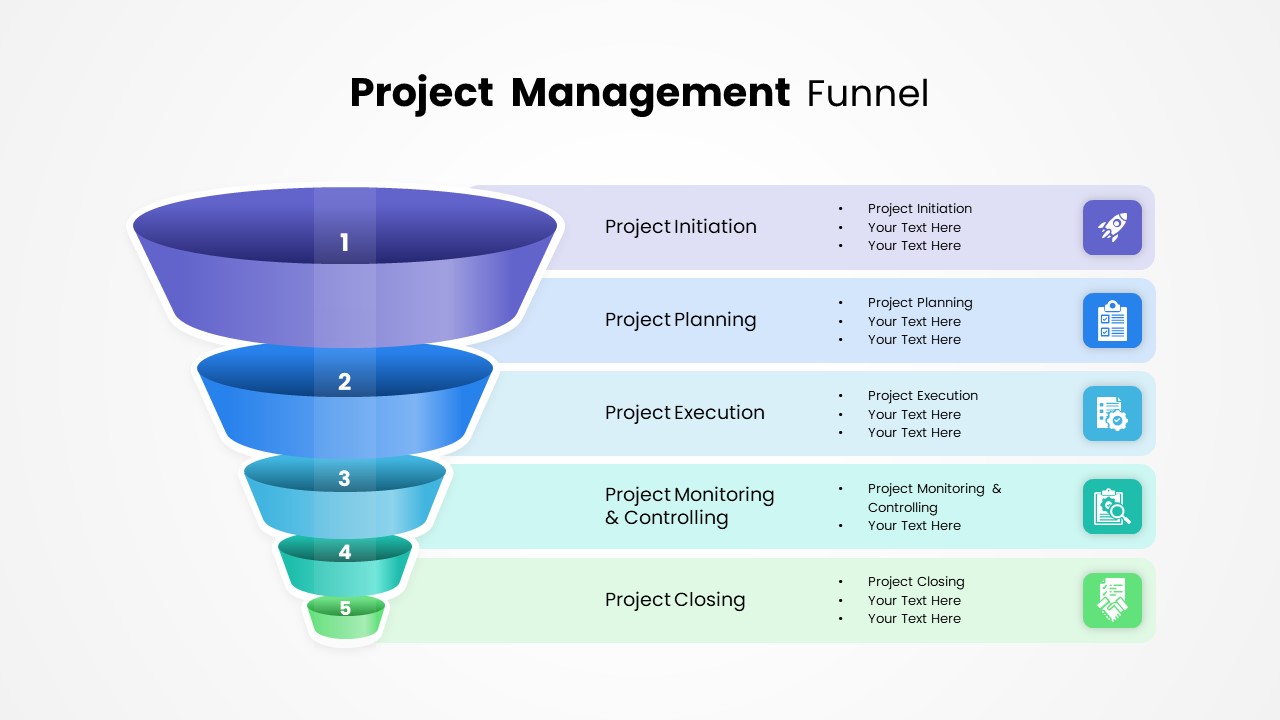
Project Management Funnel Template PowerPoint
Funnel Diagrams
Premium
-
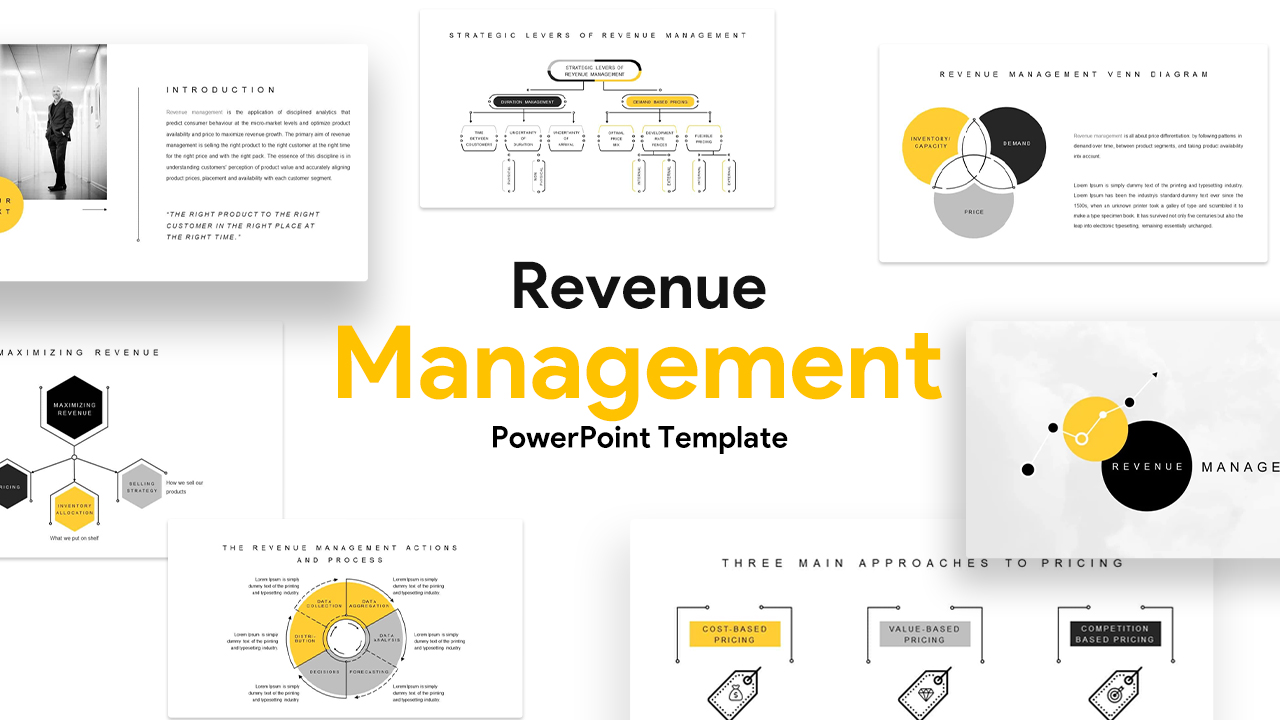
Revenue Management Templates for PowerPoint & Keynote
Business Models
Premium
-

Free Metro UI Dashboard Template
PowerPoint Templates
Free
-

Sales Meeting Presentation Template
PowerPoint Business Templates
Premium
-
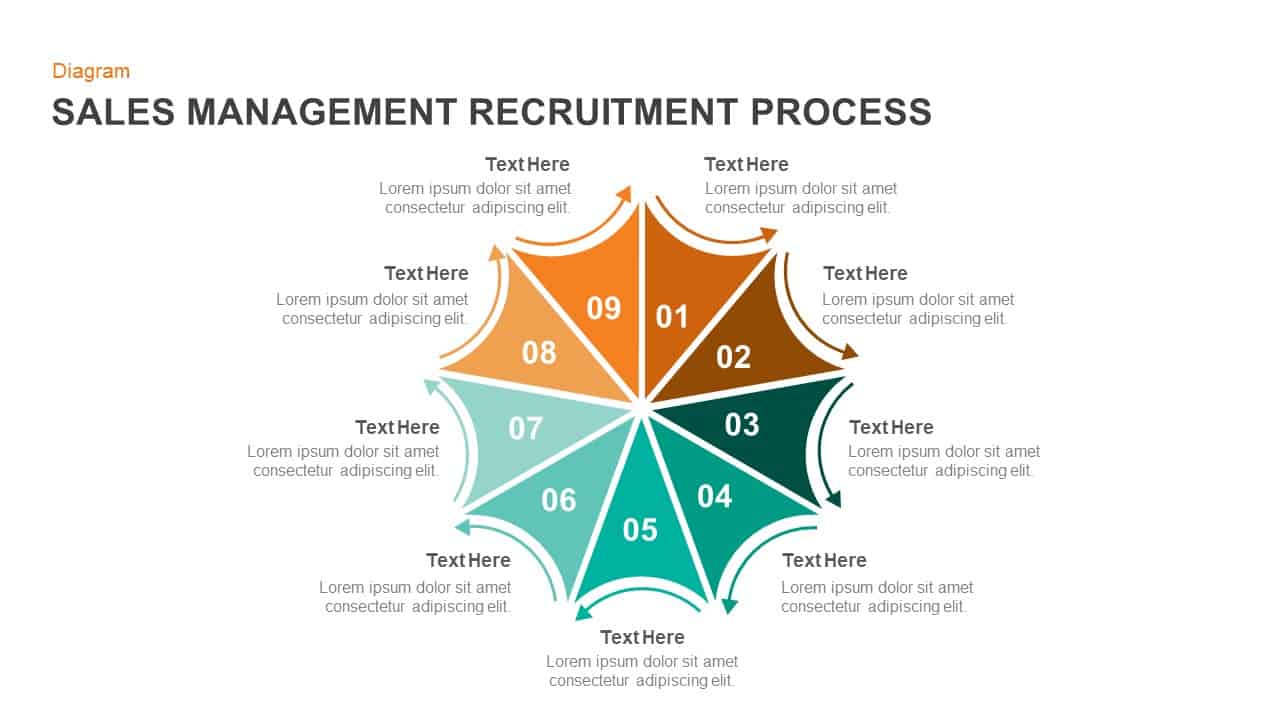
Sales Management & Recruitment PowerPoint and Keynote Slides
Diagrams
Premium
-
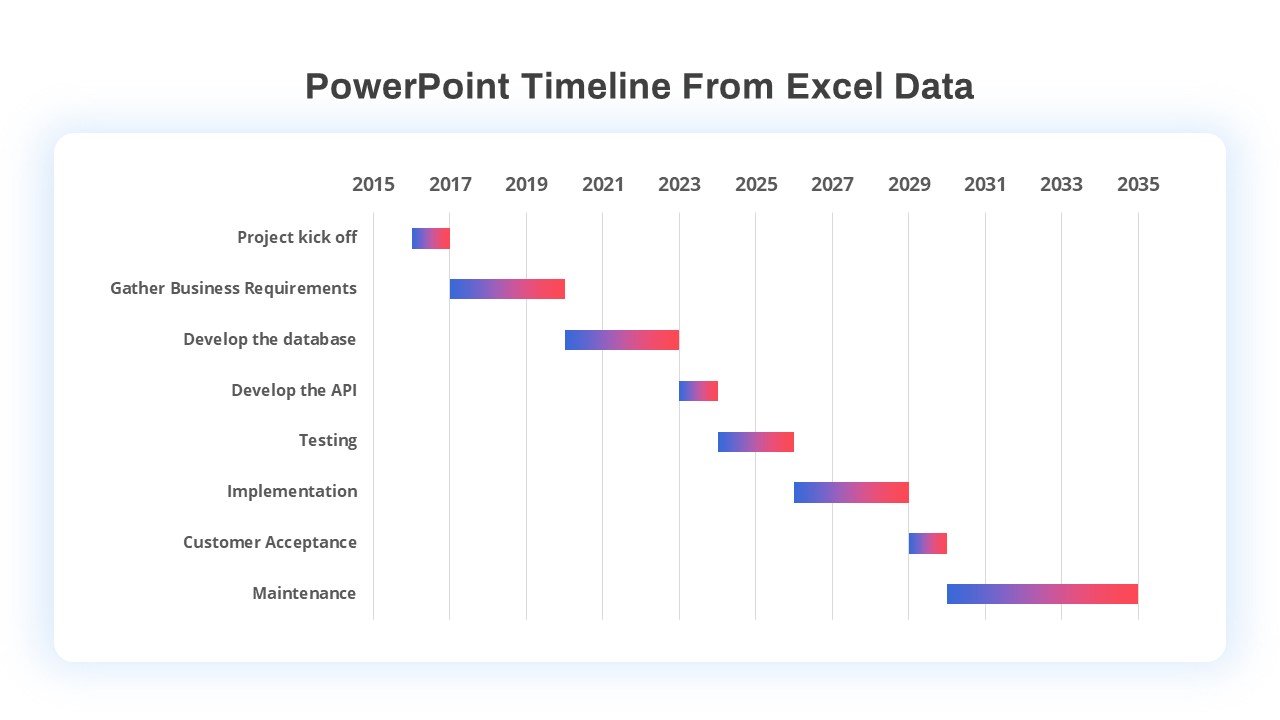
PowerPoint Timeline Template From Excel Data
Timeline PowerPoint Template
Premium
-
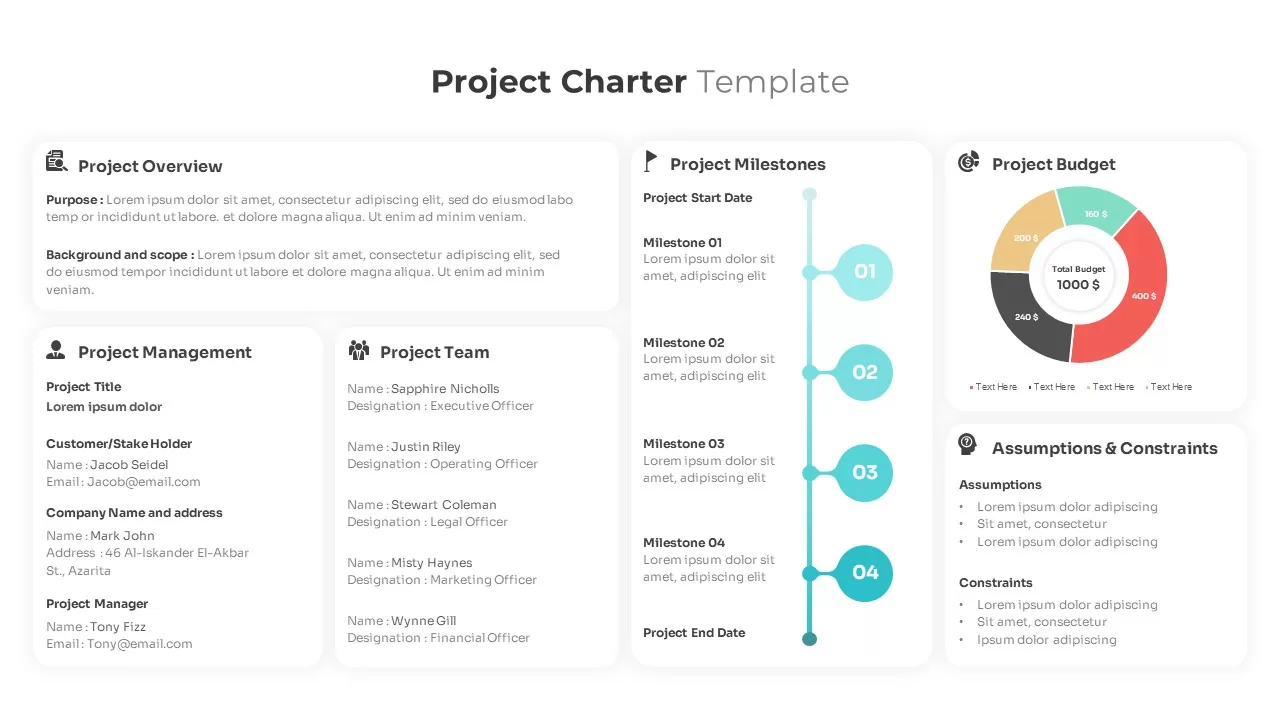
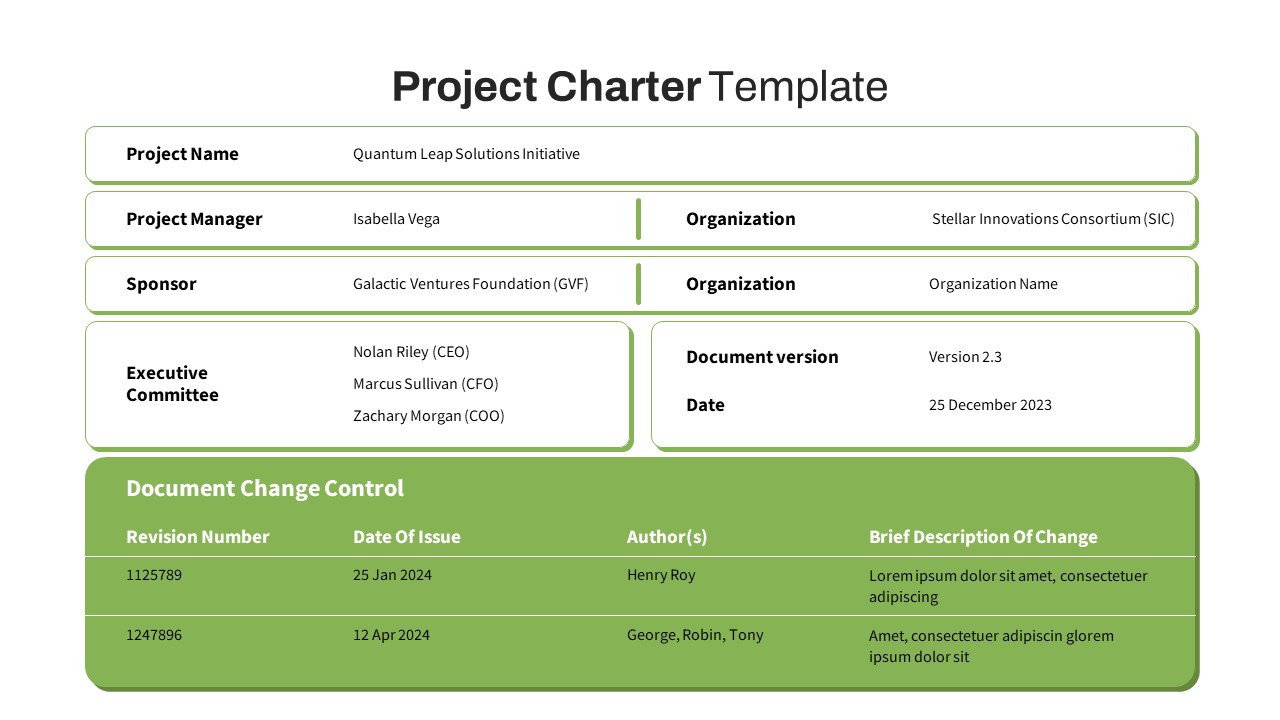
Project Charter Template
Text and Table
Premium
-
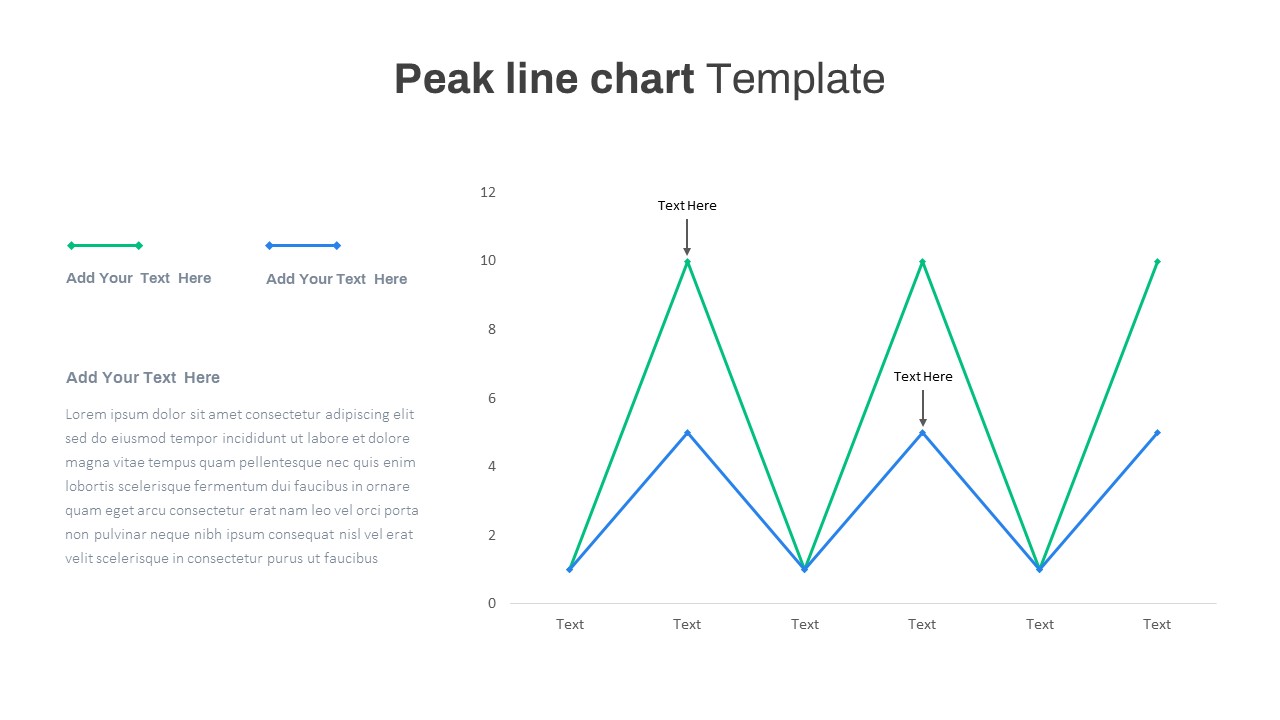
Peak Line Chart PowerPoint Template
PowerPoint Charts
Premium
-
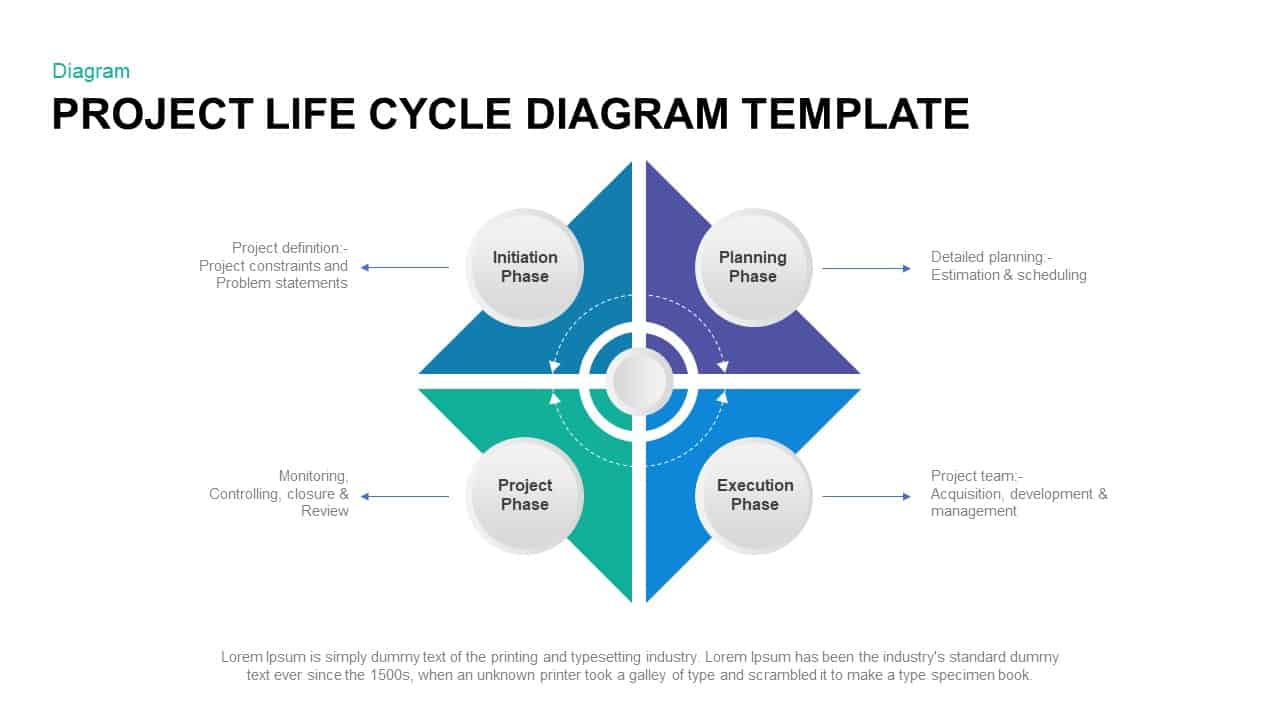
Project Life Cycle Diagram Template
Business Models
Premium
-
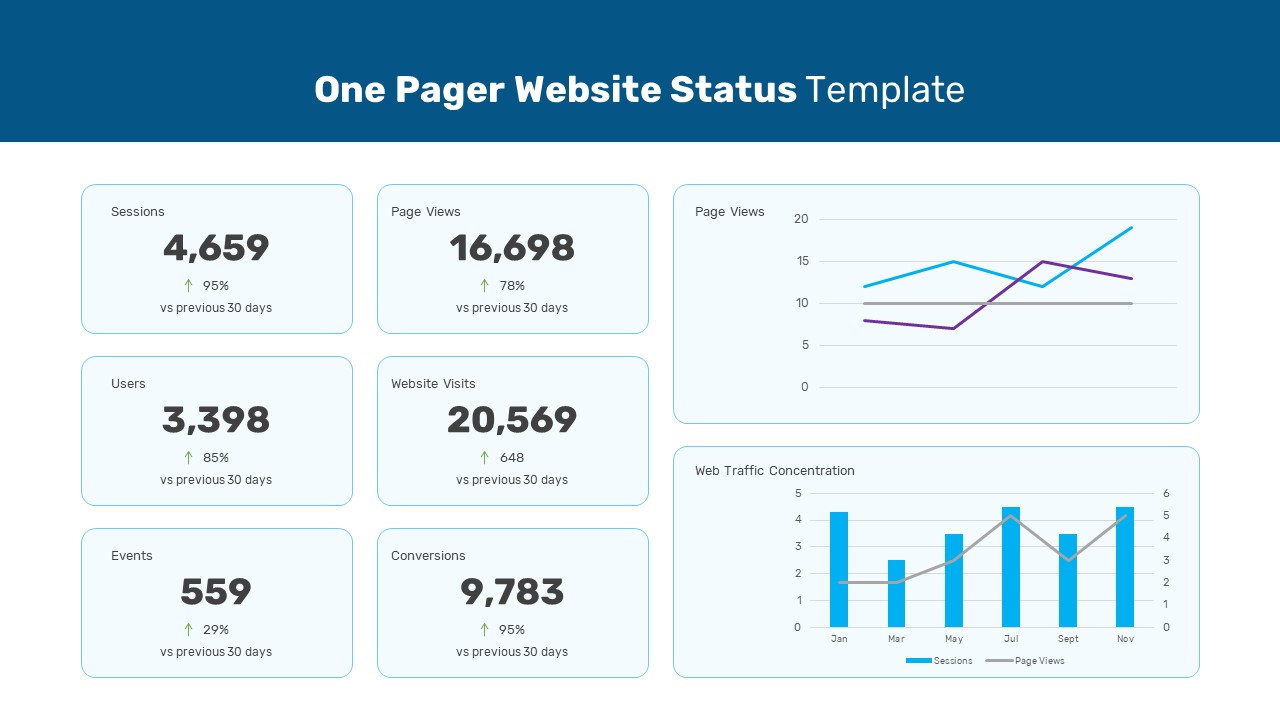
One Pager Website Status PowerPoint Template
PowerPoint Templates
Premium
-
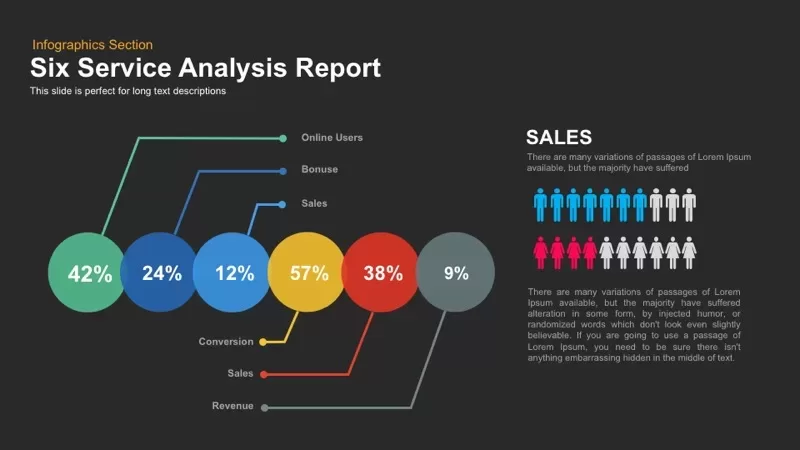
Six Service Analysis Report PowerPoint Template and Keynote
Process Flow Diagrams
Premium
-
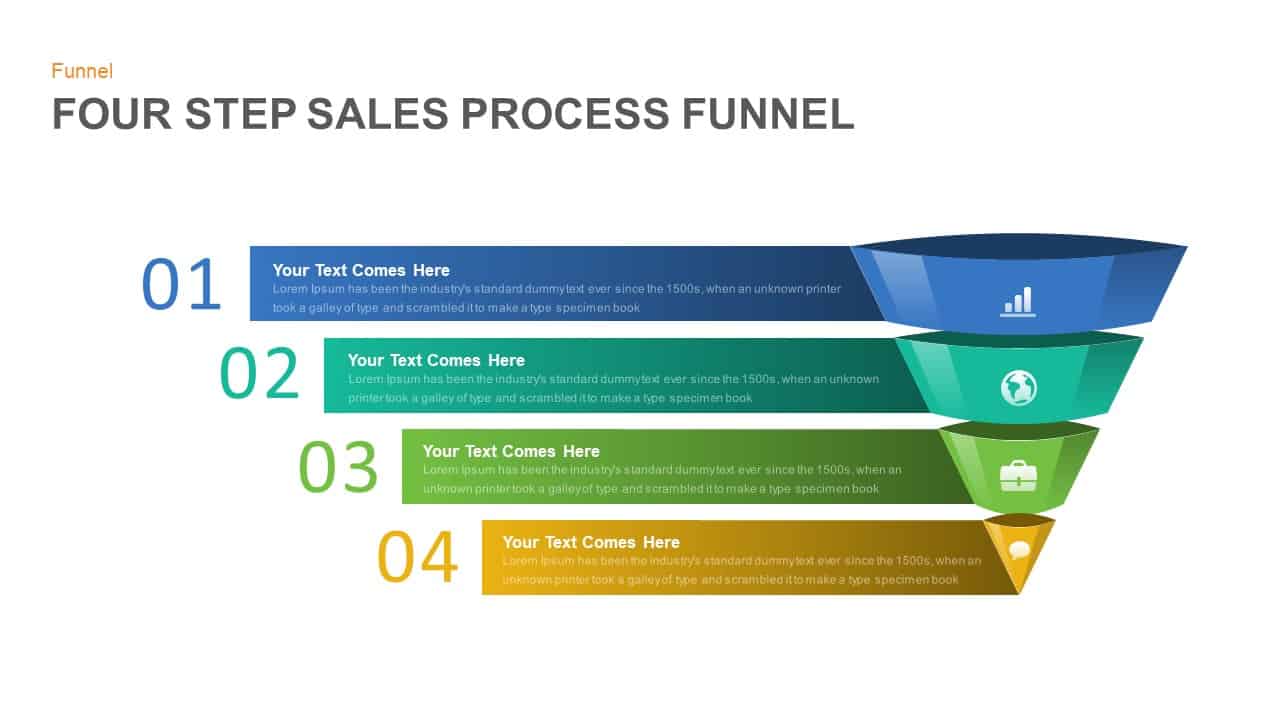
4 Step Sales Funnel Template PowerPoint
Funnel Diagrams
Premium
-
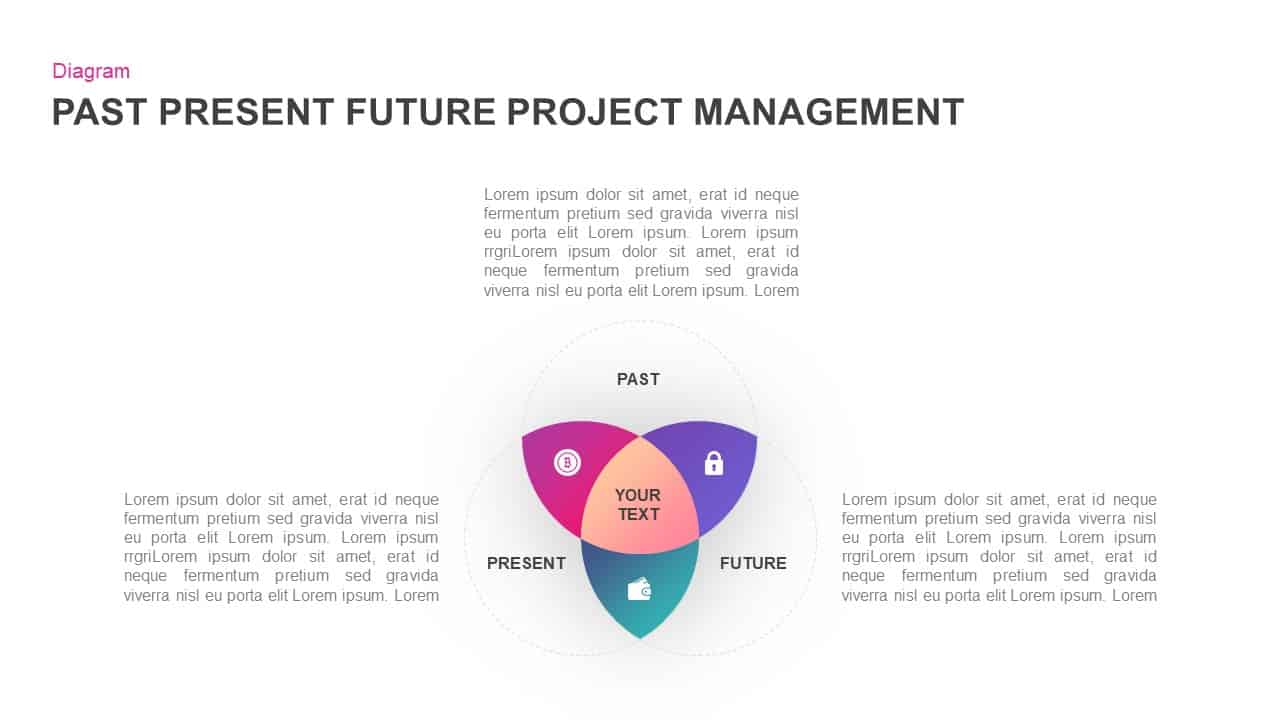
Past Present Future Project Management Template for PowerPoint & Keynote
Business Models
Premium
-
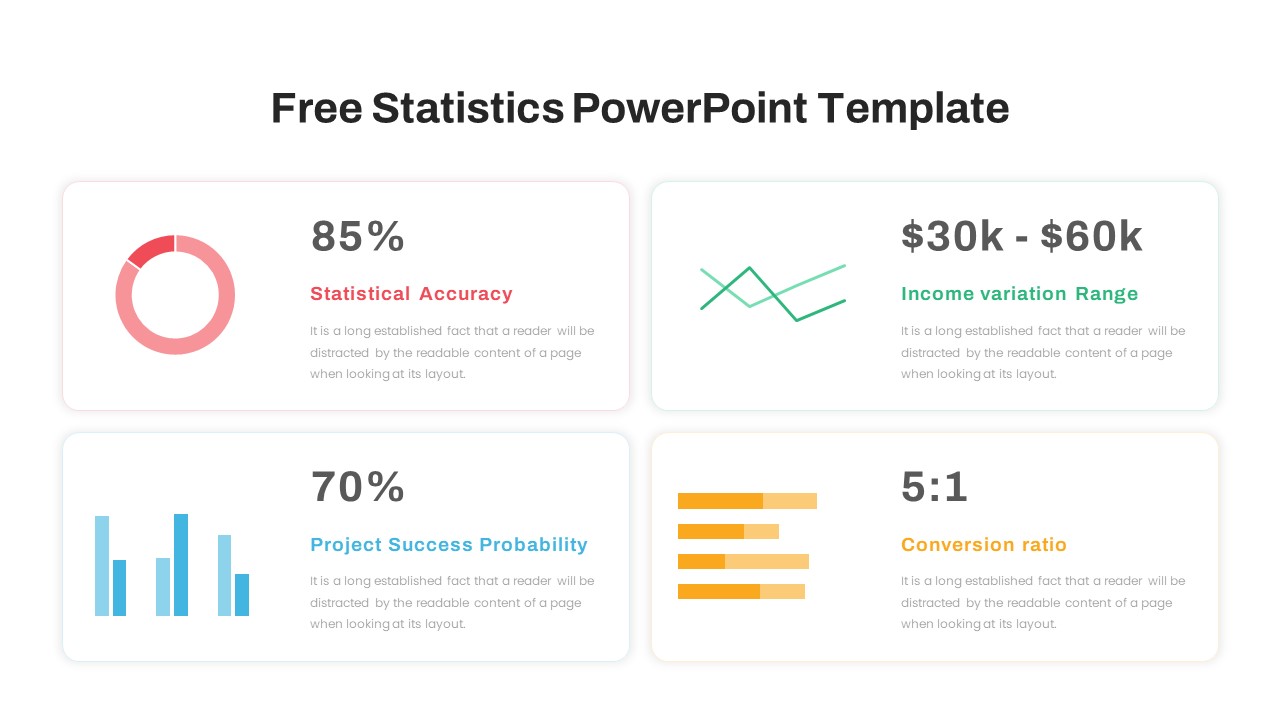
Free Statistics PowerPoint Template
Free PowerPoint Templates
Free
-
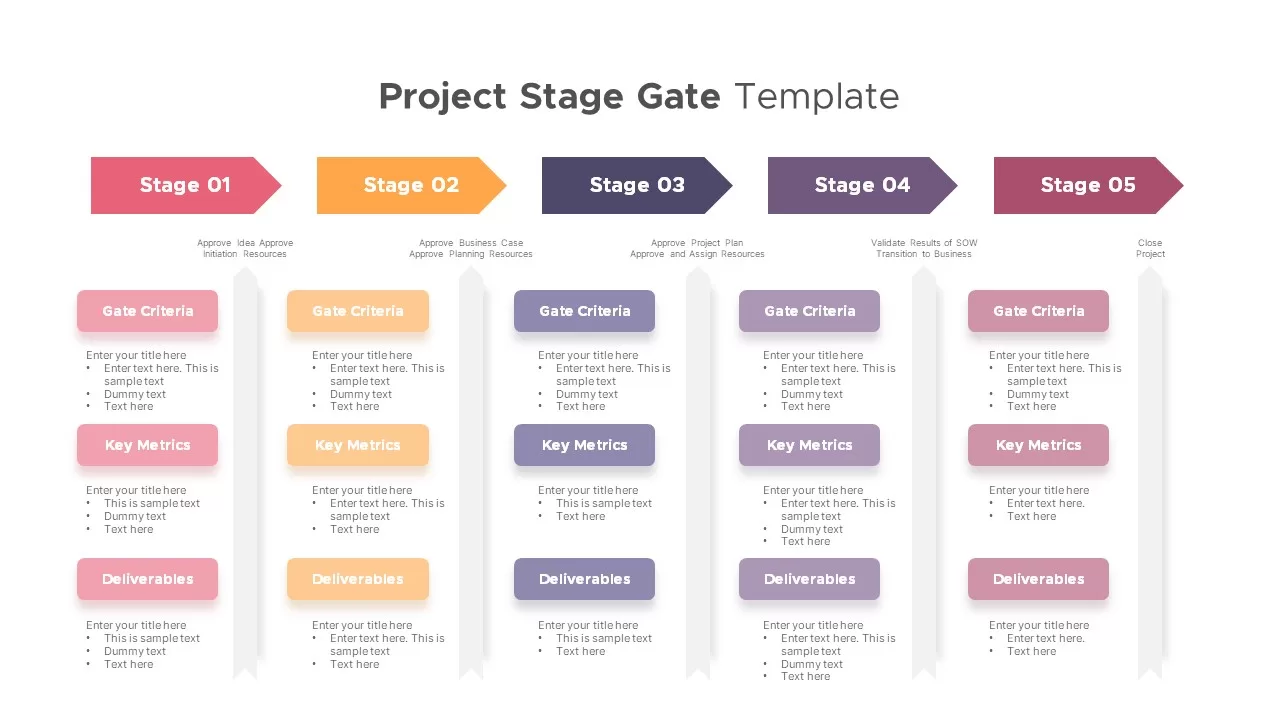
Project Stage Gate Template
PowerPoint Templates
Premium
-
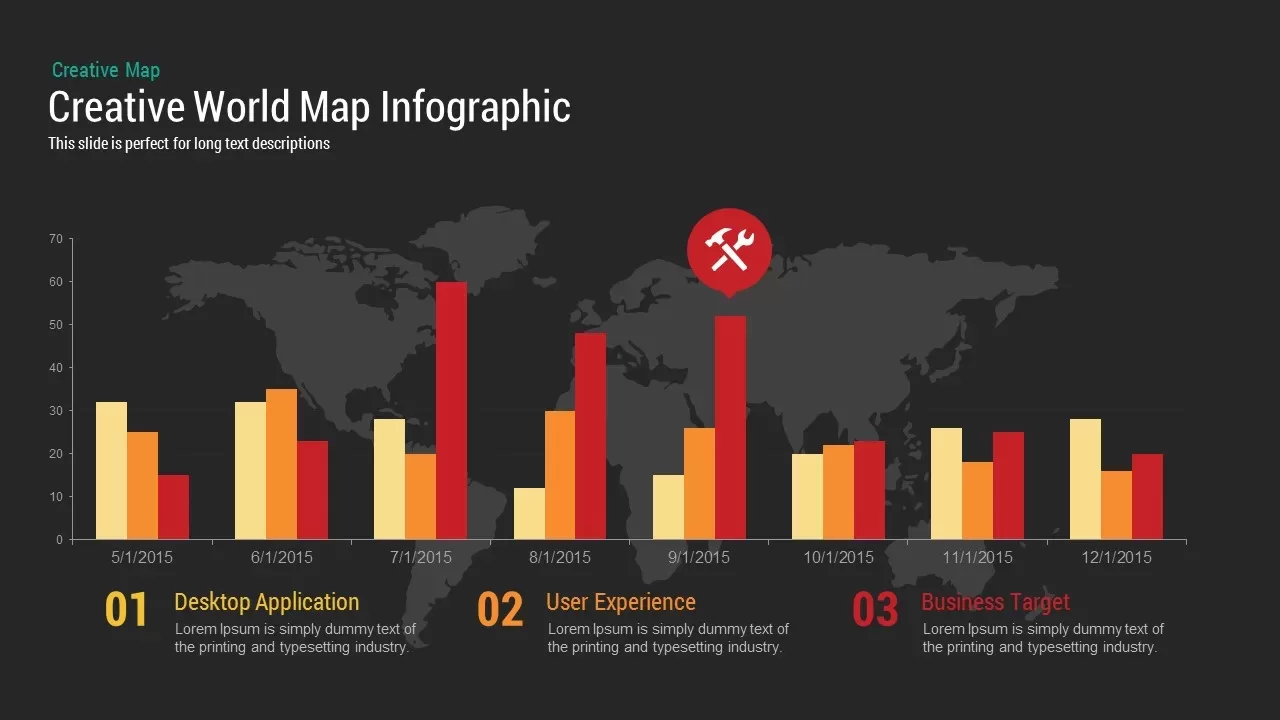
World Map Infographic PowerPoint Template and Keynote Slide
PowerPoint Charts
Premium
-
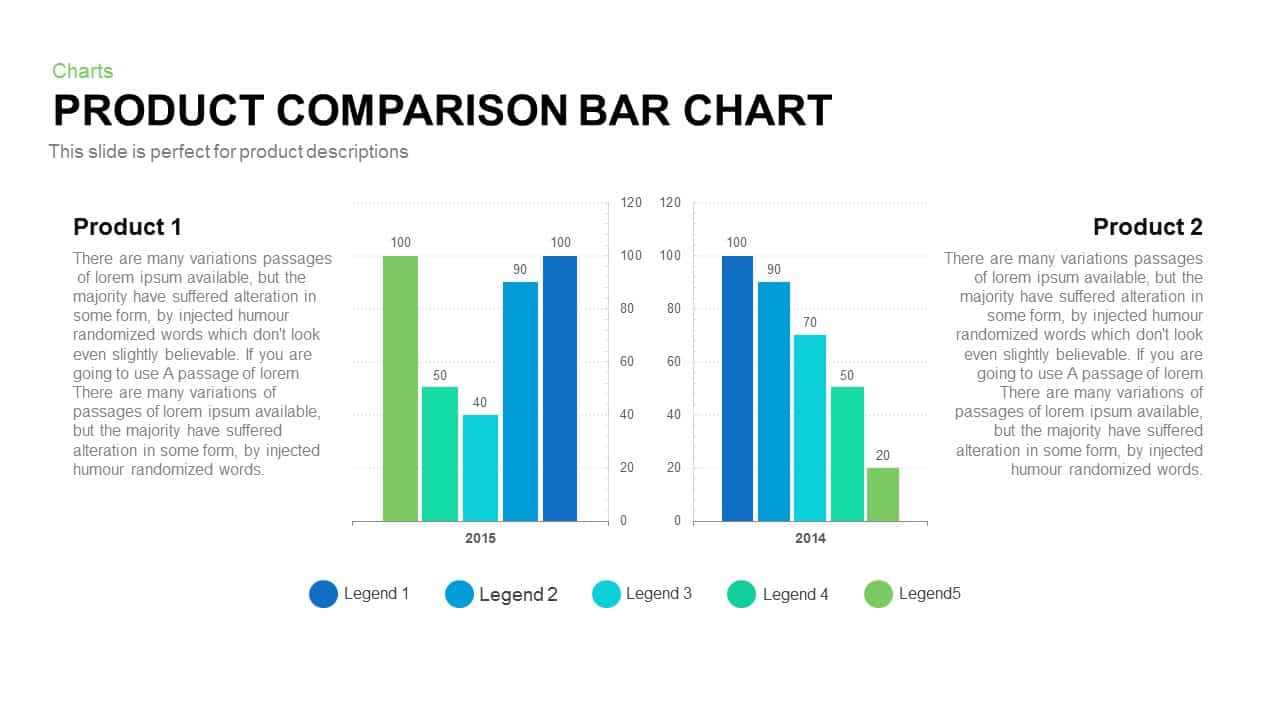
Product Comparison Bar Chart Template for PowerPoint and Keynote
PowerPoint Charts
Premium
-
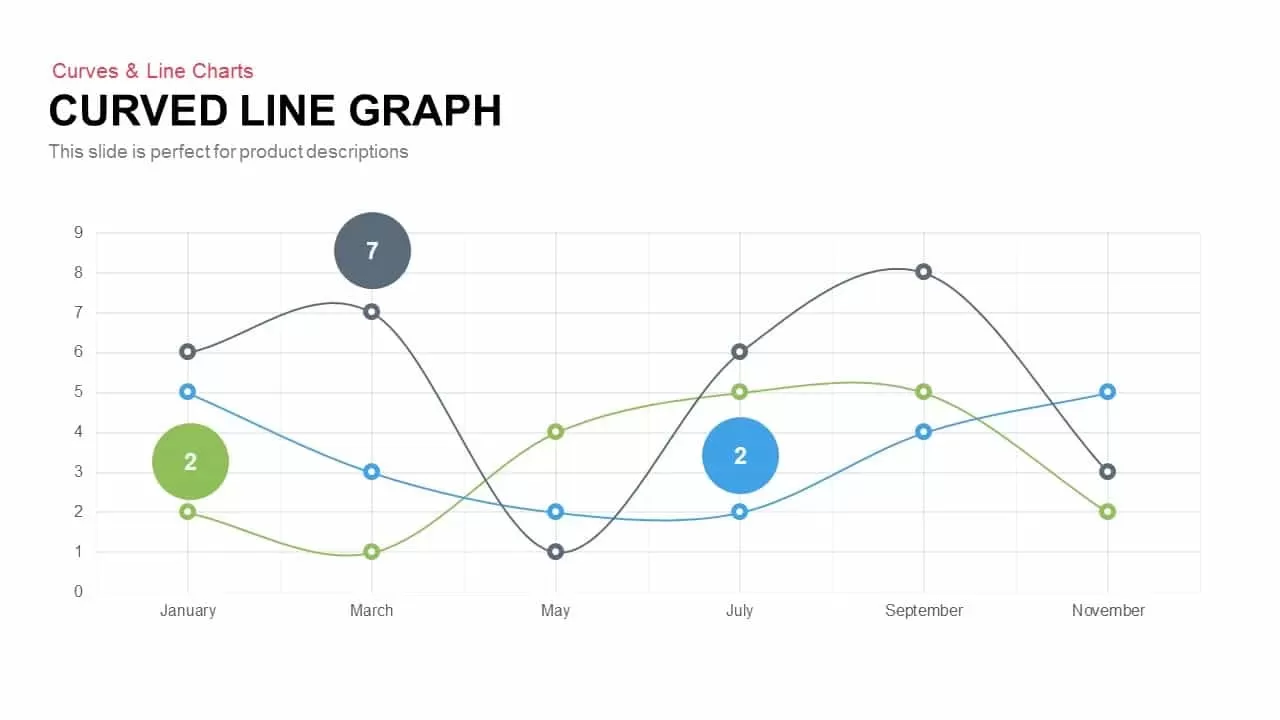
Curved Line Graph PowerPoint Template and Keynote
Curves and Lines
Premium
-
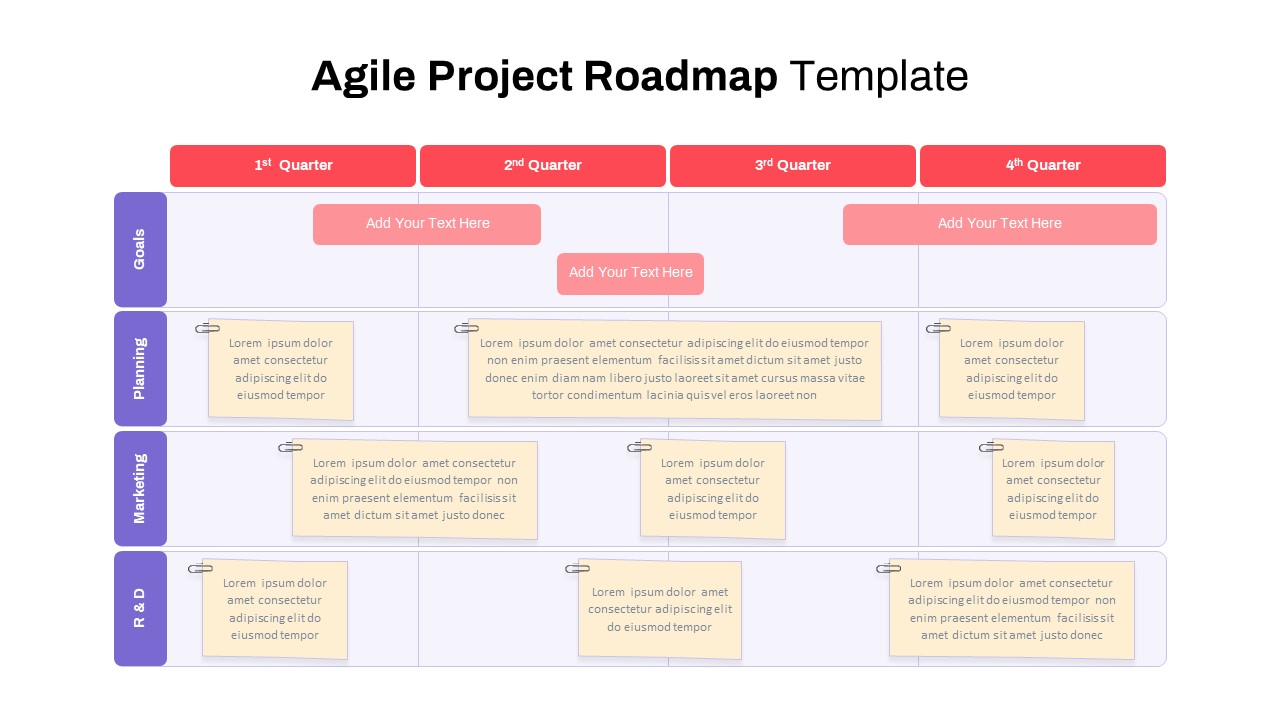
Agile Project Roadmap PowerPoint Template
PowerPoint Templates
Premium
-

Sales Deck Free PowerPoint Template
PowerPoint Templates
Free
-
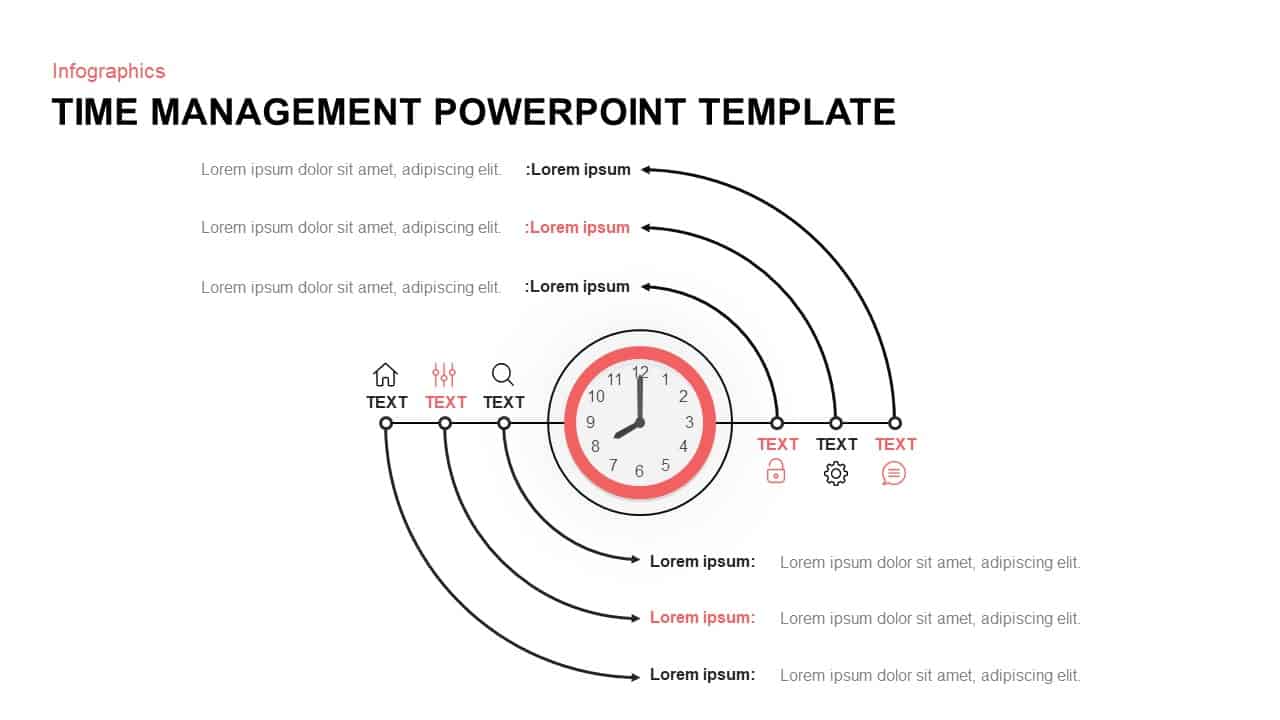
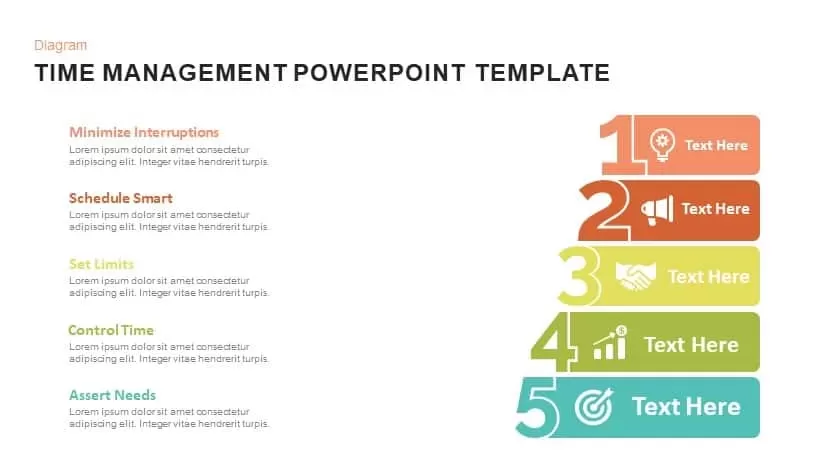
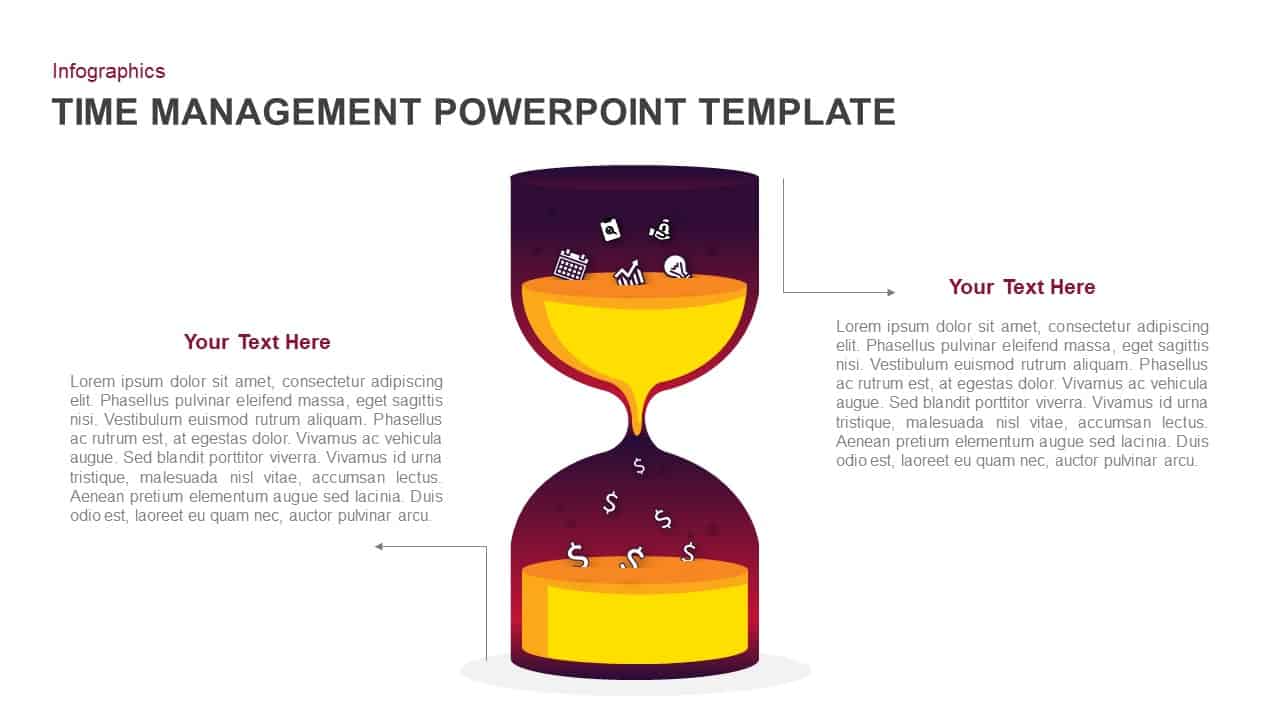
Time Management PowerPoint Template & Keynote Diagram
Timeline PowerPoint Template
Premium
-
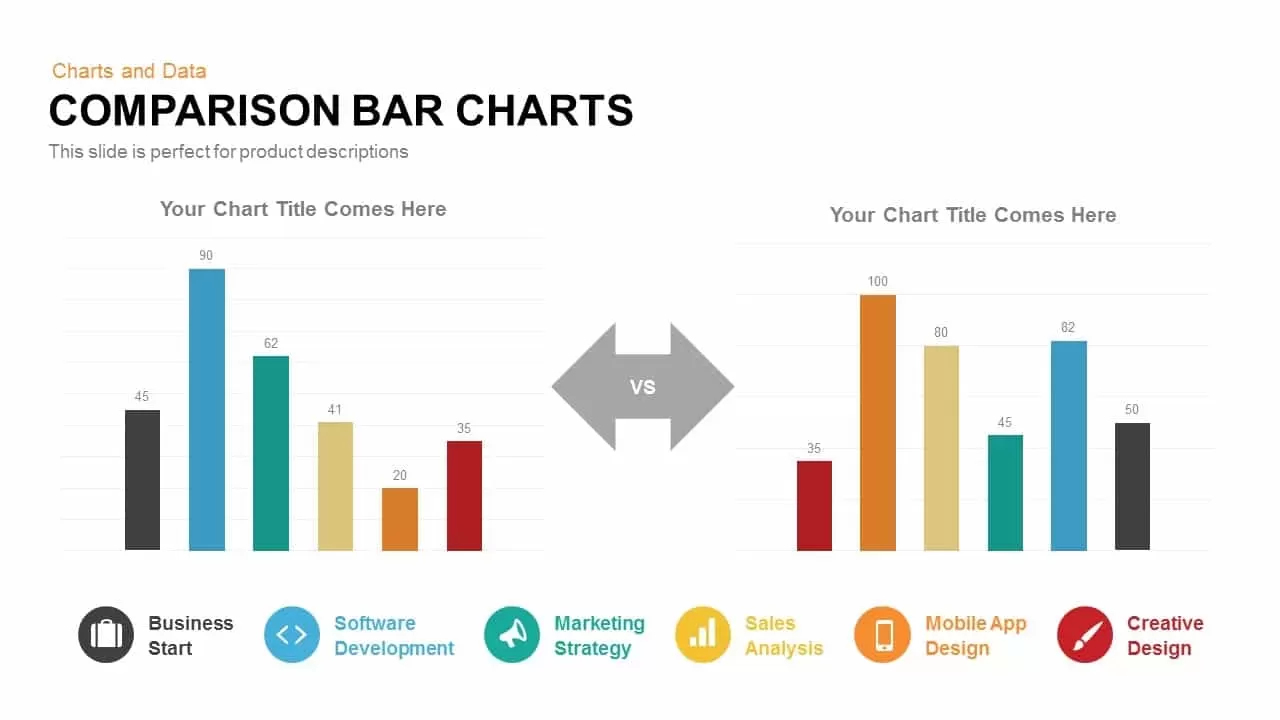
Comparison Bar Charts PowerPoint Template and Keynote Slide
Column and Bar chart
Premium
-
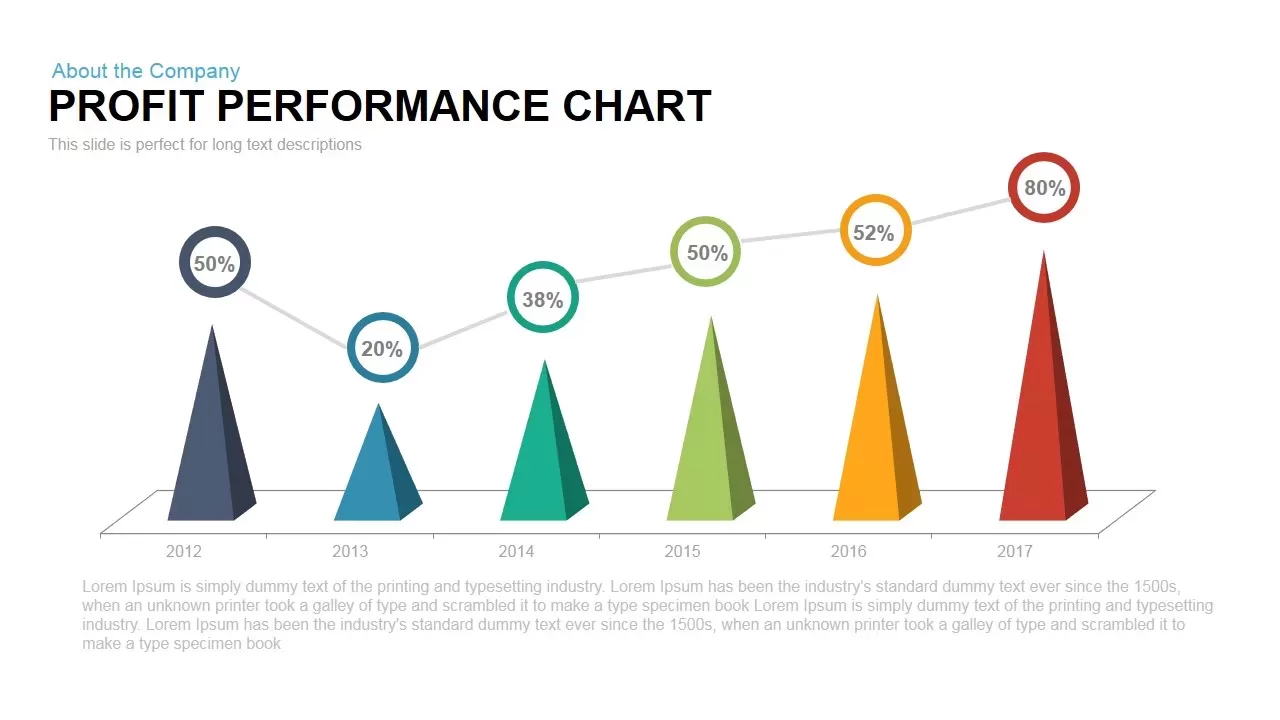
Profit Performance Chart PowerPoint Template
PowerPoint Charts
Premium
-
Free Project Charter PowerPoint Template
Free PowerPoint Templates
Free
-
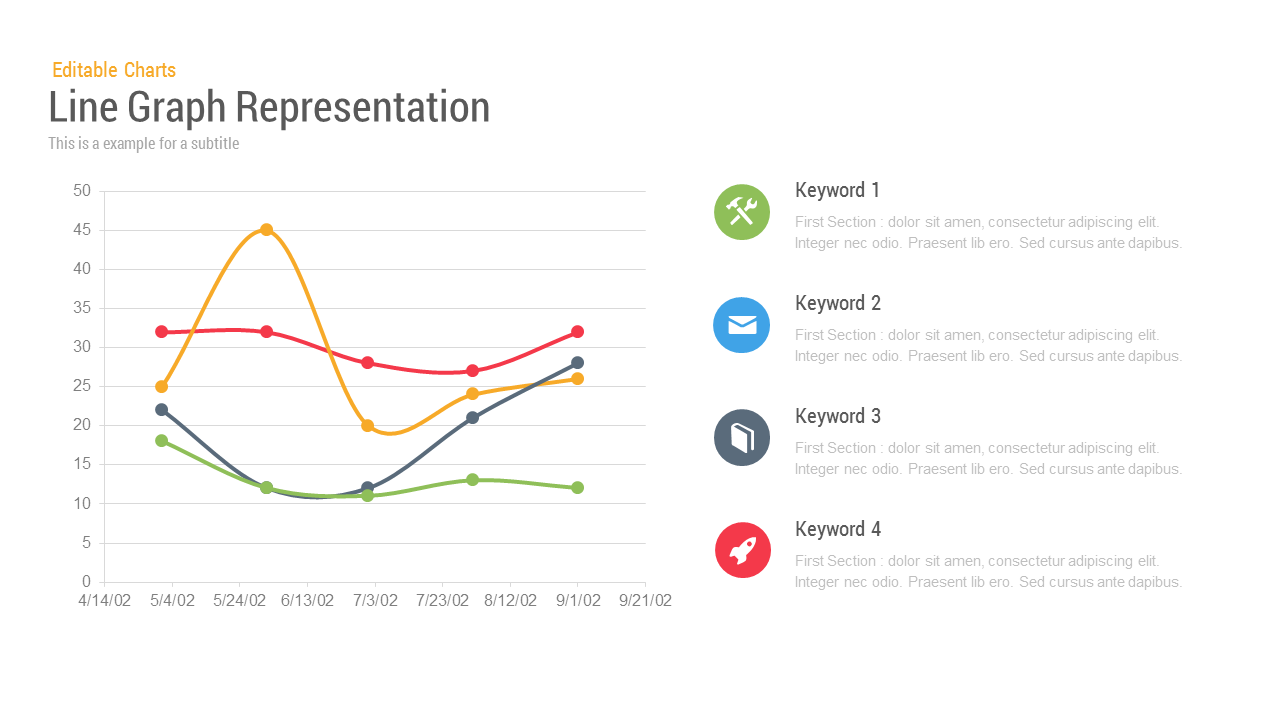
Line Chart Representation PowerPoint Templates and Keynote Slides
PowerPoint Charts
Premium
-
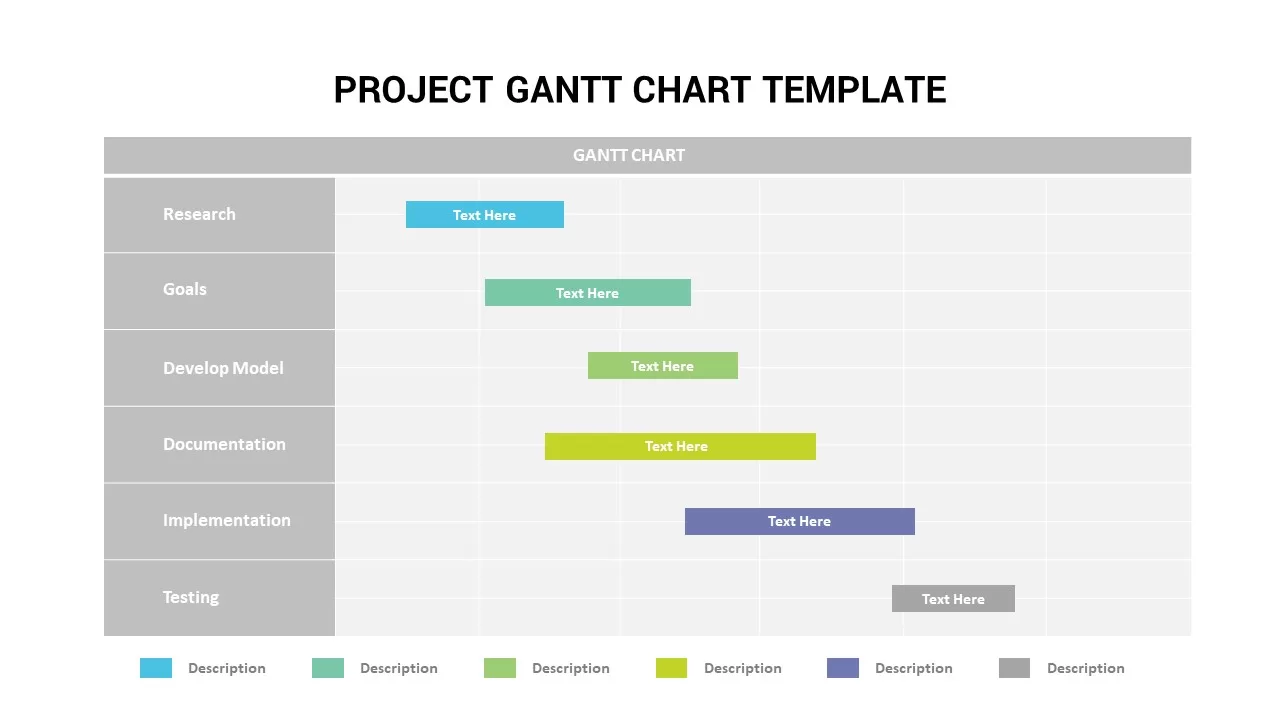
Gantt Chart in PPT Template
Infographic
Premium
-
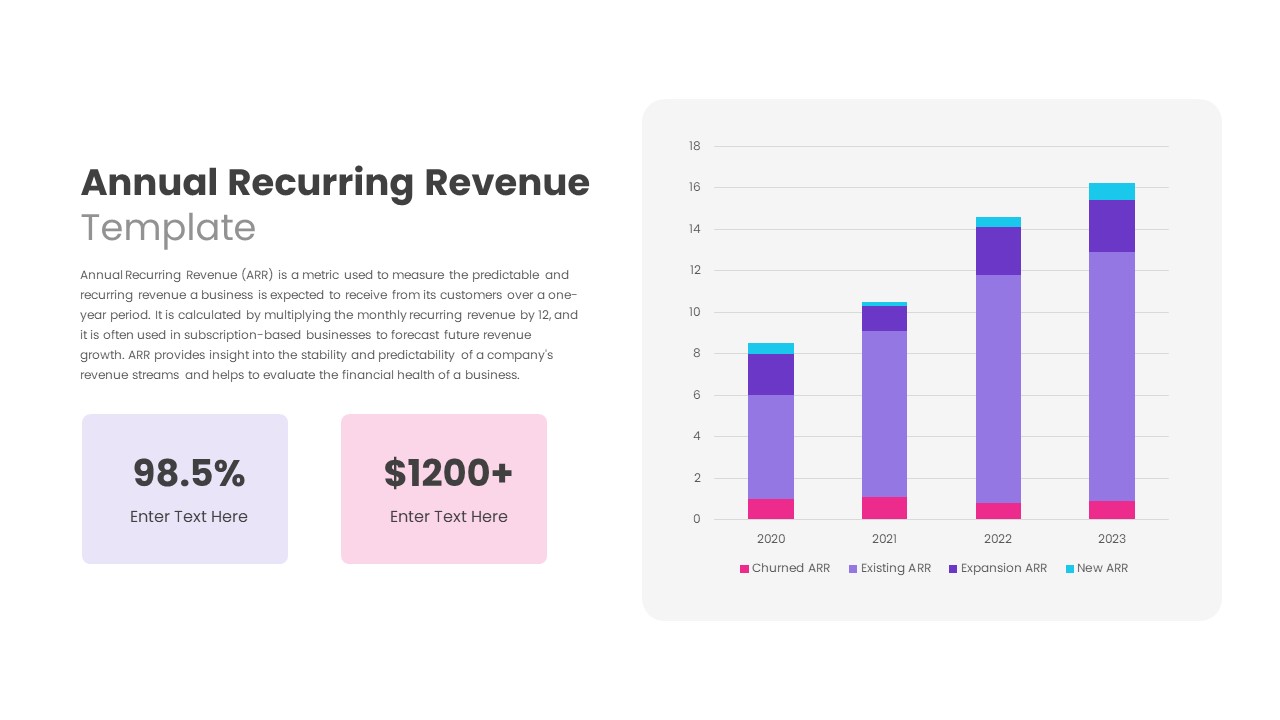
Annual Recurring Revenue PowerPoint Template
PowerPoint Templates
Premium
-
Business Growth Chart Template for PowerPoint and Keynote
Business Models
Premium
-

Stakeholder Register PowerPoint Template
PowerPoint Templates
Premium
-
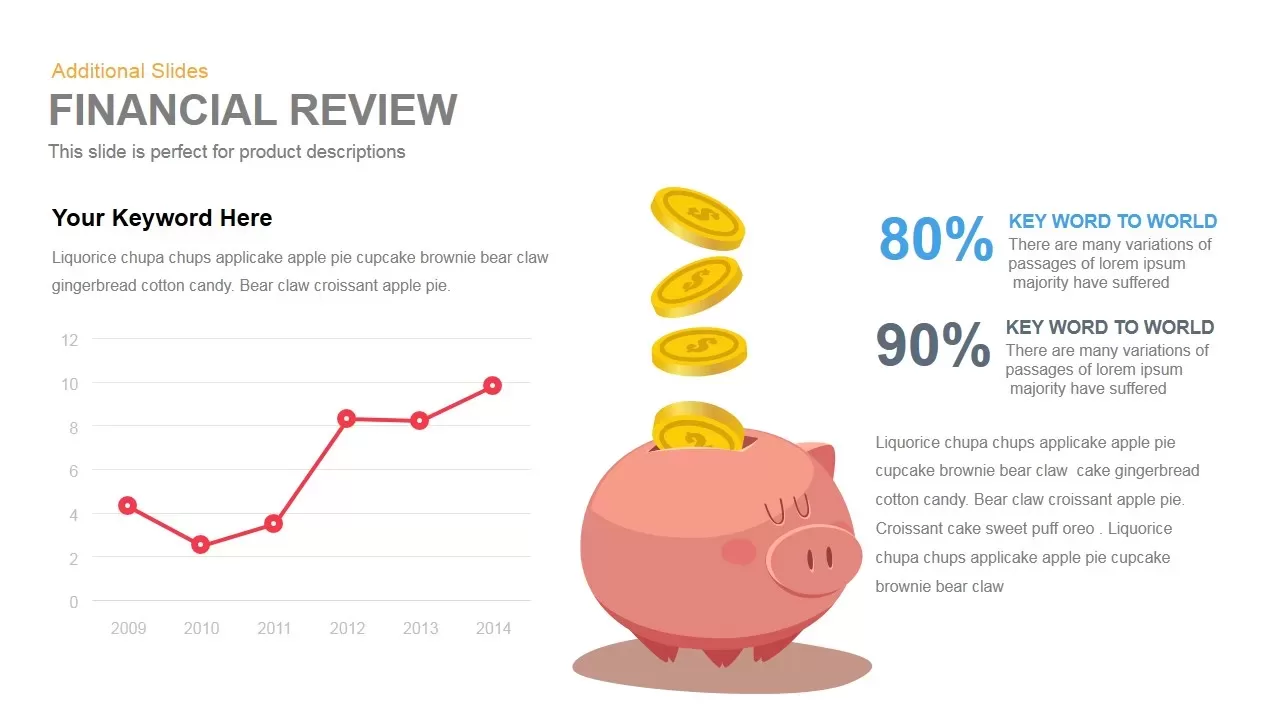
Financial Review Template for PowerPoint and Keynote
Infographic
Premium
-

Sales Pitch Deck PowerPoint Template
PowerPoint Business Templates
Premium
-
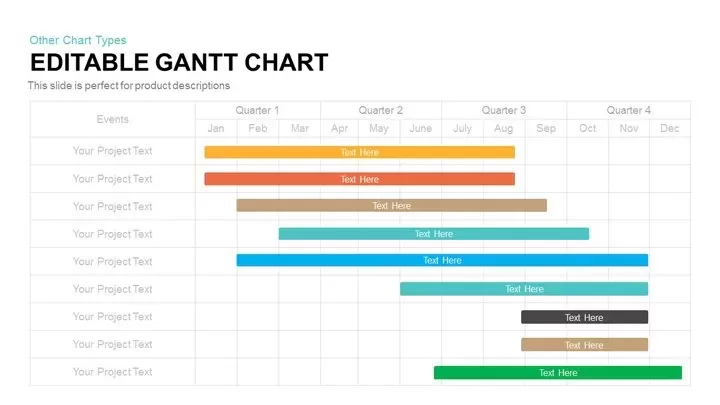
Gantt Chart PowerPoint Template & Keynote Slide
Agenda
Premium
-
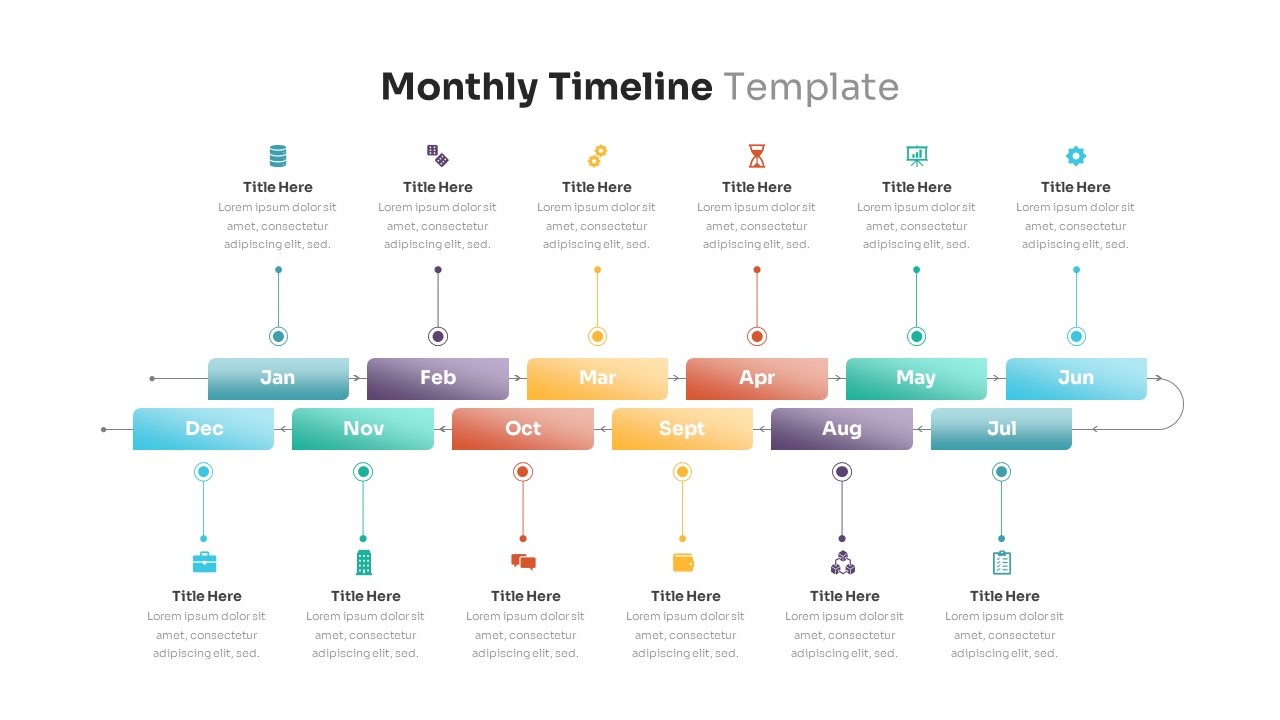
Monthly Roadmap Timeline PowerPoint Template
PowerPoint Templates
Premium
-
Time Management PowerPoint Template and Keynote Slide
Diagrams
Premium
-
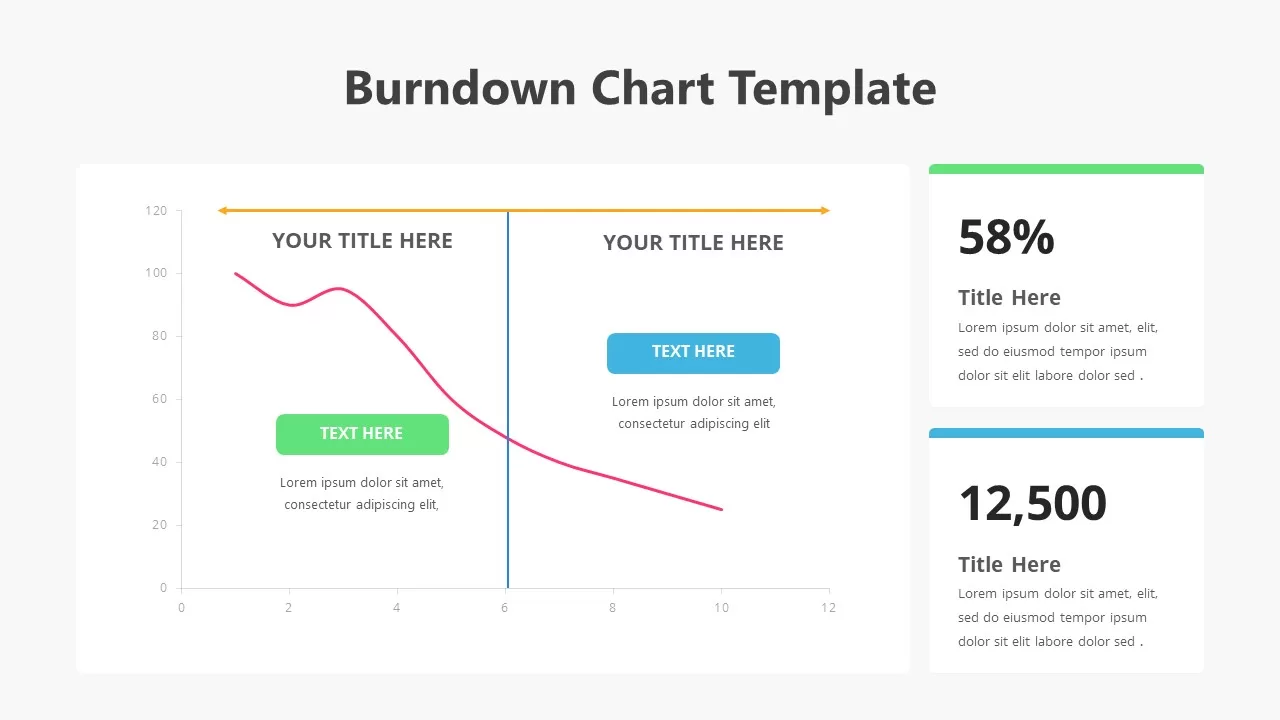
Burndown Chart PowerPoint Template
PowerPoint Charts
Premium
-
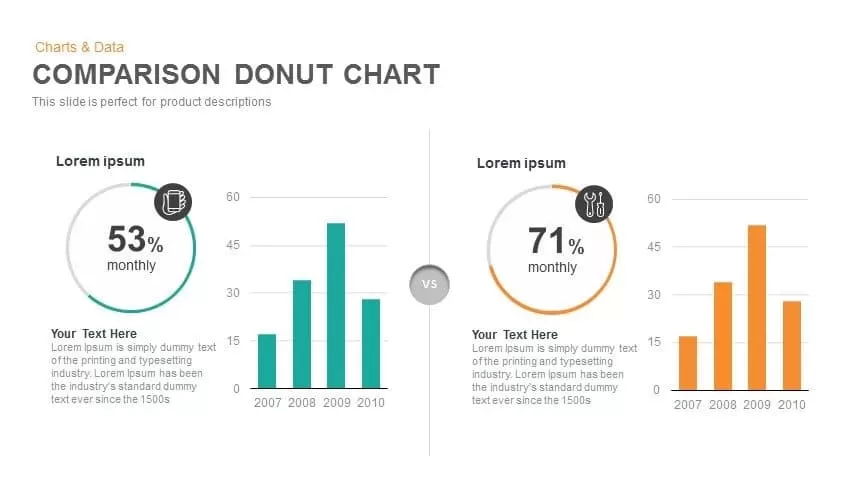
Comparison Donut Chart PowerPoint Template and Keynote
Keynote Templates
Premium
-
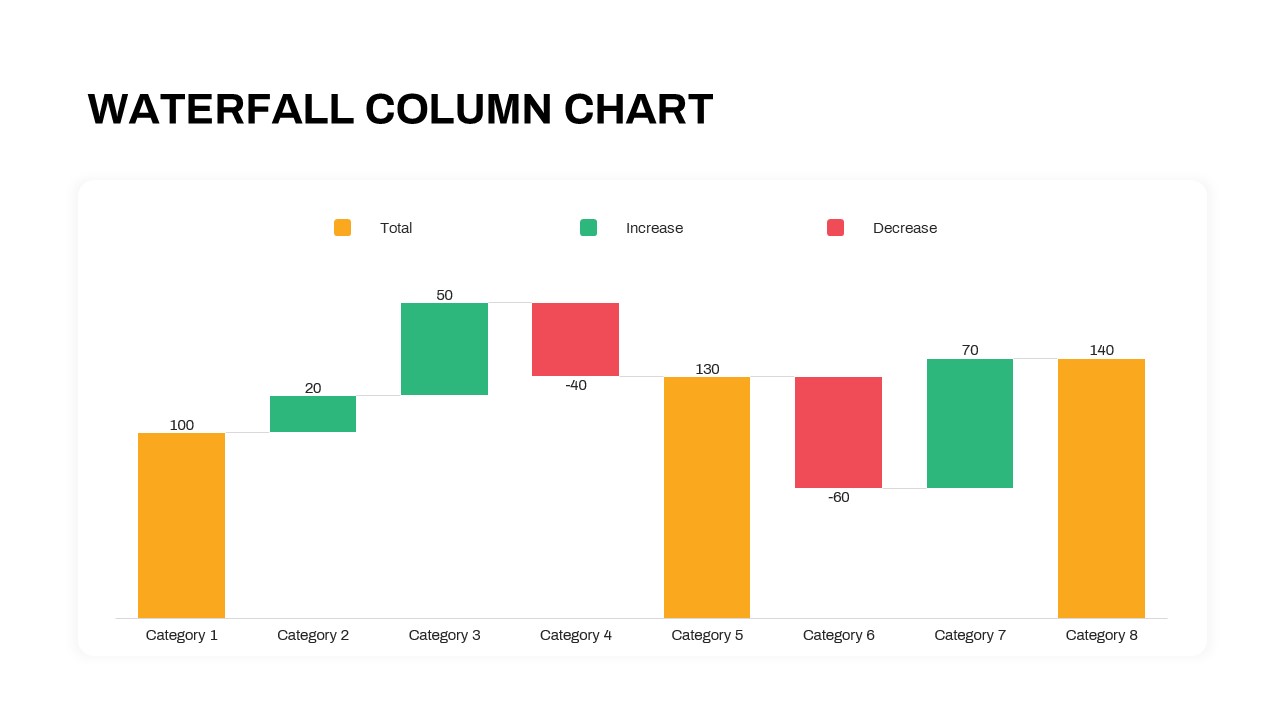
Waterfall Column Chart PowerPoint Template
Column and Bar chart
Premium
-

Clustered Column Chart PowerPoint Template
PowerPoint Charts
Premium
-
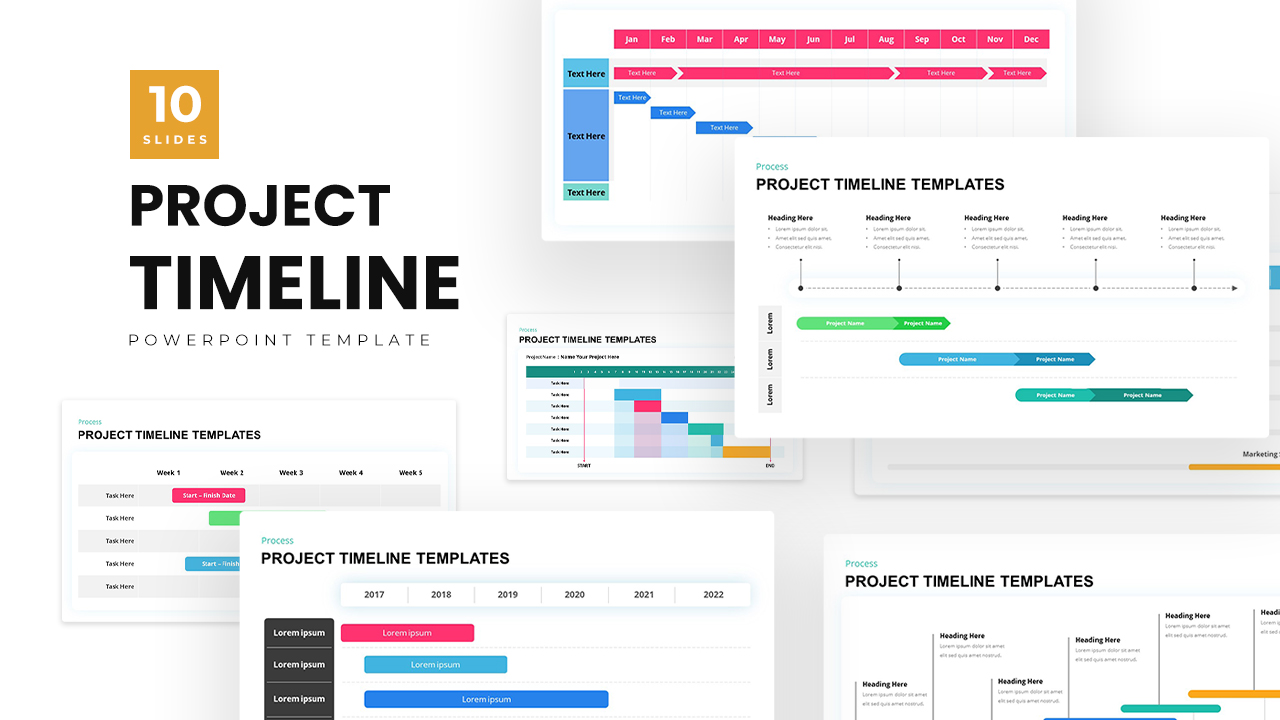
Project Timeline Template PowerPoint
Timeline PowerPoint Template
Premium
-
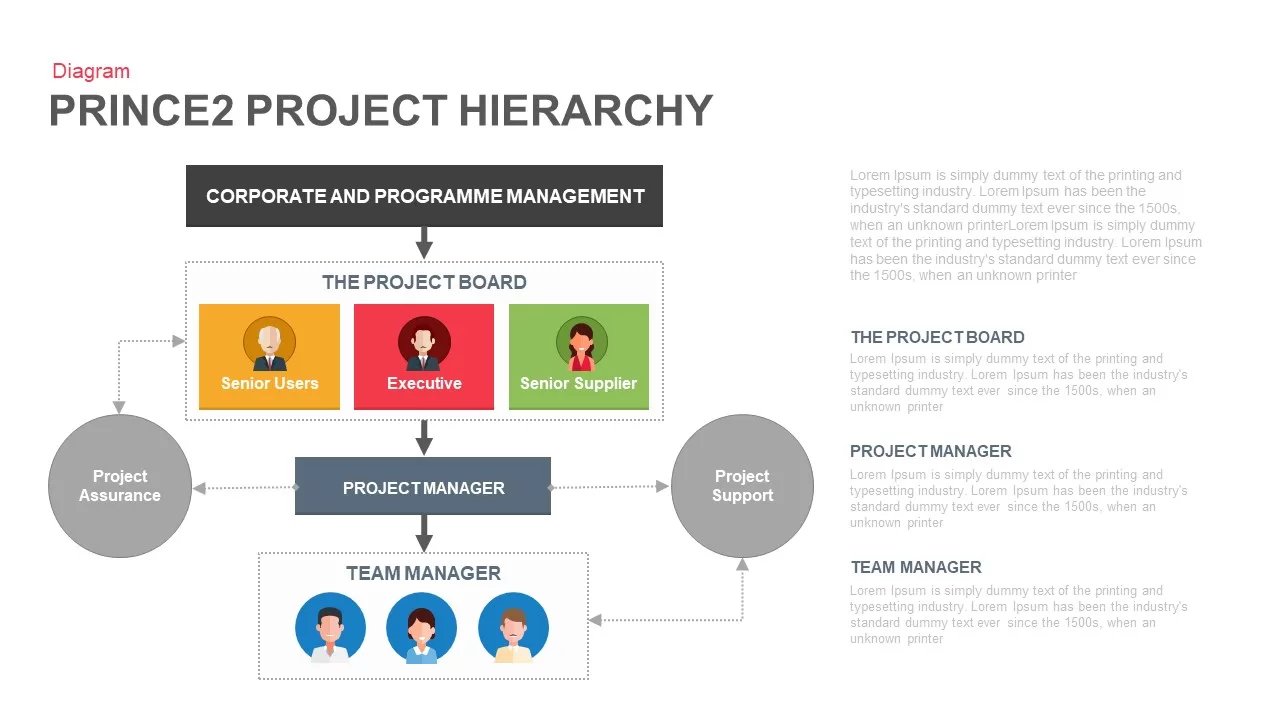
Prince2 Project Organisation Chart PowerPoint Template
Business Models
Premium
-
Free Management Deck Template
PowerPoint Templates
Free
-
Time Management PowerPoint Template and Keynote Diagram
Timeline PowerPoint Template
Premium
-
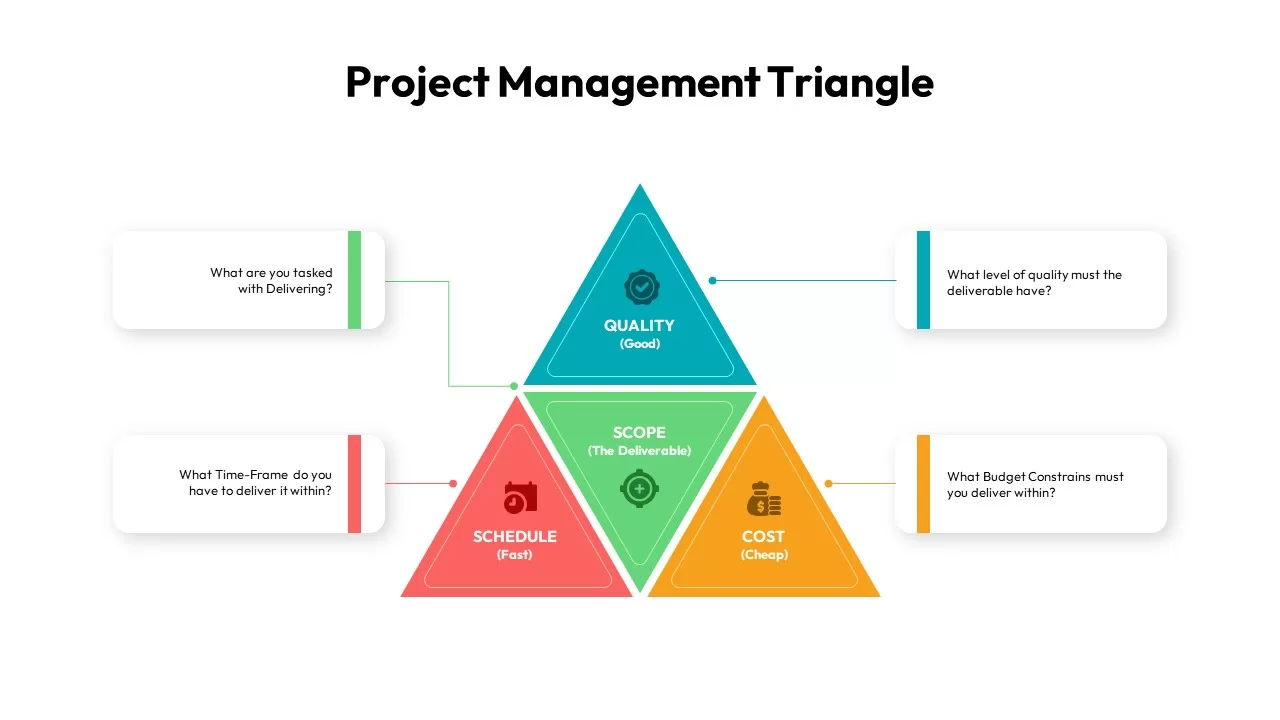
Project Management Triangle
PowerPoint Templates
Premium
-
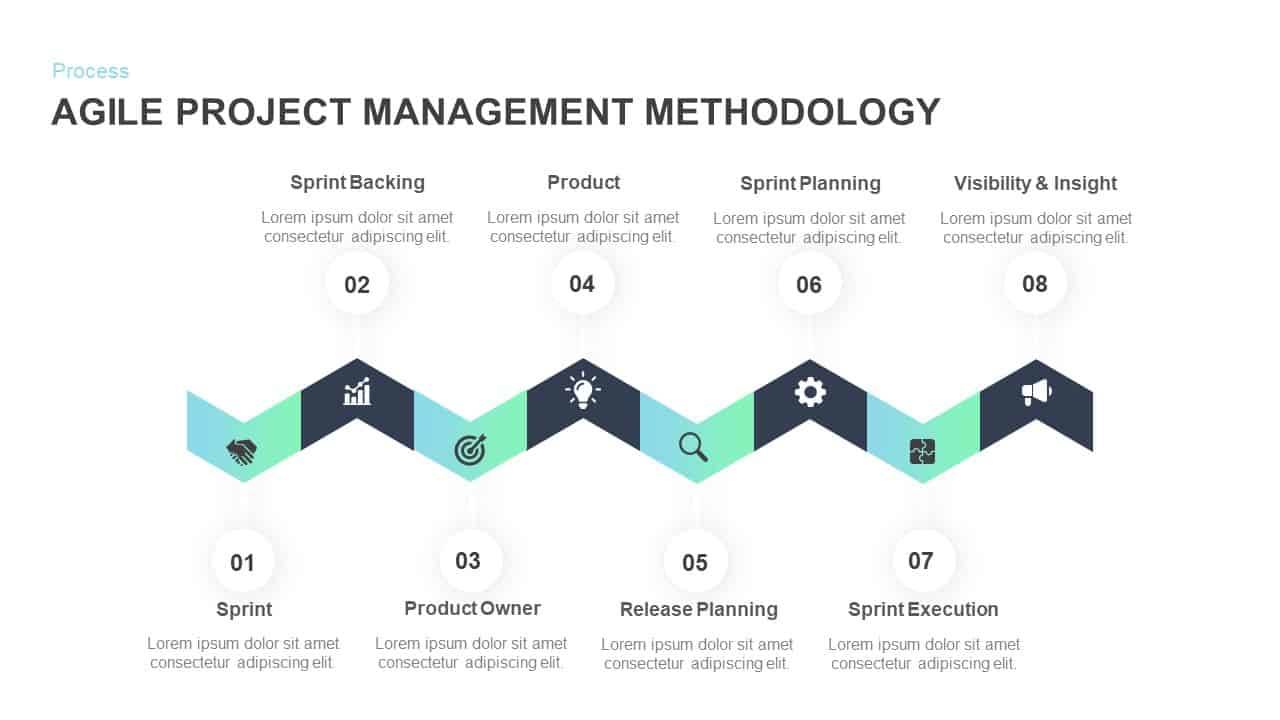
Agile Project Management Methodology PowerPoint Template and Keynote Slide
Process Flow Diagrams
Premium