


Profit and Loss Chart Infographic for PowerPoint Presentation
- Version
- Download 65
- File Size 0.00 KB
- File Count 1
- Create Date August 25, 2021
- Last Updated February 3, 2023
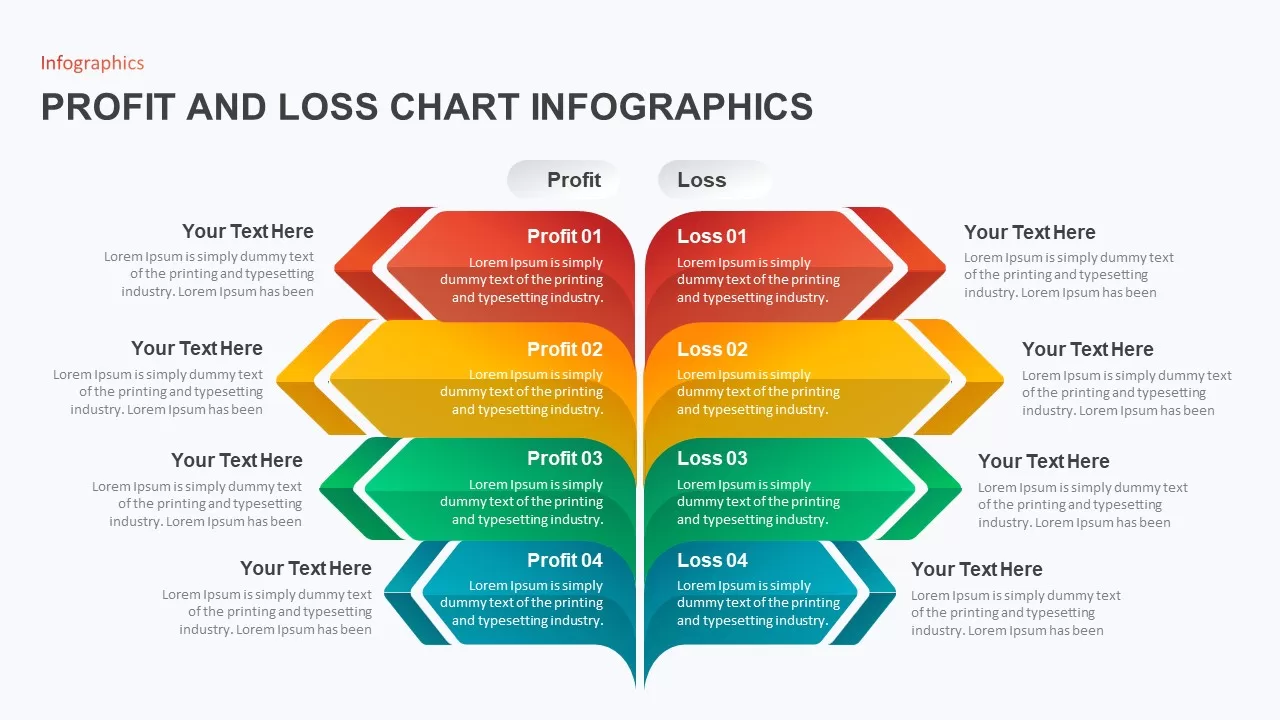
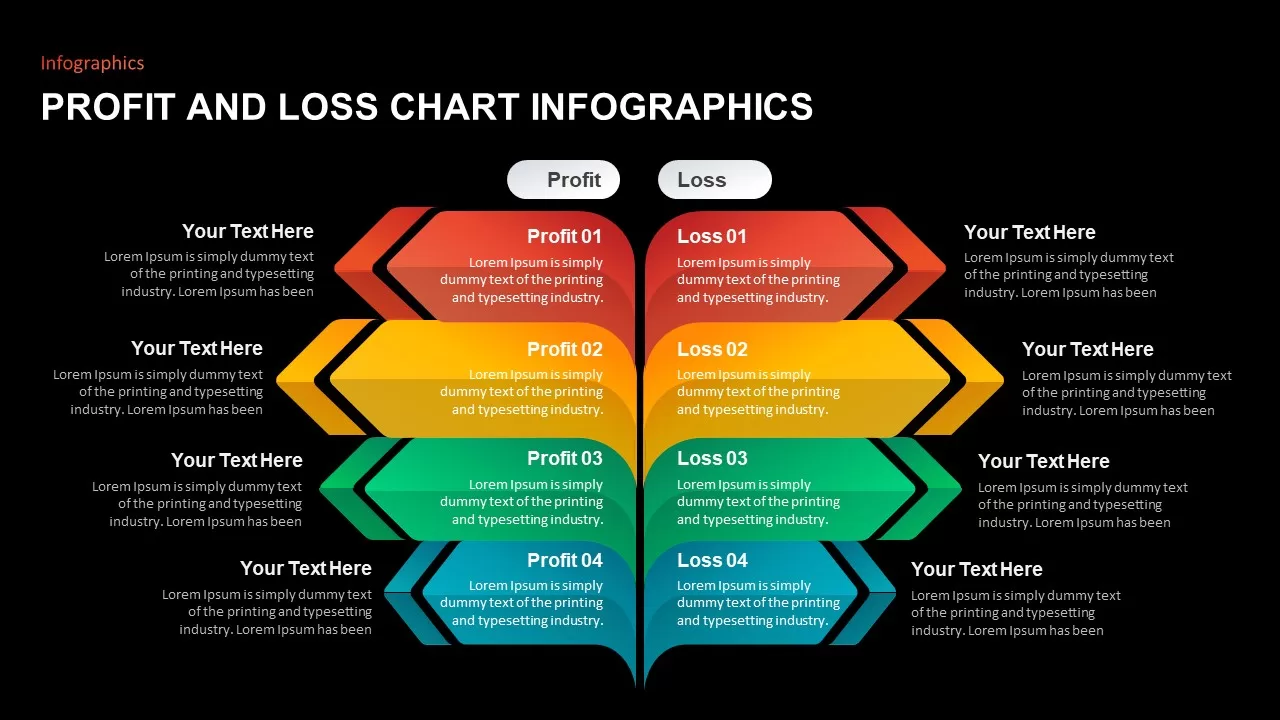
Profit and Loss Chart Infographic for PowerPoint Presentation
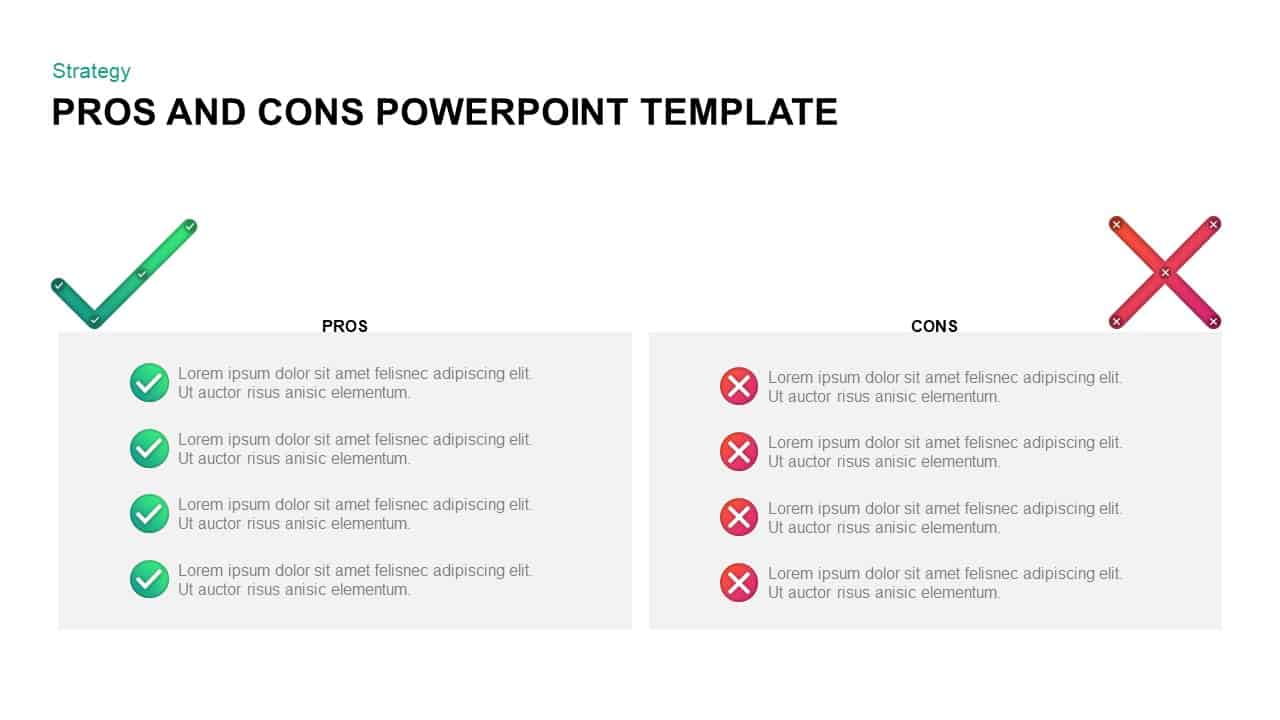
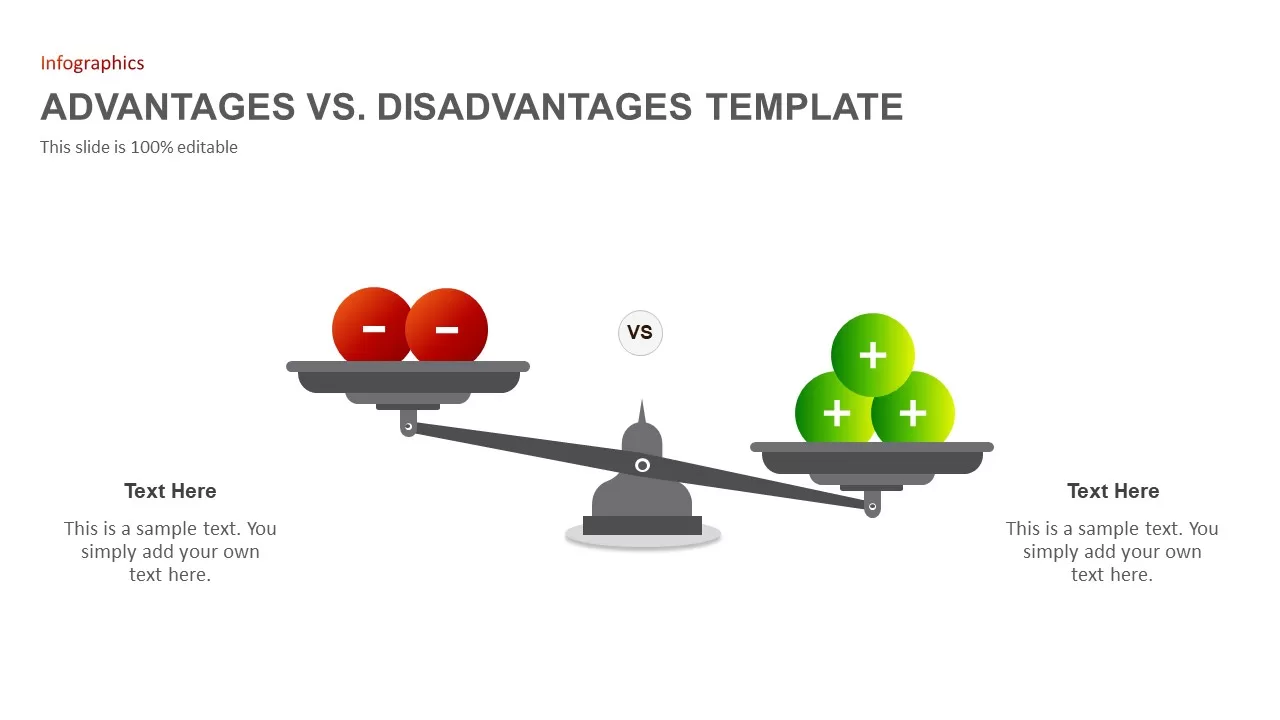
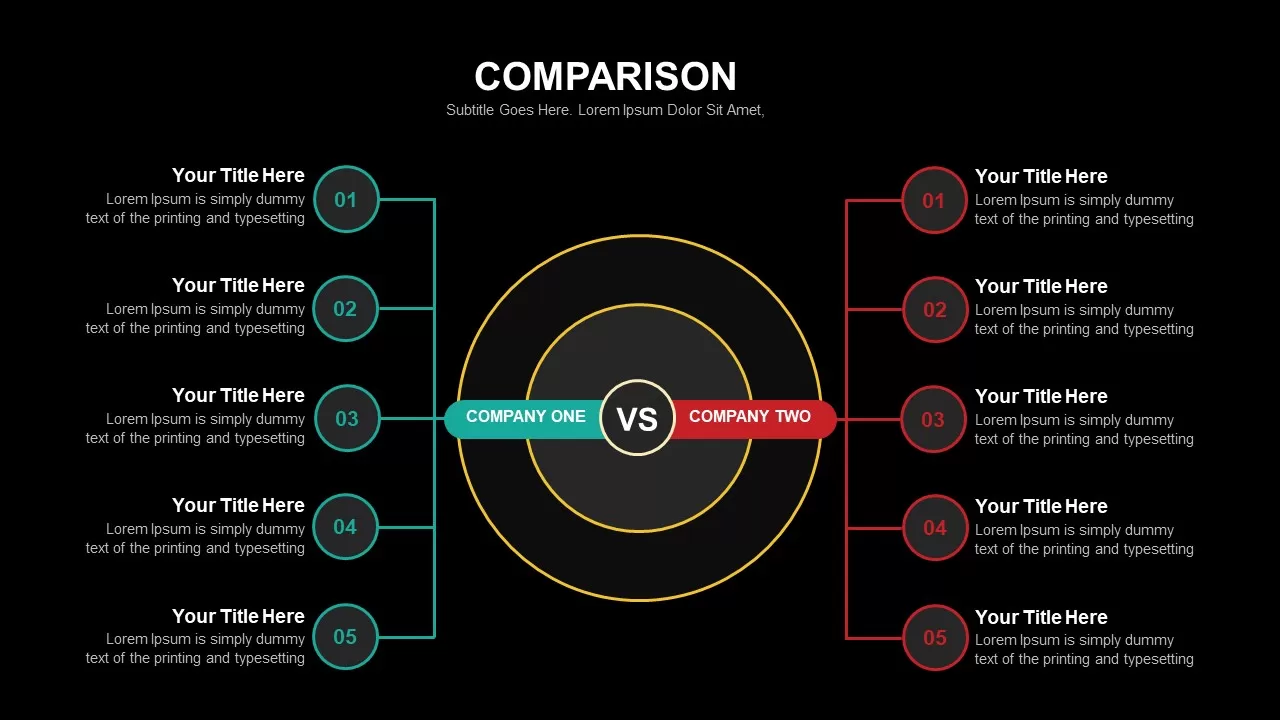
Two section comparison slide of profit and loss chart infographics is modern bullet point creation that shows the two elements of an activity or a process. This is a high-impactful arrow PowerPoint presentation crafted as a comparison slide of production descriptions. This template is used for profit and loss reports of an organization with simple graphical techniques. If you would like to give statistics of profit and loss, it may be easy to understand by this simple infographic presentation template. So, this is a user-friendly design of a profit and loss presentation template, giving all valuable accounts in a single easy-to-understand format. No matter, whatever your message might be, this will help you present two sides of a coin.
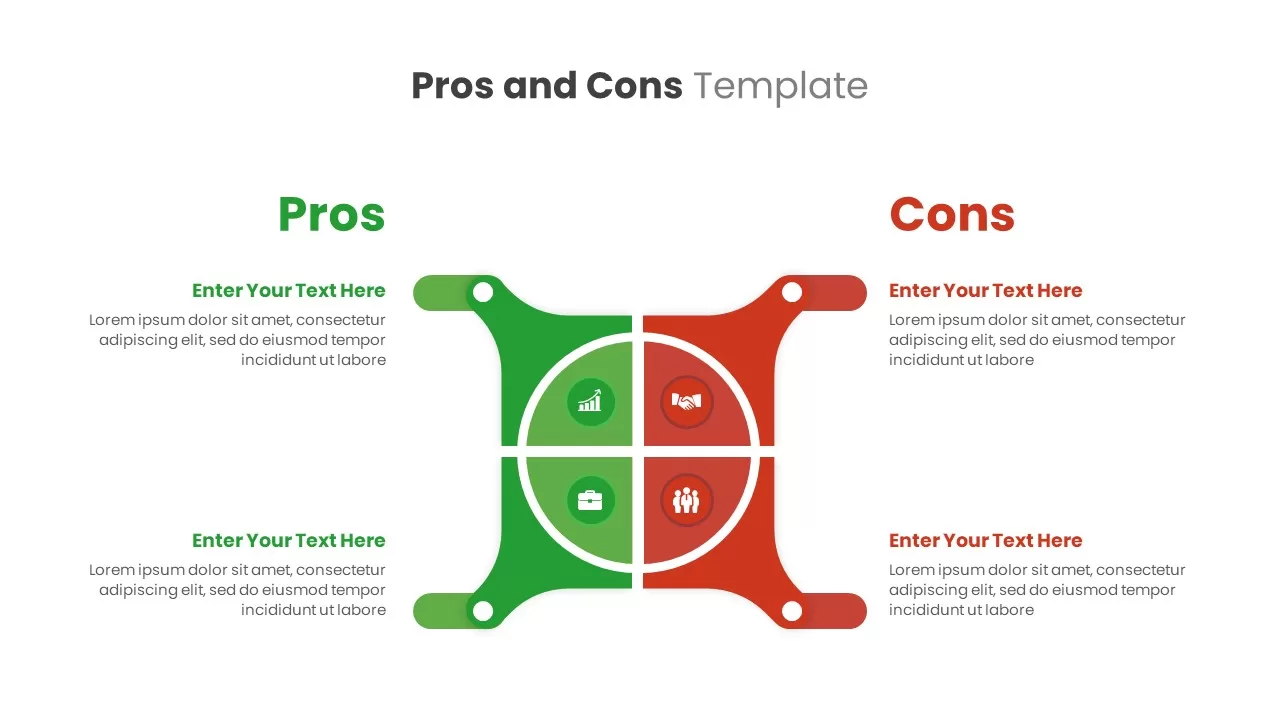
Profit and loss chart infographic for PowerPoint presentation is the generic slide for comparison presentation. Apart from the profit and loss presentation, the users can display pros and cons, dos and don’ts, likes and dislikes, similarities and differences, and have many other options to display negative and positive sides of an action or process. For example, the wide use of the internet and computers has been spawned many pros and cons related to human development and societal development. On the one hand, it improves the mode of communication through social media and other network options. On the other hand, it generates a lot of ethical and privacy issues. Hence, the profit and loss PowerPoint template can illustrate the pros and cons of different concepts and fields.
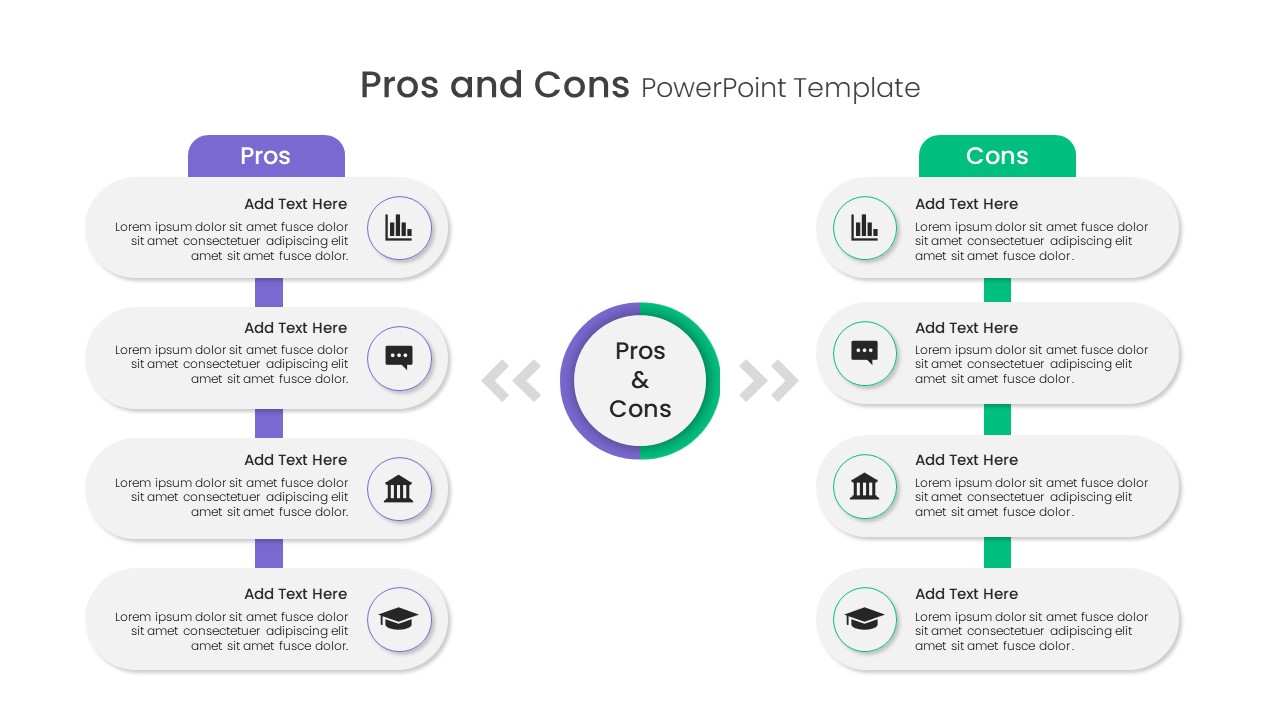
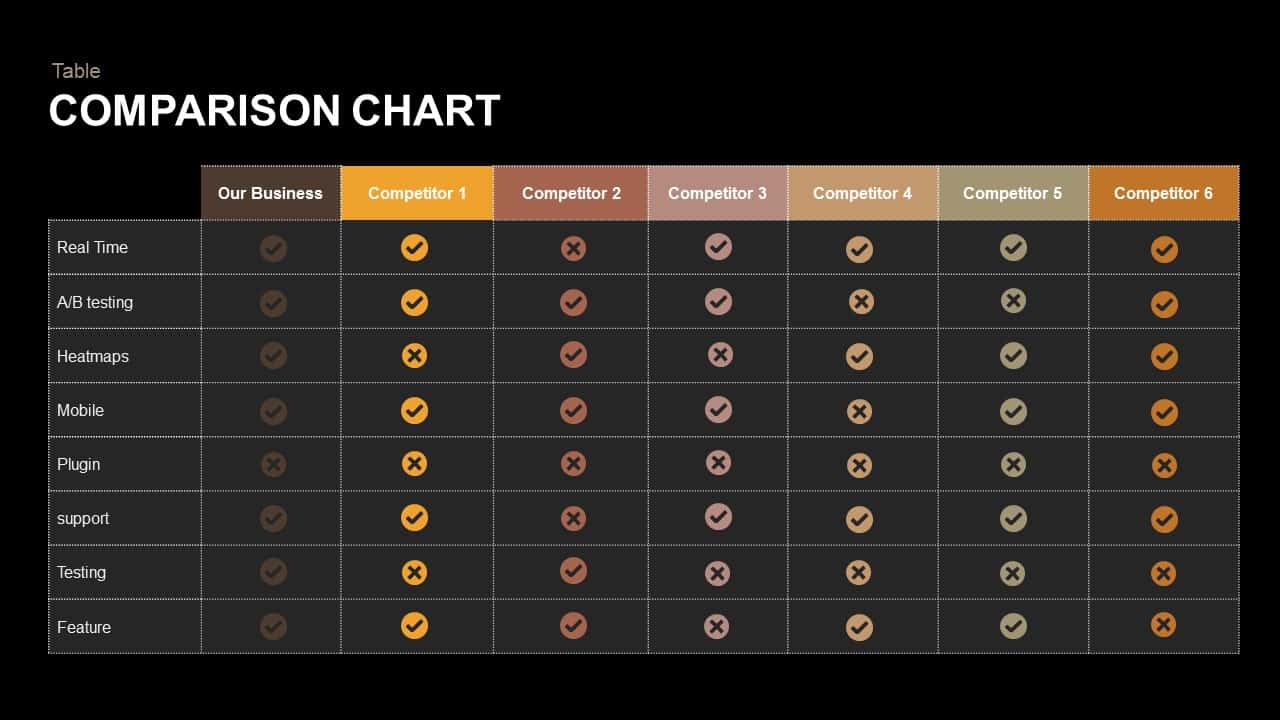
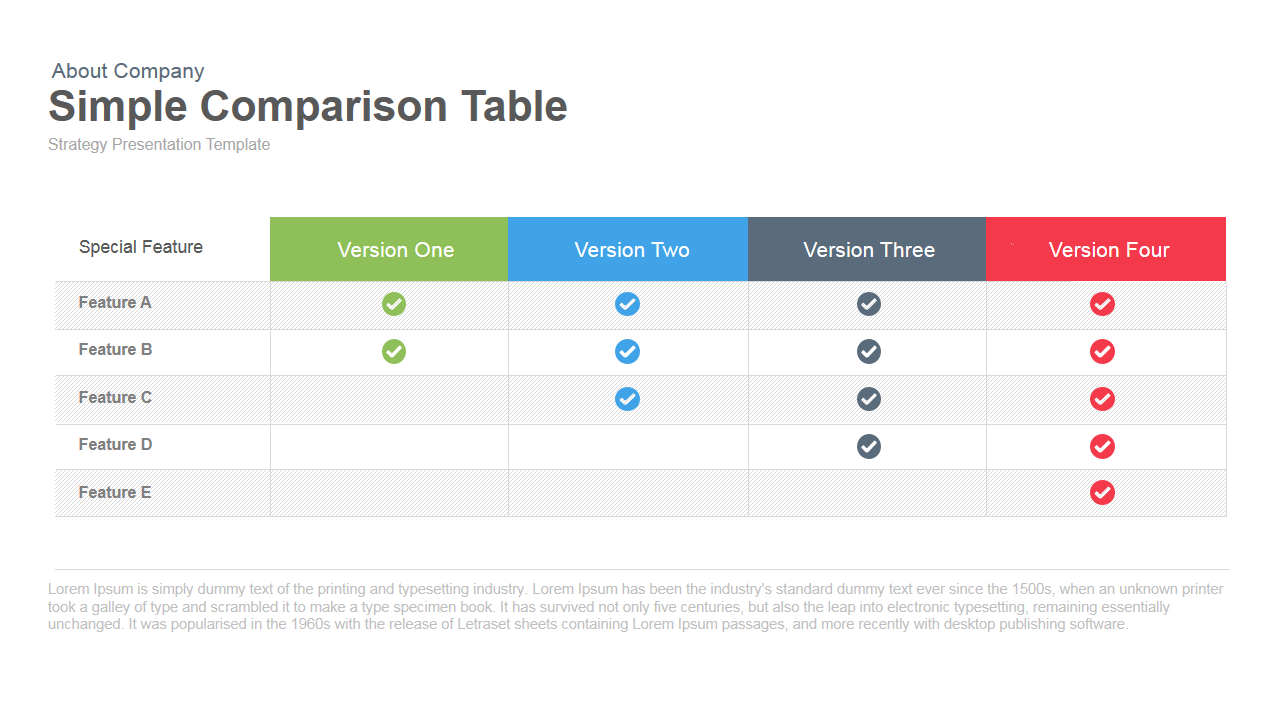
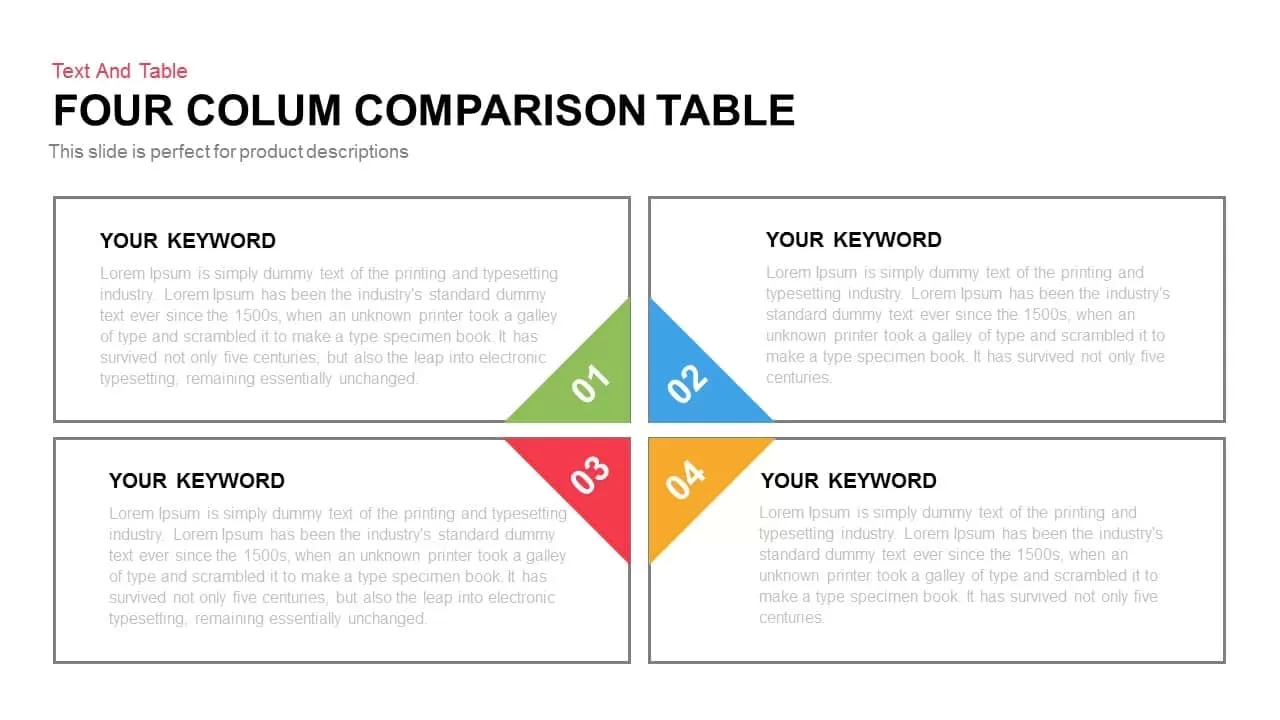
Profit and loss report PowerPoint chart is an editable common presentation diagram that showcases four elements on both sides. Comparison PowerPoint template allows the user to show product features by comparing the nearest competitive product. The two-slide template is a traditional PowerPoint for a business presentation, fully projecting the written fonts all over the design. So, when users’ need more text areas, the presenters could be downloading profit and loss ppt presentation slides to meet purposes.
Attached Files
| File | Action |
|---|---|
| https://premiumdownloads.s3.amazonaws.com/SB01905-Profit And Loss Chart Infographics.zip | Download |
Login to download this file
Add to favorites
Add to collection
-

Item ID
SB01905 -

Related Templates
-
Pros and Cons Template for PowerPoint & Keynote
Business Models
Premium
-
Pros and Cons PowerPoint Template & Keynote Slide
Diagrams
Premium
-
Free Pros And Cons PowerPoint Template
Infographic
Free
-
Pros and Cons PowerPoint Template Diagram with Arrow
Arrow Diagrams
Premium
-
Advantages Disadvantages PowerPoint Template
Business Models
Premium
-
Pros and Cons template
Infographic
Premium
-
Comparison Chart PowerPoint Template and Keynote Slide
Tables
Premium
-
Simple Comparison Table PowerPoint Template & Keynote
Tables
Premium
-
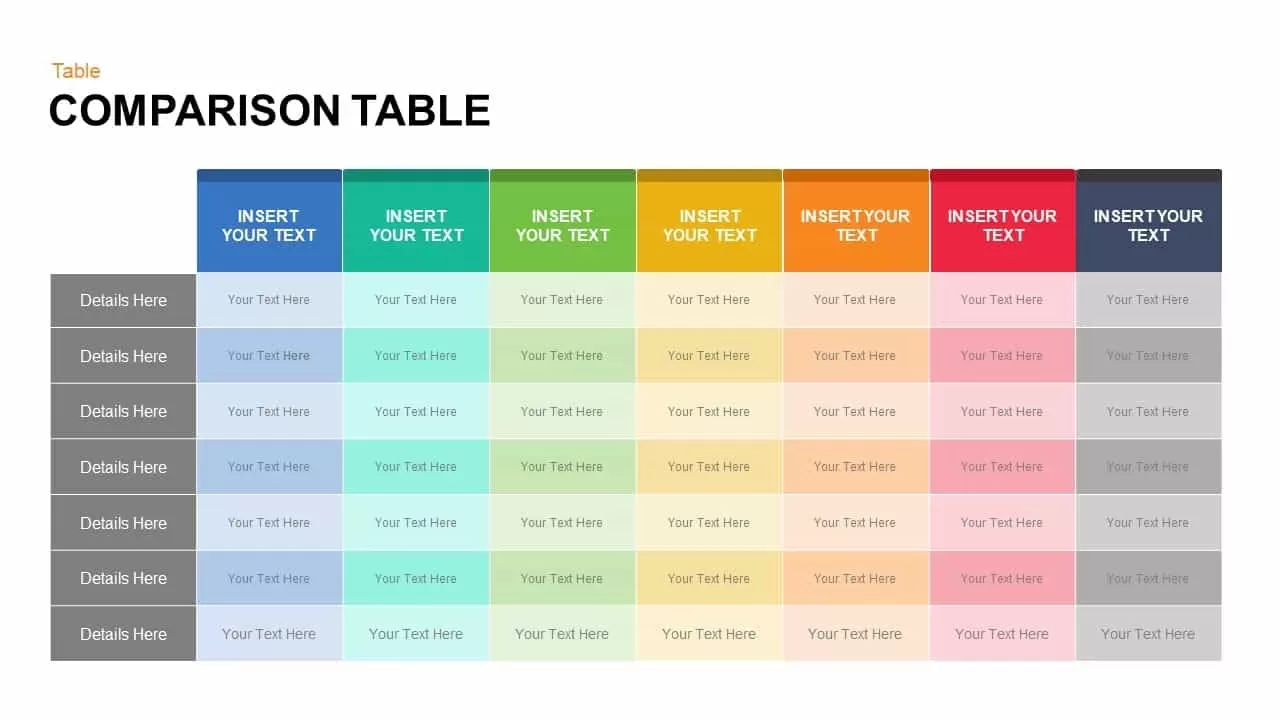
Comparison Table for PowerPoint and Keynote Presentation
Tables
Premium
-
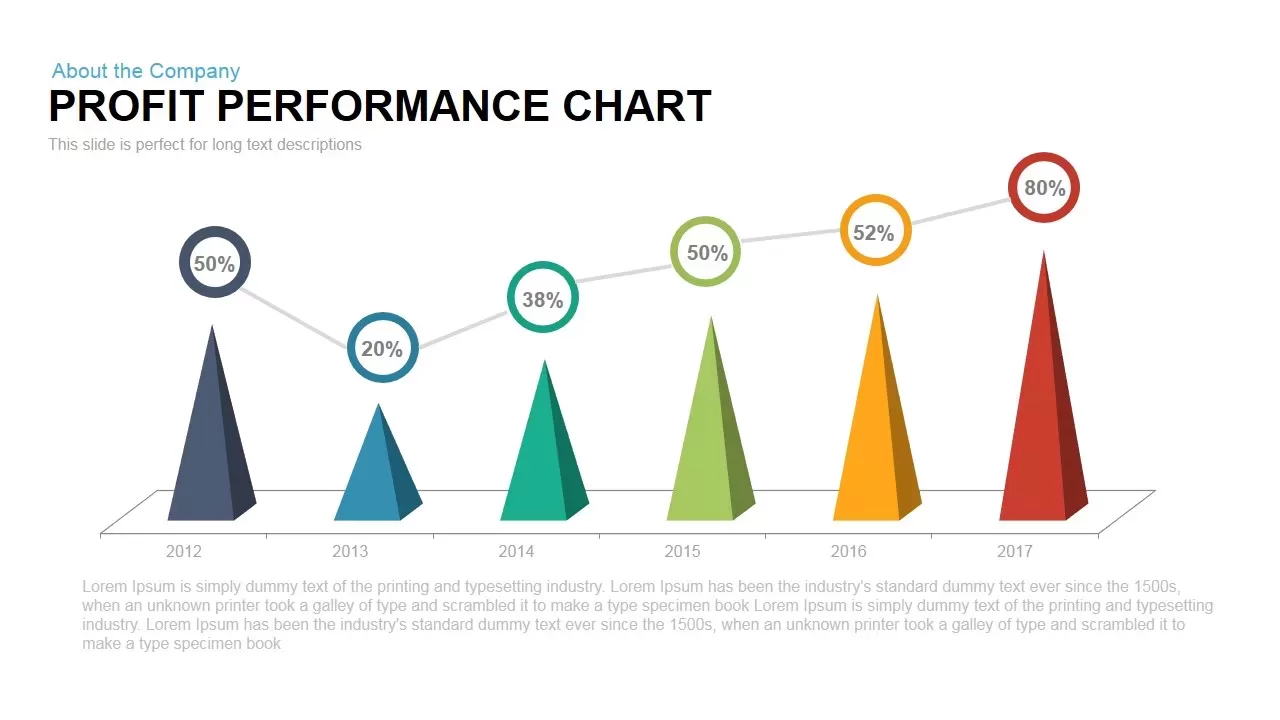
Profit Performance Chart PowerPoint Template
PowerPoint Charts
Premium
-
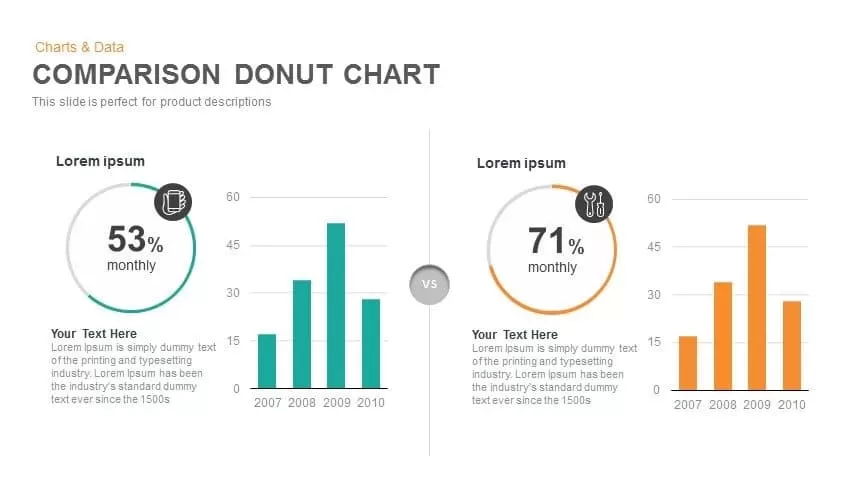
Comparison Donut Chart PowerPoint Template and Keynote
Keynote Templates
Premium
-
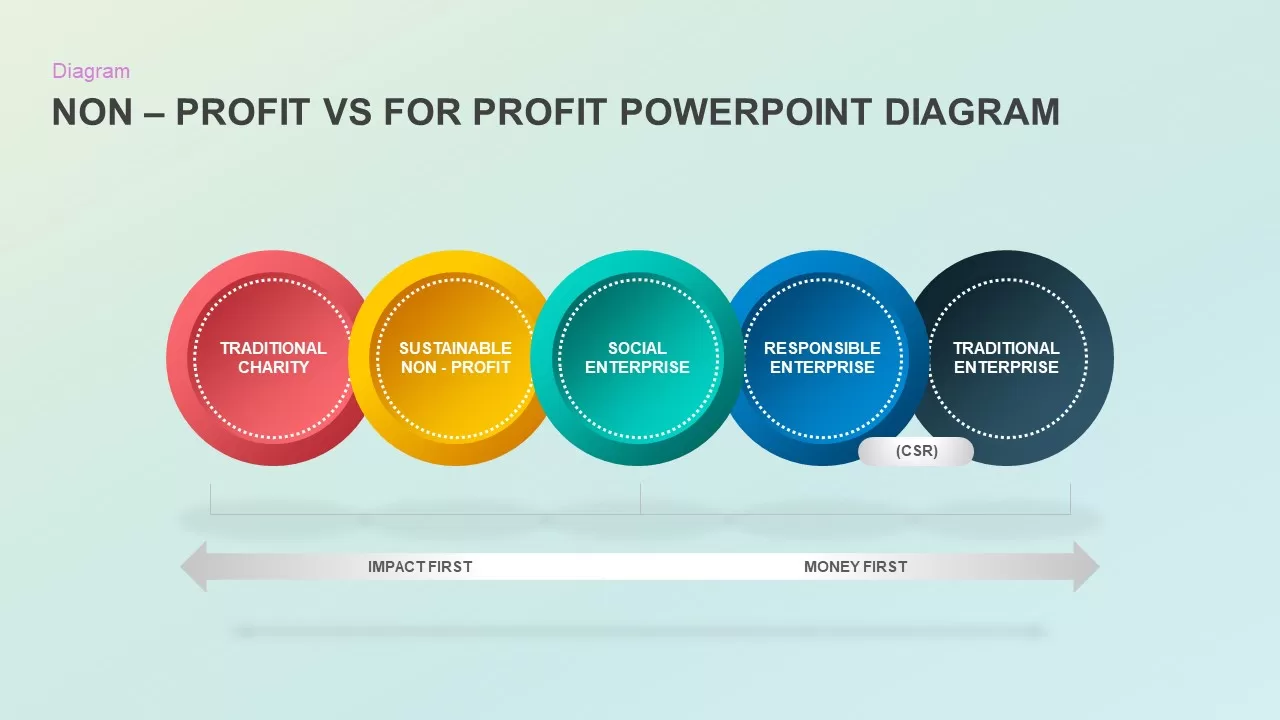
NonProfit Vs For Profit PowerPoint Diagram
PowerPoint Business Templates
Premium
-
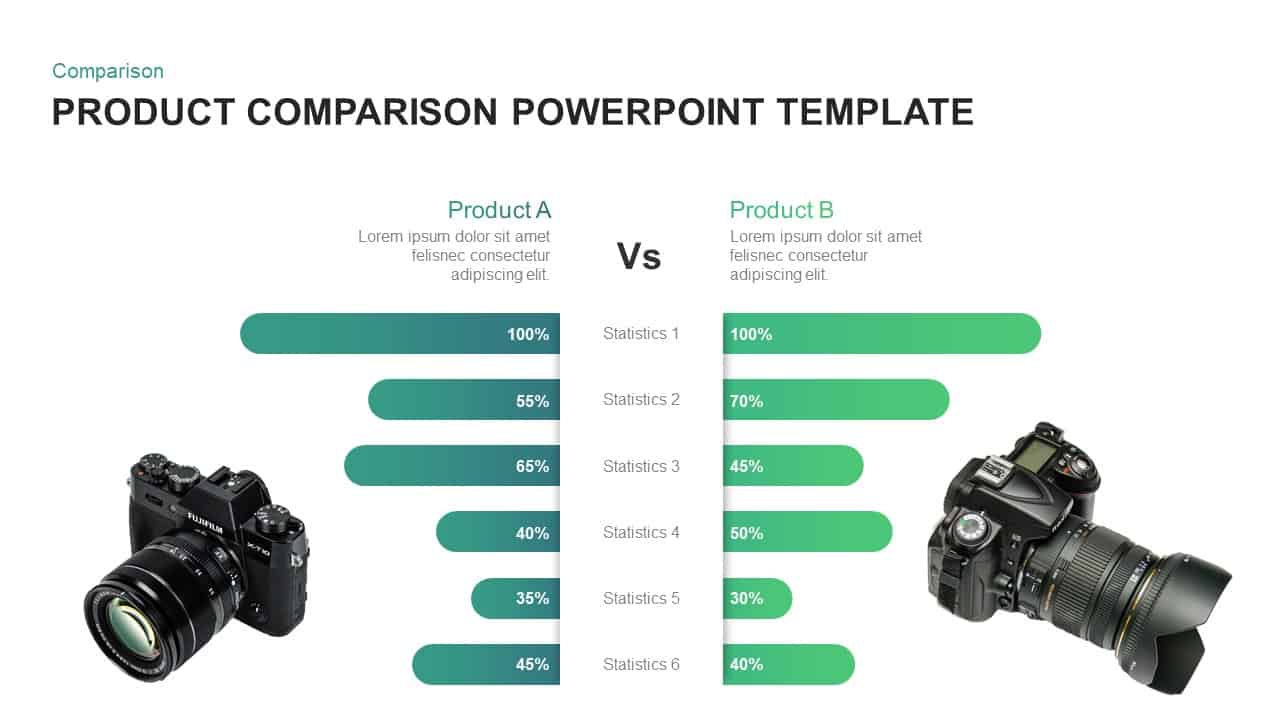
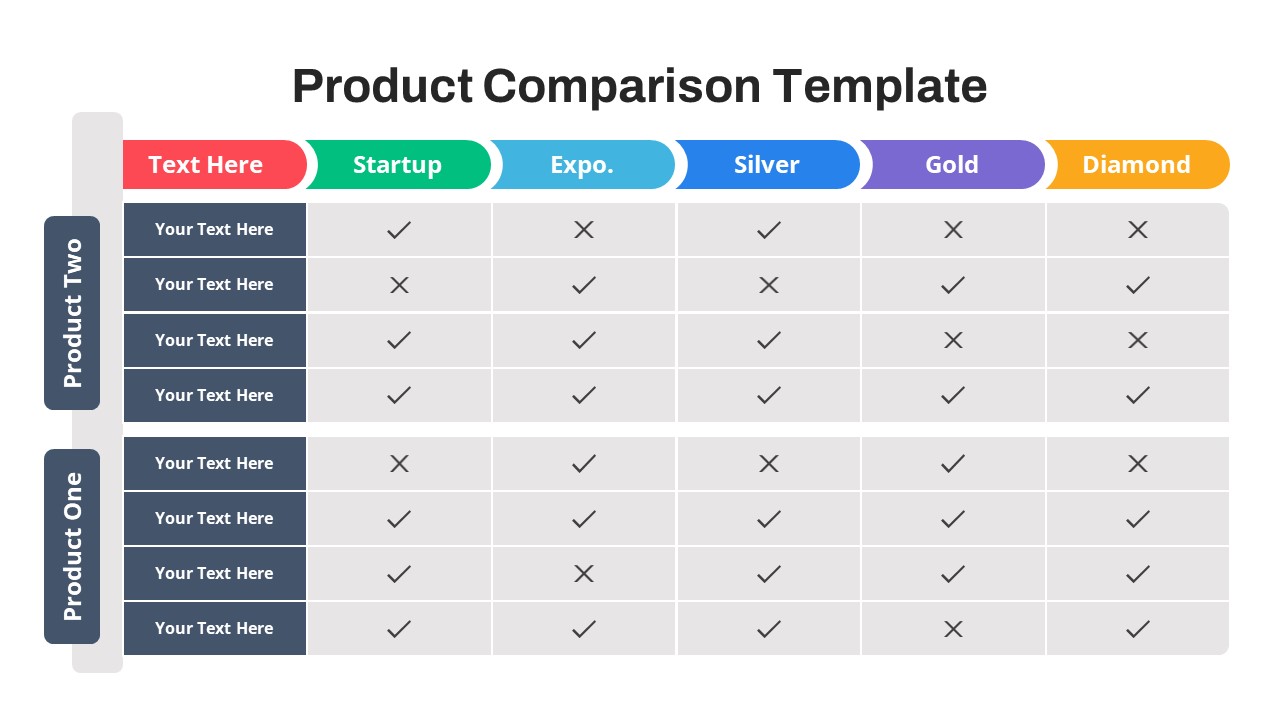
Product Comparison PowerPoint Template & Keynote Diagram
Business Models
Premium
-
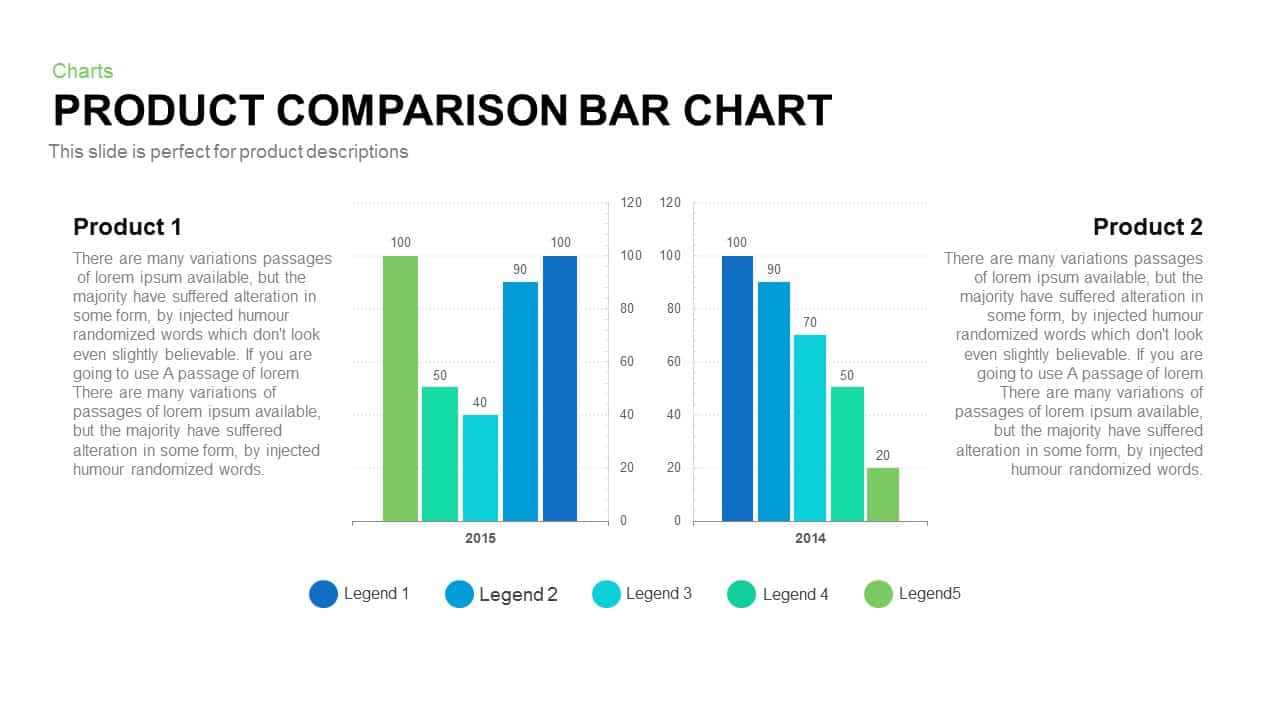
Product Comparison Bar Chart Template for PowerPoint and Keynote
PowerPoint Charts
Premium
-
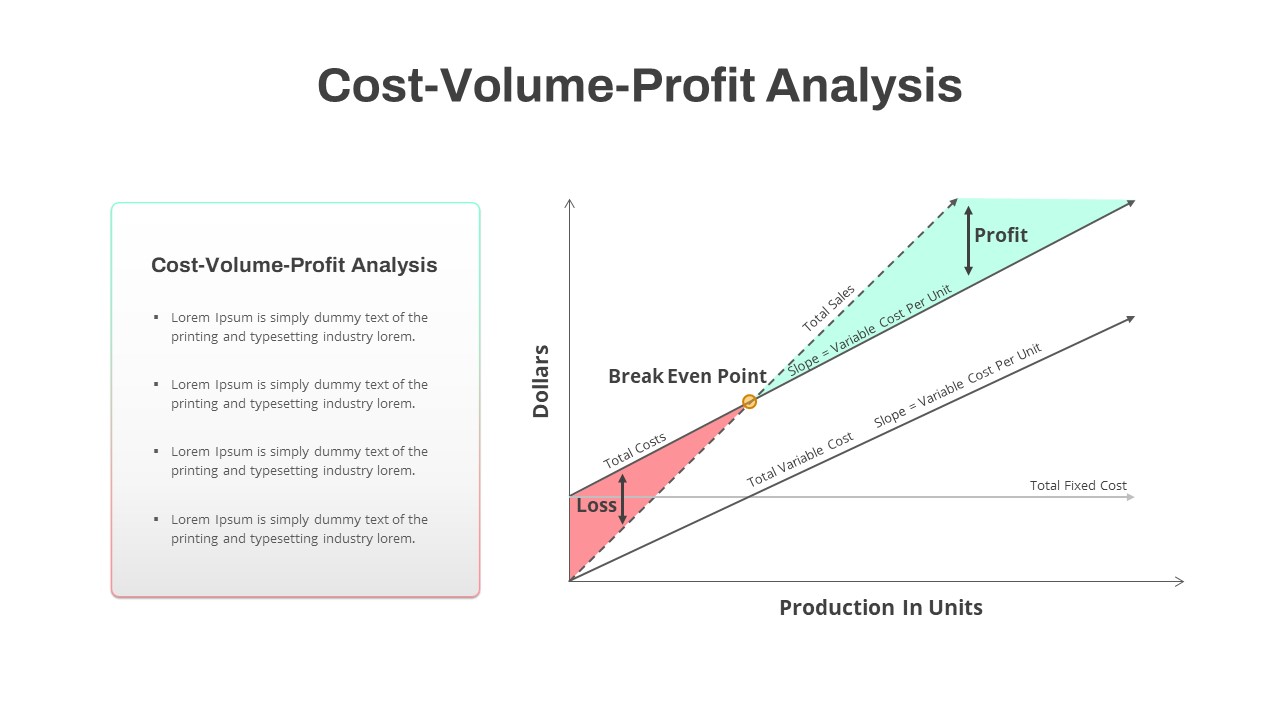
Cost Volume Profit Analysis PowerPoint Template
PowerPoint Templates
Premium
-
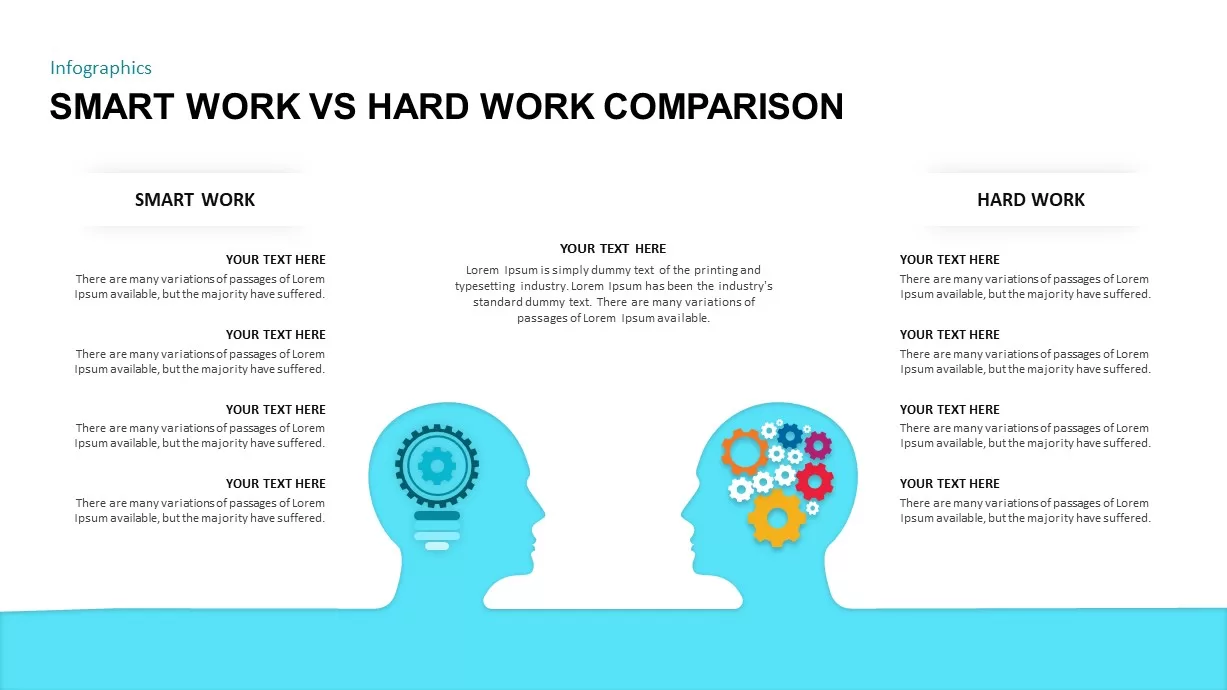
Smart Work VS Hard Work Comparison Template
Business Models
Premium
-
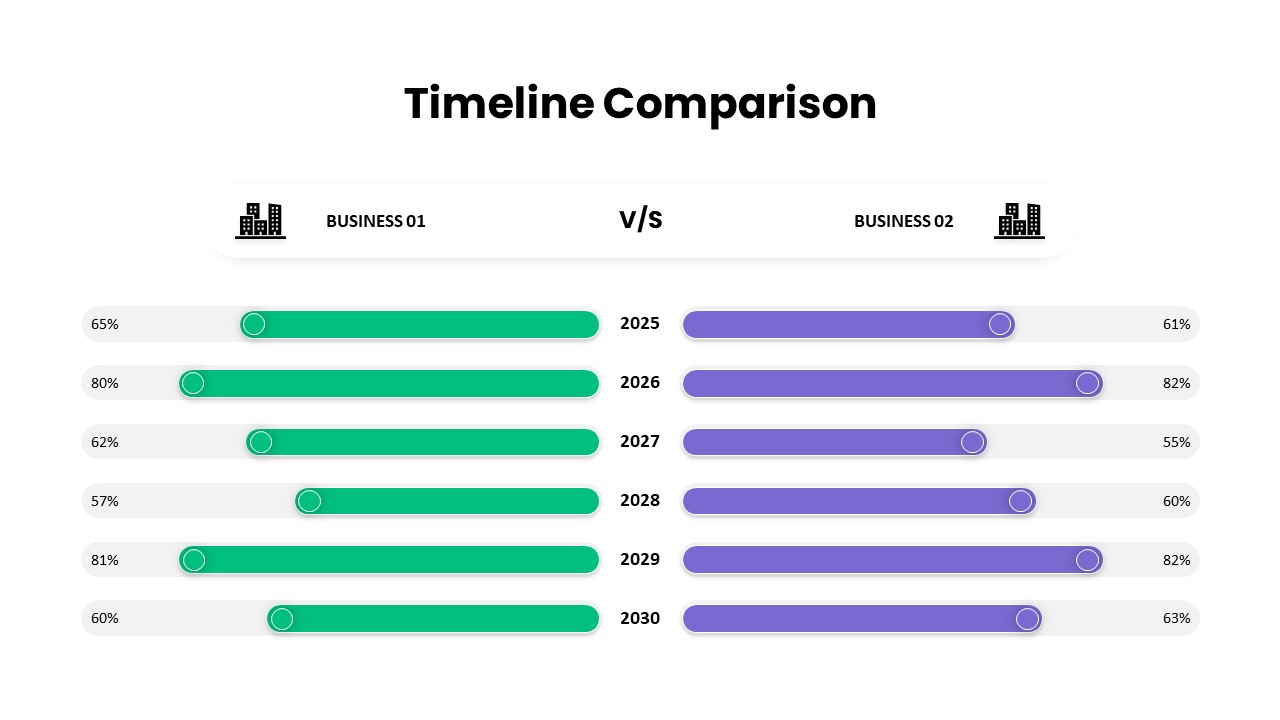
Timeline Comparison PowerPoint Template
Timeline PowerPoint Template
Premium
-
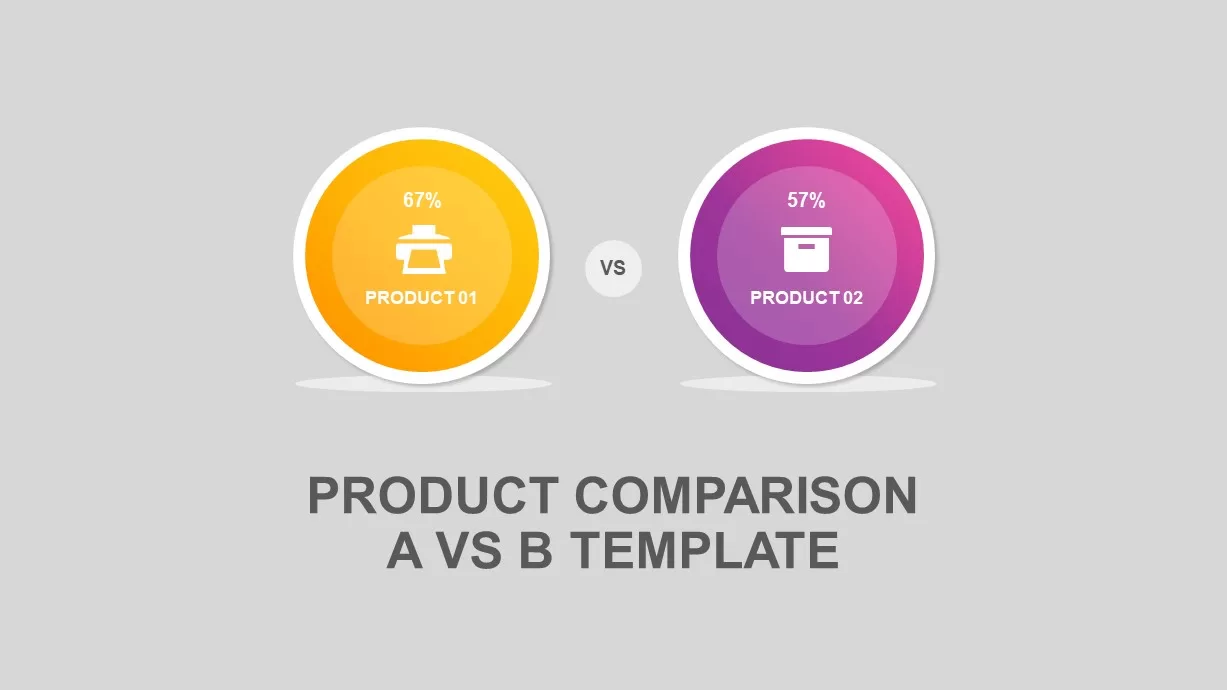
Product Comparison A vs B PowerPoint Template
Business Models
Premium
-
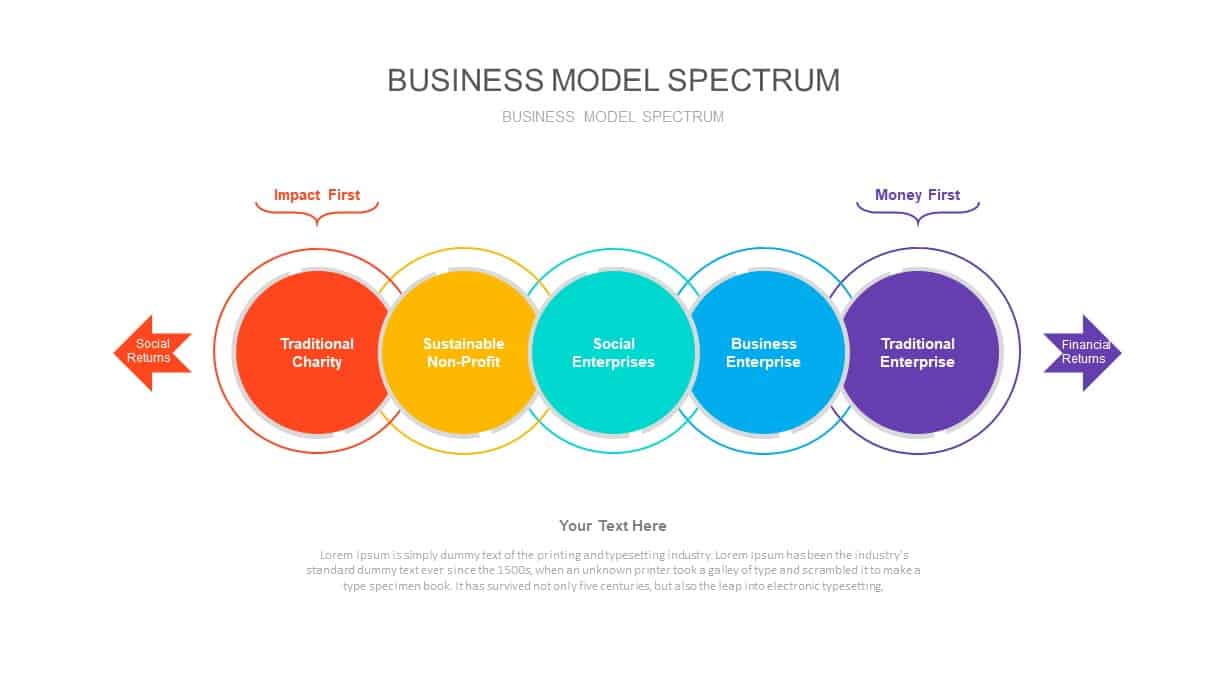
Business Model Spectrum PowerPoint Diagram
Business Models
Premium
-
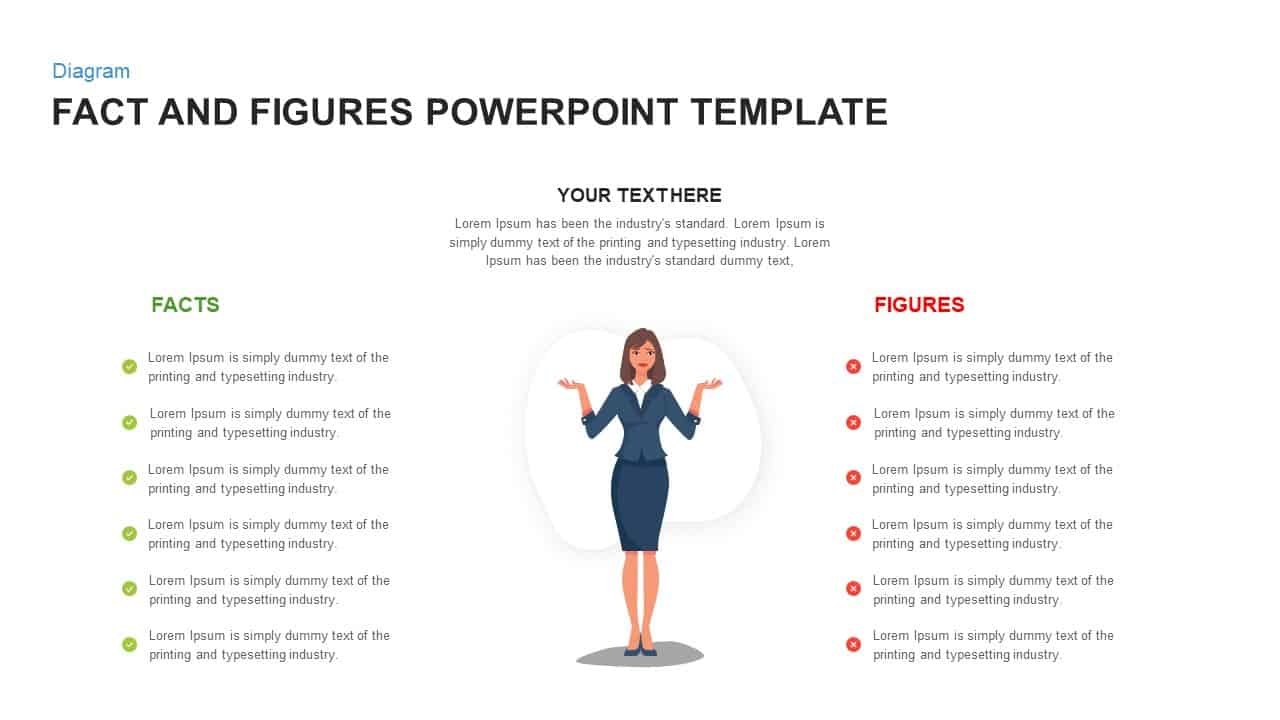
Facts and Figures PowerPoint Template
Business Models
Premium
-

Non Profit Organization PowerPoint Template
PowerPoint Templates
Premium
-
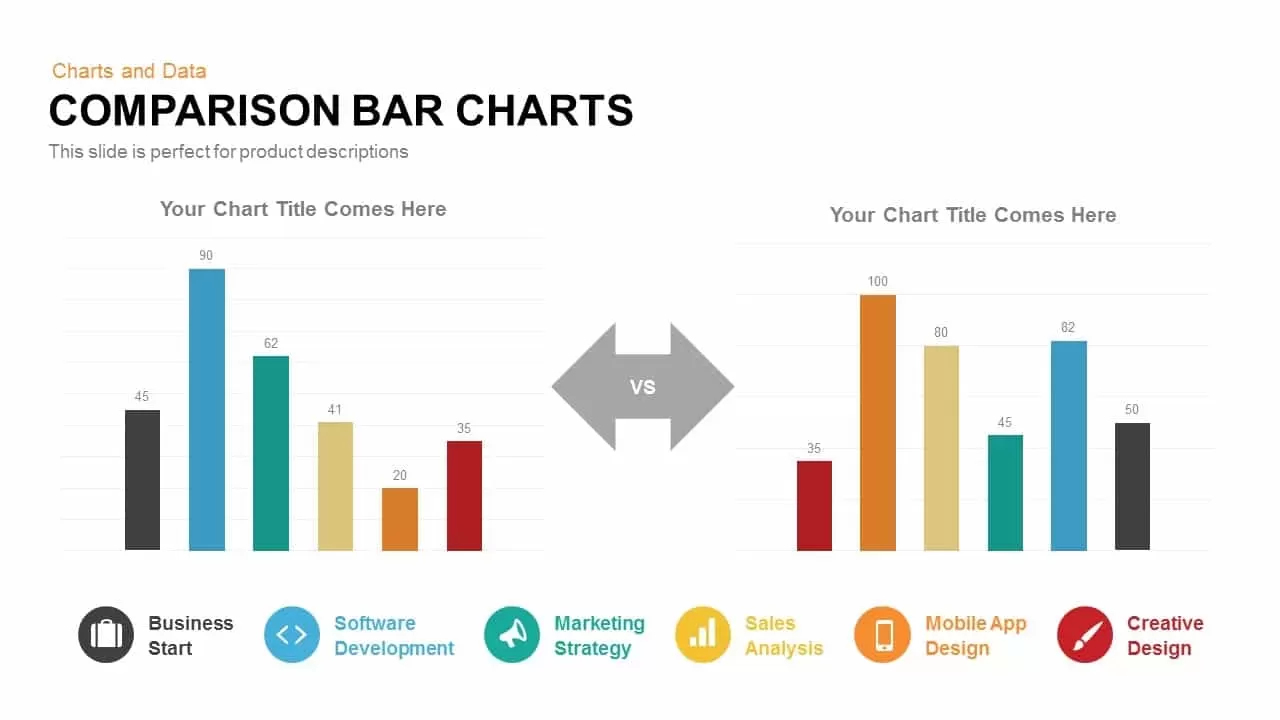
Comparison Bar Charts PowerPoint Template and Keynote Slide
Column and Bar chart
Premium
-
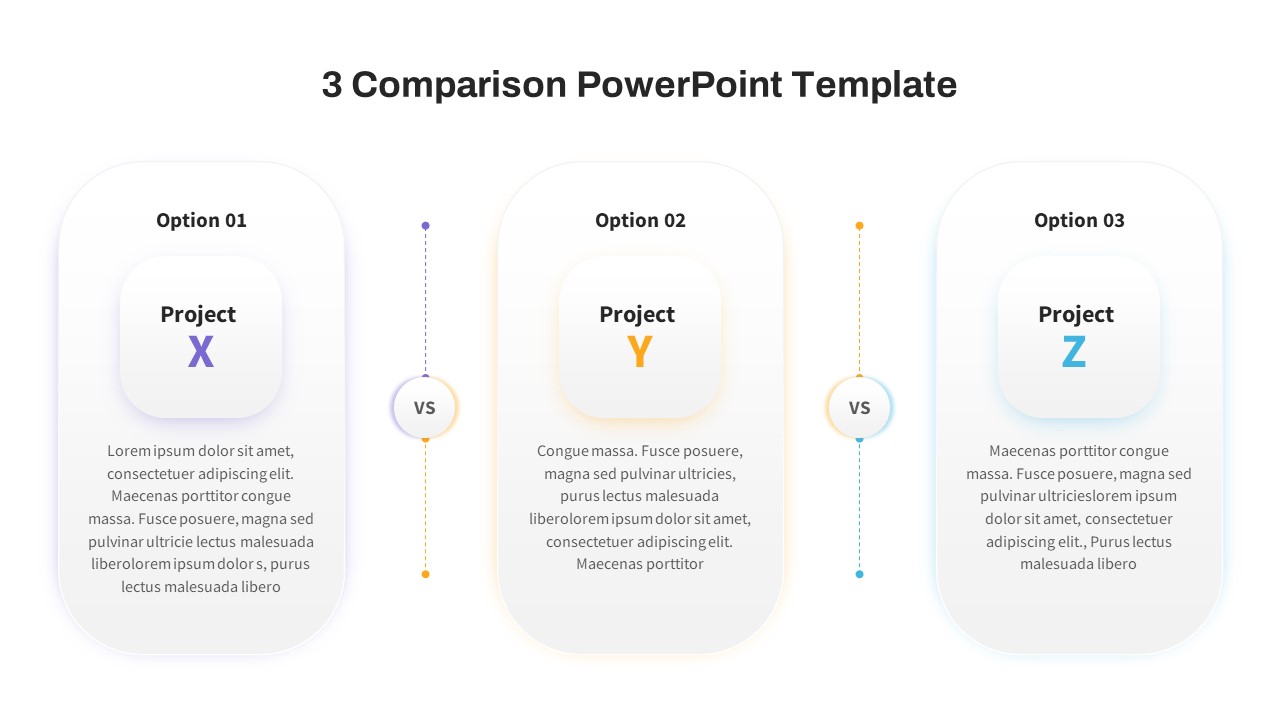
3 Comparison PowerPoint Template Free
PowerPoint Templates
Free
-
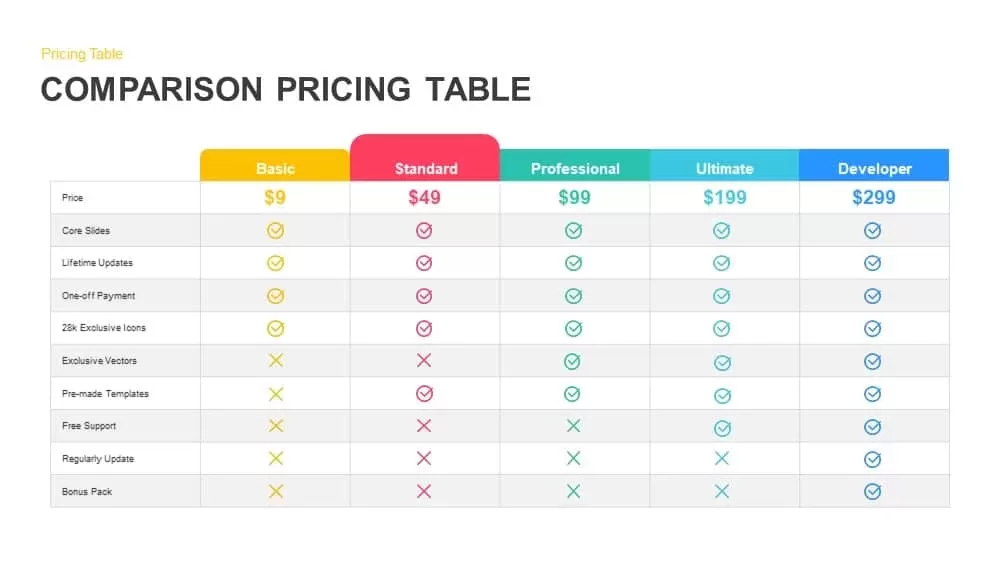
Comparison Pricing Table Template for PowerPoint and Keynote
Infographic
Premium
-
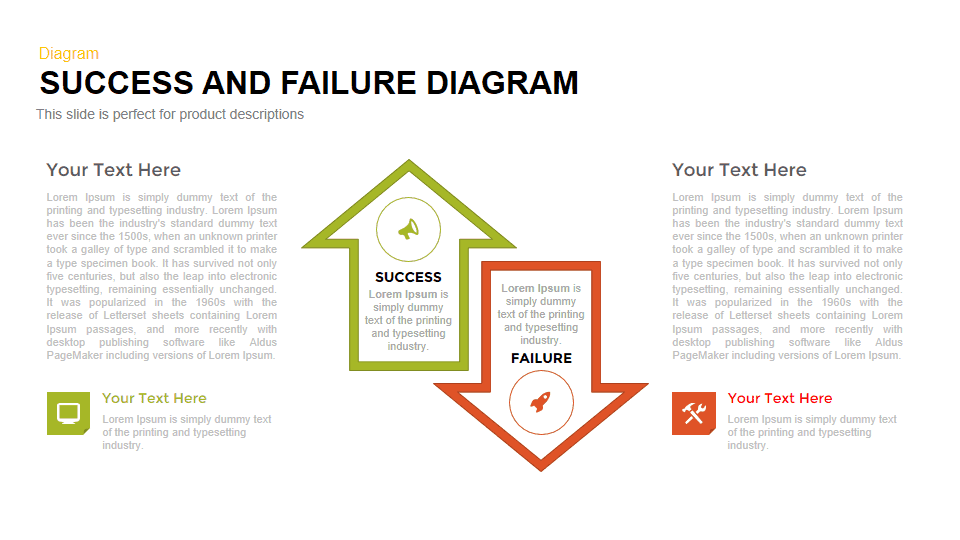
Success and Failure PowerPoint Template
Business Models
Premium
-
Comparison Slides
PowerPoint Charts
Premium
-
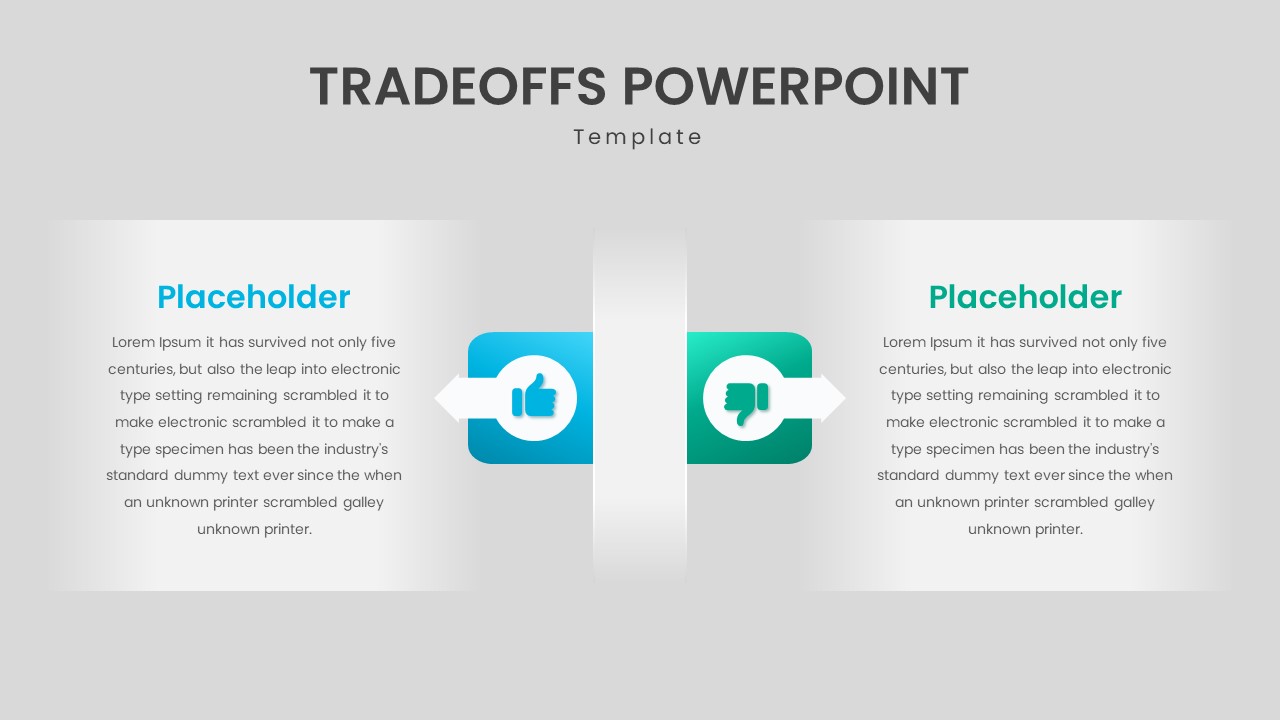
Tradeoffs PowerPoint Template
PowerPoint Templates
Premium
-
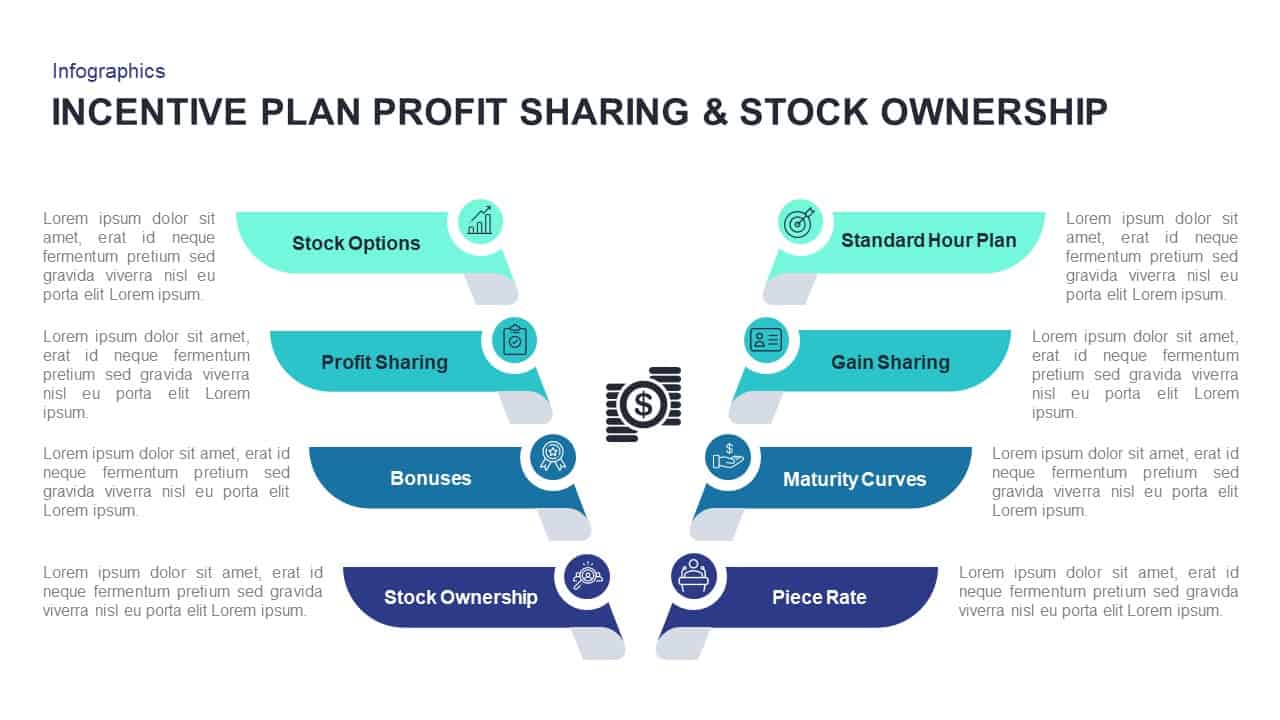
Incentive Plans Profit Sharing Stock Ownership Presentation Template
Business Models
Premium
-
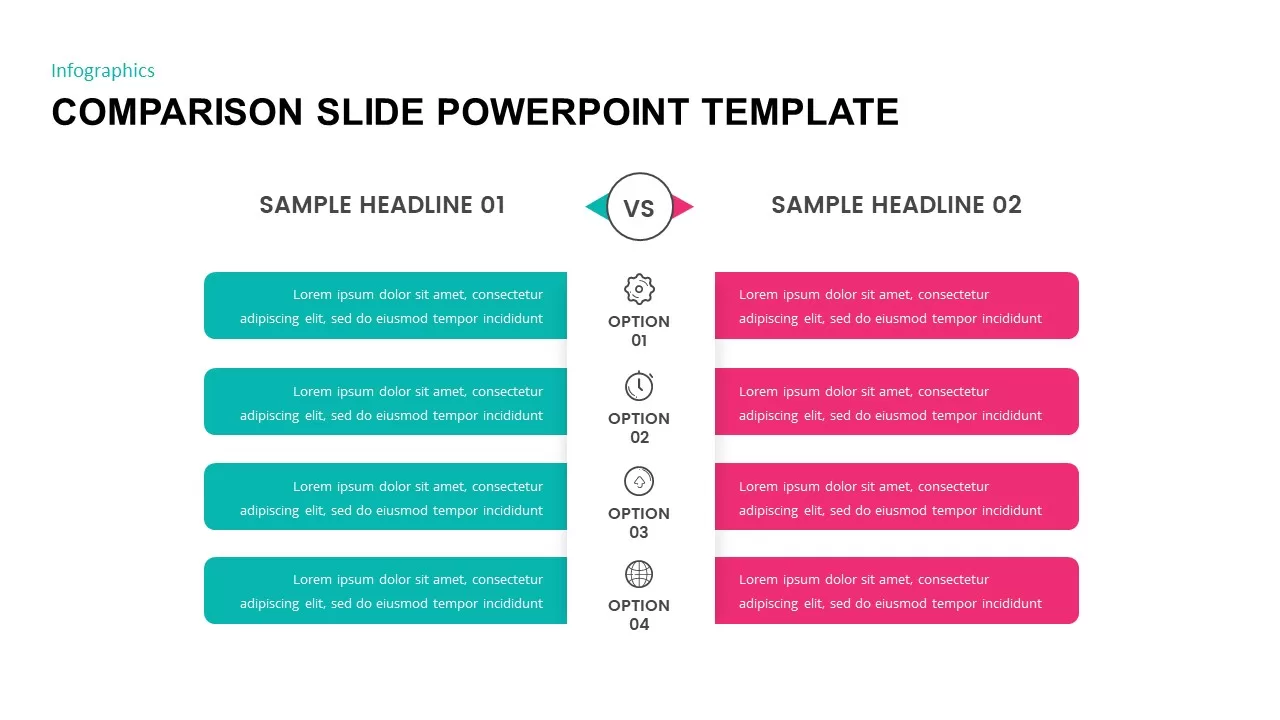
Comparison Slide Template for PowerPoint & Keynote
Column and Bar chart
Premium
-
Column Comparison Table PowerPoint Template & Keynote Slide
Keynote Templates
Premium
-
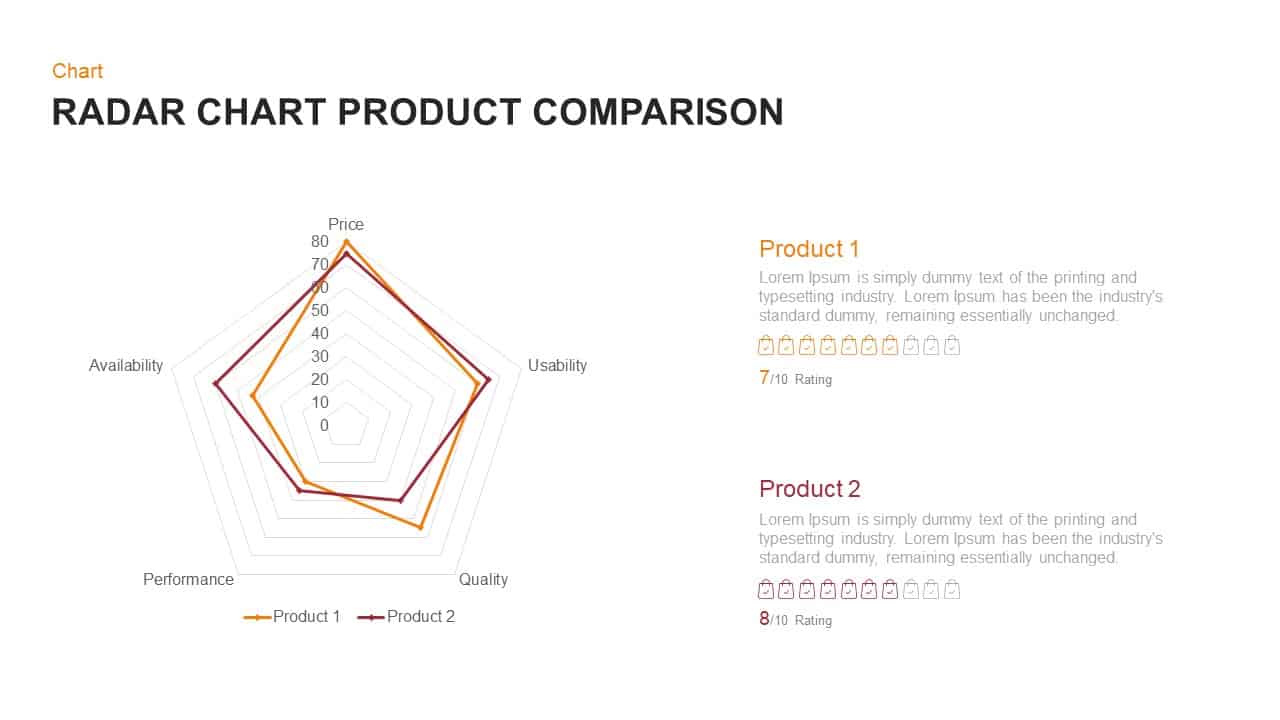
Radar Chart Product Comparison PowerPoint Template
Business Models
Premium
-
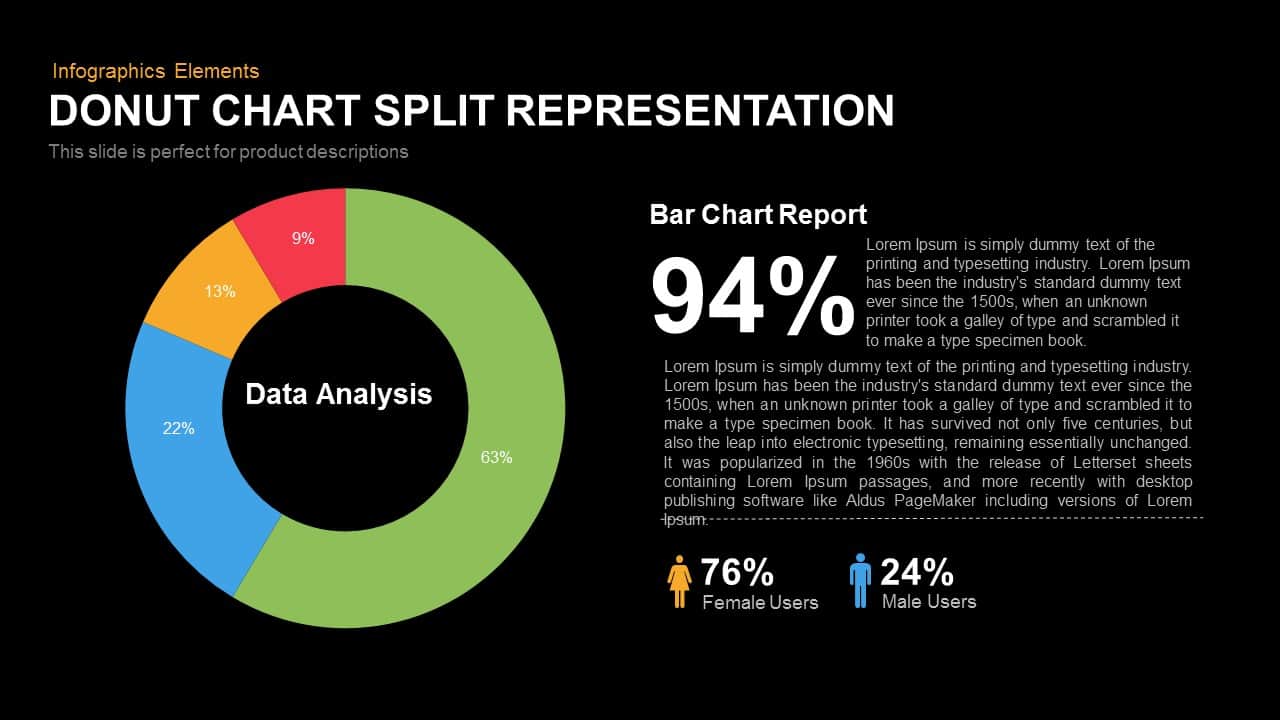
Split Representation Donut Chart Template for PowerPoint and Keynote
Keynote Templates
Premium
-
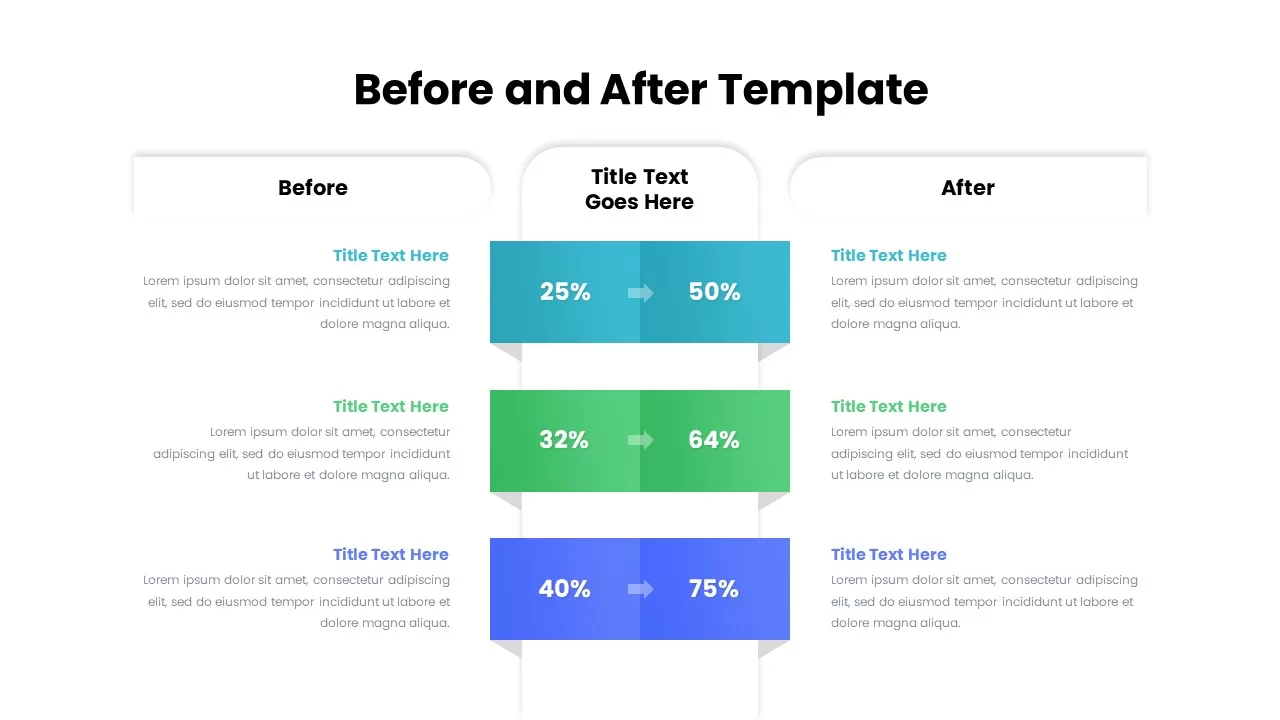
Before and After Slides
PowerPoint Charts
Premium
-
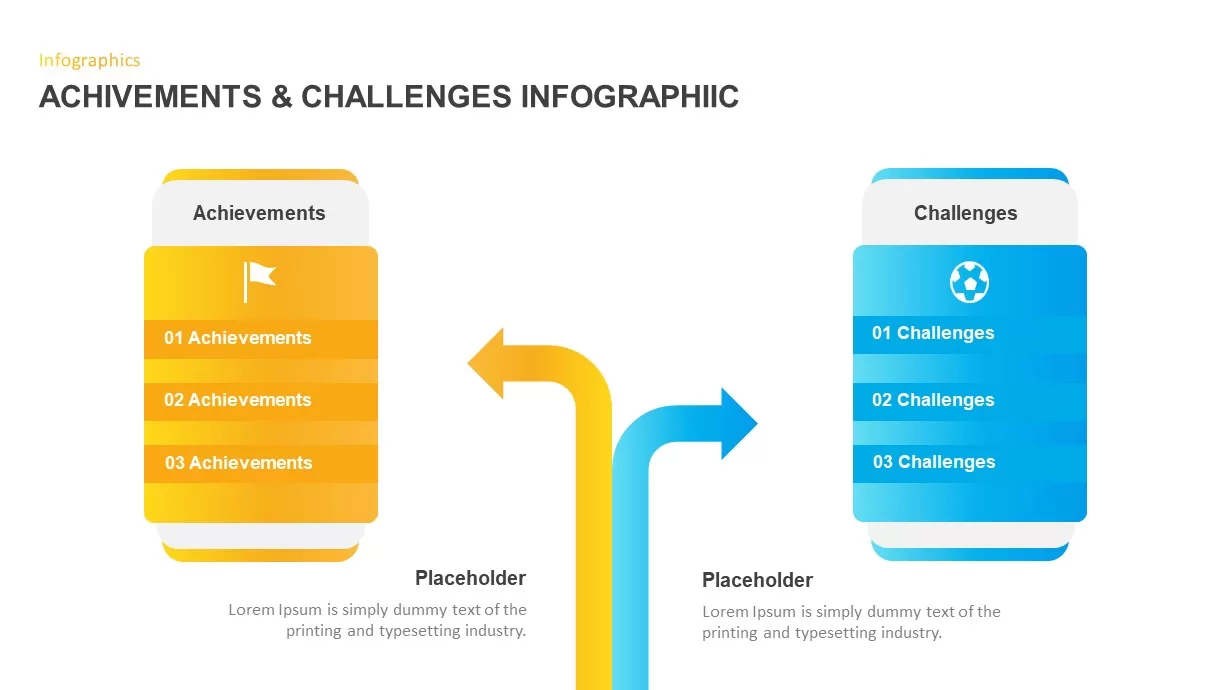
Achievements and Challenges PowerPoint Template
Business Models
Premium
-
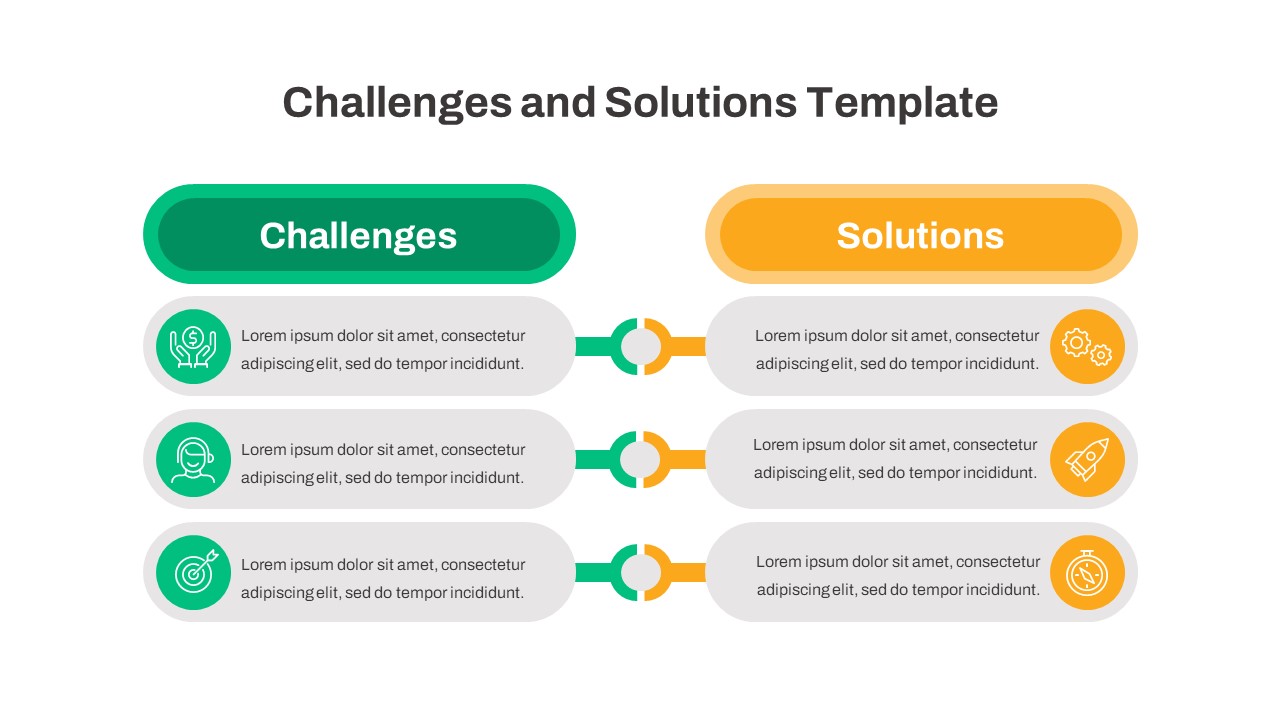
Free Challenges and Solutions PowerPoint Template
Free PowerPoint Templates
Free
-
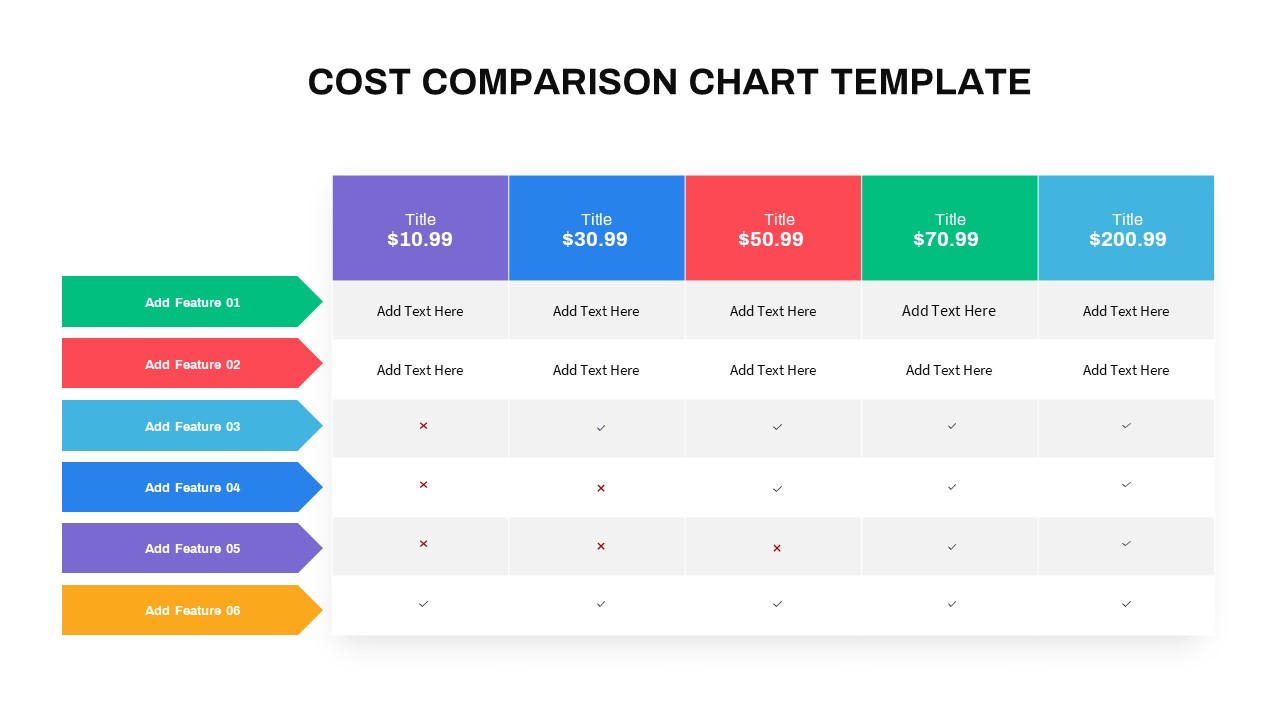
Cost Comparison PowerPoint Template
PowerPoint Templates
Premium
-
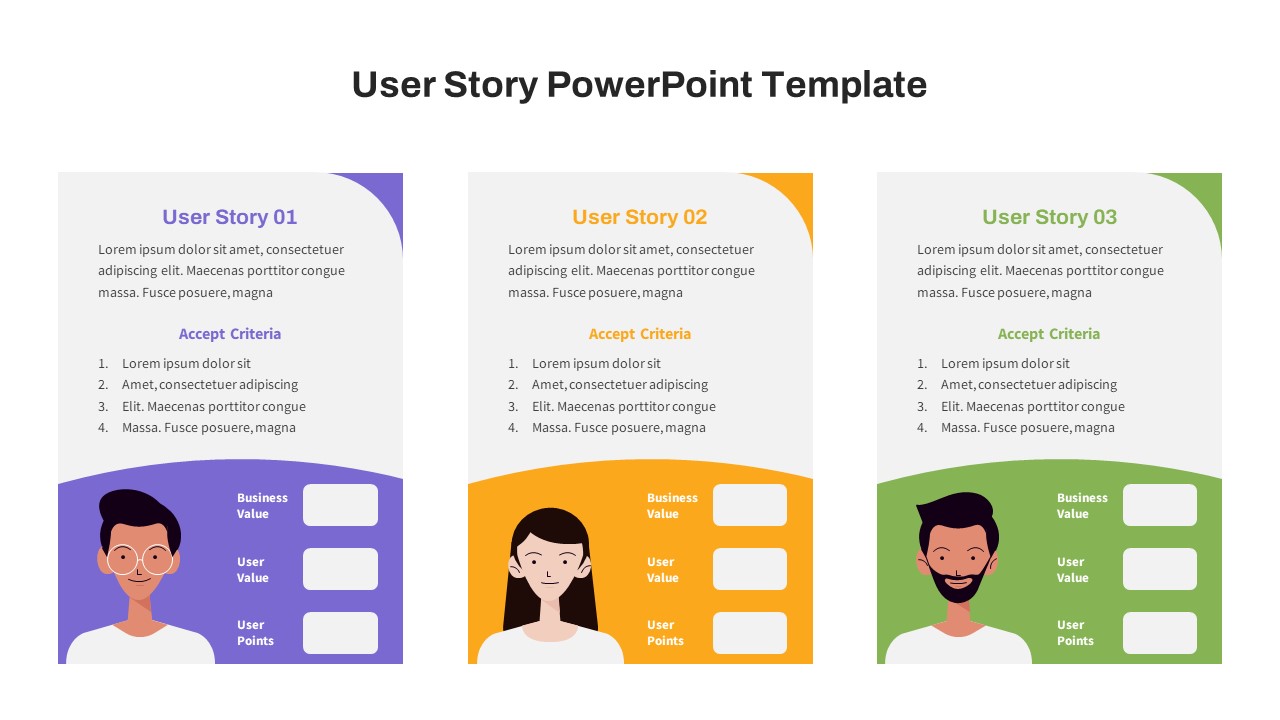
User Story PowerPoint Template Free
Infographic
Free
-

Combination Chart PowerPoint Template
PowerPoint Charts
Premium
-
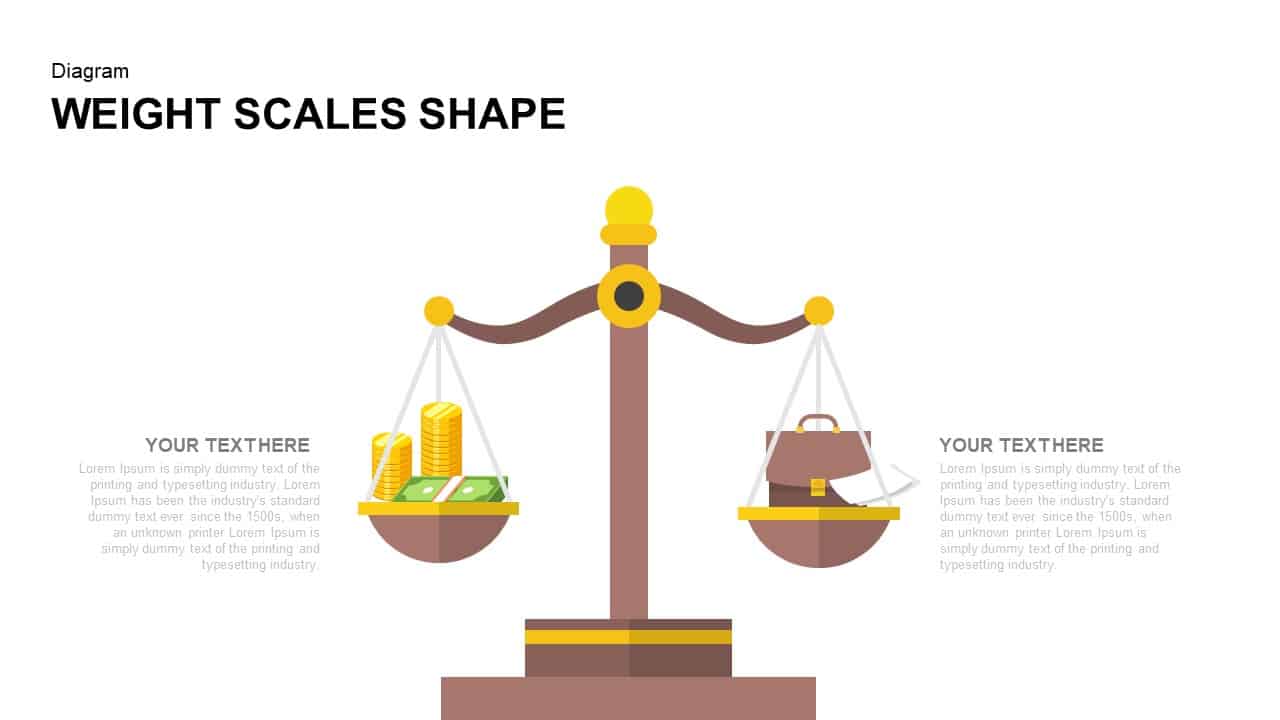
Weight Scales Shapes for PowerPoint and Keynote Template
Shapes
Premium
-
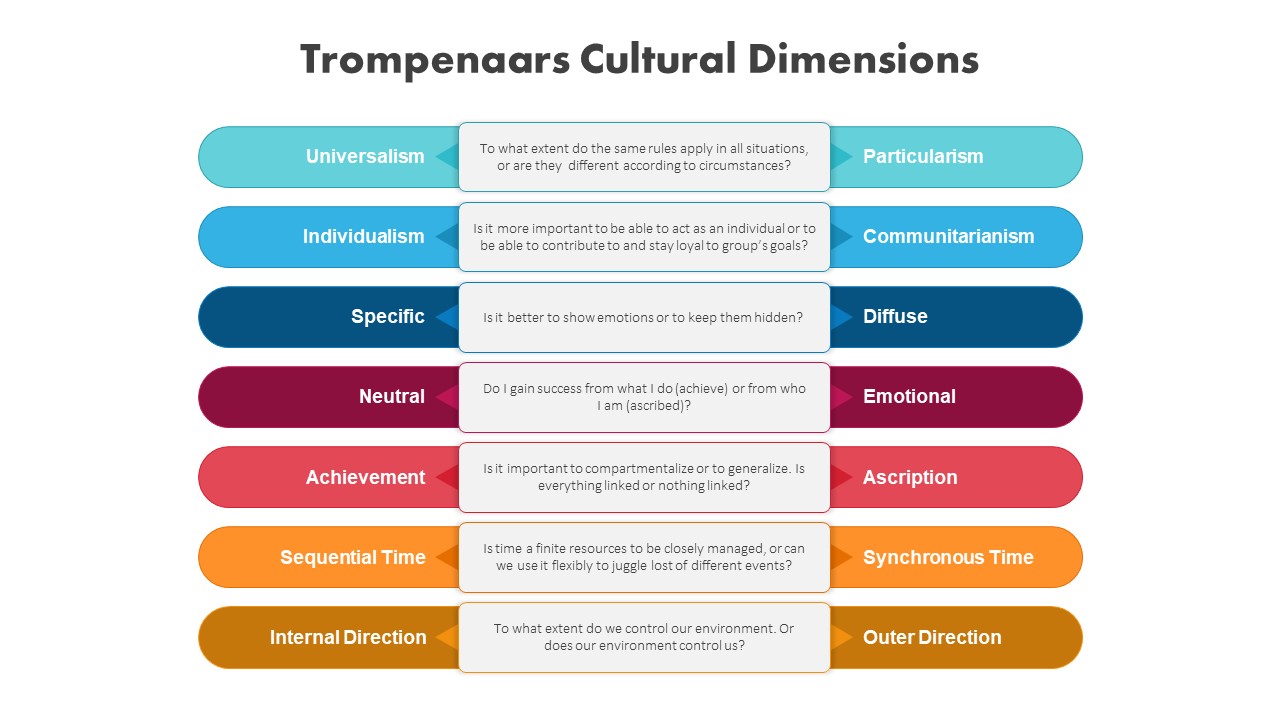
Trompenaars Cultural Dimensions Template
PowerPoint Templates
Premium
-
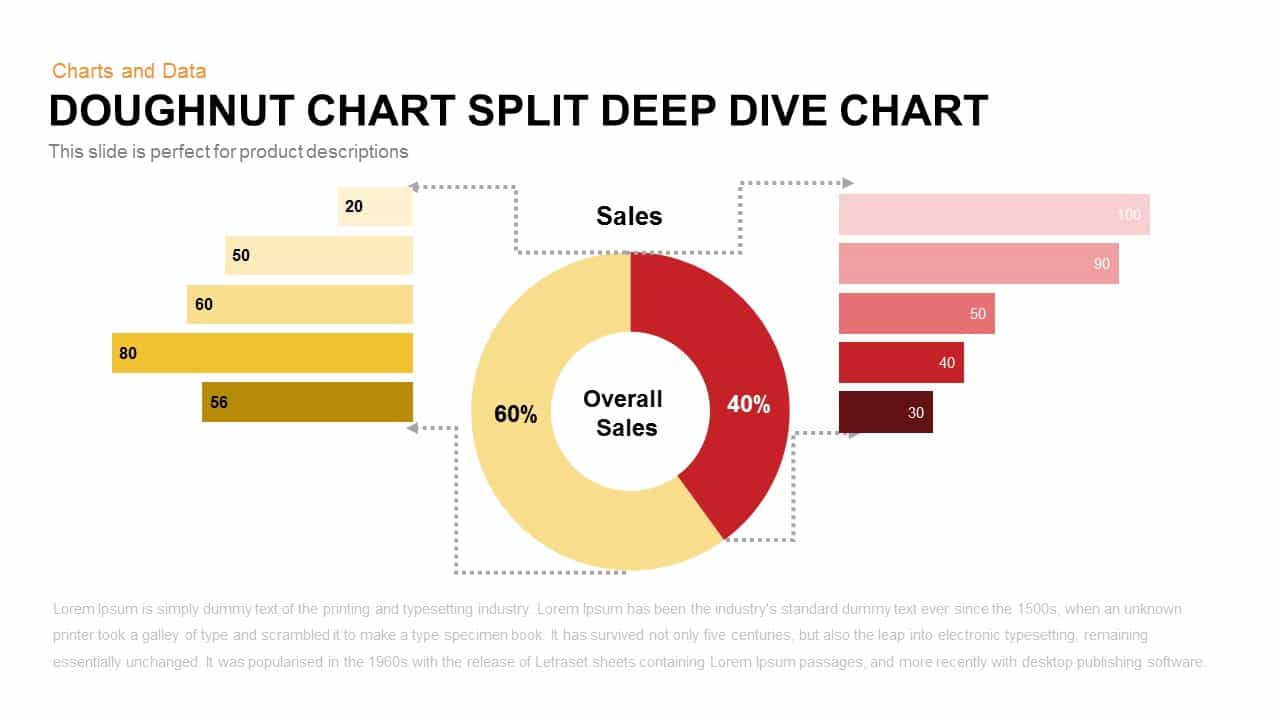
Donut Chart Split Deep Dive Chart Template For PowerPoint and Keynote
Keynote Templates
Premium
-
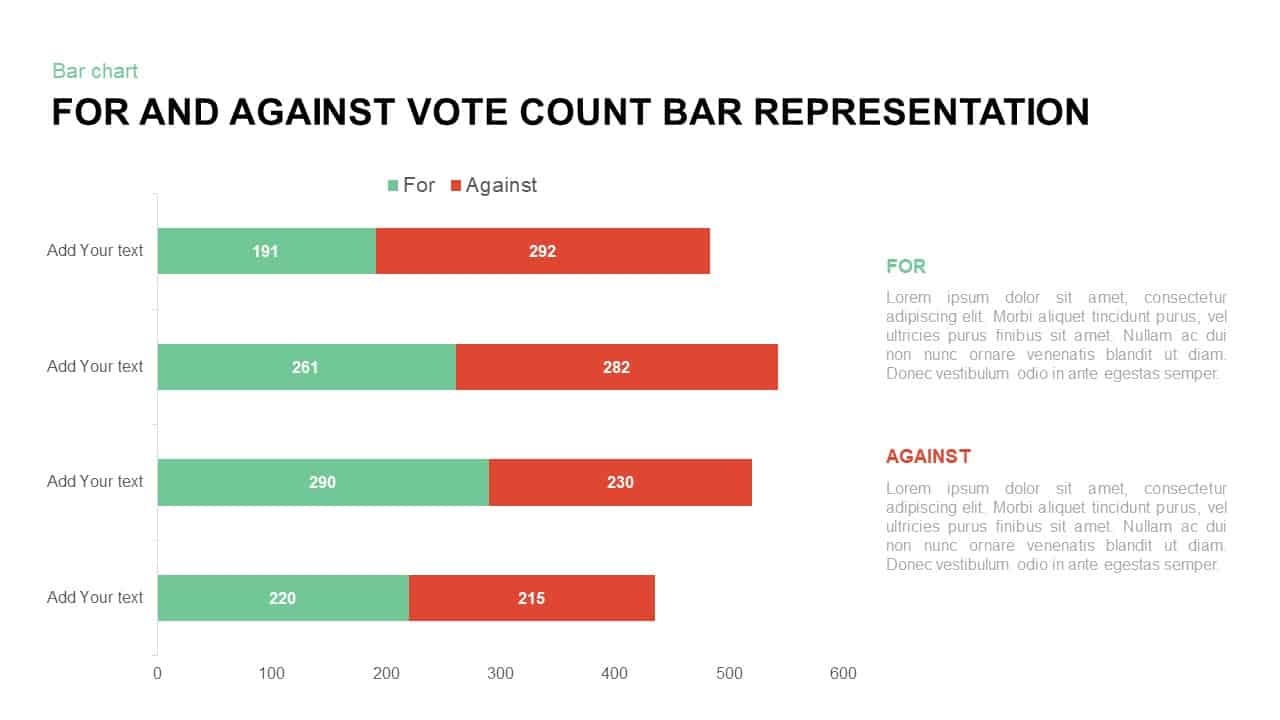
For and Against Vote Count Bar Chart for PowerPoint Presentation
Column and Bar chart
Premium
-
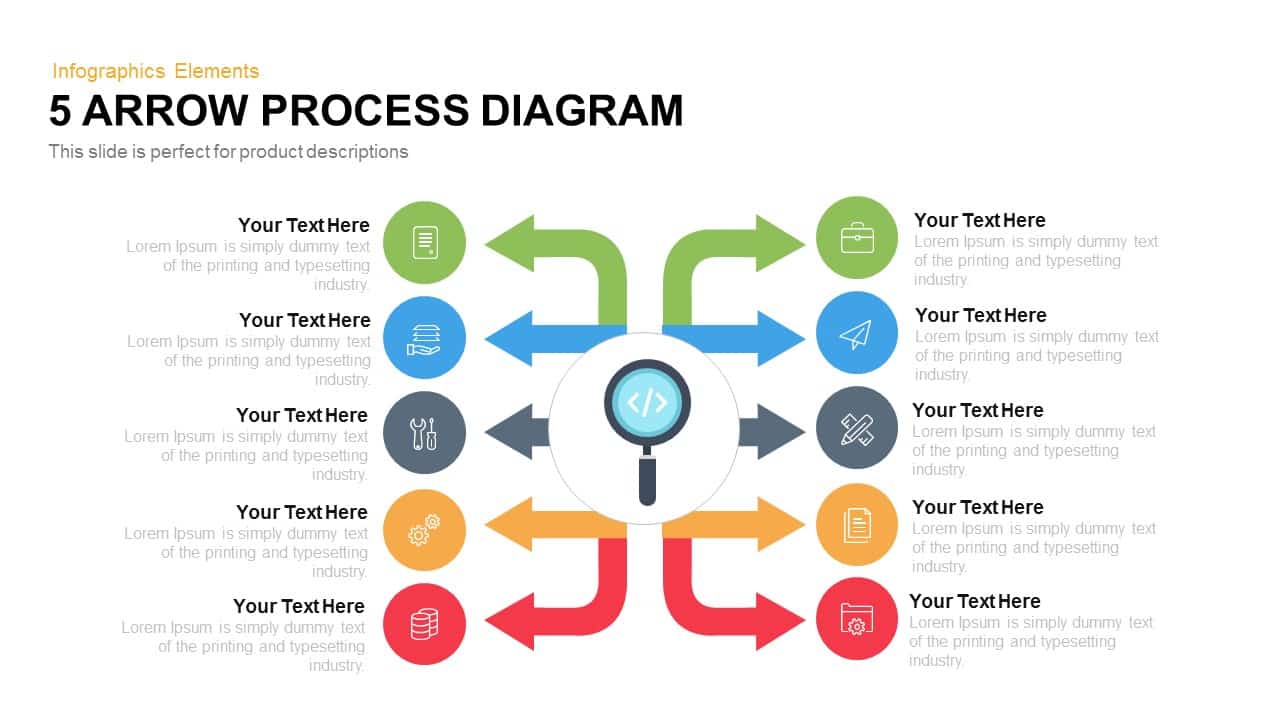
Arrow Process Diagram Template for PowerPoint and Keynote
Arrow Diagrams
Premium
-
Free Product Comparison PowerPoint Template
Business Models
Free
-

Pencil Bar Chart PowerPoint Template and Keynote Slide
Column and Bar chart
Premium
-
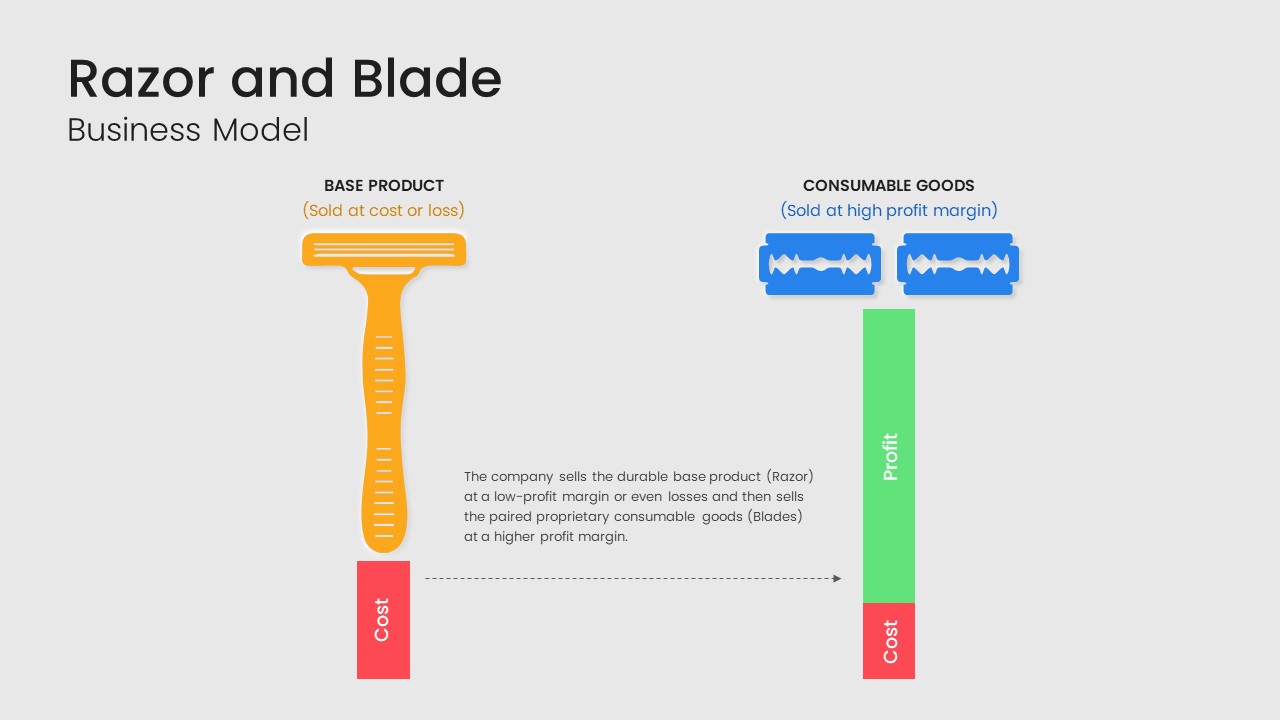
Razor Blade Business Model PowerPoint Template
Business Models
Premium
-
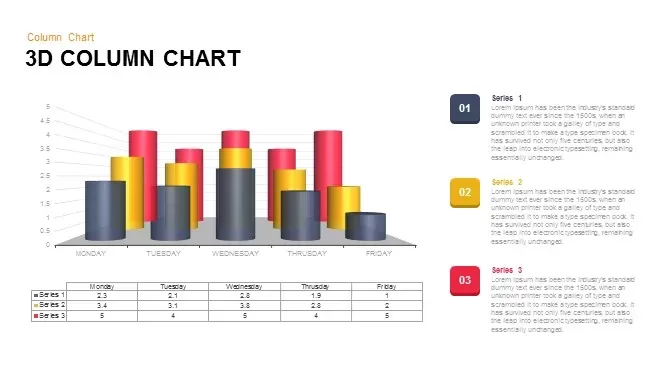
3D Column Chart for PowerPoint and Keynote Presentation
PowerPoint Charts
Premium
-
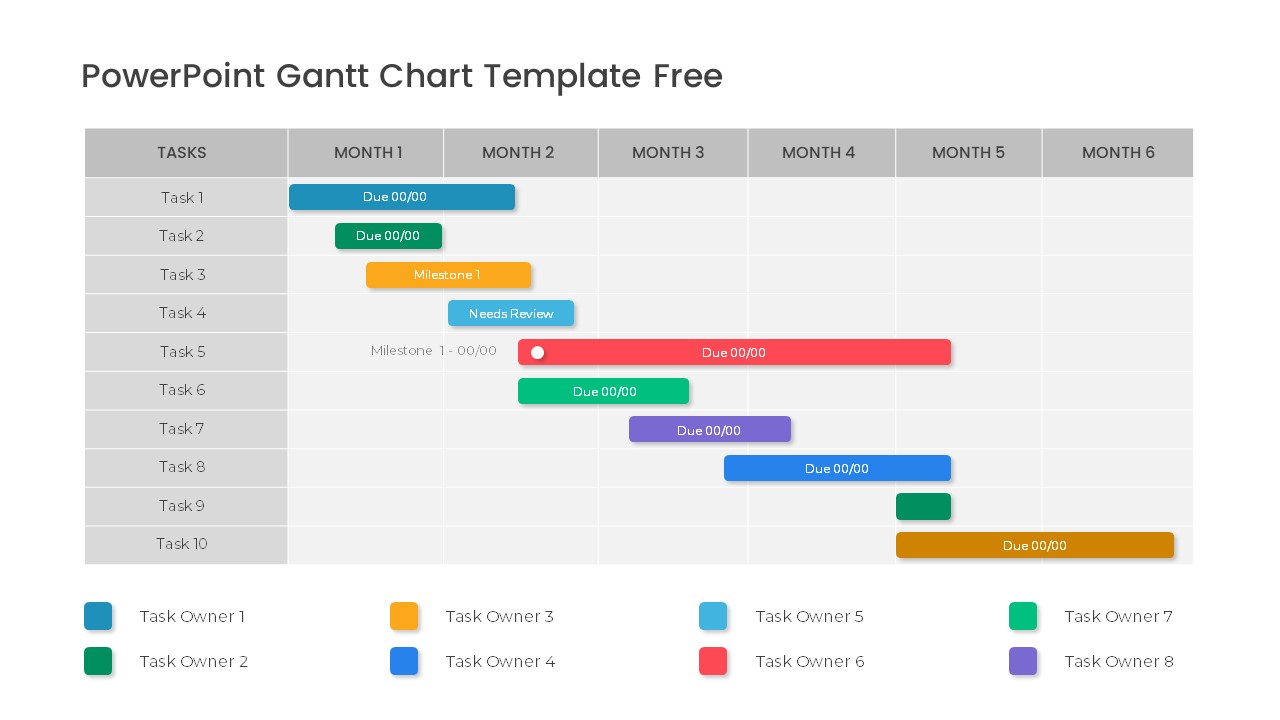
Free PowerPoint Gantt Chart Template
PowerPoint Charts
Free
-
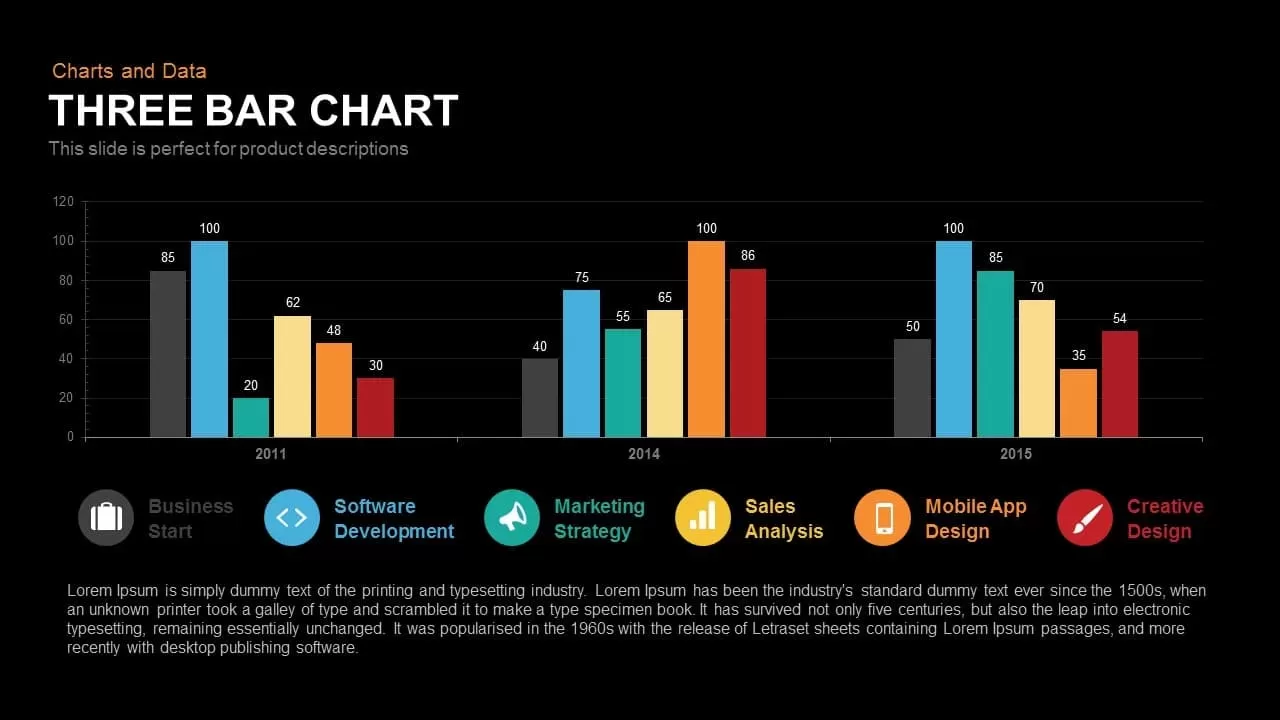
3 Bar Chart PowerPoint Template and Keynote Slide
Column and Bar chart
Premium
-
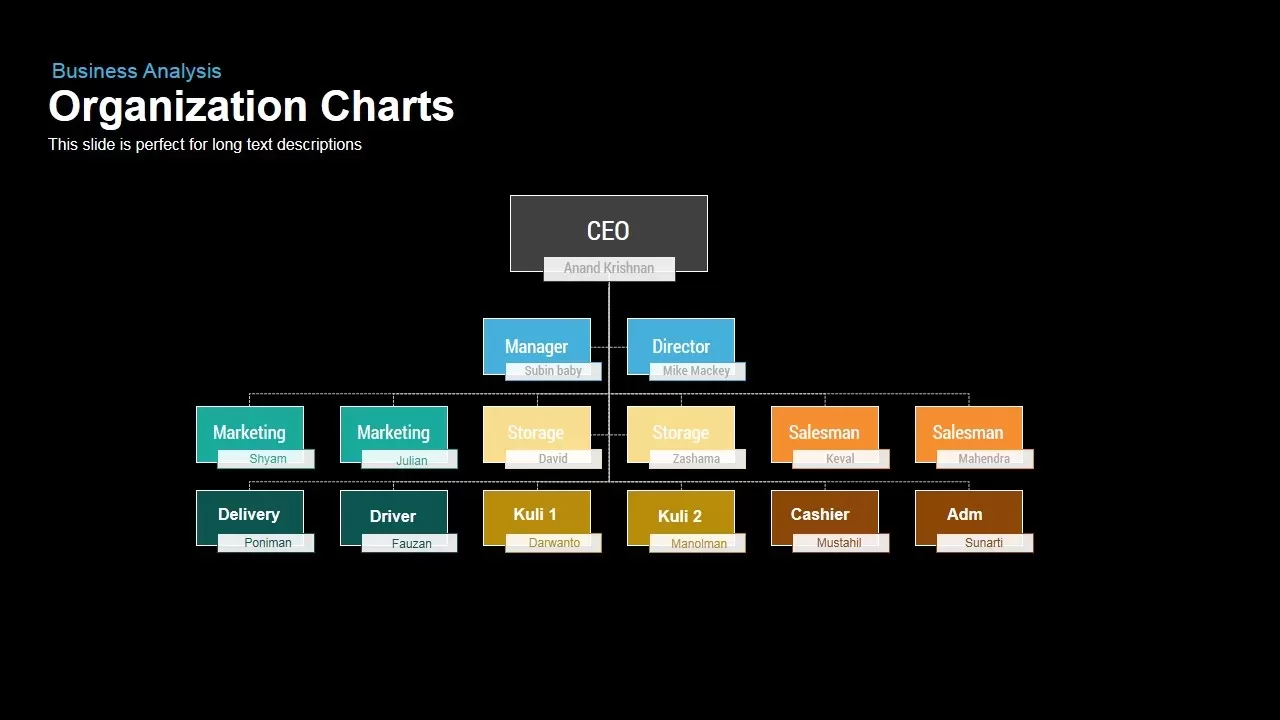
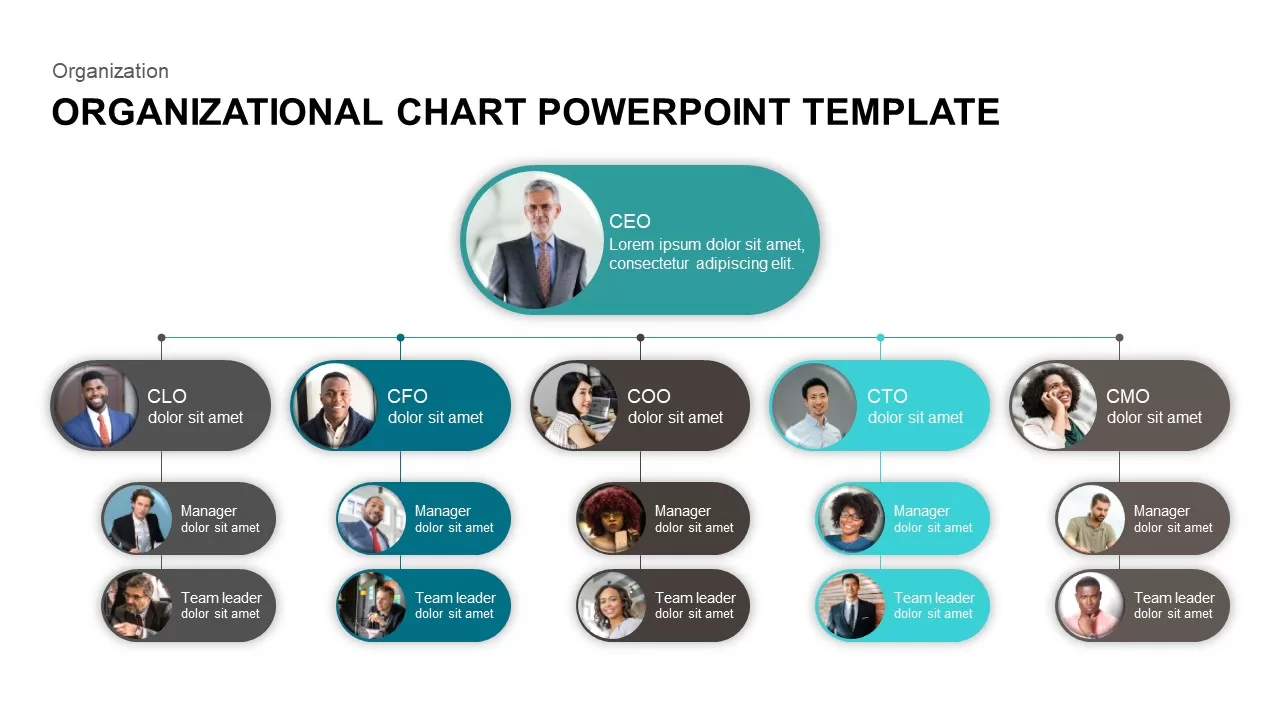
Organization Chart PowerPoint Template and Keynote slide
Org Charts
Premium
-
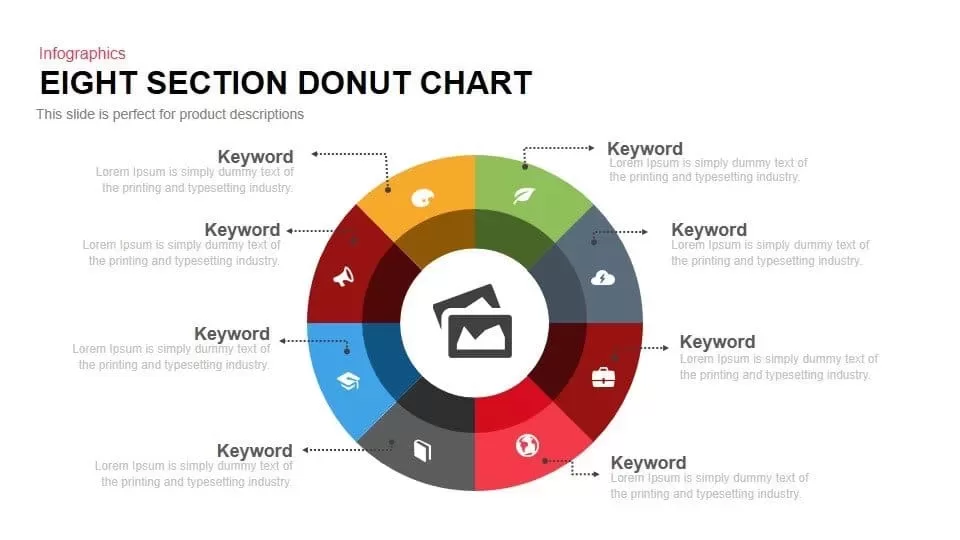
8 Section Donut Chart PowerPoint Template and Keynote Slide
Circular Diagrams
Premium
-
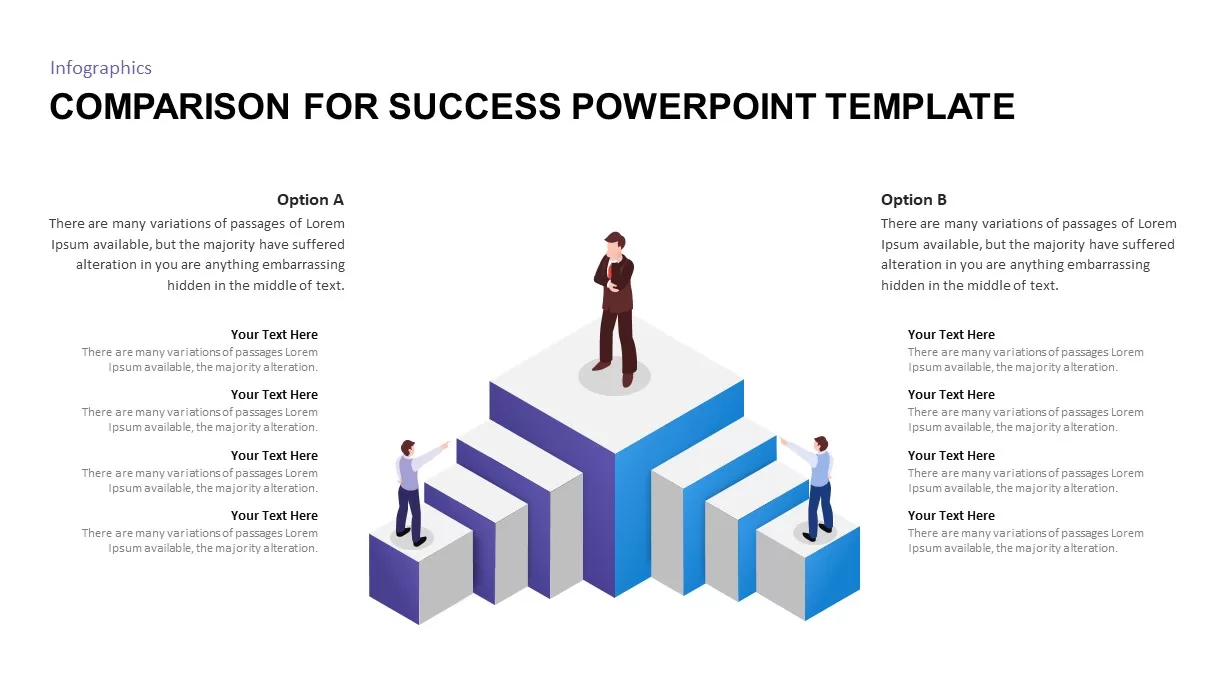
Comparison for Success PowerPoint Template
Business Models
Premium
-
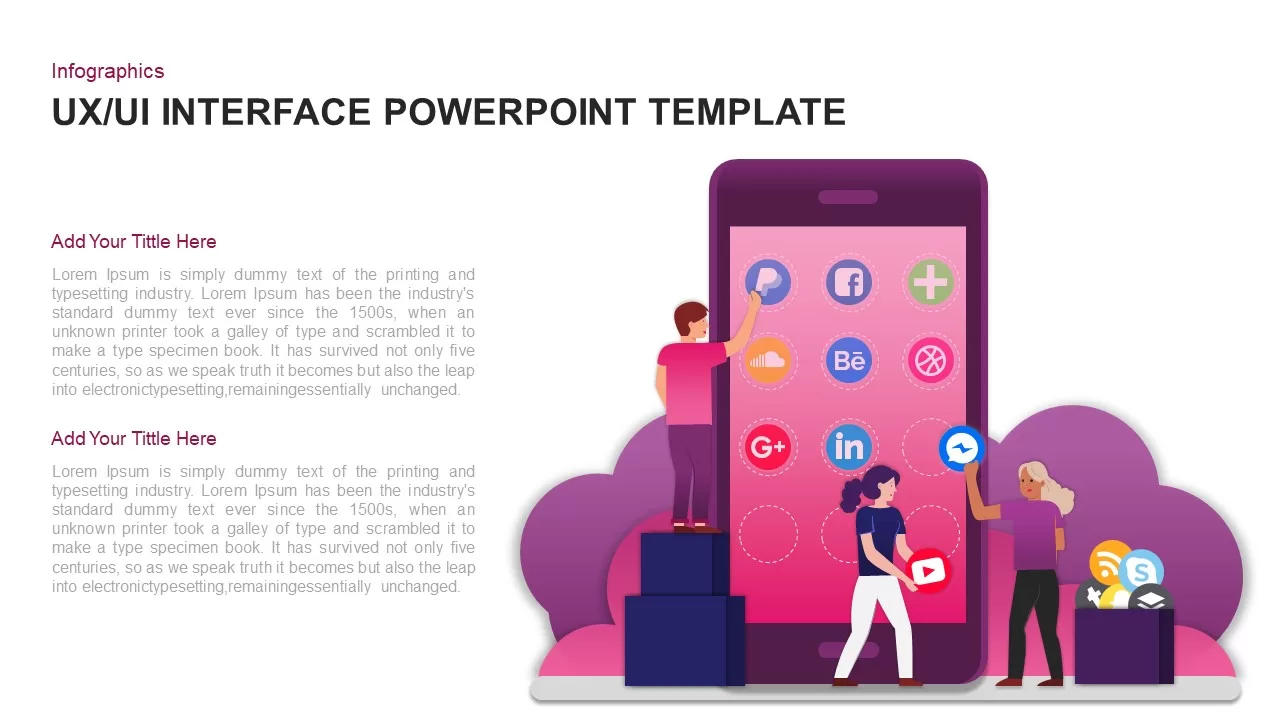
UI/UX Design Template for PowerPoint and Keynote
Infographic
Premium
-
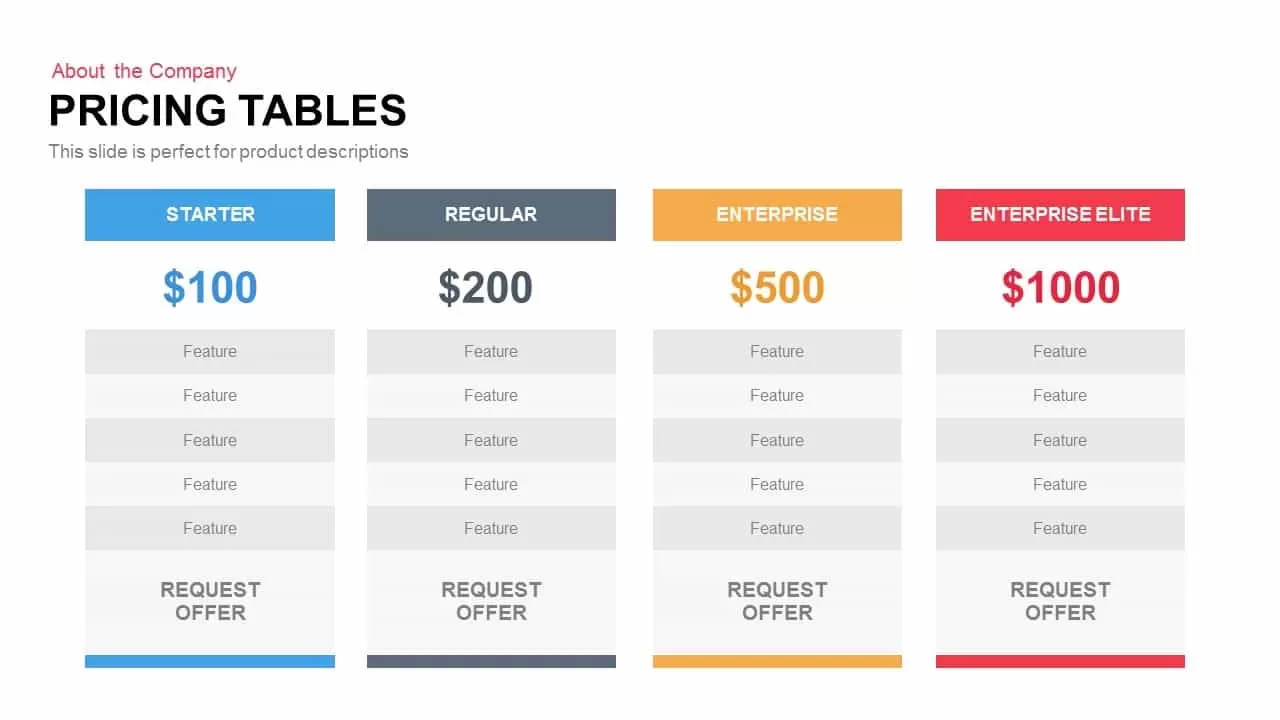
Pricing Table PowerPoint Template and Keynote Slide
Business Models
Premium
-
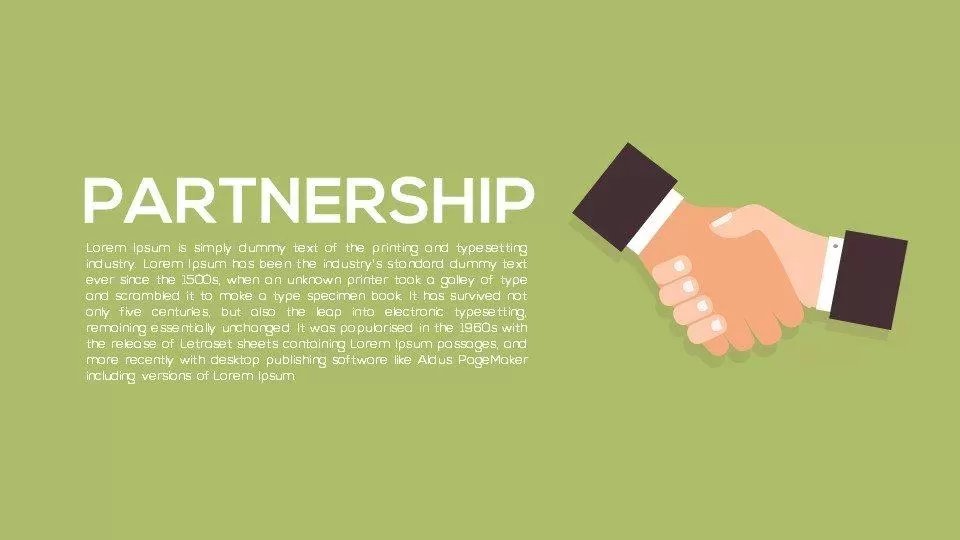
Metaphor Partnership PowerPoint Template and Keynote Template
Keynote Templates
Premium
-
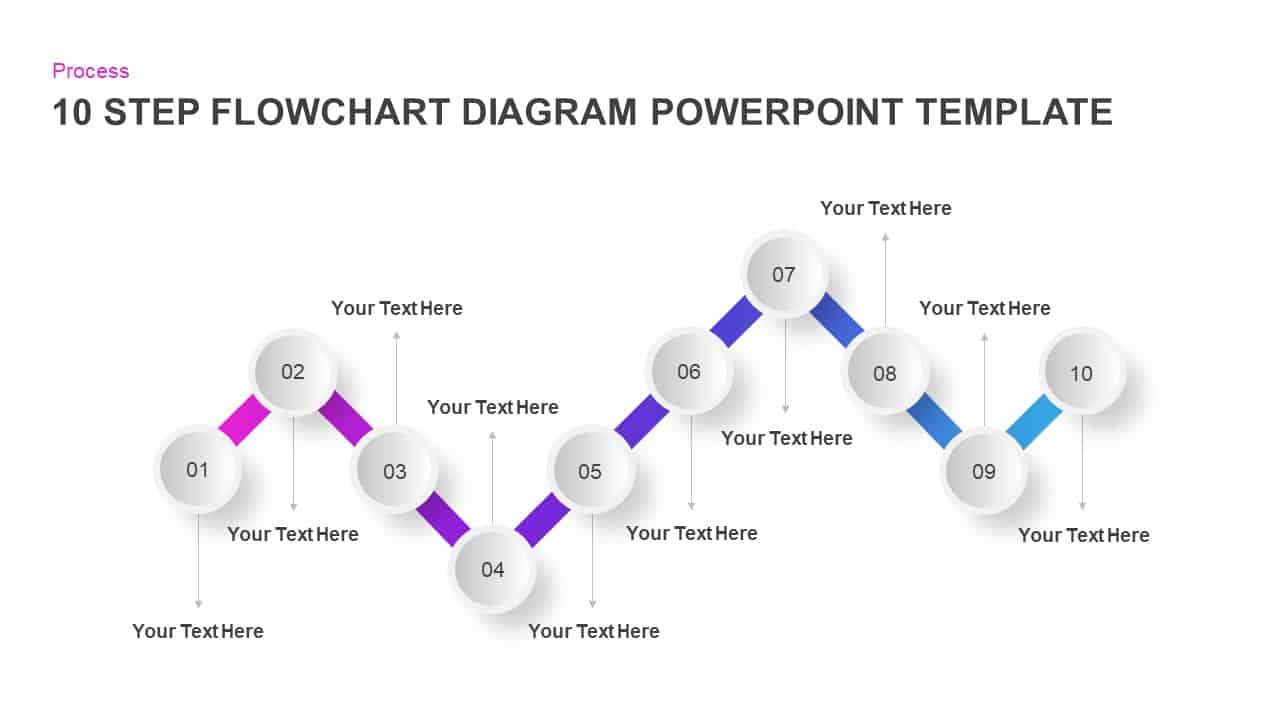
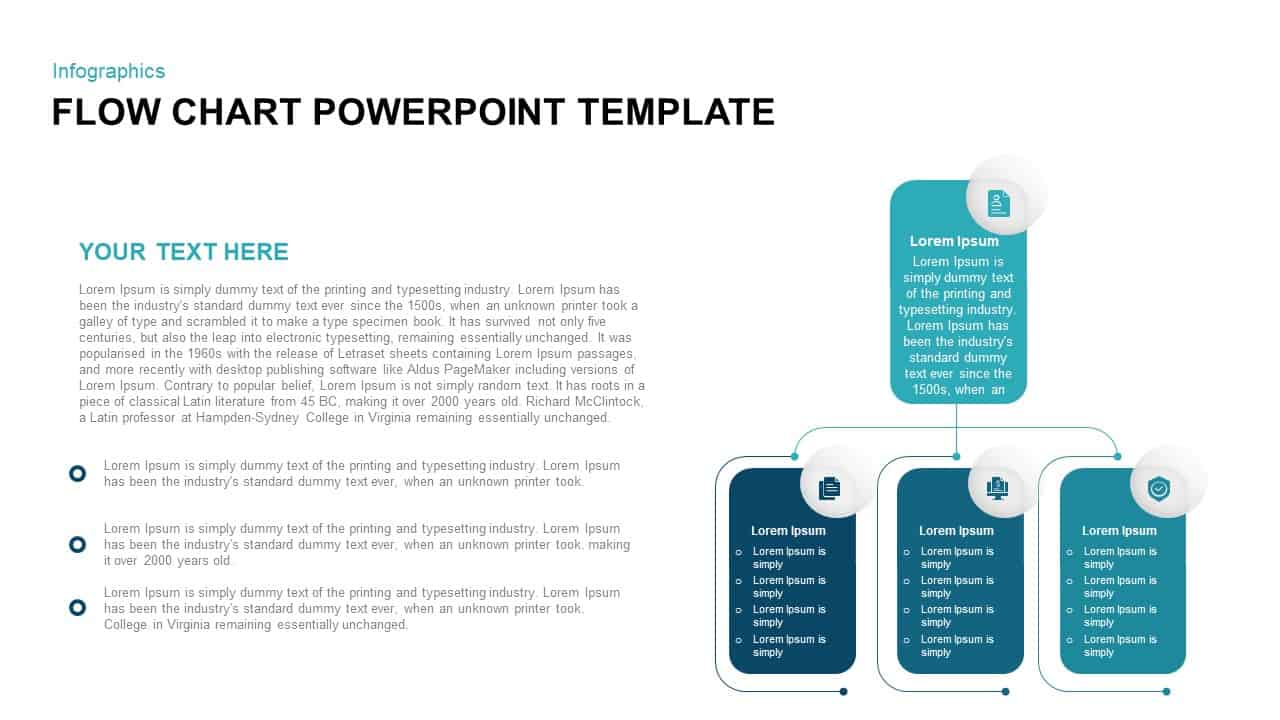
10 Step Flow Chart Diagram Template for PowerPoint and Keynote
Flow Charts
Premium
-
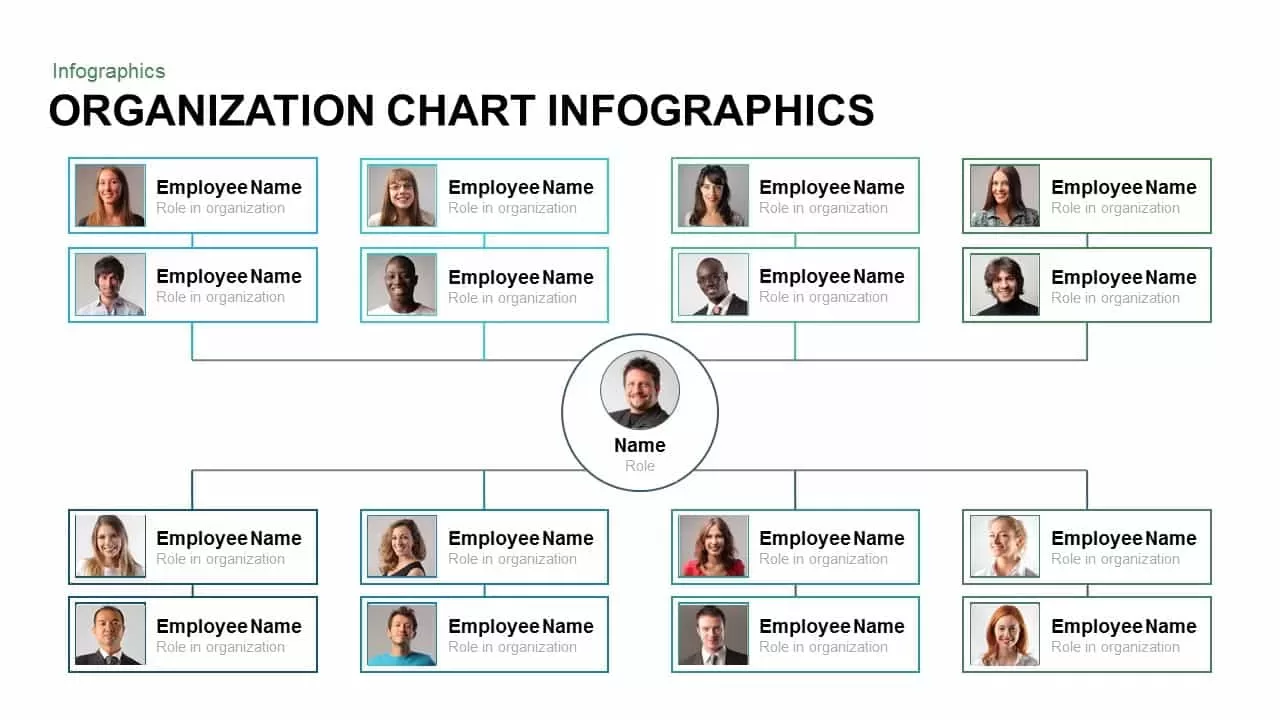
Infographic Organization Chart Template for PowerPoint and Keynote
Org Charts
Premium
-
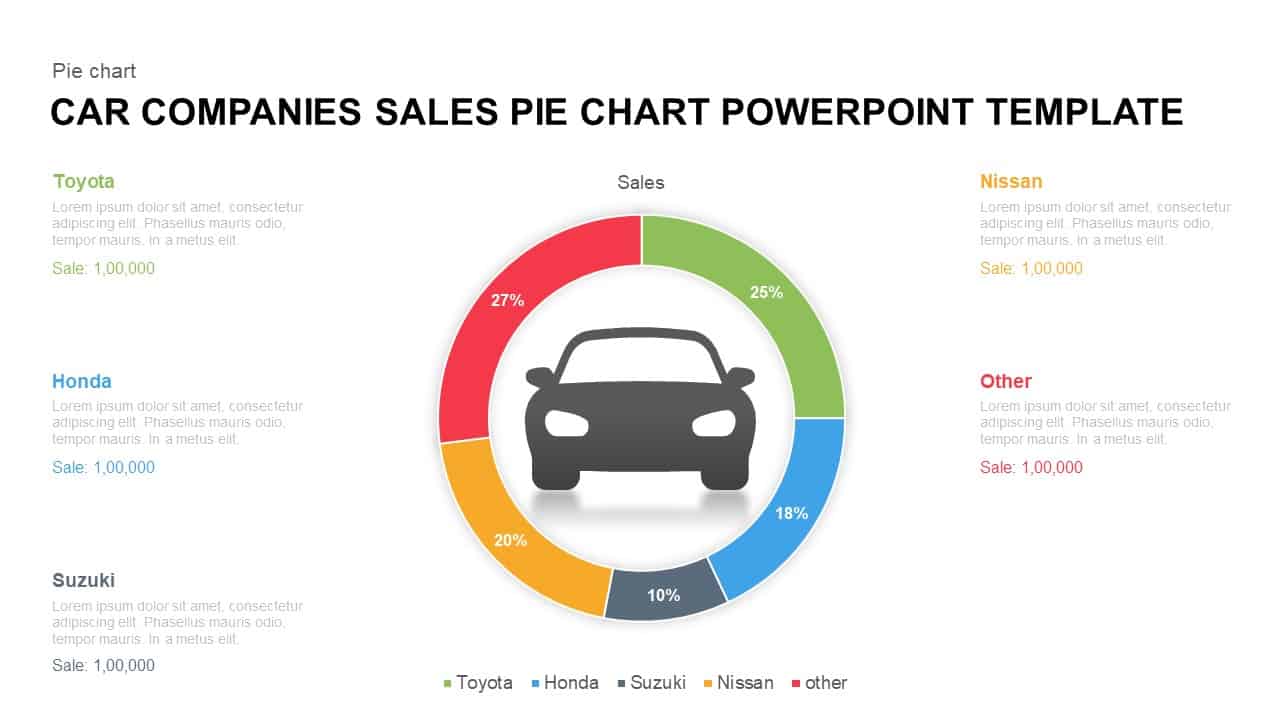
Car Companies Sales Pie Chart Template for PowerPoint & Keynote
Column and Bar chart
Premium
-
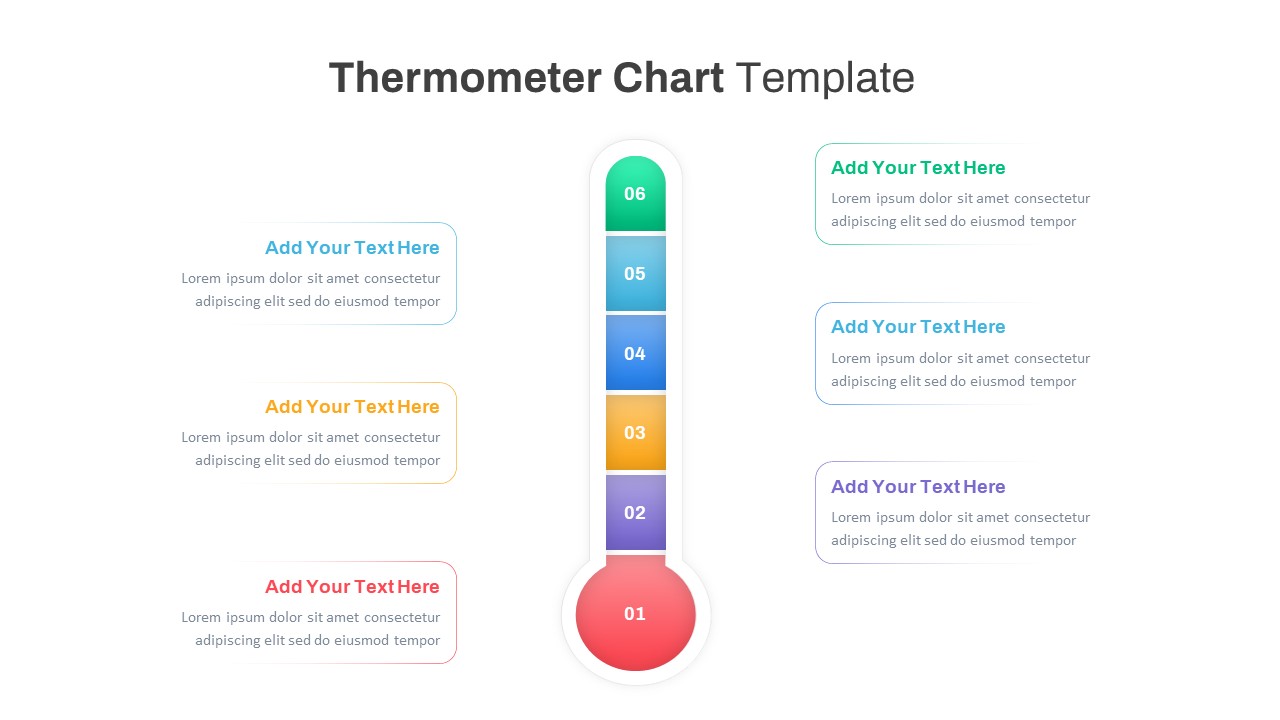
PowerPoint Thermometer Chart Template
PowerPoint Templates
Premium
-
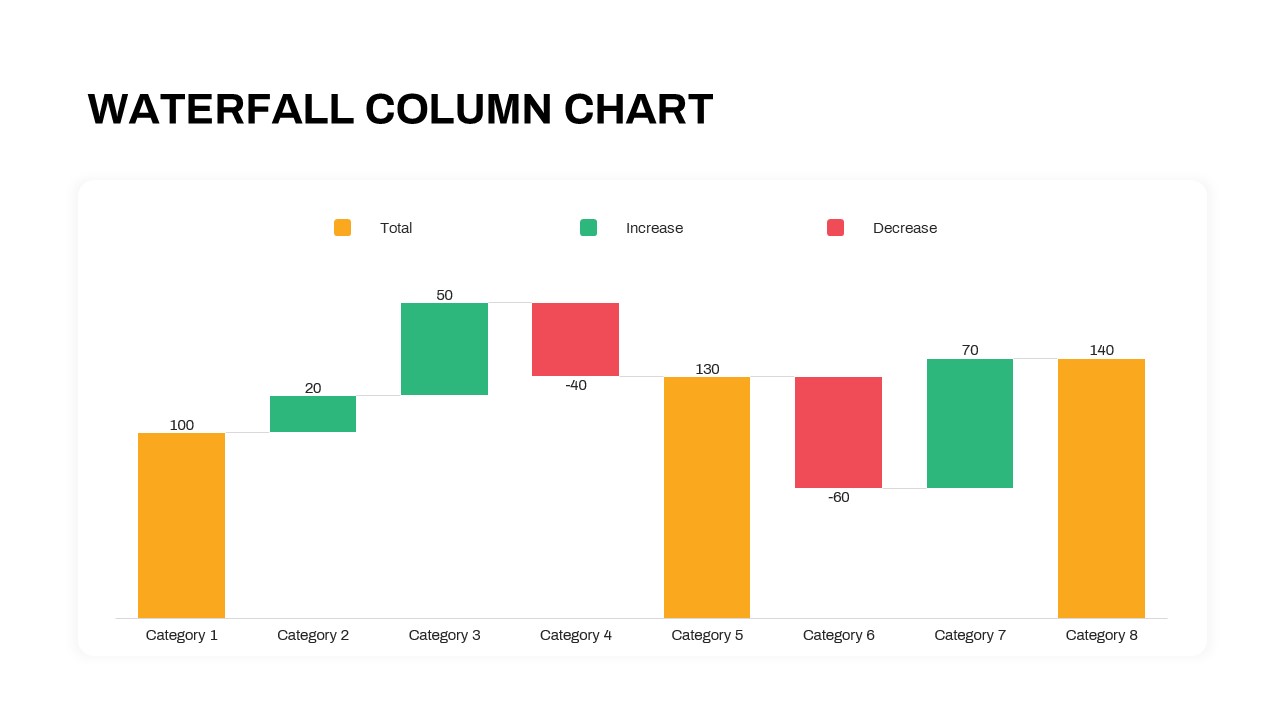
Waterfall Column Chart PowerPoint Template
Column and Bar chart
Premium
-
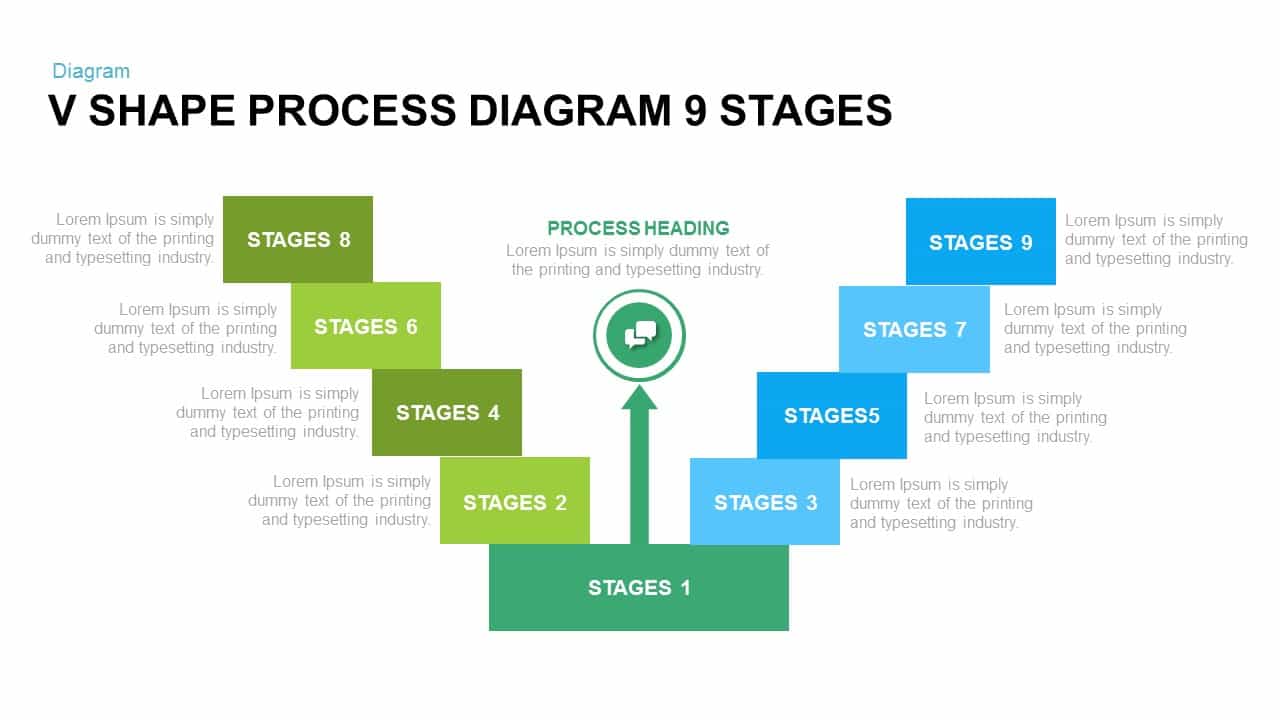
9 Stages V Shape Process Diagram PowerPoint Template and Keynote Slide
Diagrams
Premium
-
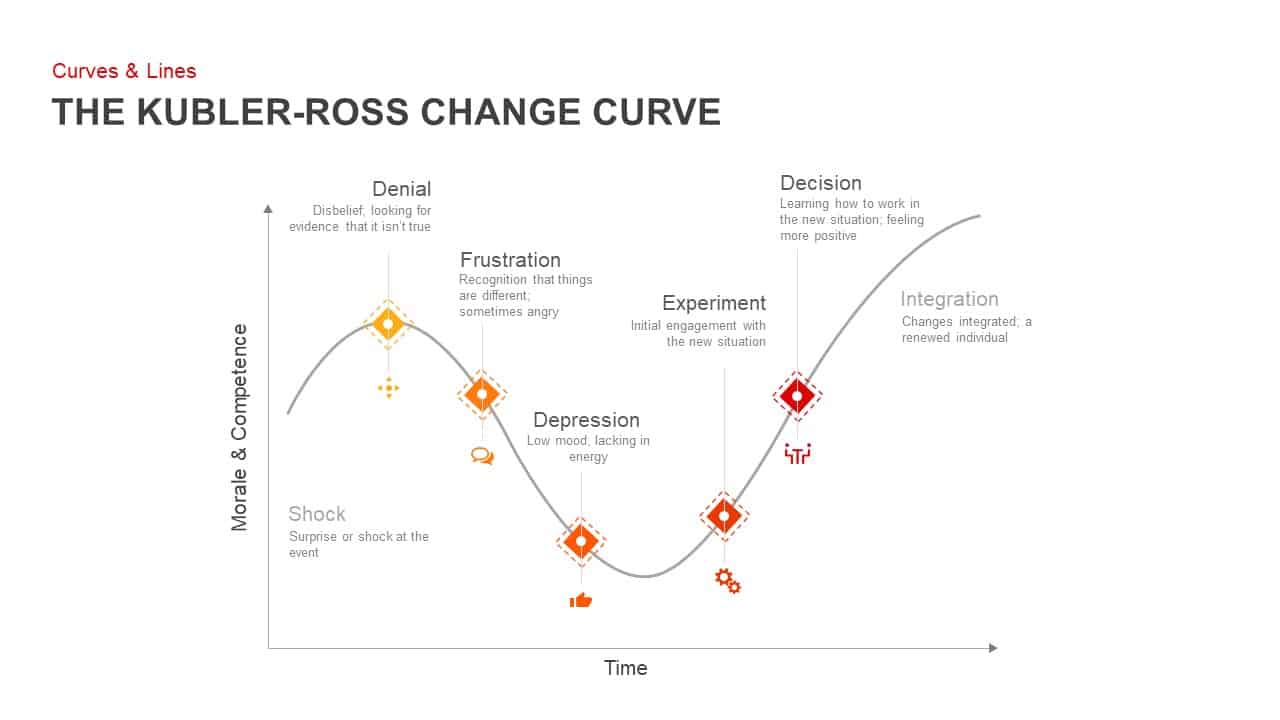
Kubler Ross Change Curve PowerPoint Template
Business Models
Premium
-
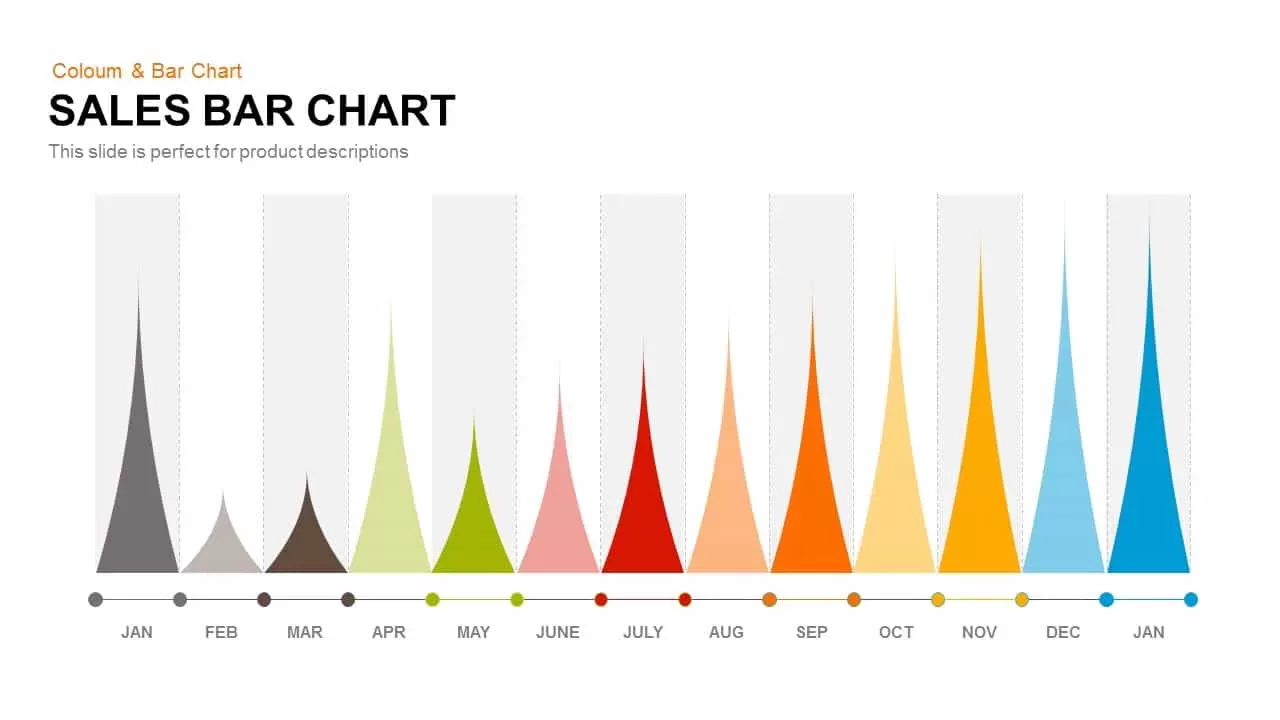
Sales Bar Chart Template for PowerPoint and Keynote
Column and Bar chart
Premium
-
Four Stage Bubble Chart PowerPoint Template and Keynote
Stage Diagrams
Premium
-
Simple Bar Chart PowerPoint Template
Column and Bar chart
Premium
-
Cyclical Process For Business Process Improvement PowerPoint and Keynote Presentation
Process Flow Diagrams
Premium
-
Radial Bar Chart Template for PowerPoint and Keynote
Circular Diagrams
Premium
-

Web Design Proposal Template – PowerPoint Presentation Template
PowerPoint Templates
Premium
-
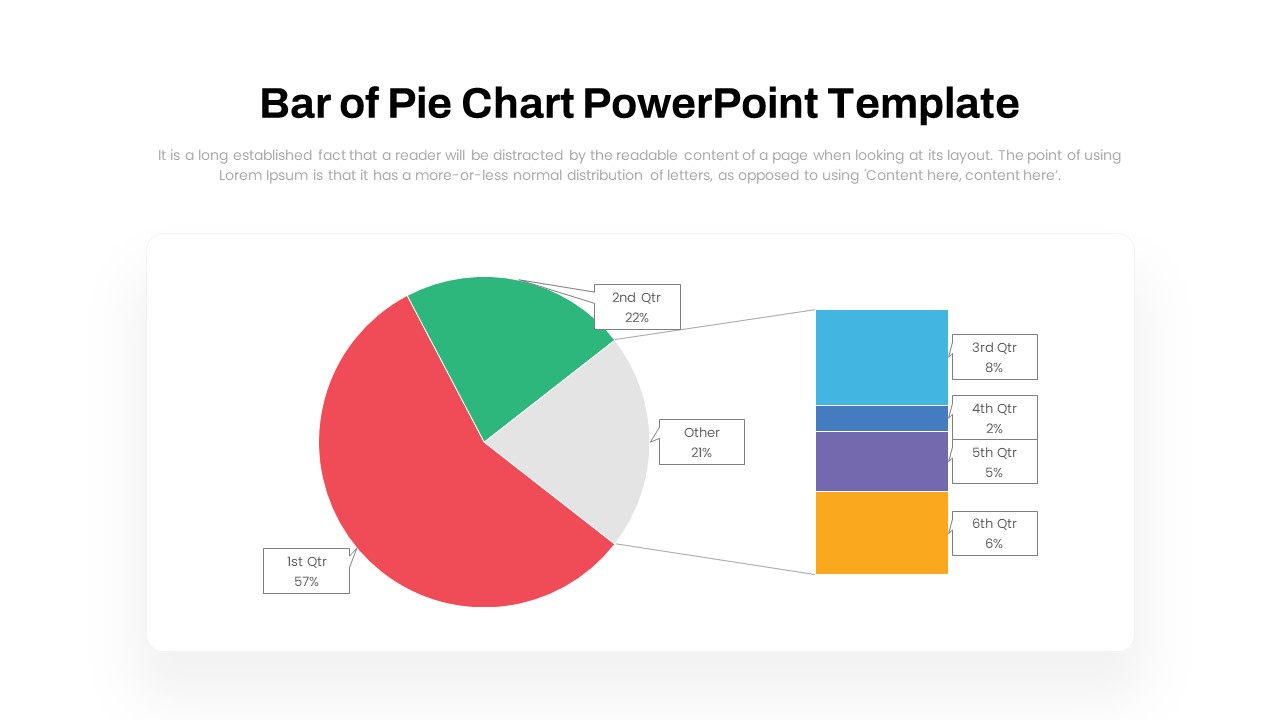
Bar of Pie Chart PowerPoint Template
PowerPoint Templates
Premium
-
Flow Chart Template For PowerPoint & Keynote Presentations
Flow Charts
Premium
-
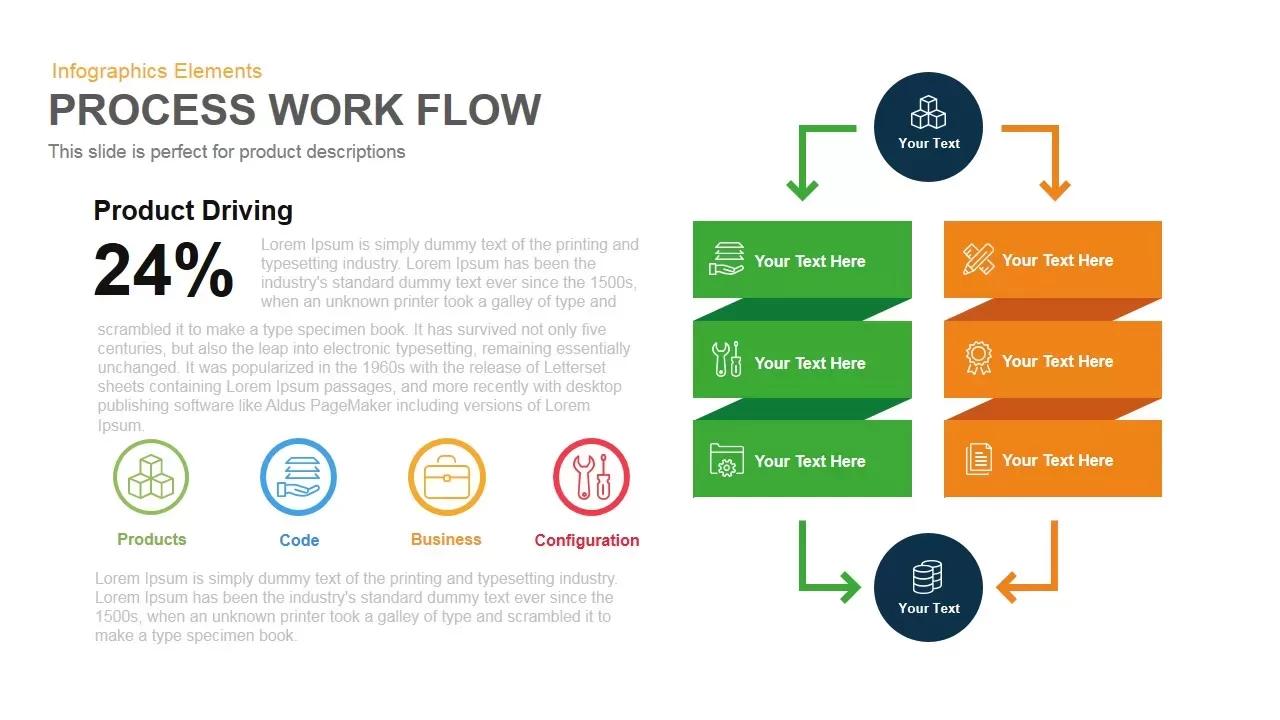
Process Workflow PowerPoint Template and Keynote
Business Models
Premium
-
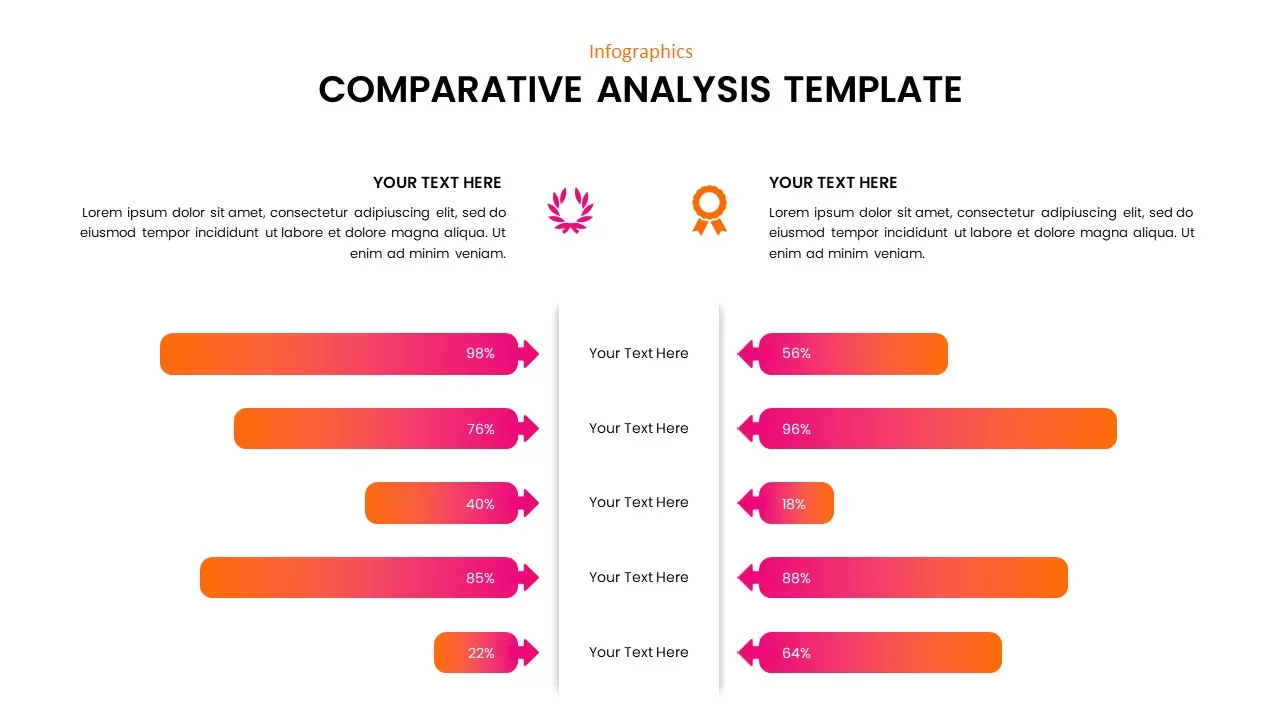
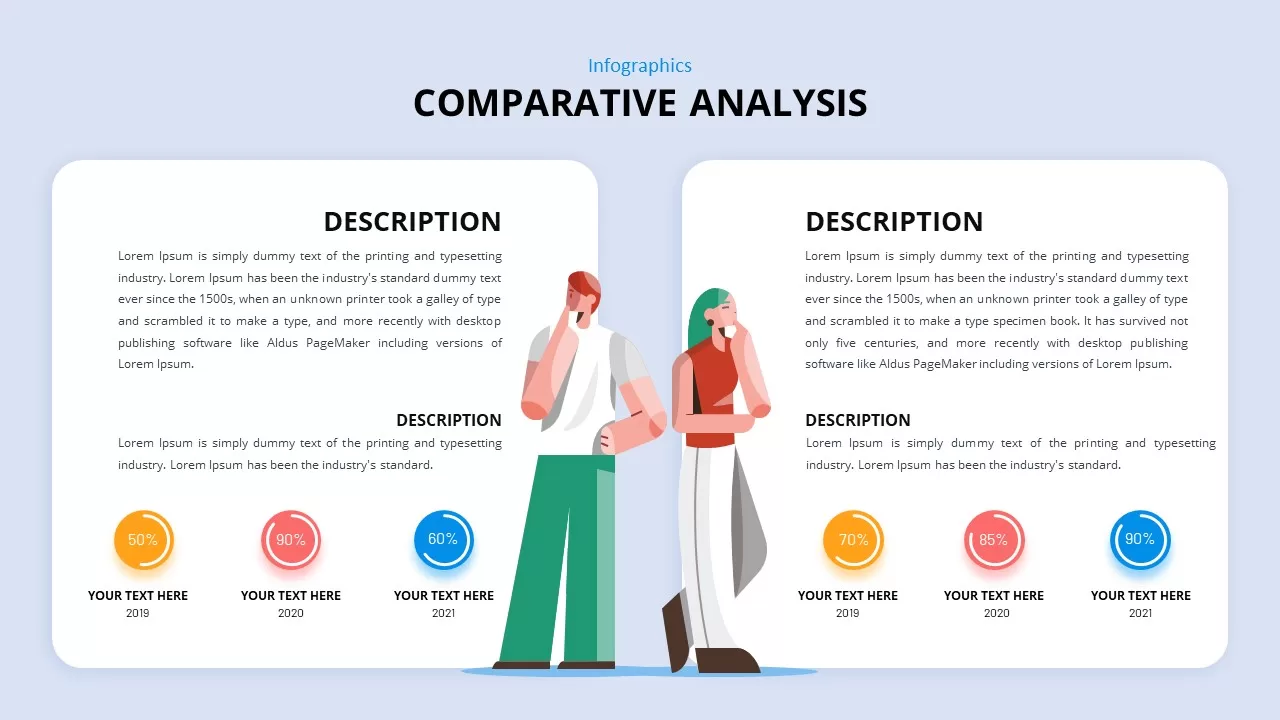
Comparative Analysis PowerPoint Template
Infographic
Premium
-
Requirement List Template
Diagrams
Premium
-
Opposing Ideas Slides Template for PowerPoint
Process Flow Diagrams
Premium
-
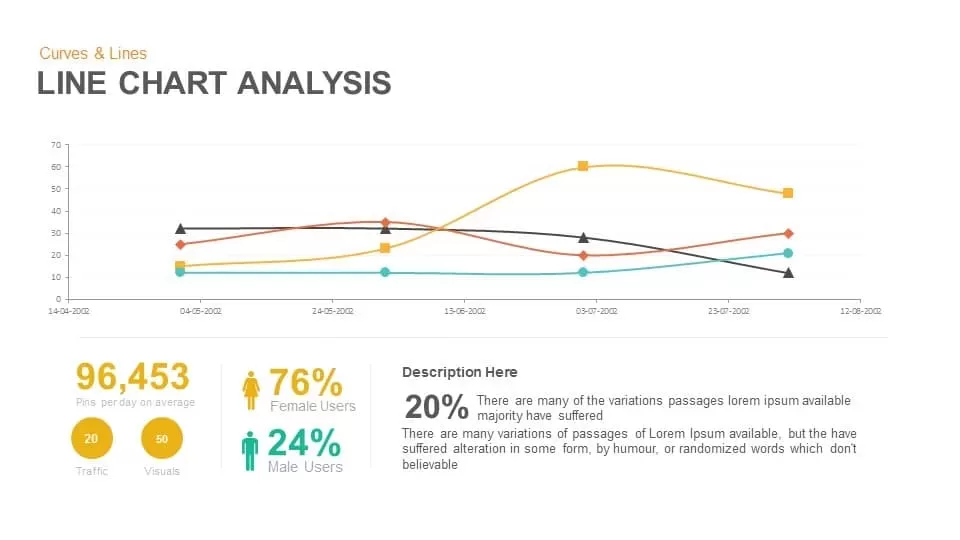
Line Chart Analysis PowerPoint Template and Keynote Slide
Curves and Lines
Premium
-
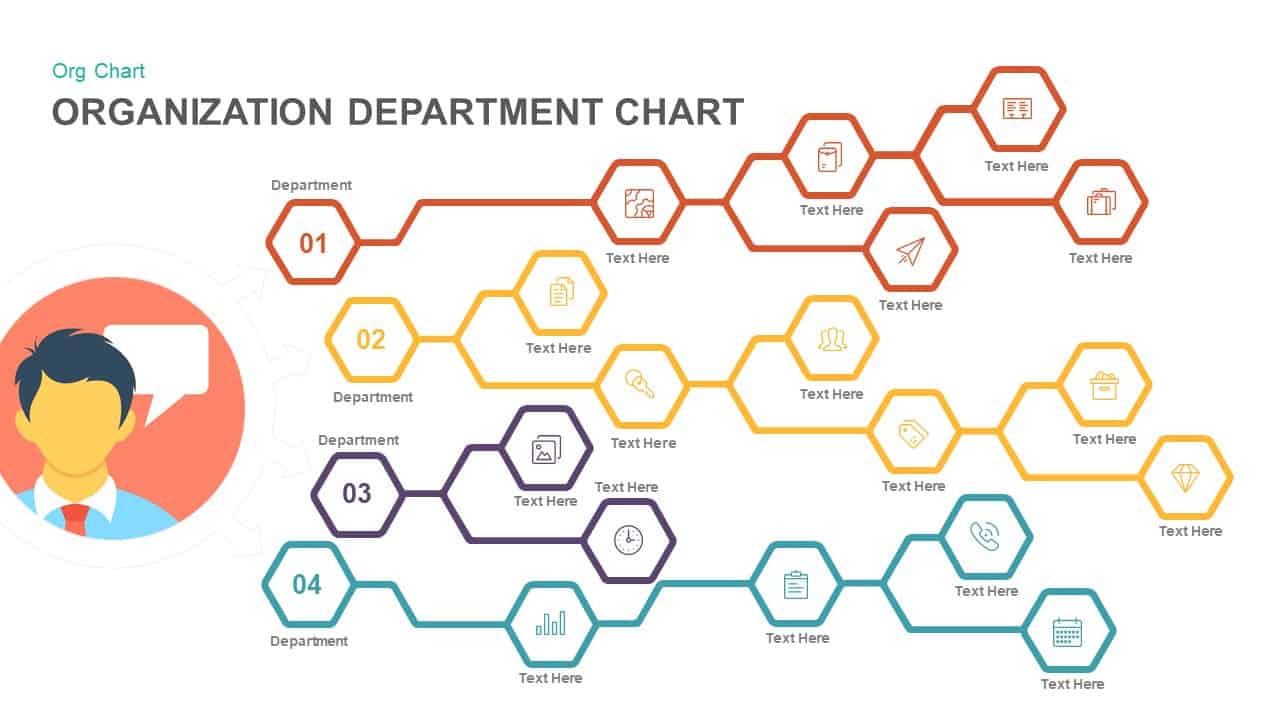
Organization Chart PowerPoint Template and Keynote with Department
Diagrams
Premium
-
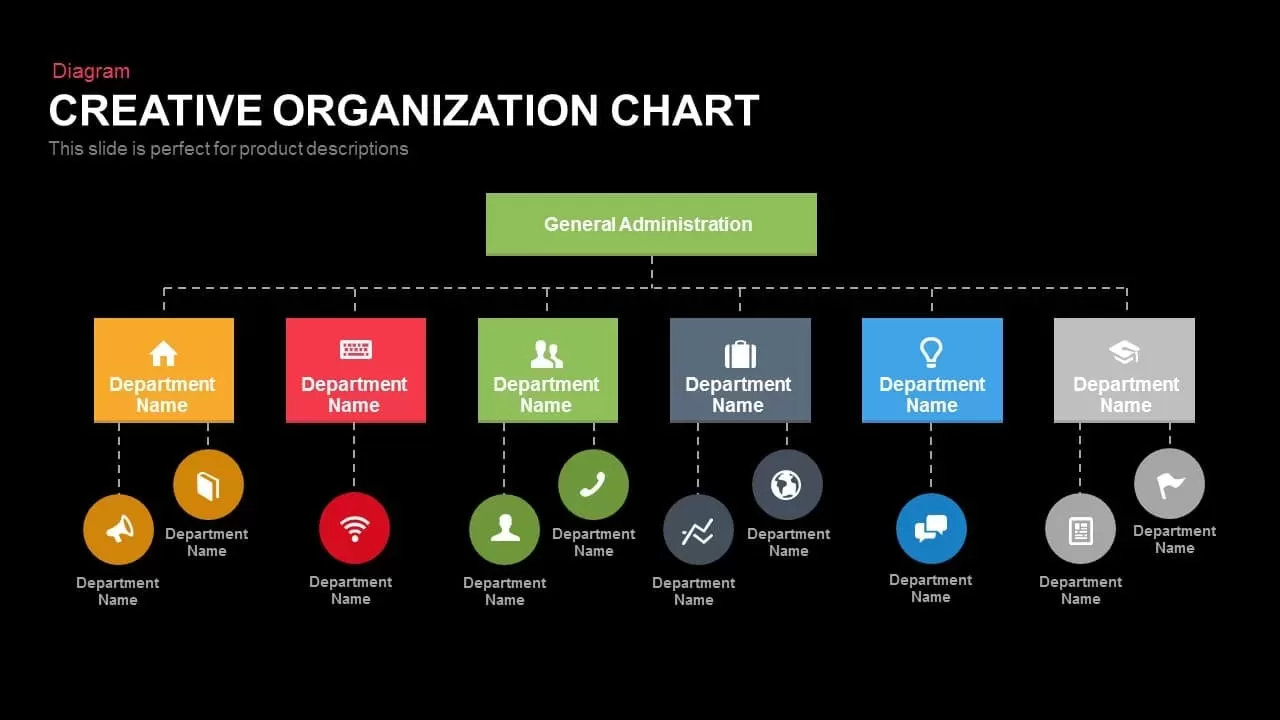
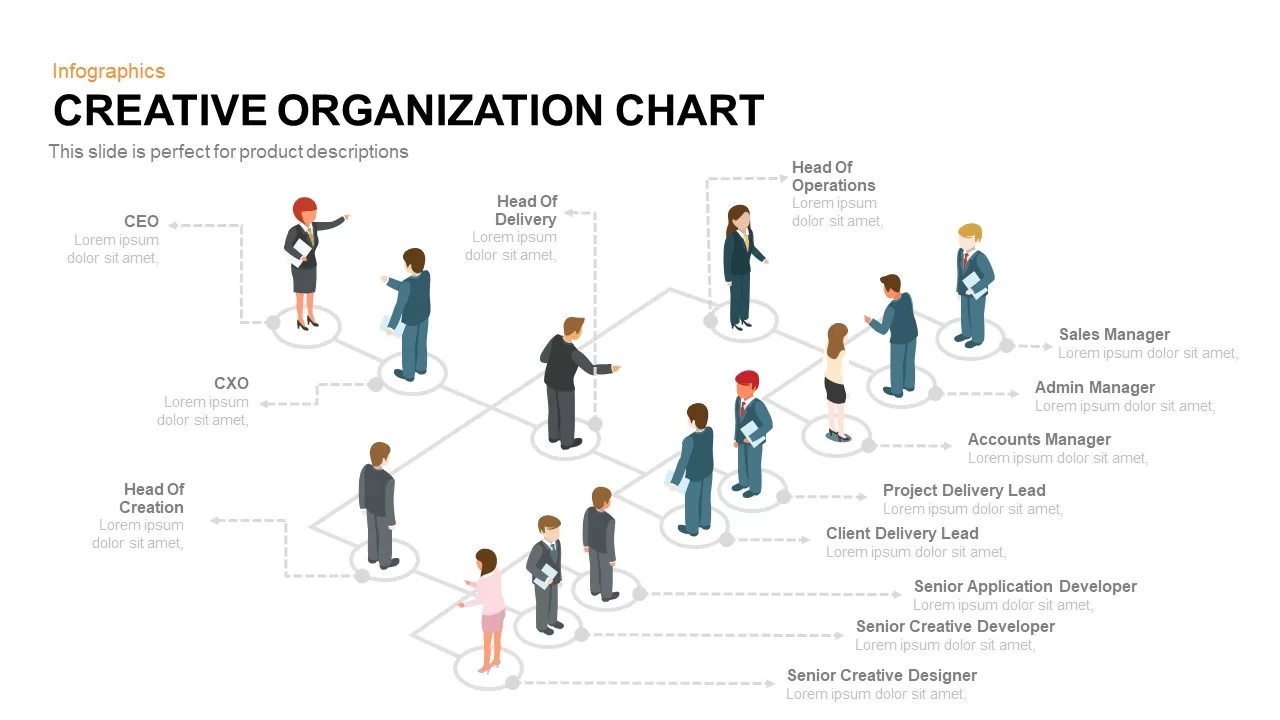
Creative Organization Chart PowerPoint Template
Org Charts
Premium
-
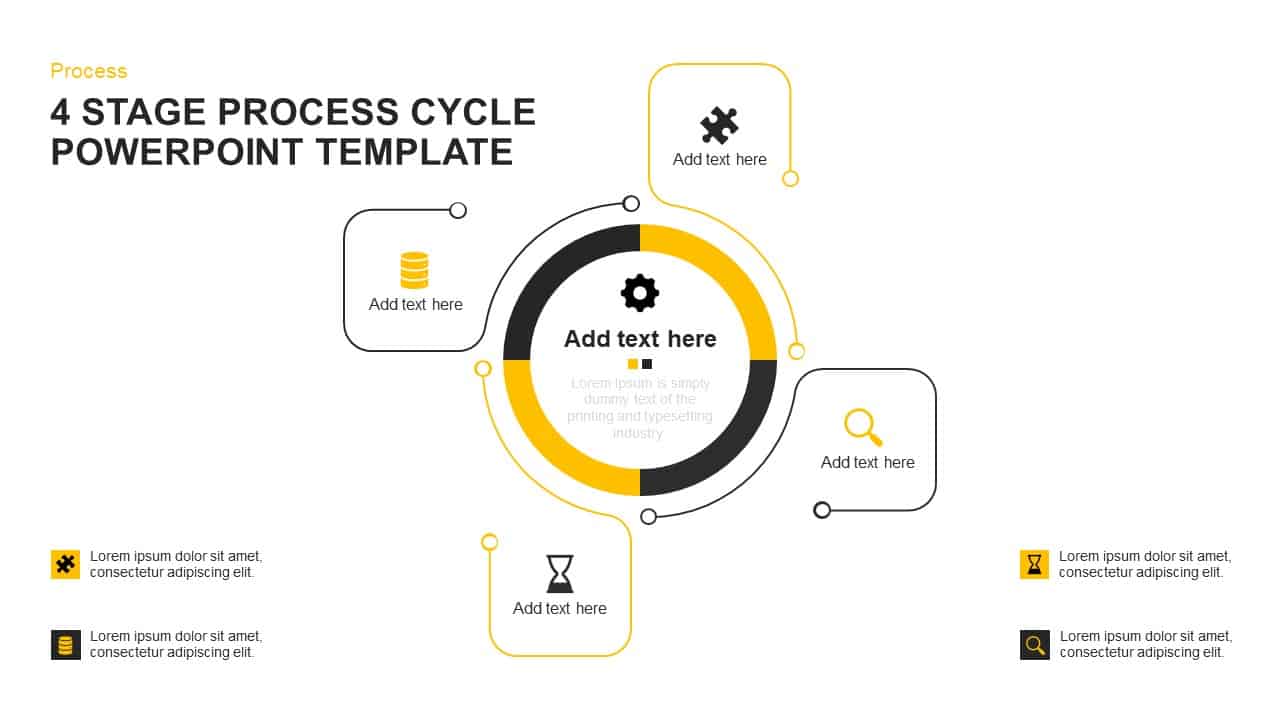
4 Stage Process Cycle PowerPoint Template & Keynote Diagram
Circular Diagrams
Premium
-
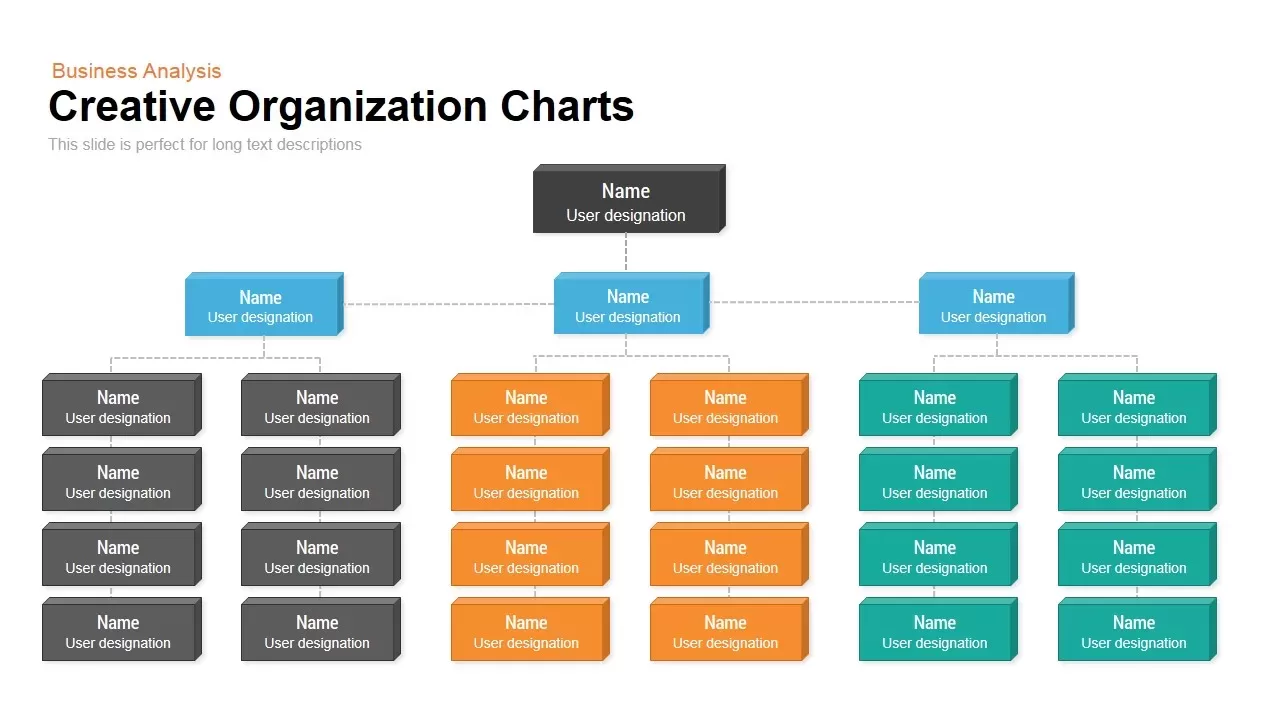
Creative Organization Chart Template for PowerPoint & Keynote
Org Charts
Premium
-
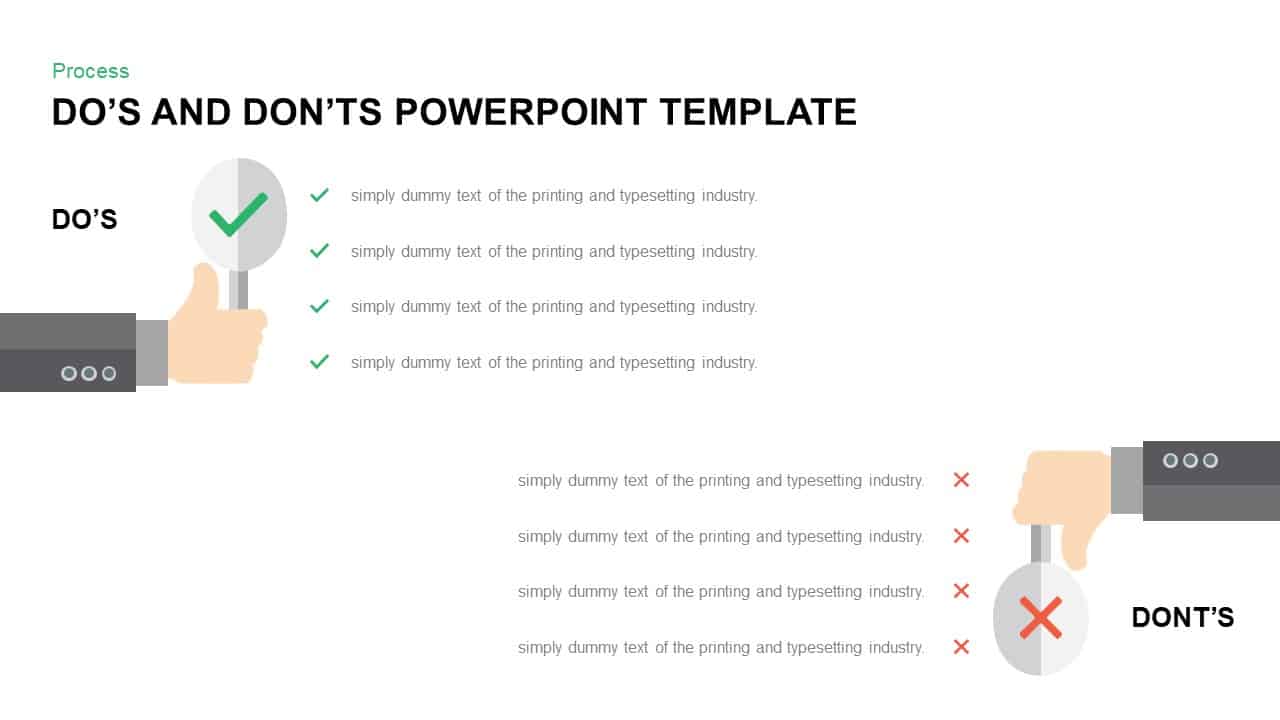
Do’s and Don’ts PowerPoint Template
Keynote Templates
Premium
-
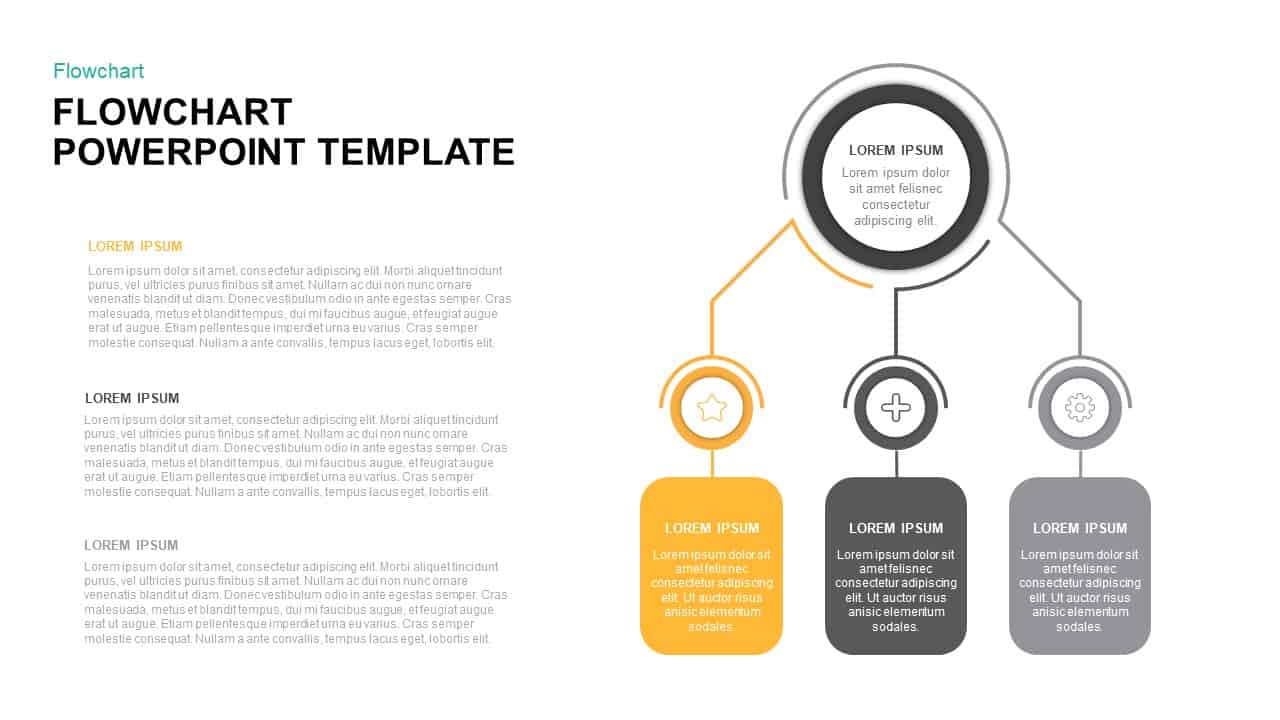
FlowChart PowerPoint Template
Flow Charts
Premium
-
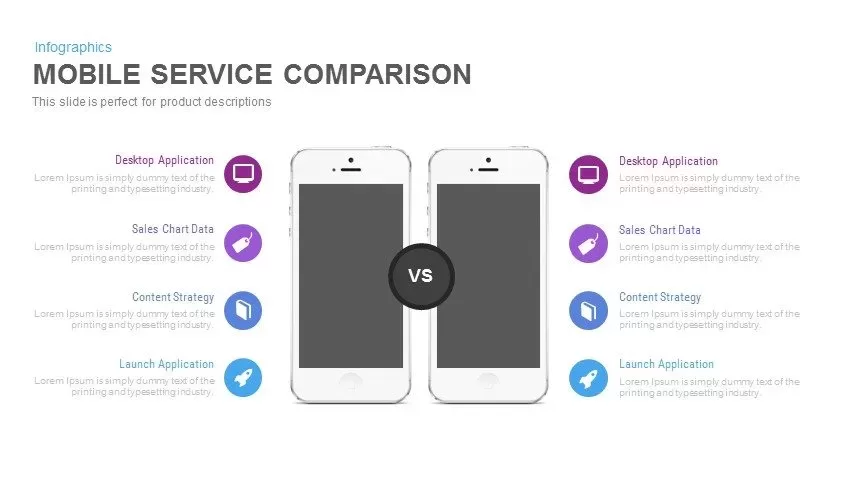
Mobile Service Comparison Template for PowerPoint and Keynote
Infographic
Premium
-
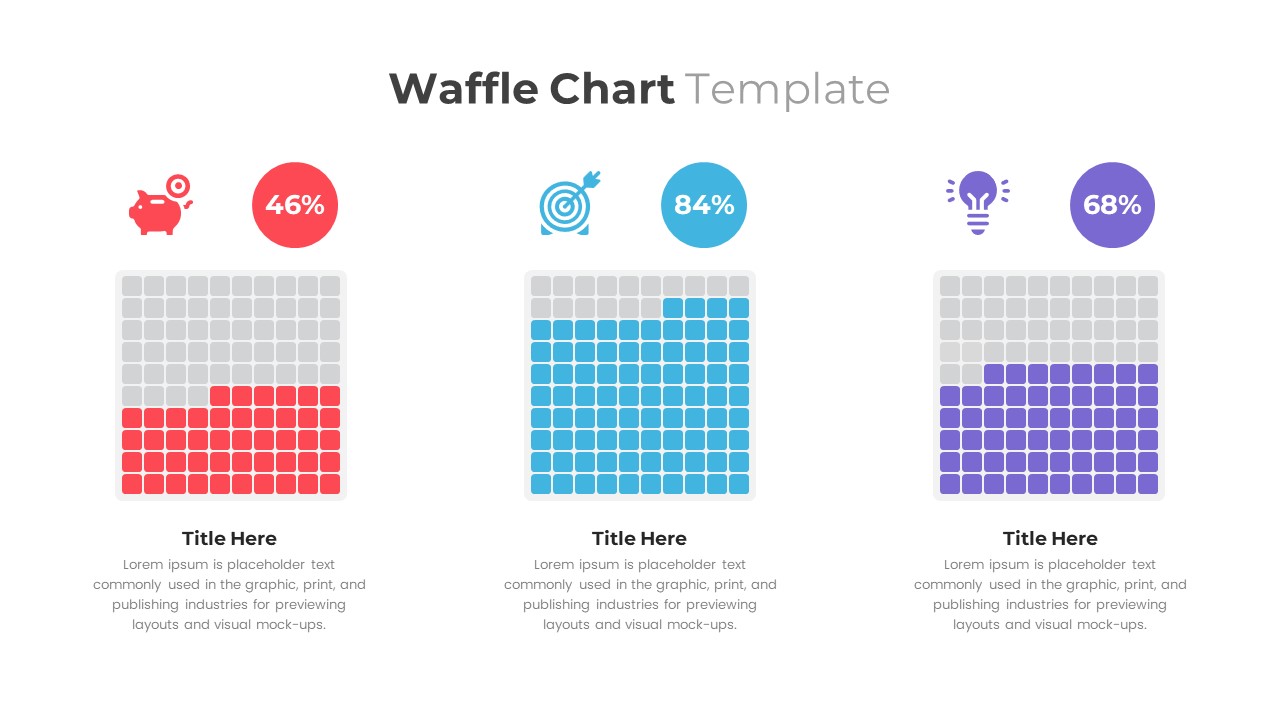
Waffle Chart PowerPoint Template
PowerPoint Templates
Premium
-
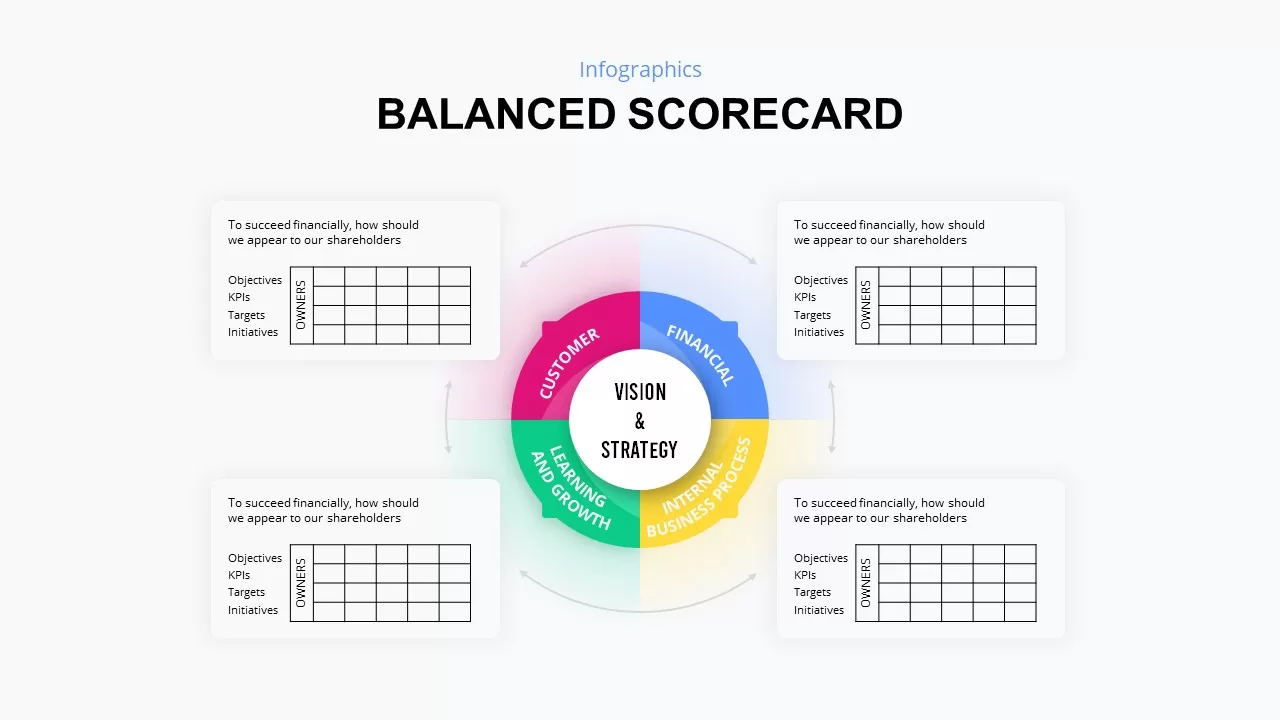
Balanced Scorecard PowerPoint Presentation Template
Circular Diagrams
Premium
-
3 to 9 Step Circular Process PowerPoint Templates
Puzzle
Premium
-
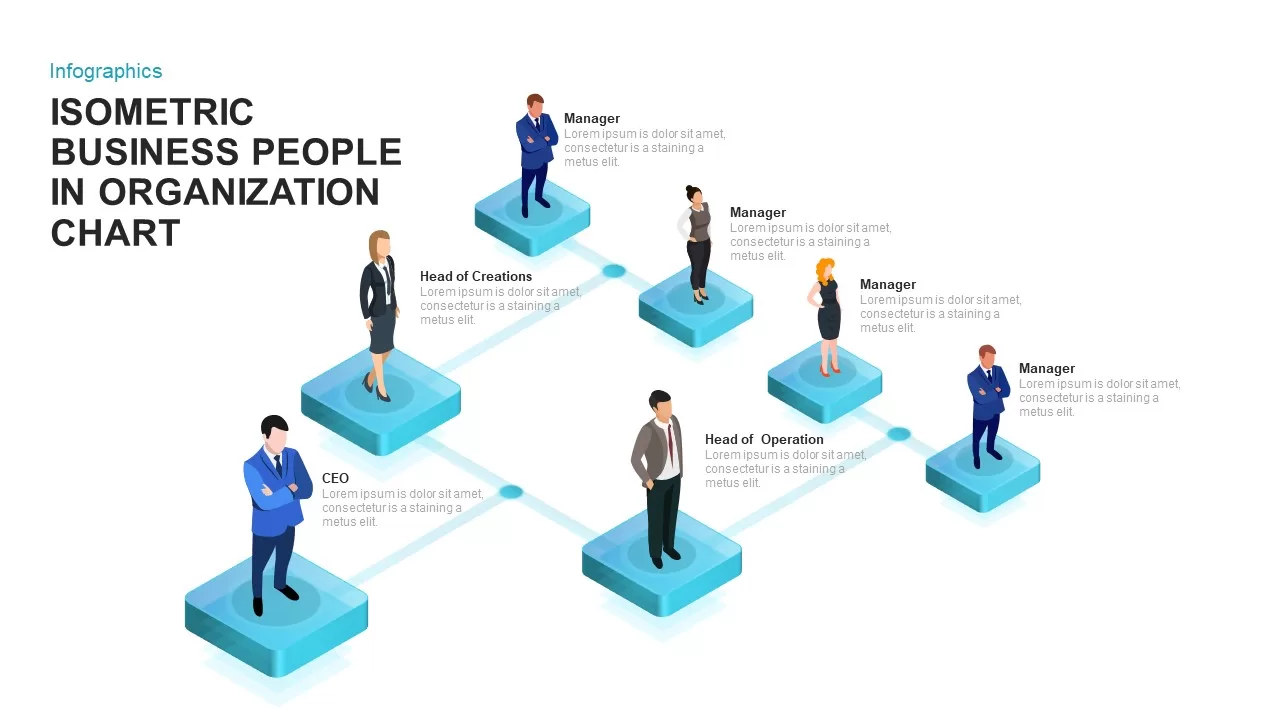
Isometric Business People Organization Chart Template for PowerPoint and Keynote
Org Charts
Premium
-
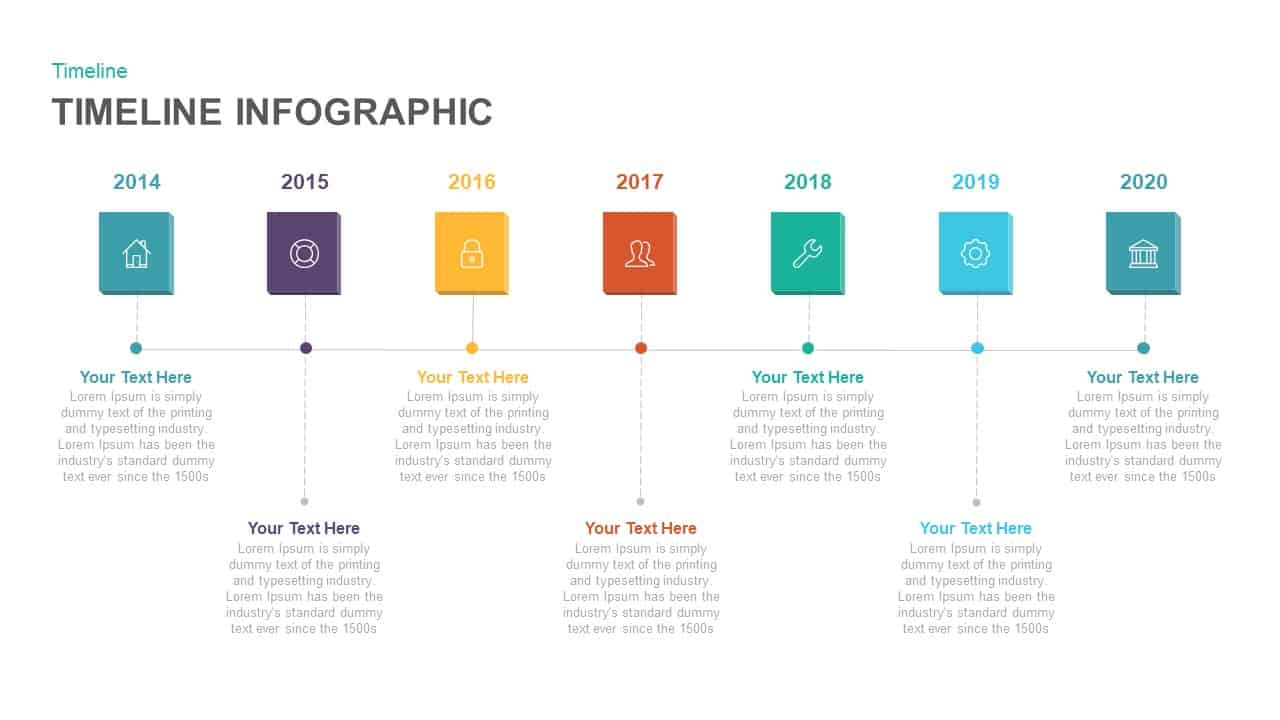
Timeline Infographic Template for PowerPoint and Keynote
Timeline PowerPoint Template
Premium
-
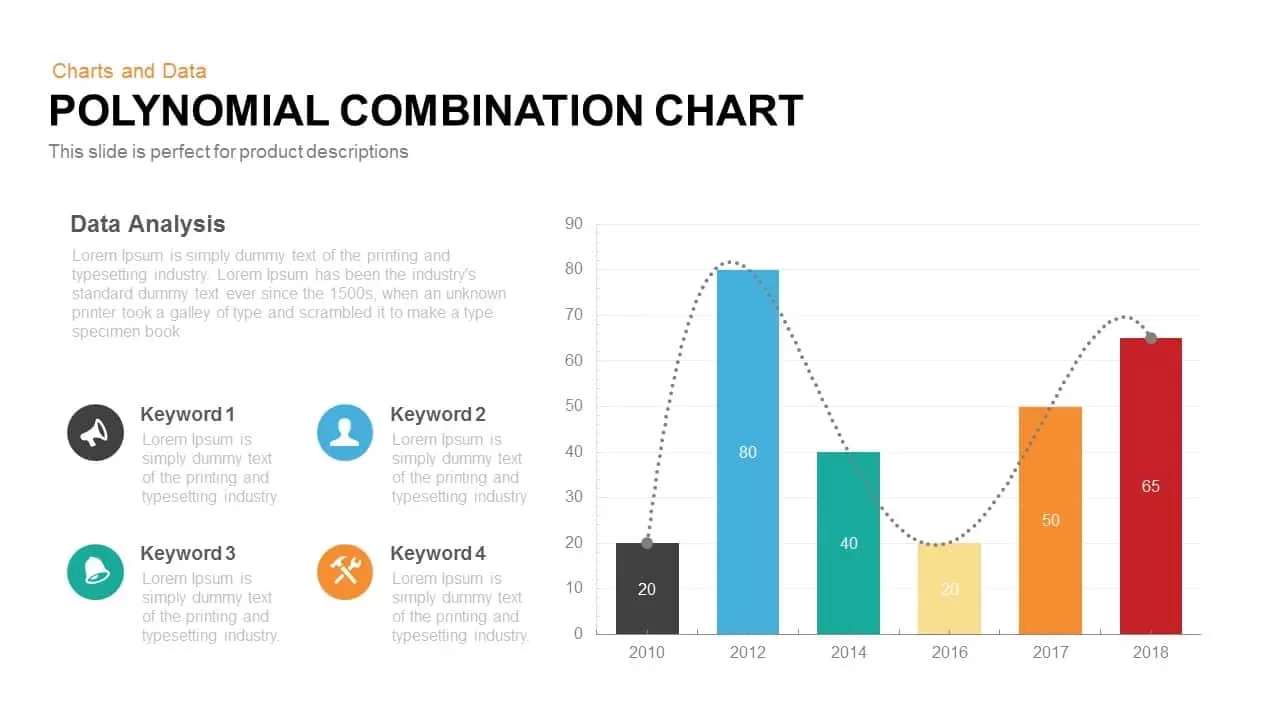
Polynomial Combination Chart PowerPoint Template and Keynote Slide
Column and Bar chart
Premium
-
Comparative Analysis PowerPoint Template
Diagrams
Premium
-
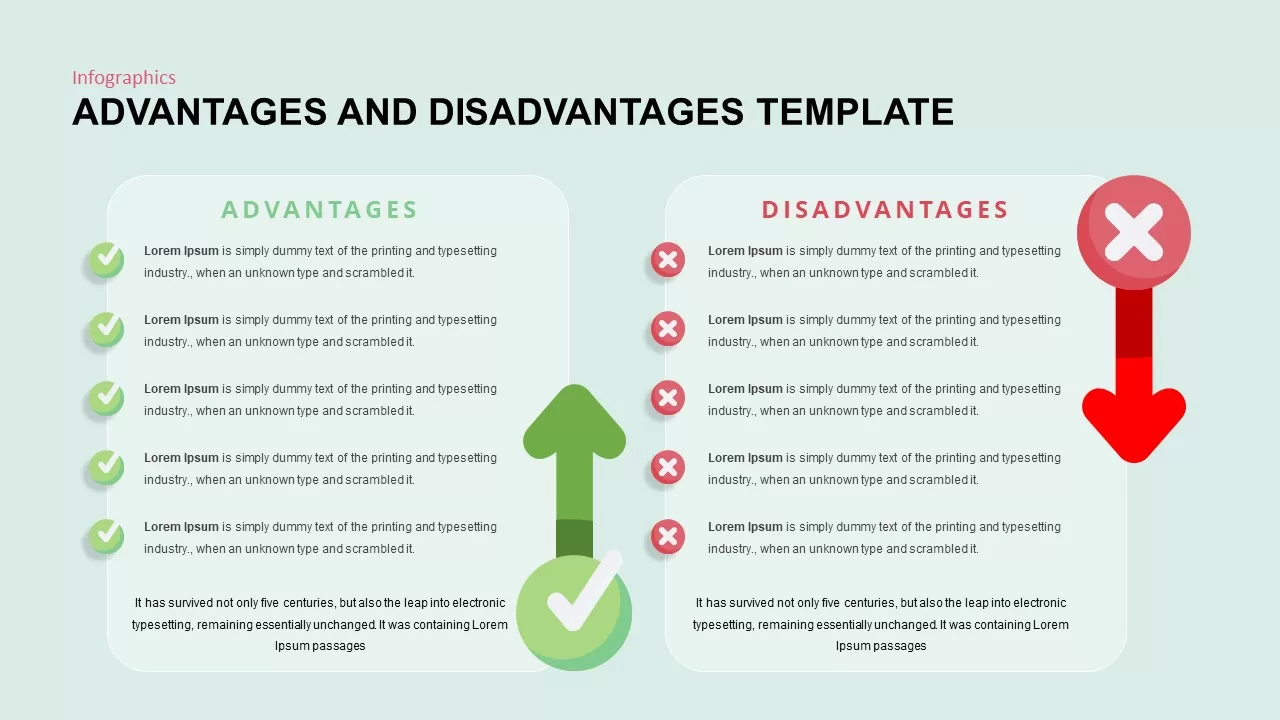
Advantages and Disadvantages PowerPoint Templates
PowerPoint Templates
Premium
-
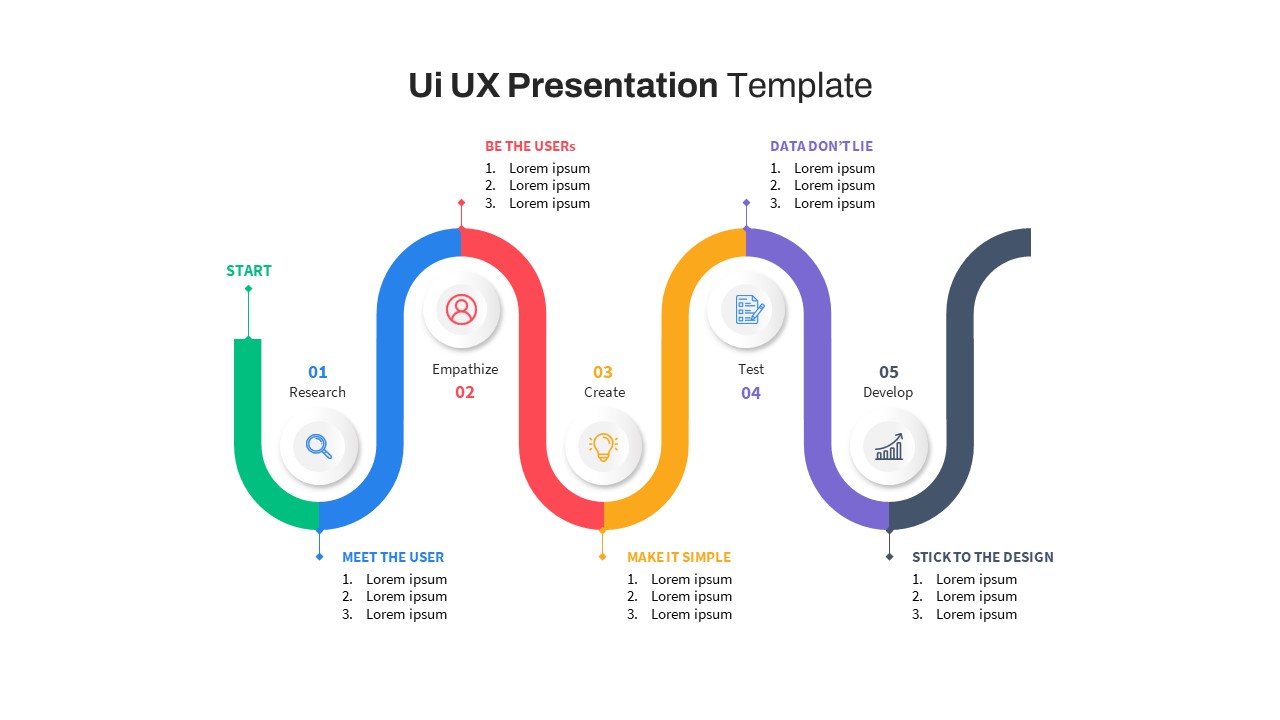
Ui UX PowerPoint Presentation Template Free
Keynote Templates
Free
-
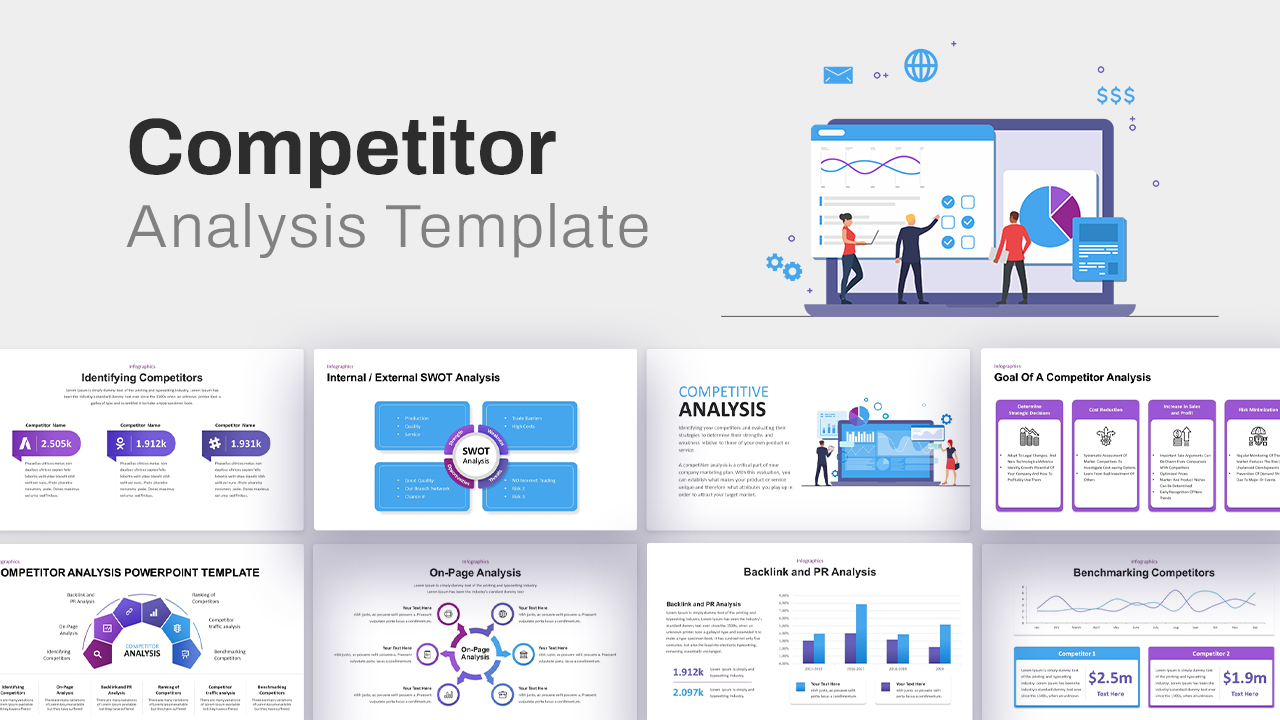
Competitor Analysis Template
PowerPoint Business Templates
Premium
-
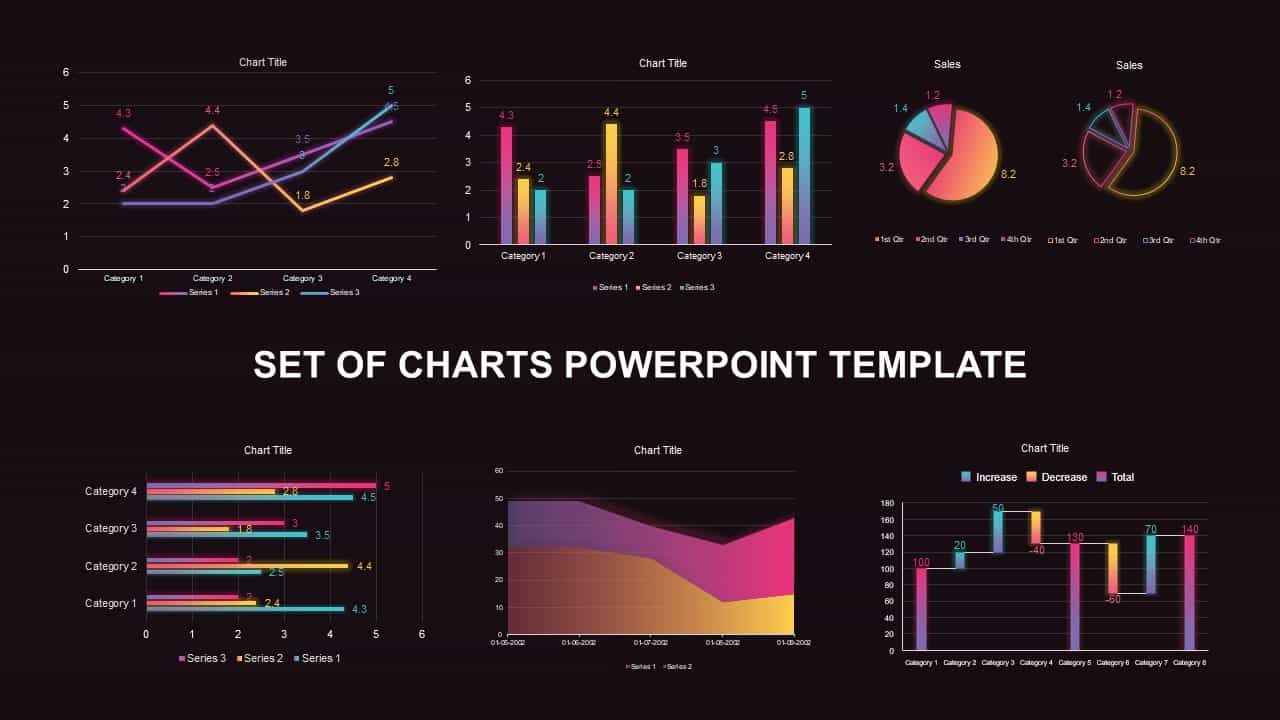
Set of Chart PowerPoint Template and Keynote Diagram
PowerPoint Charts
Premium
-
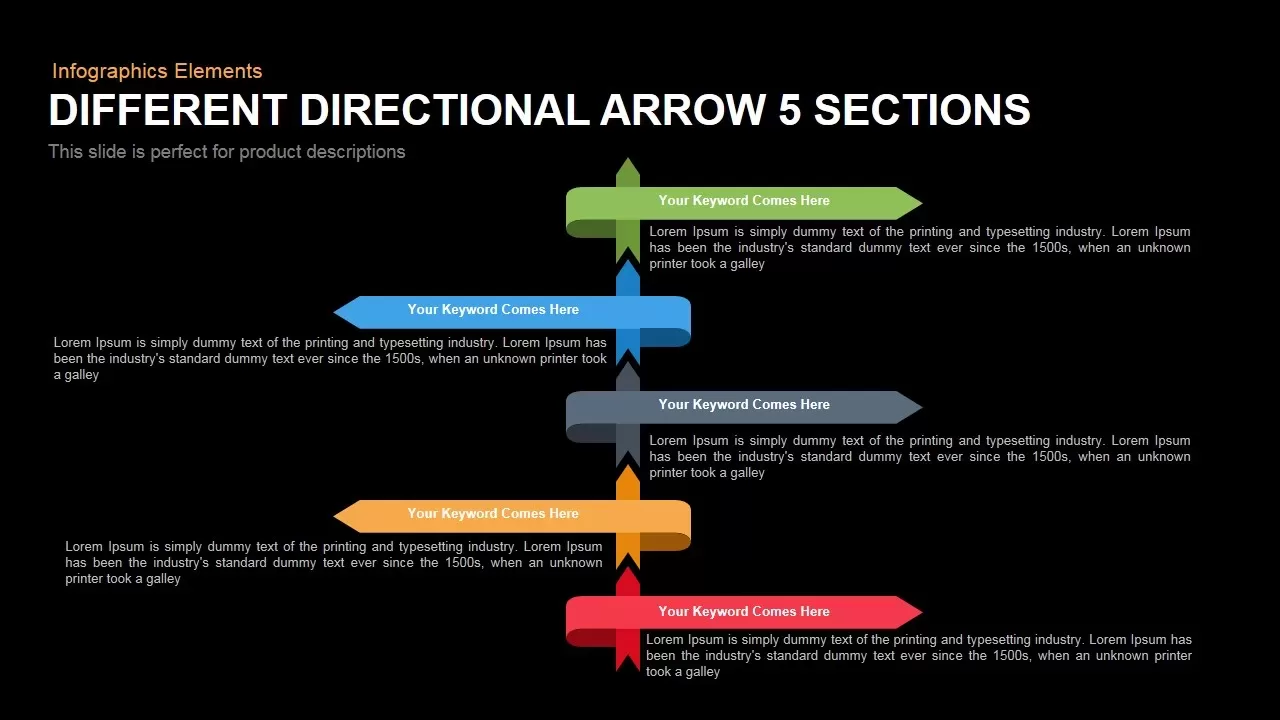
Different Directional Arrows Template for PowerPoint and Keynote
Arrow Diagrams
Premium
-

Radial Bar Chart PowerPoint Templates and Keynote Slides
PowerPoint Charts
Premium
-

VR Presentation Template
Infographic
Premium
-
Creative Isometric Organization Chart PowerPoint Template and Keynote template
Keynote Templates
Premium
-

Creative Bar Chart Data Analysis PowerPoint Template and Keynote
Infographic
Premium
-
Org Chart PowerPoint Presentation Template
PowerPoint Charts
Premium
-

User Persona PowerPoint Template
Business Models
Premium