


PowerPoint Thermometer Chart Template


- Version
- Download 25
- File Size 0.00 KB
- File Count 1
- Create Date October 22, 2023
- Last Updated October 16, 2023
PowerPoint Thermometer Chart Template
Download Thermometer Chart for PowerPoint Presentation
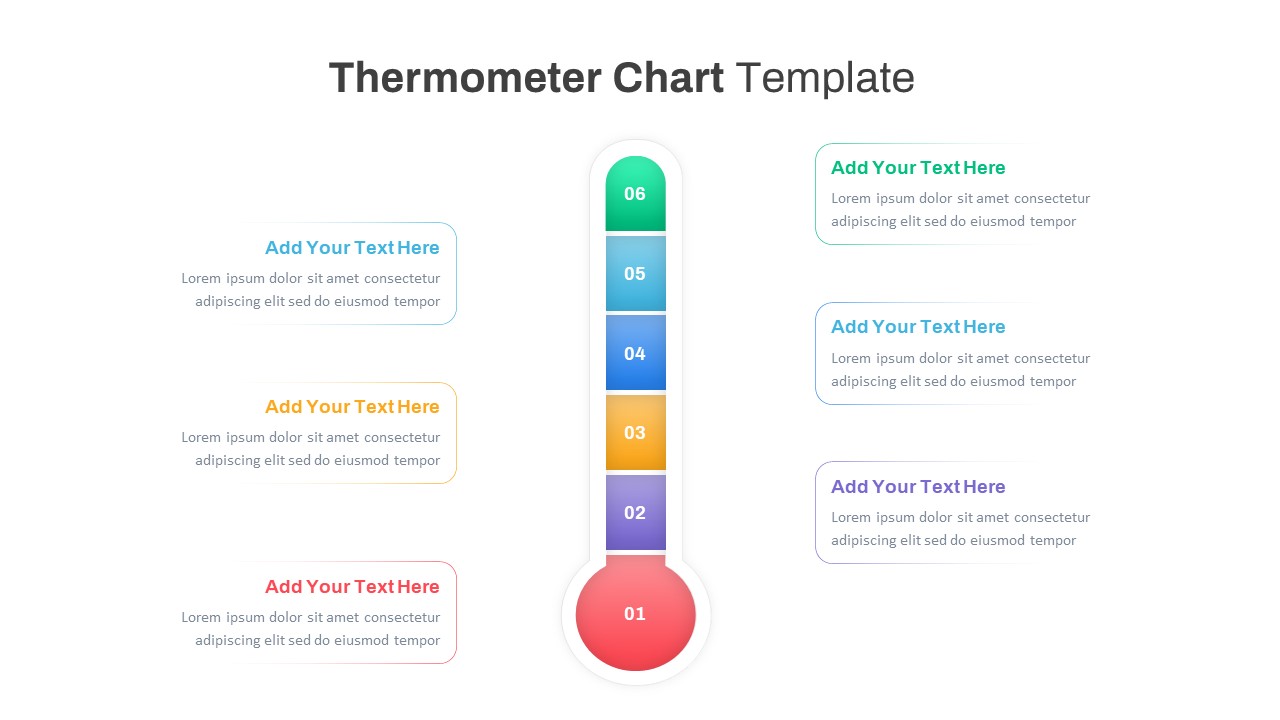
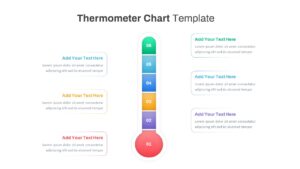
Thermometer Chart PowerPoint Template is a customizable design for multitopic presentation. You can display data evaluation, fundraising progress, and financial reports. A thermometer offers a metaphorical representation for illustrating the spectrum between two contrasting extremes, encompassing concepts like high/low, positive/negative, profit/loss, and various other comparisons. Either you can use it as an evaluative description, or you can insert general ideas of your subject using the step-by-step bullet point.
What is a thermometer Chart PowerPoint?
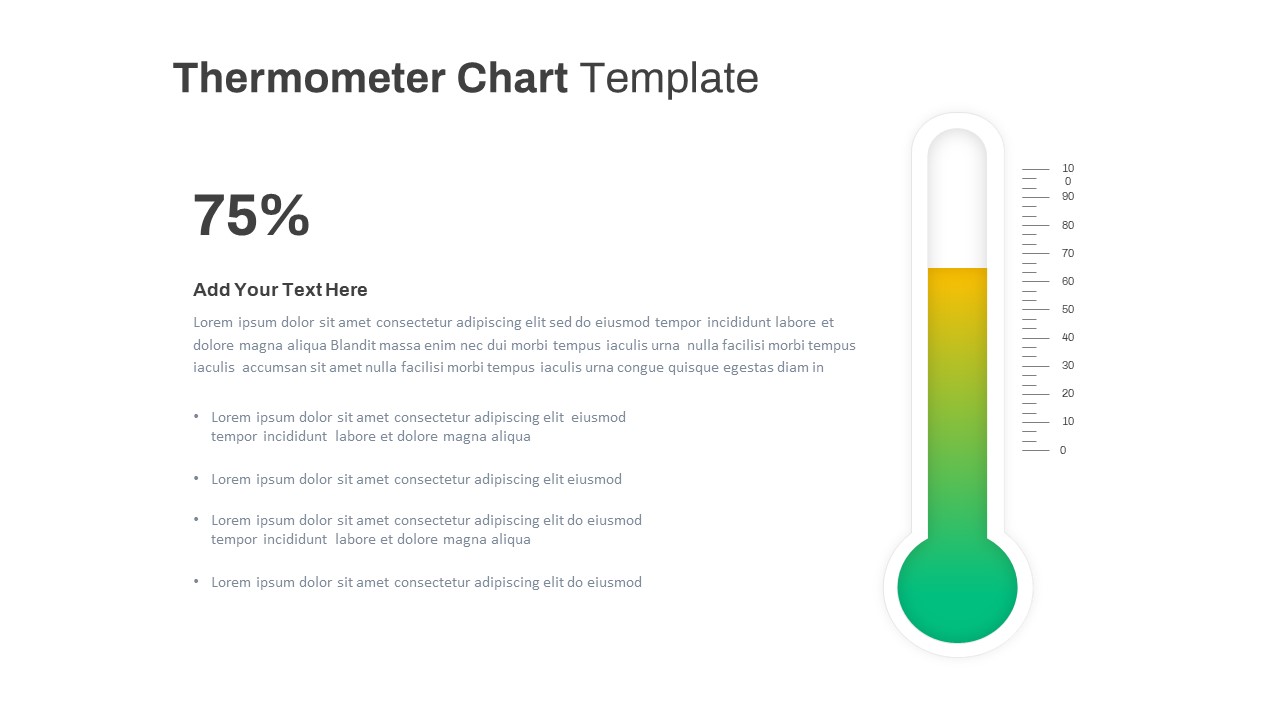
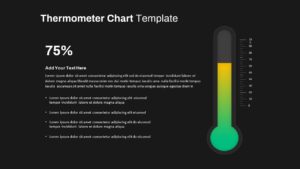
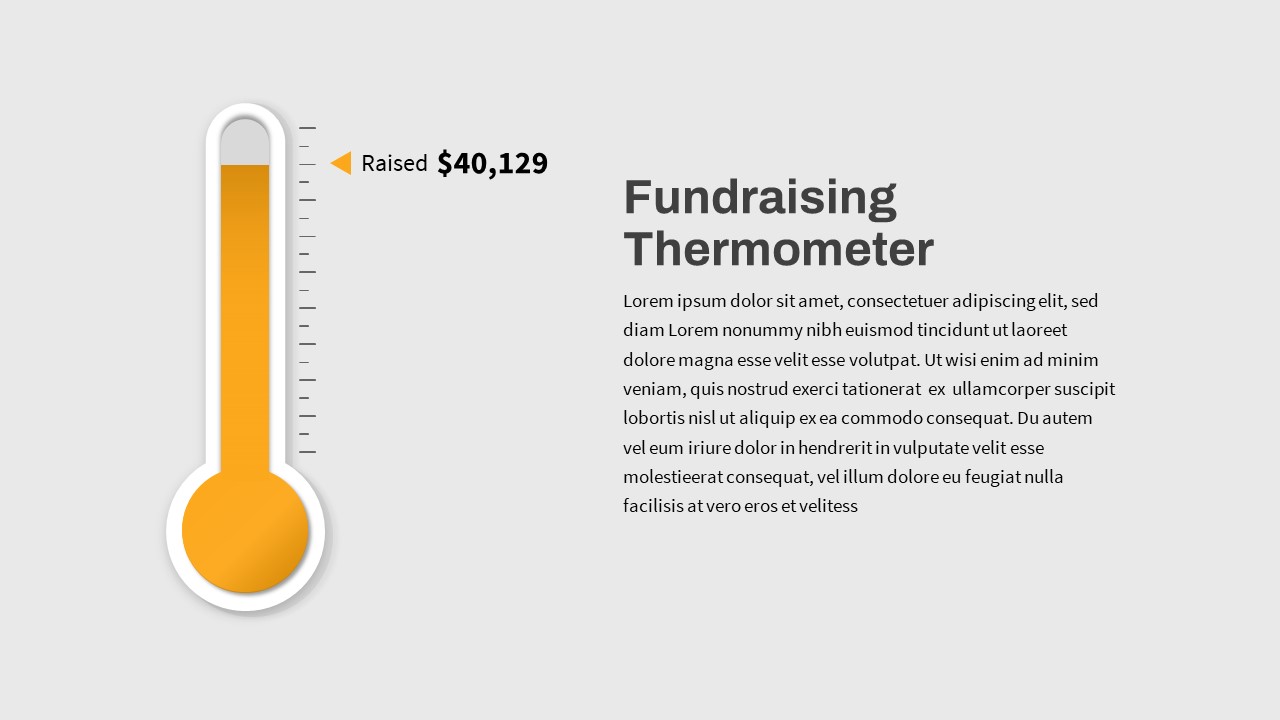
A thermometer PowerPoint chart is a visual representation often used in PowerPoint presentations to illustrate progress or attainment toward a specific goal or target. It resembles a thermometer, where a vertical column is partially filled or colored to indicate the current status of a particular metric. As progress or values increase or decrease, the filled portion of the chart adjusts accordingly, making it a simple and intuitive way to convey information about goals, milestones, or performance levels. It's commonly used in business presentations, fundraising campaigns, and other contexts where tracking progress is important.
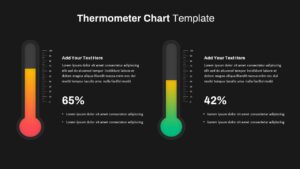
PowerPoint Thermometer Chart Template is suitable for depicting key indications in the organization. You can highlight the organization’s fundraising progress that quickly displays goals and achievements. It can be a substitute for statistical updates featuring financial presentations. Whether it's sales targets, project milestones, or KPIs, this helps you monitor and communicate progress effectively. Medical and healthcare presentations will be metaphoric when you use the template to illustrate patient data, outcomes, and more in symbolic manner.
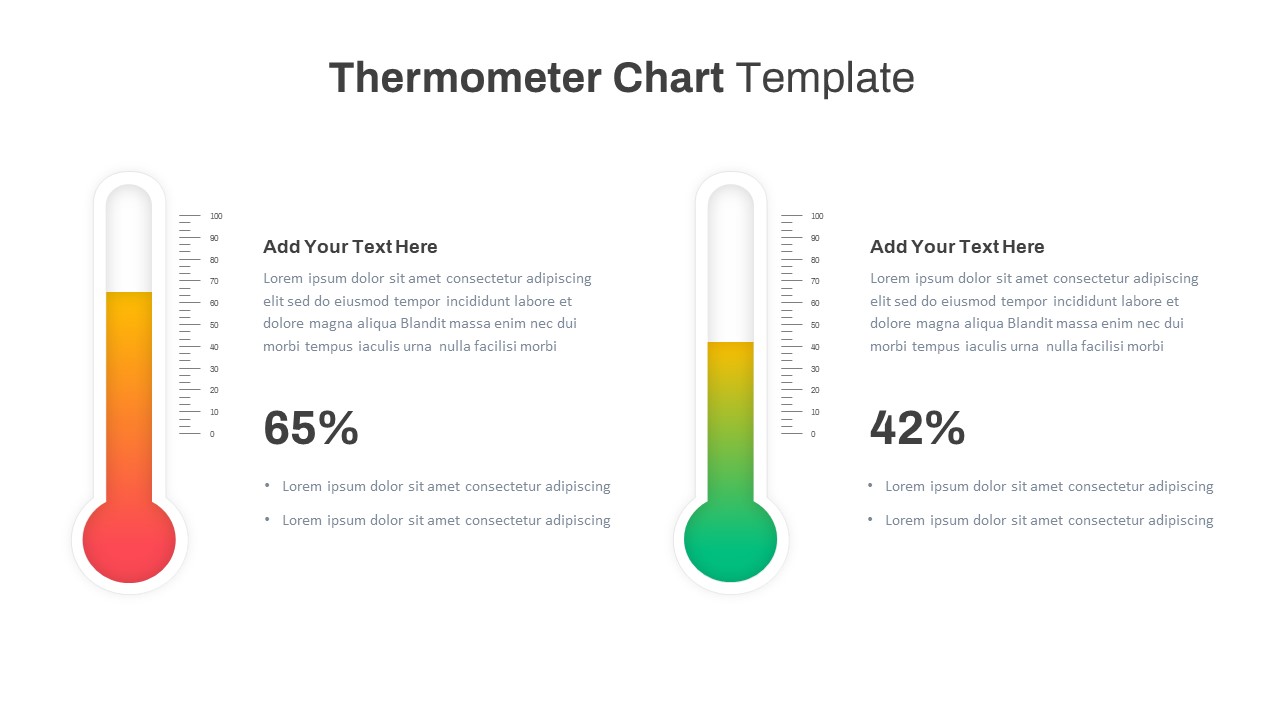
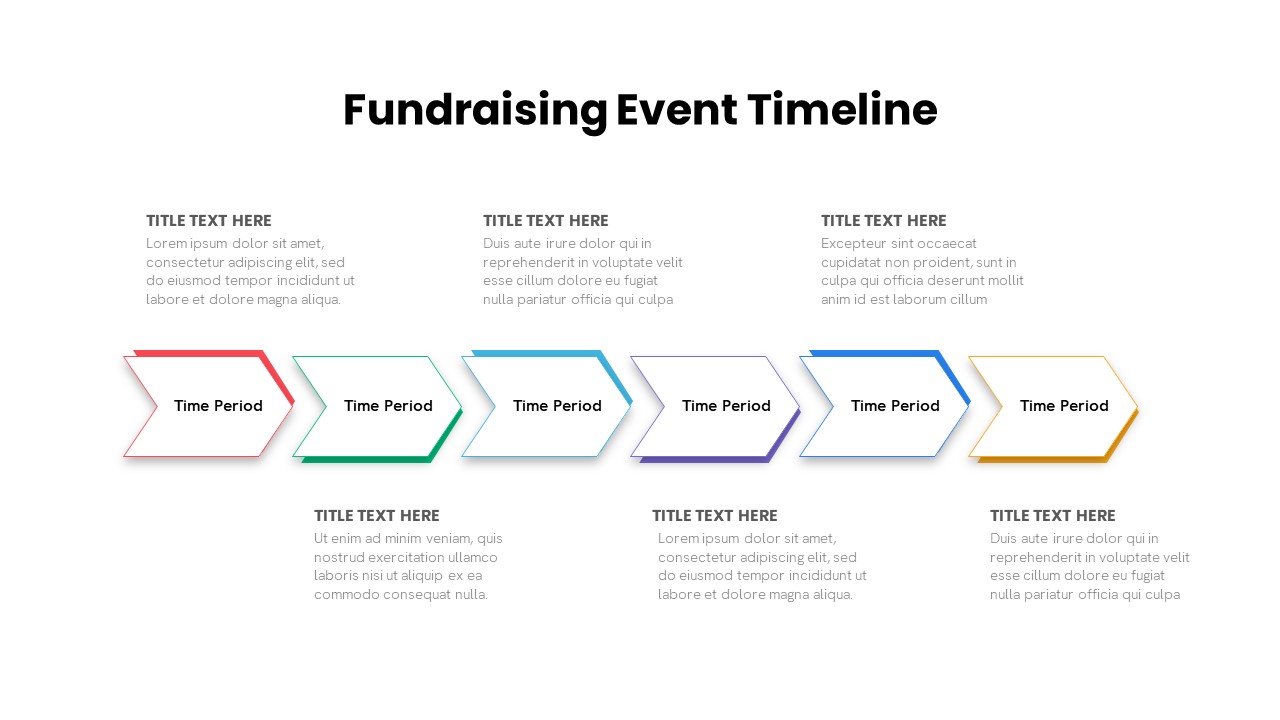
Besides healthcare analytics, the thermometer chart template can use to demonstrate reports of Nonprofit campaigns regarding impact of their project, and donations, or support given by the public. So, business executives, financial analysists, healthcare practitioners, researchers, project managers and wide range of data presenters can use this thermometer chart for highlighting their key points.
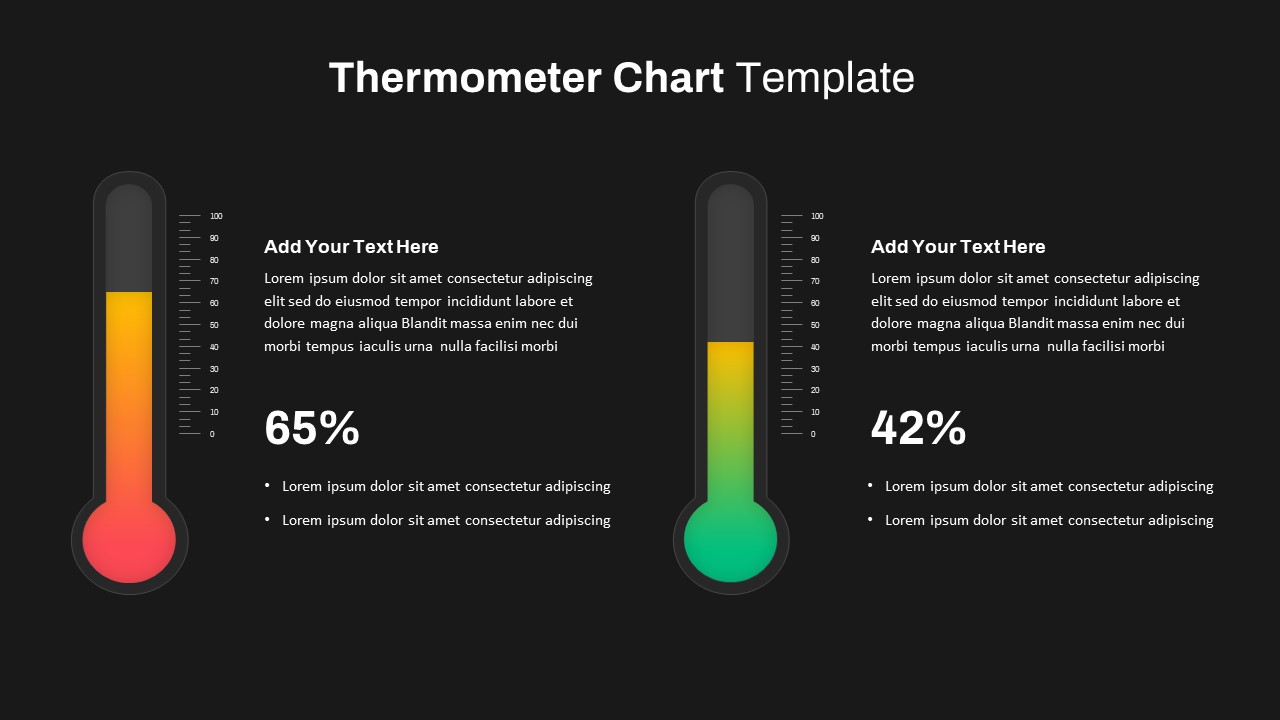
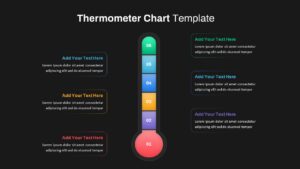
The thermometer slide has two variant designs in black and white backgrounds. You can use slides to present general descriptions and for comparison slideshows as well. Download thermometer chart for PowerPoint and make your presentation more impressive than ever before. Travel to our vast collection of PowerPoint templates now!
Attached Files
| File | Action |
|---|---|
| https://premiumdownloads.s3.amazonaws.com/SB03776-PowerPoint Thermometer Chart Template.ZIP | Download |
Login to download this file
Add to favorites
Add to collection
-

Item ID
SB03776 -

Related Templates
-
Fundraising Thermometer PowerPoint Template
PowerPoint Templates
Premium
-

Free Nursing Capstone PowerPoint Deck
PowerPoint Templates
Free
-

Nature PowerPoint Presentation Template
PowerPoint Business Templates
Premium
-

Sales Deck Free PowerPoint Template
PowerPoint Templates
Free
-

Research Proposal PowerPoint Template
PowerPoint Templates
Premium
-

Free Vertical PowerPoint Template
PowerPoint Business Templates
Free
-

Cab Service PowerPoint Template
PowerPoint Templates
Premium
-

Free Space Minimal Deck Template
PowerPoint Templates
Free
-

Gym PowerPoint Template
PowerPoint Templates
Premium
-

VET Clinic PowerPoint Template
PowerPoint Templates
Premium
-

Travel Agency PowerPoint Template
PowerPoint Templates
Premium
-

Free Physical Education PowerPoint Template Deck
Free PowerPoint Templates
Free
-

IoT Presentation Template
PowerPoint Templates
Premium
-

Effective Communication PowerPoint Template
PowerPoint Templates
Premium
-

PowerPoint Quiz With Timer
PowerPoint Templates
Premium
-

Free Charity PowerPoint Template Deck
PowerPoint Templates
Free
-

Graph Paper PowerPoint Template Deck
PowerPoint Templates
Premium
-

Free Economics PowerPoint Template
Free PowerPoint Templates
Free
-

Free Aviation PowerPoint Template
Free PowerPoint Templates
Free
-

Free Army PowerPoint Template
PowerPoint Templates
Free
-

Macroeconomics PowerPoint Template
PowerPoint Templates
Premium
-

Customer Experience Loyalty PowerPoint Deck Template
PowerPoint Templates
Premium
-

Free Event Planning PowerPoint Template
Free PowerPoint Templates
Free
-

Free Real Estate Listing PowerPoint Template
Free PowerPoint Templates
Free
-

Free Cartoon PowerPoint Template
Free PowerPoint Templates
Free
-

Free University Presentation PowerPoint Template
PowerPoint Templates
Free
-

Animated Agriculture PowerPoint Deck Template
PowerPoint Templates
Premium
-

Stakeholder Register PowerPoint Template
PowerPoint Templates
Premium
-

Free Book Review PowerPoint Template
Free PowerPoint Templates
Free
-
Fundraising Campaign Event Timeline Template
PowerPoint Templates
Premium
-

Global Warming Infographic PowerPoint Template Deck
PowerPoint Templates
Premium
-

Real Estate PowerPoint Theme
PowerPoint Themes
Premium
-

Annual Report PowerPoint Template and Keynote
PowerPoint Templates
Premium
-

Data Science PowerPoint Template
PowerPoint Templates
Premium
-

EFQM Model PowerPoint Template
PowerPoint Templates
Premium
-

Free Dunder Mifflin Paper Company Pitch Deck
Free PowerPoint Templates
Free
-
Progress Bar Chart PowerPoint Template
PowerPoint Templates
Premium
-
Progress Chart PowerPoint Template
PowerPoint Templates
Premium
-

Free AI Artificial Intelligence PowerPoint Template
PowerPoint Templates
Free
-
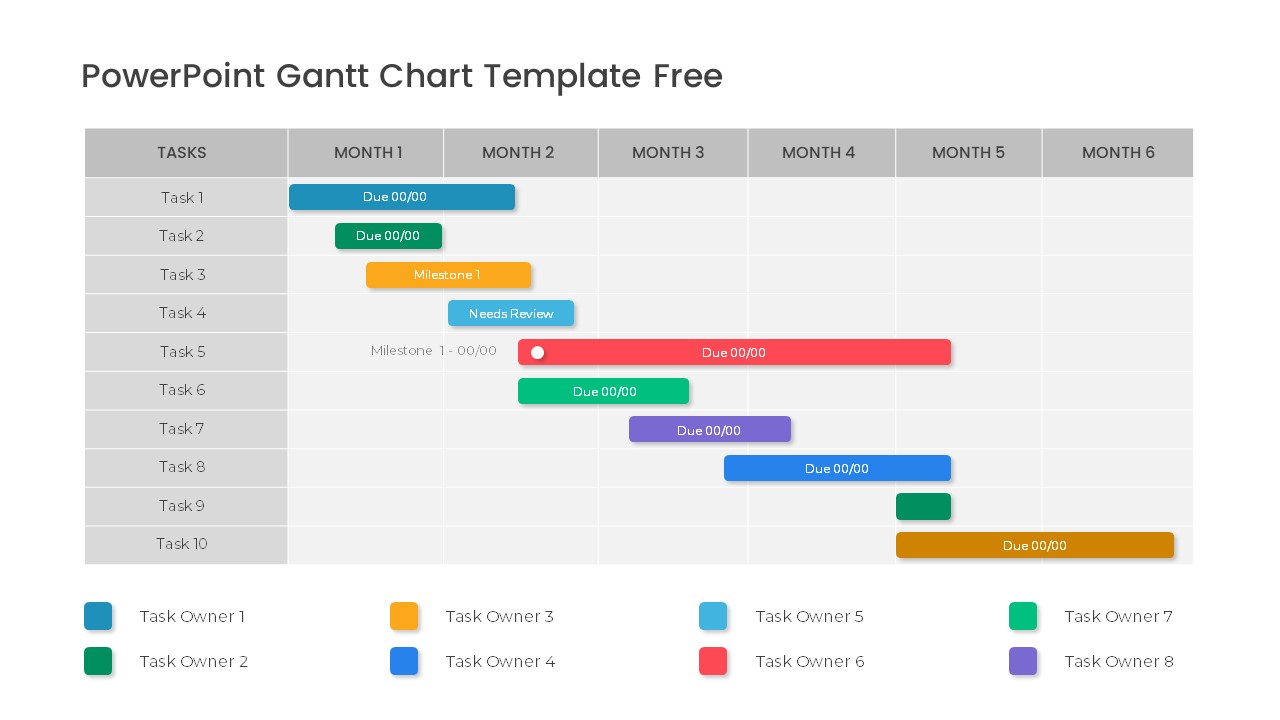
Free PowerPoint Gantt Chart Template
PowerPoint Charts
Free
-

Business Process Reengineering Template
PowerPoint Templates
Premium
-

Health Care PowerPoint Theme
PowerPoint Themes
Premium
-

Animated Upcoming Event Poster PowerPoint Template
PowerPoint Templates
Premium
-

Finance Consulting PowerPoint Template
PowerPoint Templates
Premium
-
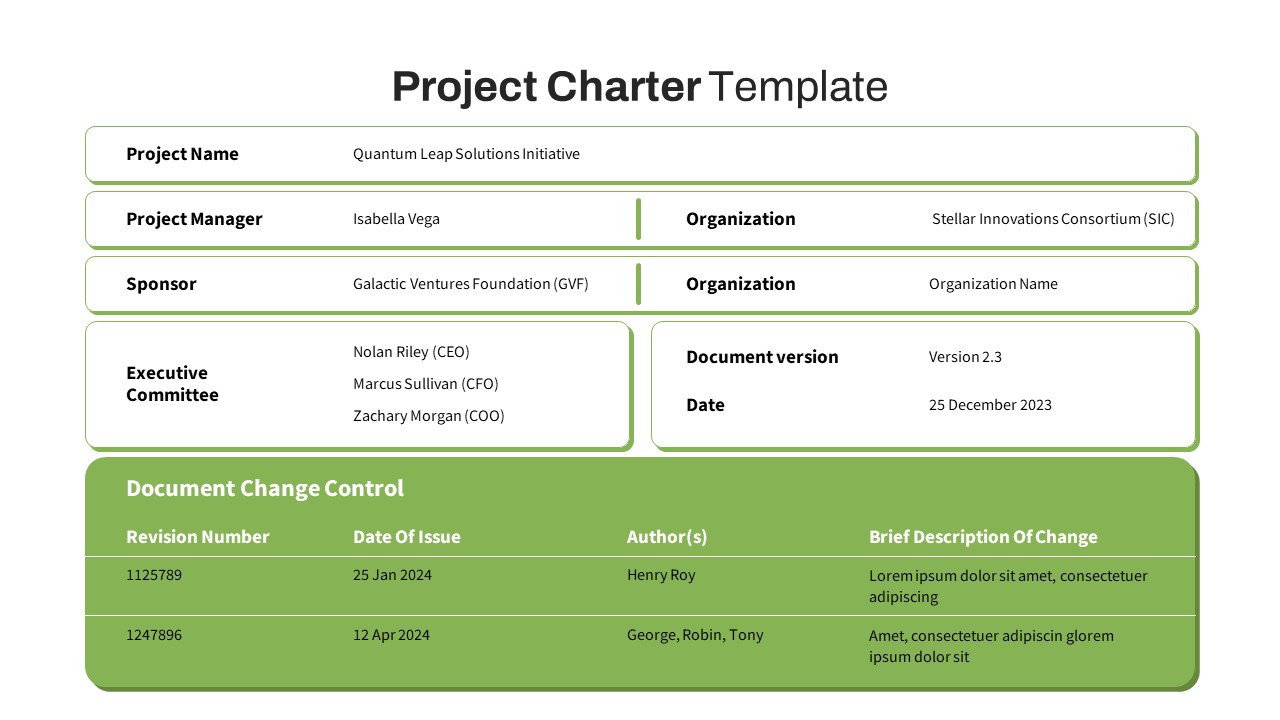
Free Project Charter PowerPoint Template
Free PowerPoint Templates
Free
-

Open Door Policy PowerPoint Template
PowerPoint Templates
Premium
-
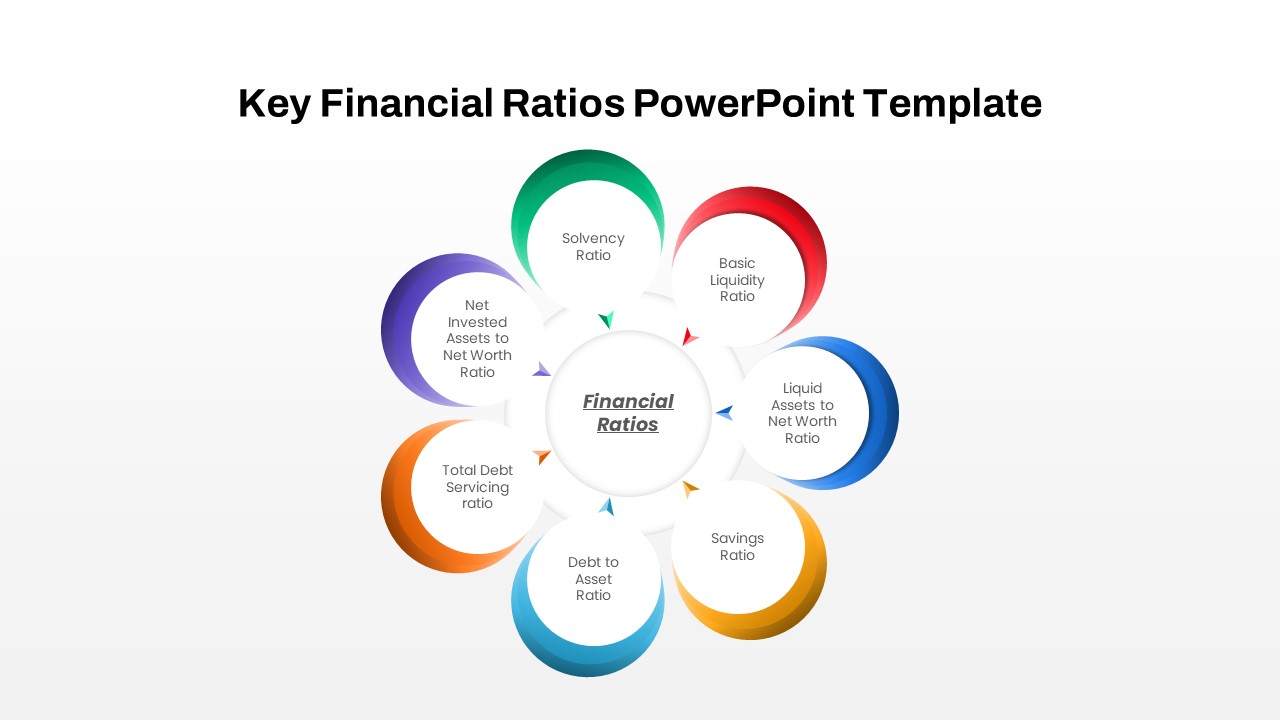
Key Financial Ratios PowerPoint Template
PowerPoint Templates
Premium
-
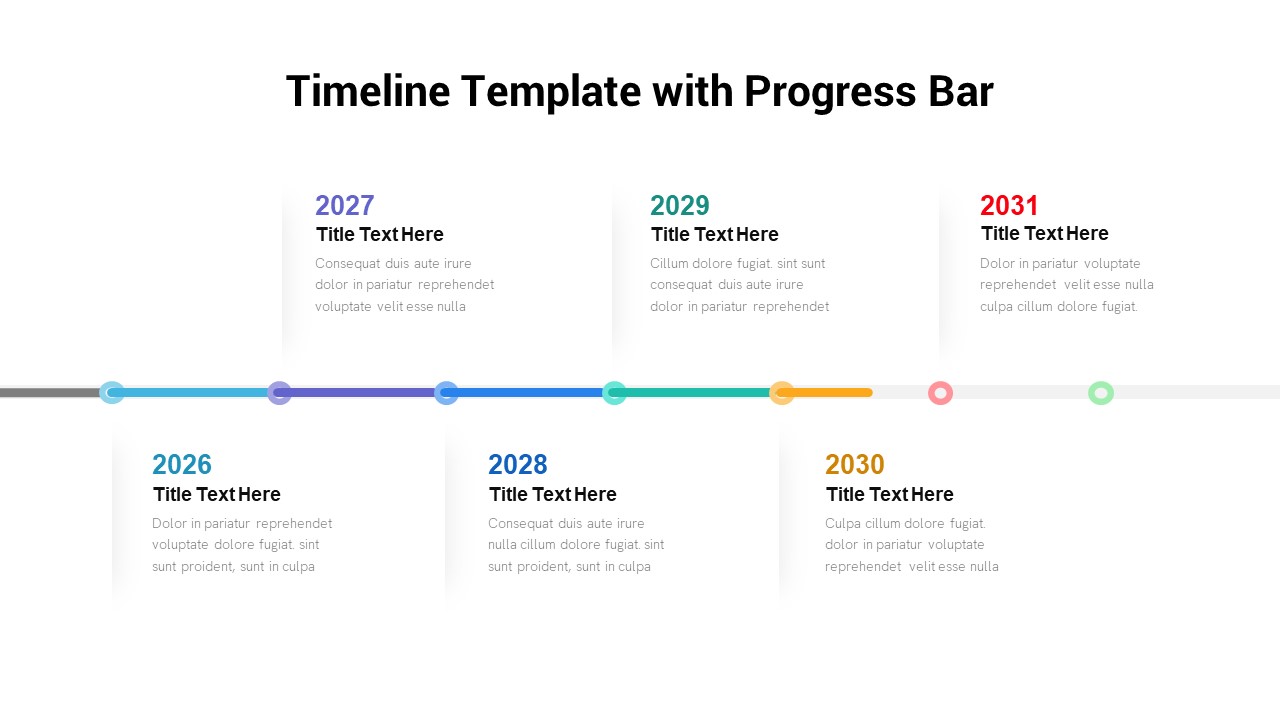
Progress Timeline Bar PowerPoint Template
Timeline PowerPoint Template
Premium
-
Financial Planning Process With Review and Monitor Template for PowerPoint & Keynote
Business Models
Premium
-

Area Chart PowerPoint Template
PowerPoint Charts
Premium
-
Spline Chart PowerPoint Template
PowerPoint Charts
Premium
-

Healthcare Presentation Template
PowerPoint Business Templates
Premium
-
High Level Timeline PowerPoint Template
Timeline PowerPoint Template
Premium
-

Healthcare PowerPoint Theme
PowerPoint Themes
Premium
-

Biotechnology PowerPoint Presentation Template
PowerPoint Templates
Premium
-
Milestone Chart PowerPoint
Timeline PowerPoint Template
Premium
-
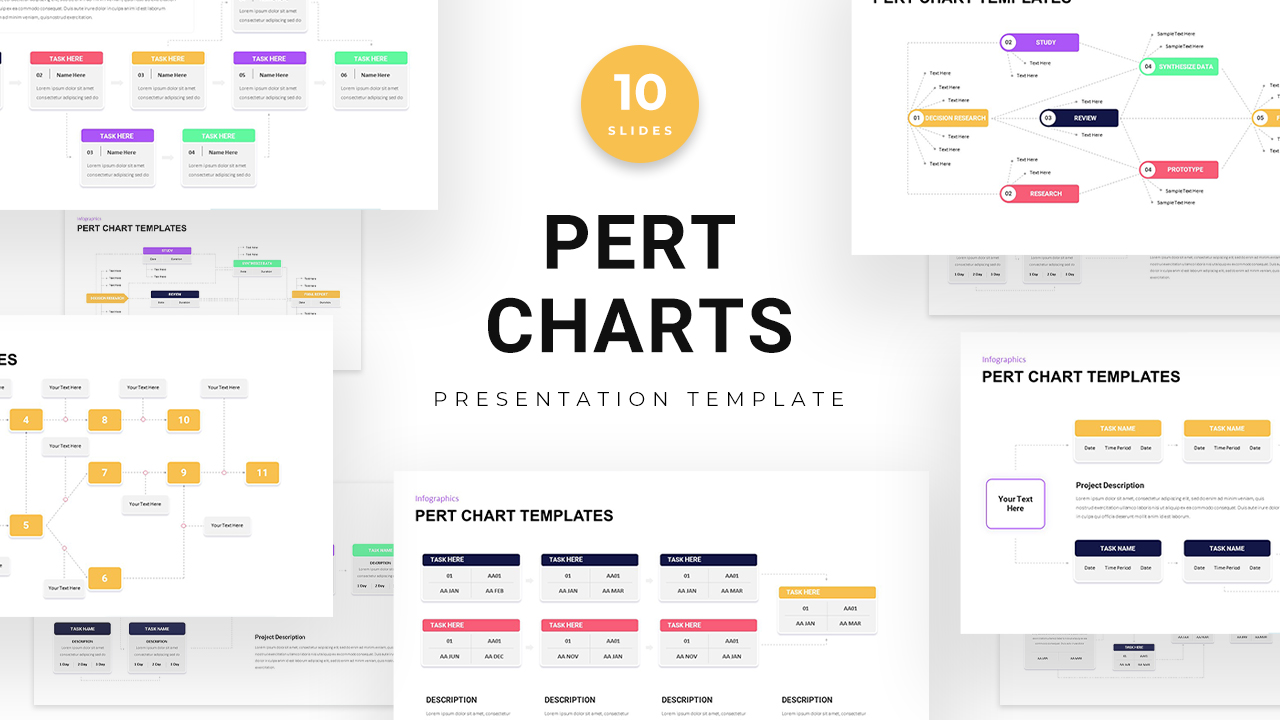
Pert Chart PowerPoint Templates
Diagrams
Premium
-
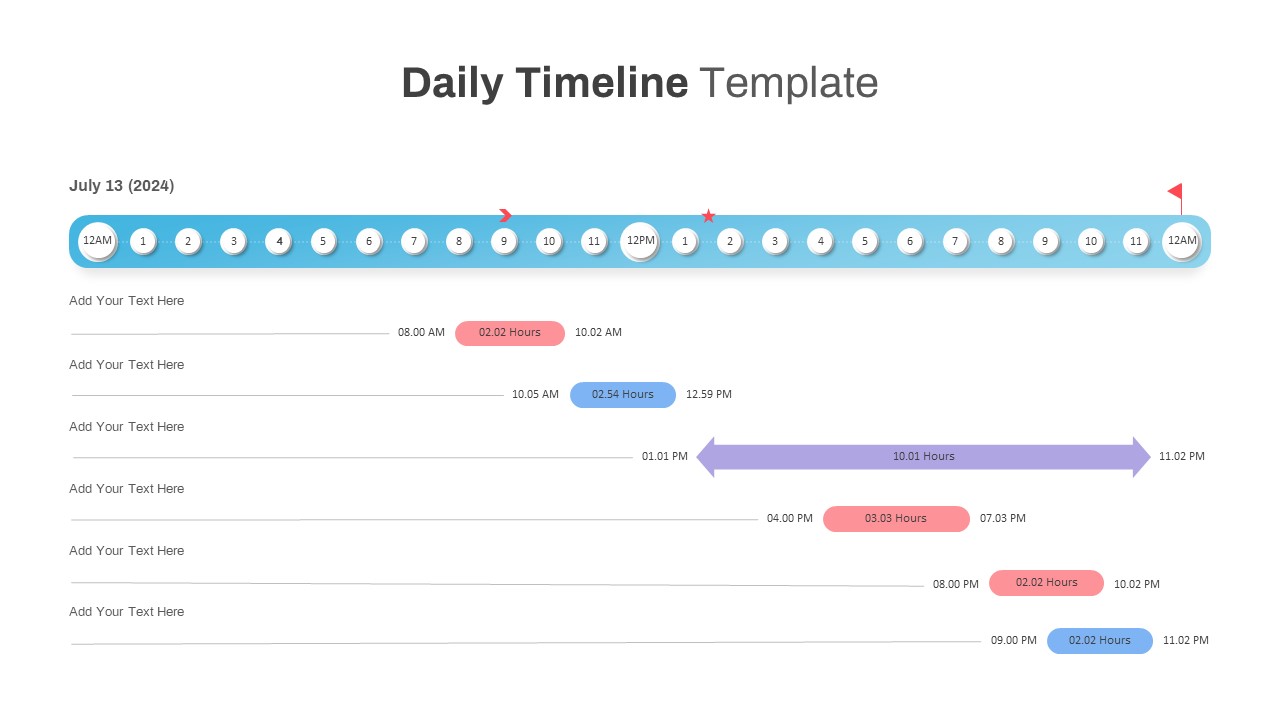
Daily Timeline Template PowerPoint
Timeline PowerPoint Template
Premium
-

Financial Report PowerPoint Template & Keynote
PowerPoint Templates
Premium
-
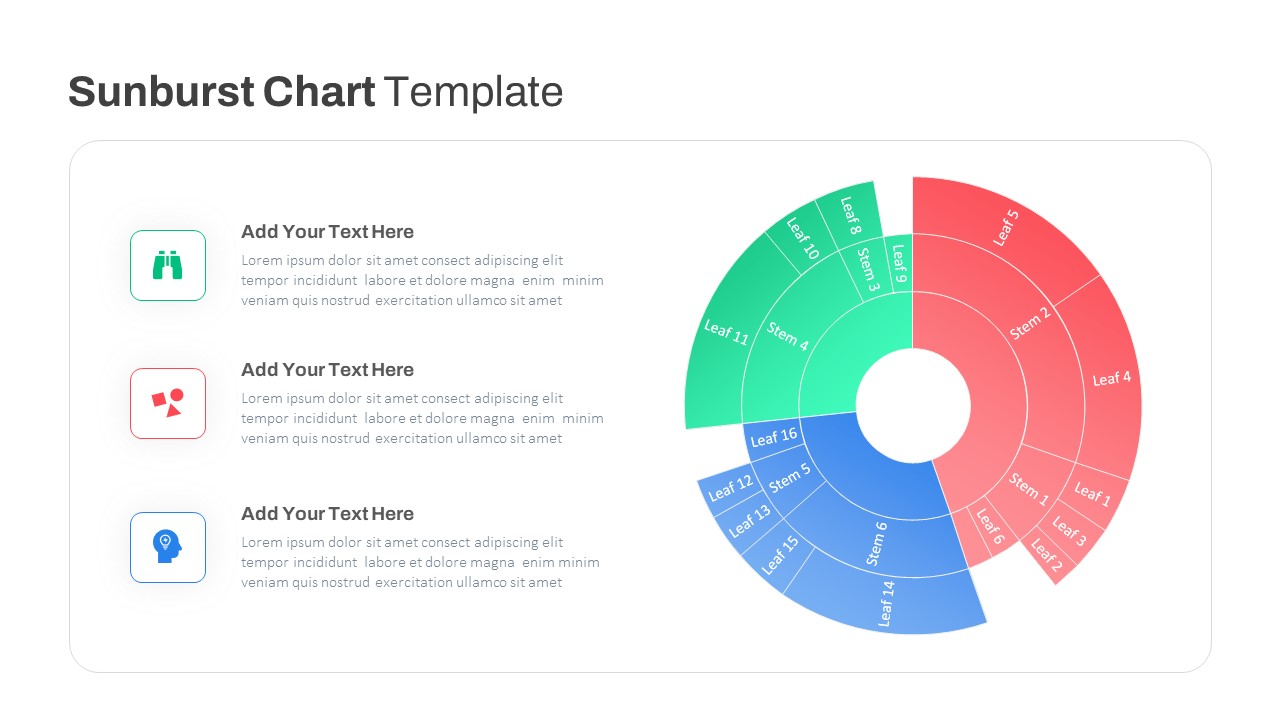
Sun Burst Chart PowerPoint Template
Circular Diagrams
Premium
-

Power Analogy Metaphor PowerPoint Template
Metaphor, Simile & Analogy
Premium
-
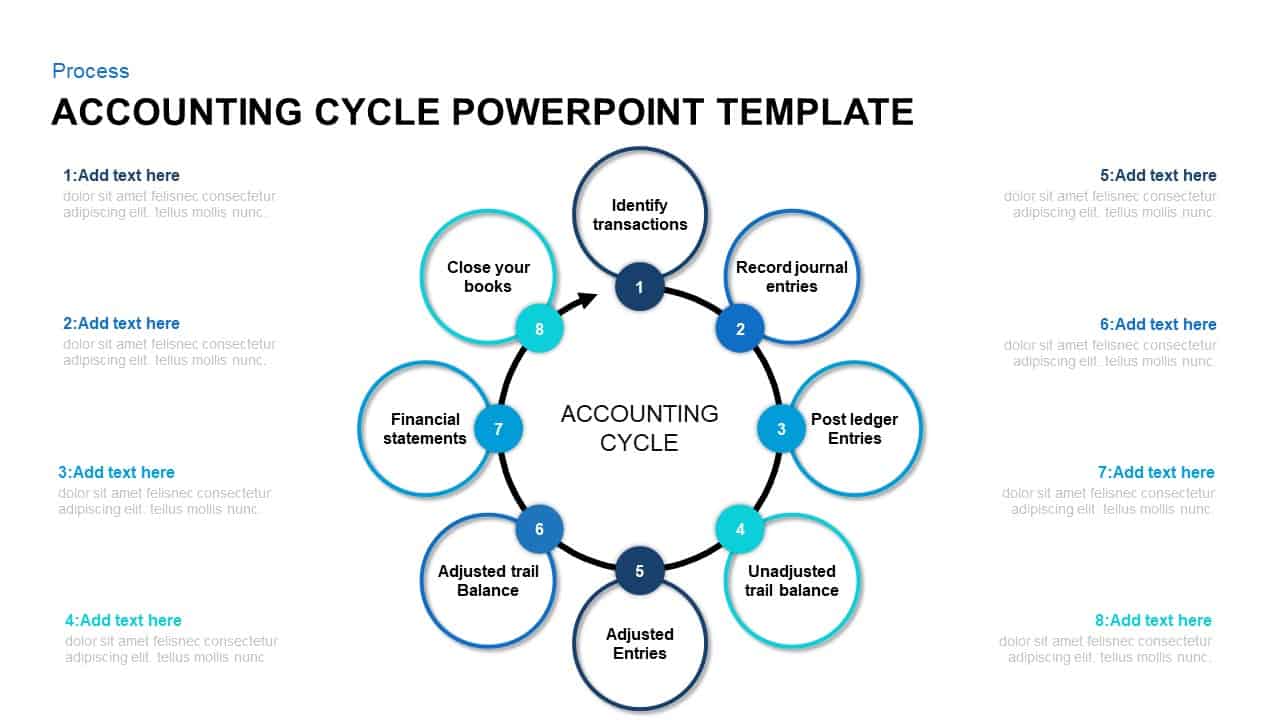
8 Step of Accounting Cycle PowerPoint Template
Circular Diagrams
Premium
-
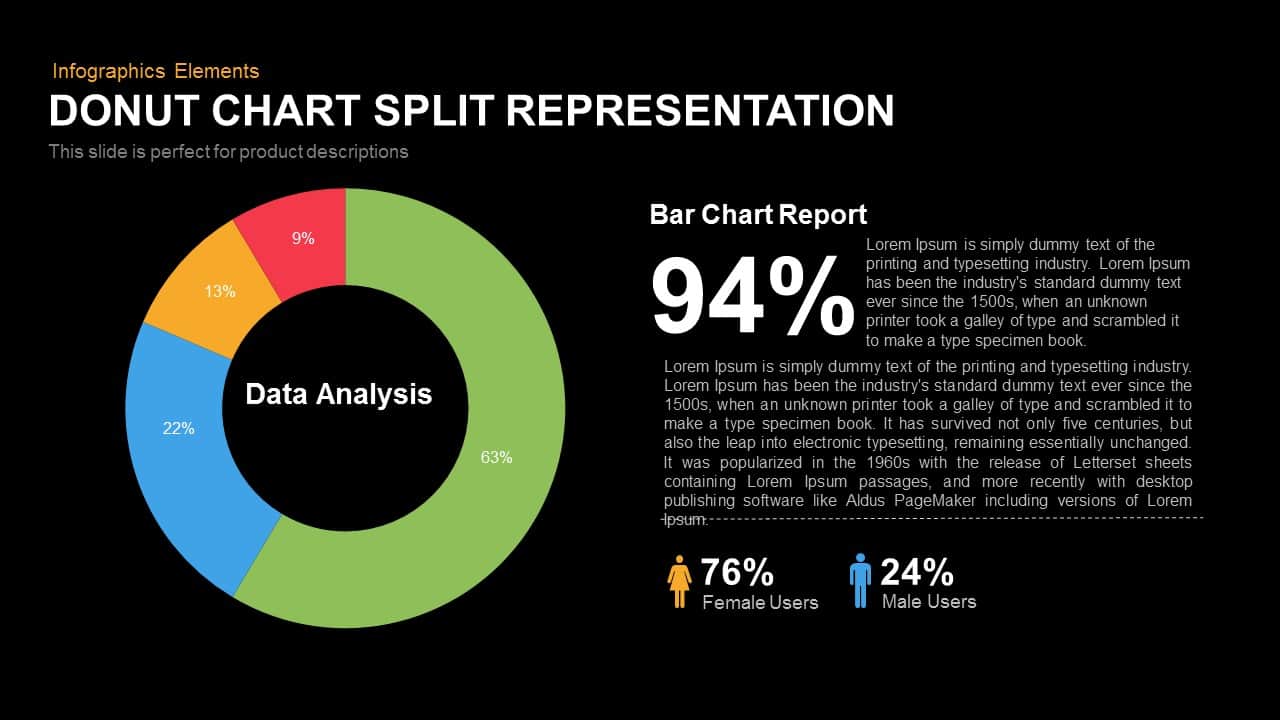
Split Representation Donut Chart Template for PowerPoint and Keynote
Keynote Templates
Premium
-
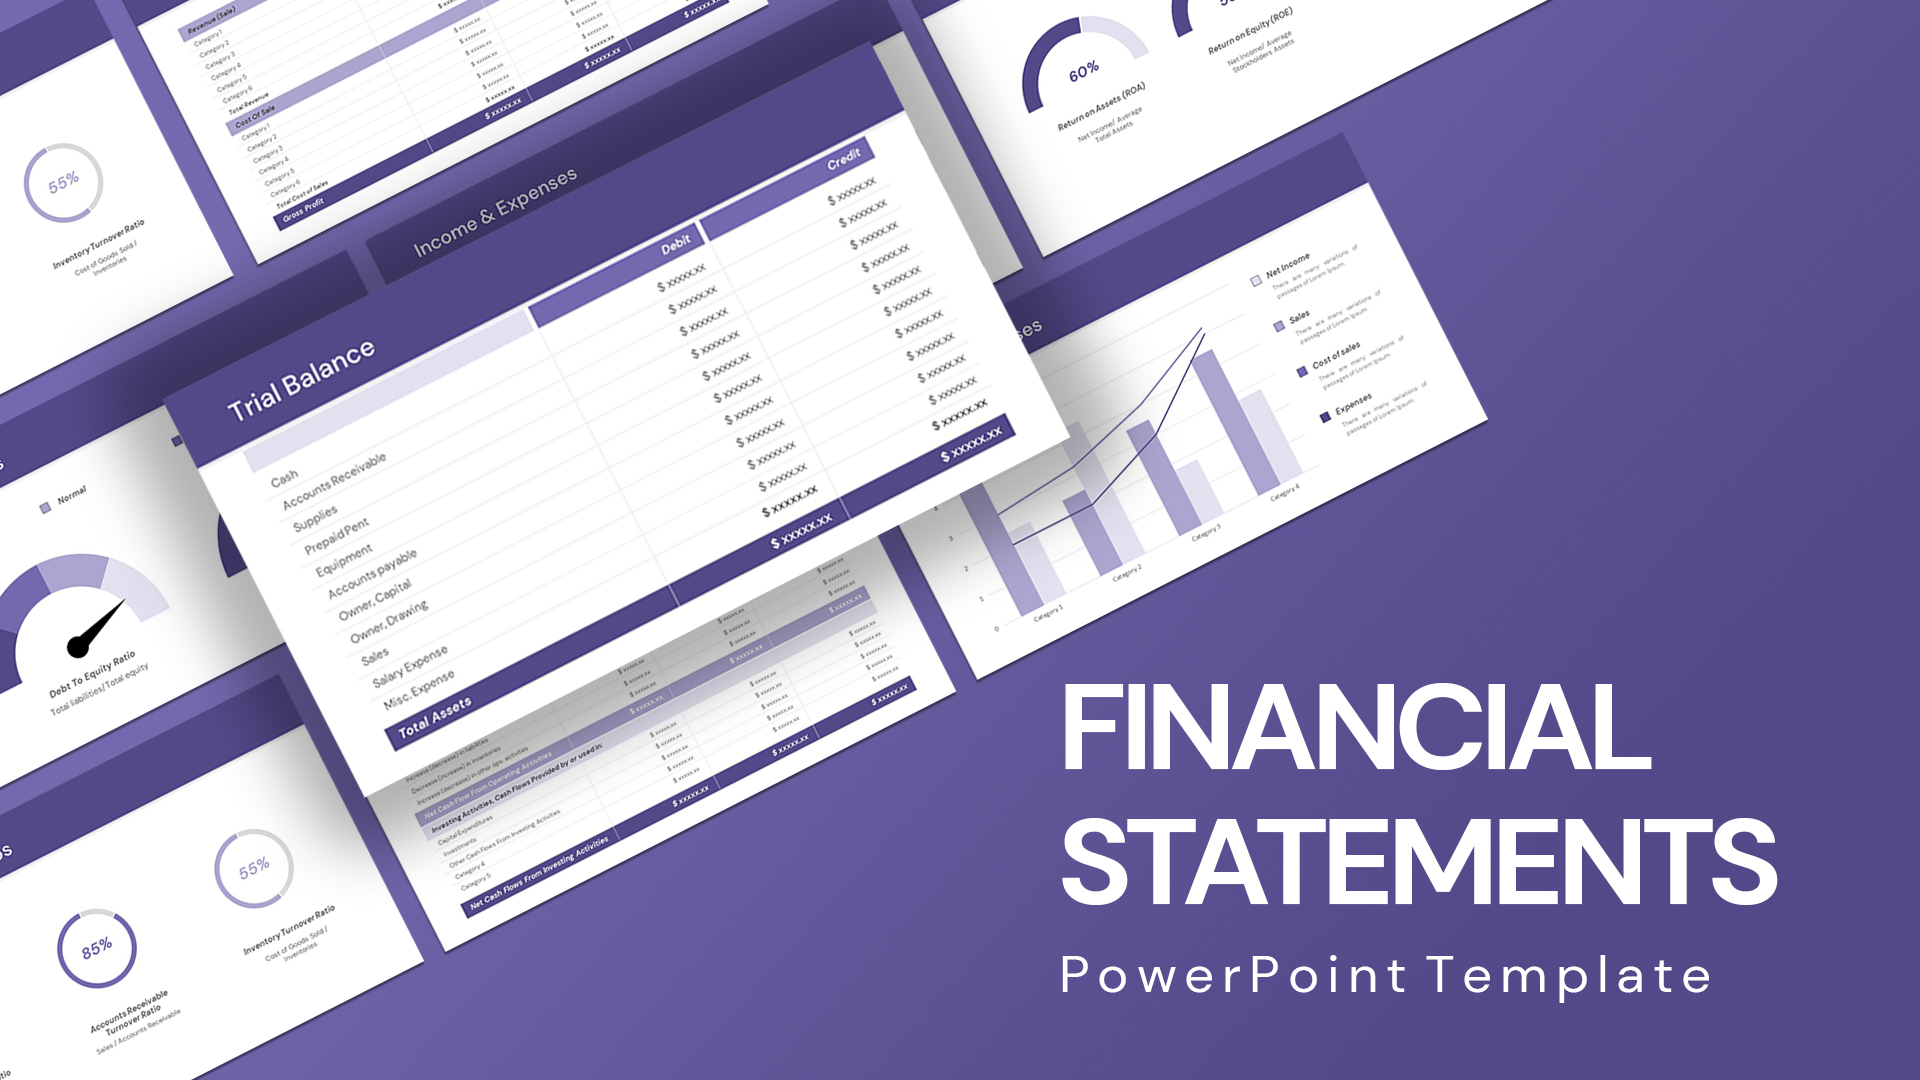
Financial Statement PowerPoint Template
PowerPoint Templates
Premium
-
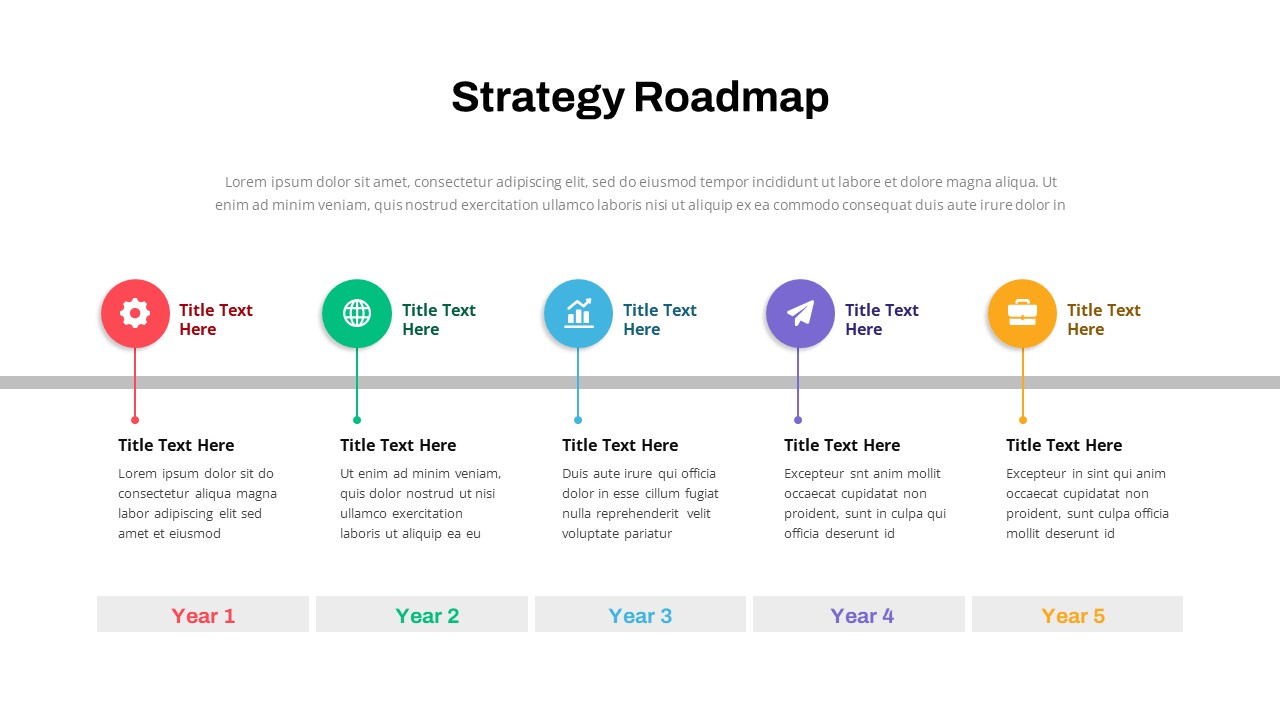
Data Strategy Roadmap PowerPoint Template
PowerPoint Templates
Premium
-
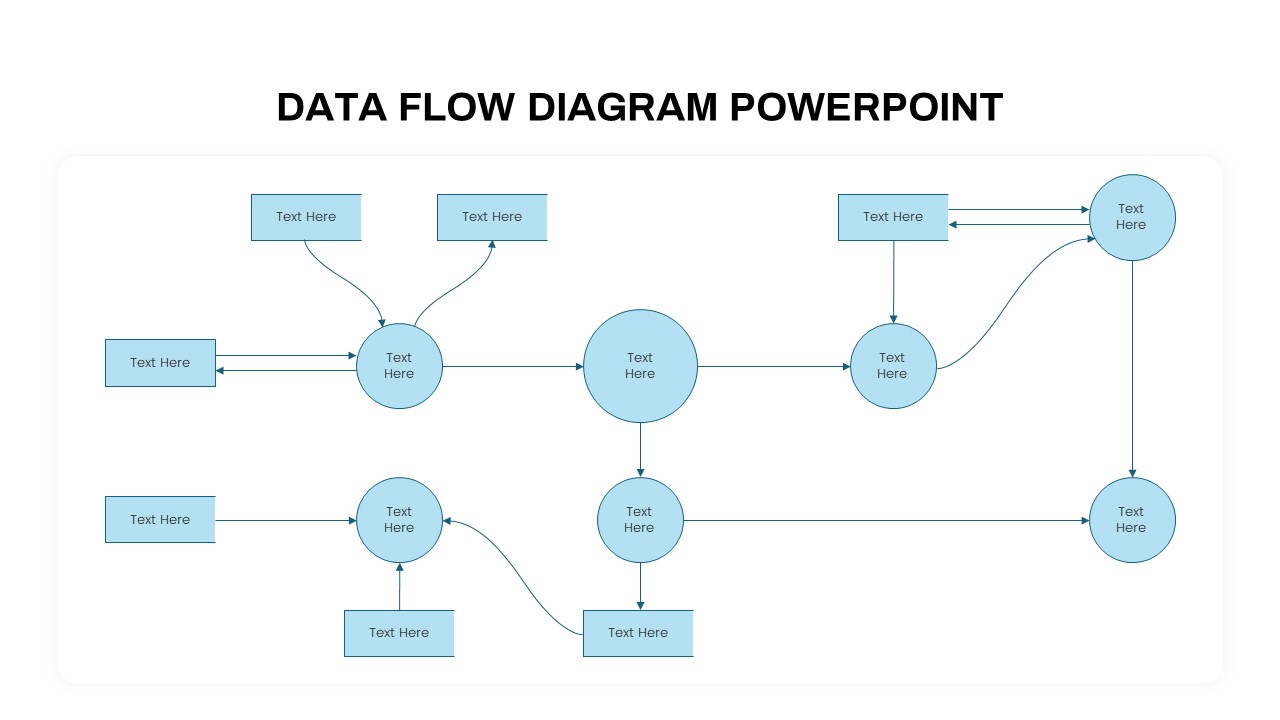
Data Flow PowerPoint Presentation Template
PowerPoint Templates
Premium
-

Financial Report Metaphor PowerPoint Presentation Template
Metaphor, Simile & Analogy
Premium
-
Project Management Dashboard PowerPoint Template and Keynote Template
PowerPoint Templates
Premium
-
Kaizen Pick Chart PowerPoint Template
PowerPoint Templates
Premium
-

Mekko Chart Template
PowerPoint Templates
Premium
-
Cone Chart PowerPoint Template
Column and Bar chart
Premium
-
Vaccination PowerPoint Template
PowerPoint Templates
Premium
-
3D Printing Deck PowerPoint Template
PowerPoint Templates
Premium
-

Proportional Area Chart PowerPoint Template
PowerPoint Templates
Premium
-

Free Animated Medical PowerPoint Template
PowerPoint Templates
Free
-
Segmented Scatter Chart PowerPoint Template
PowerPoint Charts
Premium
-
Project Management Presentation Template
PowerPoint Business Templates
Premium
-
Stacked Area Chart PowerPoint Template
PowerPoint Charts
Premium
-
Free PowerPoint Book Template
Free slides
Free
-

Free Charts and Graphs PowerPoint Template
PowerPoint Templates
Free
-
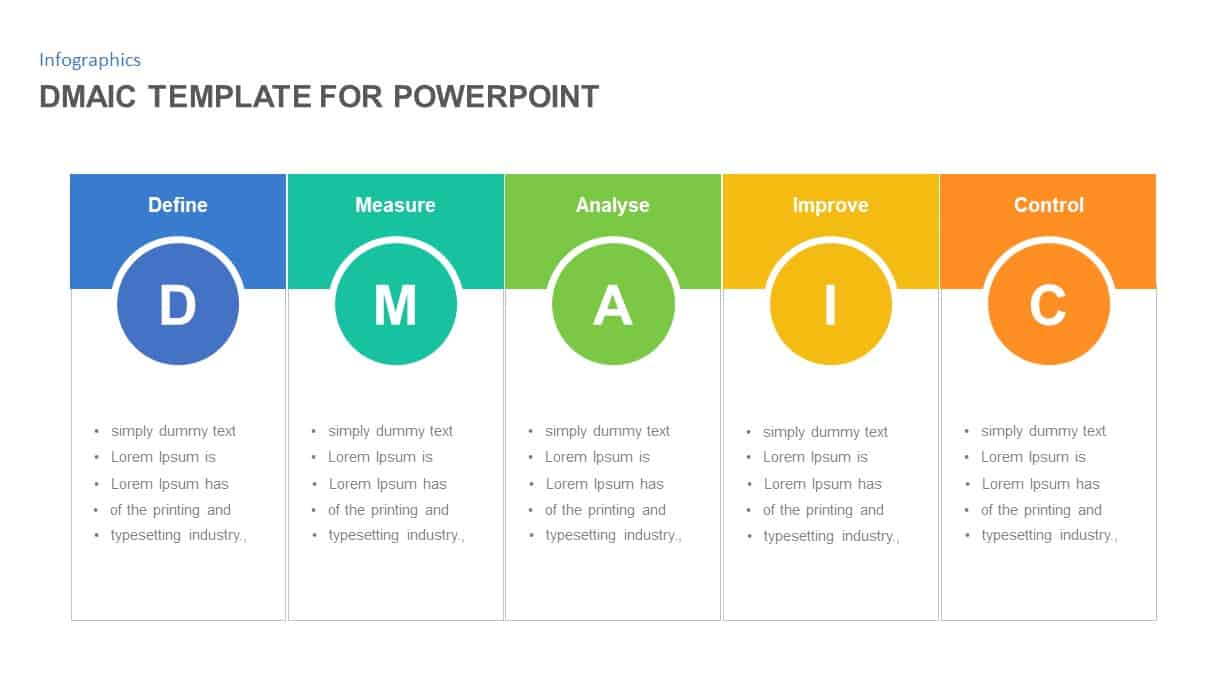
DMAIC PowerPoint Template
Business Models
Premium
-
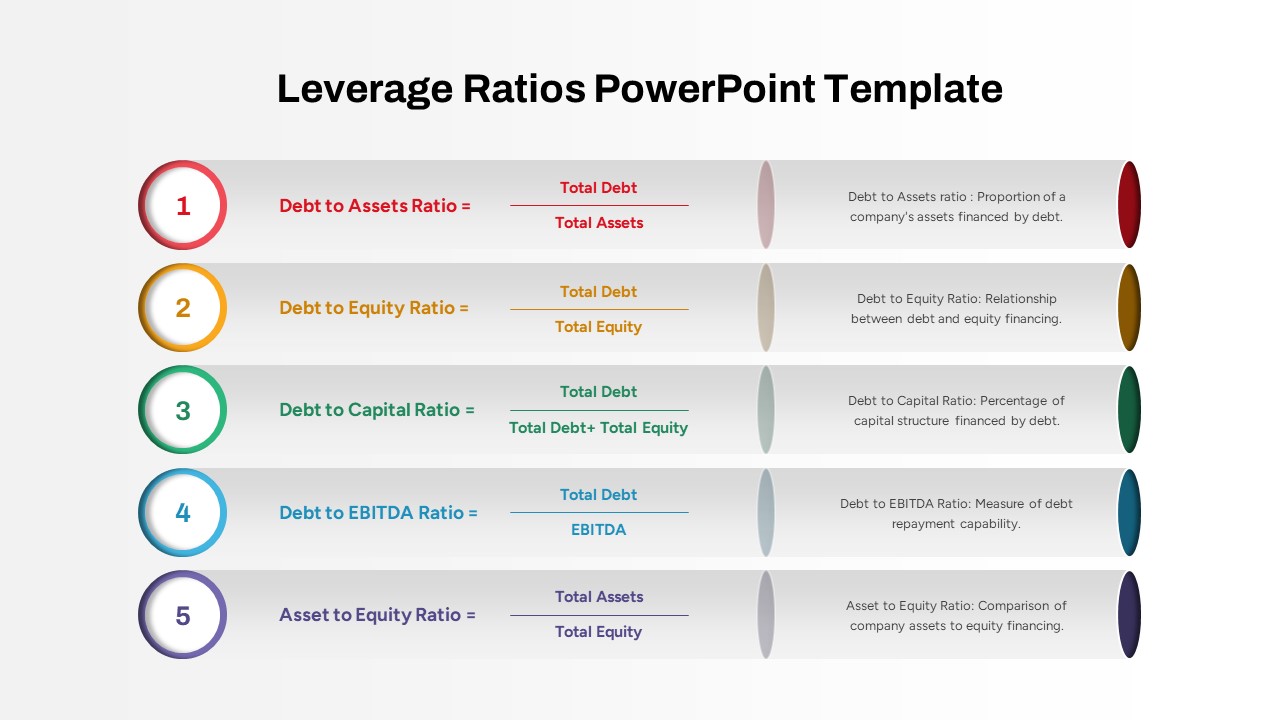
Leverage Ratios PowerPoint Template
PowerPoint Templates
Premium
-

Corporate Deck PPT
PowerPoint Business Templates
Premium
-

Free Finance Deck PowerPoint Template
PowerPoint Templates
Free
-

Combination Chart PowerPoint Template
PowerPoint Charts
Premium
-
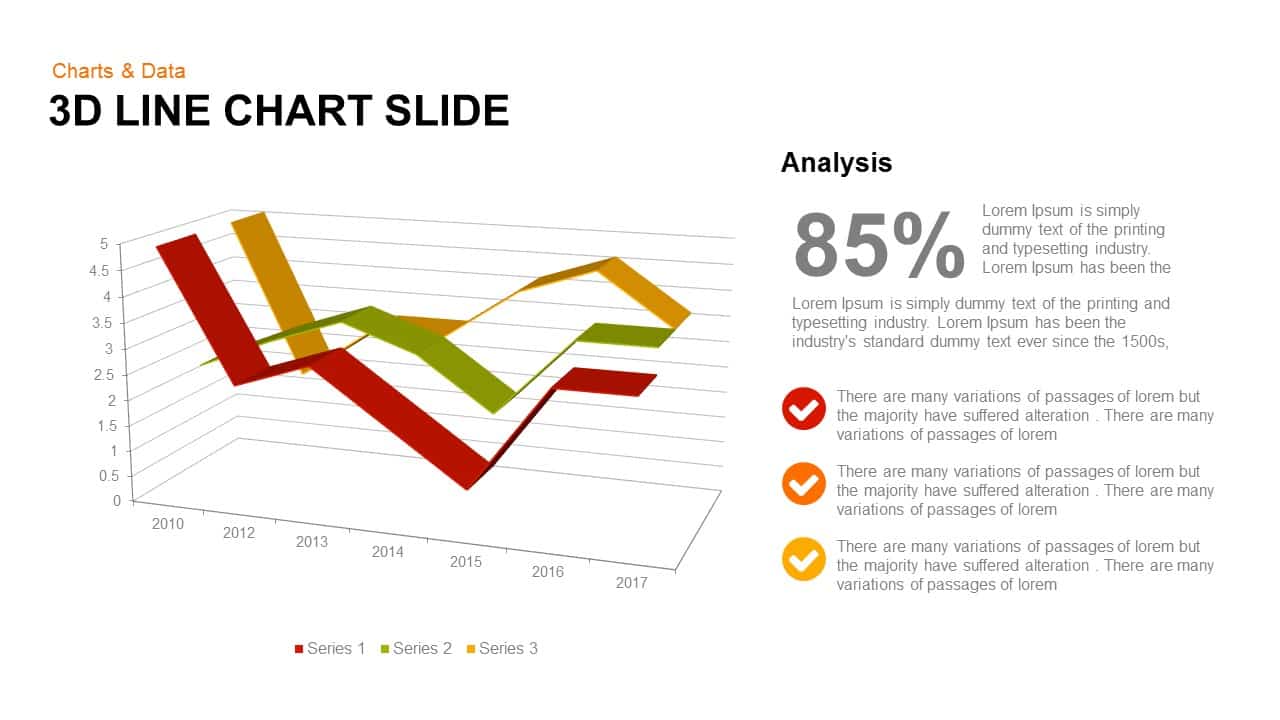
3d Line Chart PowerPoint Template and Keynote Slide
3D Shapes
Premium
-
Project Roadmap PowerPoint Template
PowerPoint Templates
Premium
-

Multipurpose Business PowerPoint Template
PowerPoint Business Templates
Premium
-
Mirror Bar Chart PowerPoint Template
PowerPoint Templates
Premium
-

Animated Clustered Bar Chart PowerPoint Template
PowerPoint Charts
Premium
-

Free Teacher’s Week Plan PowerPoint Template
PowerPoint Templates
Free
-
Jump Line Chart PowerPoint Template
Column and Bar chart
Premium
-
Gantt Chart in PPT Template
Infographic
Premium
-
Steps PowerPoint Template Free
Free PowerPoint Templates
Free
-
Simple Bar Chart PowerPoint Template
Column and Bar chart
Premium
-

Corporate PowerPoint Presentation Template
PowerPoint Business Templates
Premium
-
Cost Comparison PowerPoint Template
PowerPoint Templates
Premium
-
Free Balanced Scorecard PowerPoint Template
PowerPoint Business Templates
Free
-
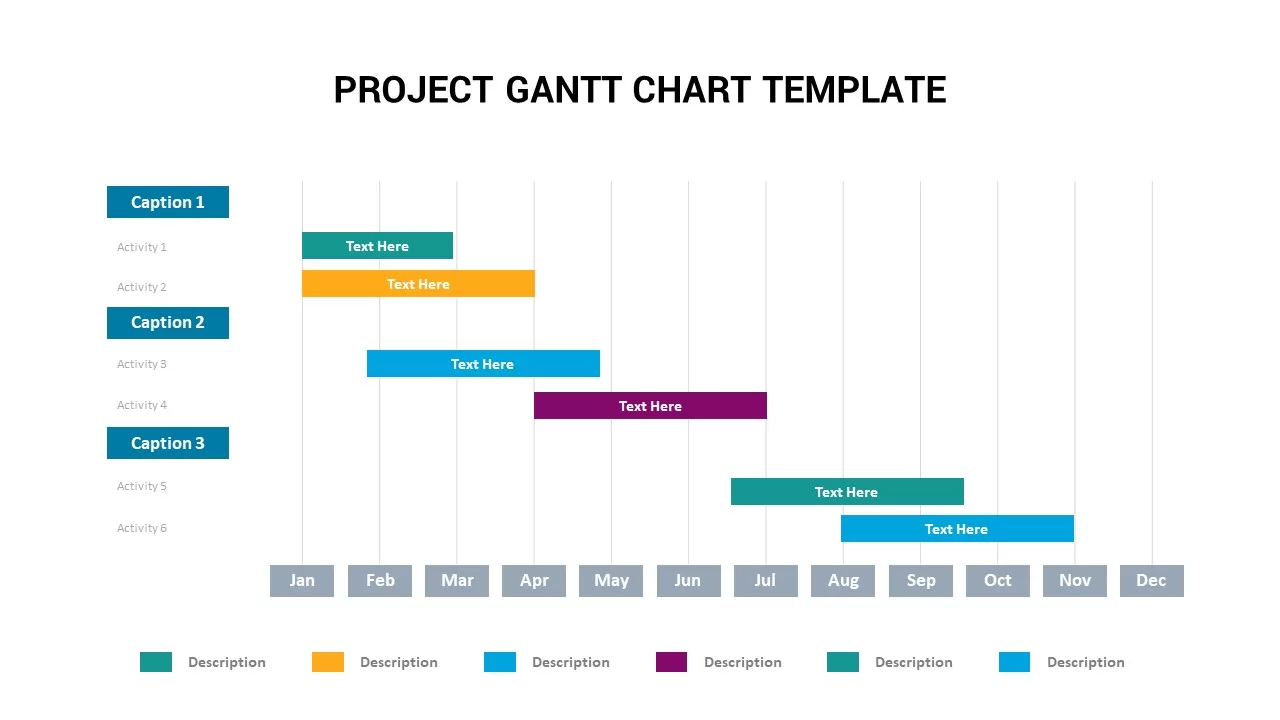
Project Gantt Chart Infographics PowerPoint Template
Infographic
Premium
-
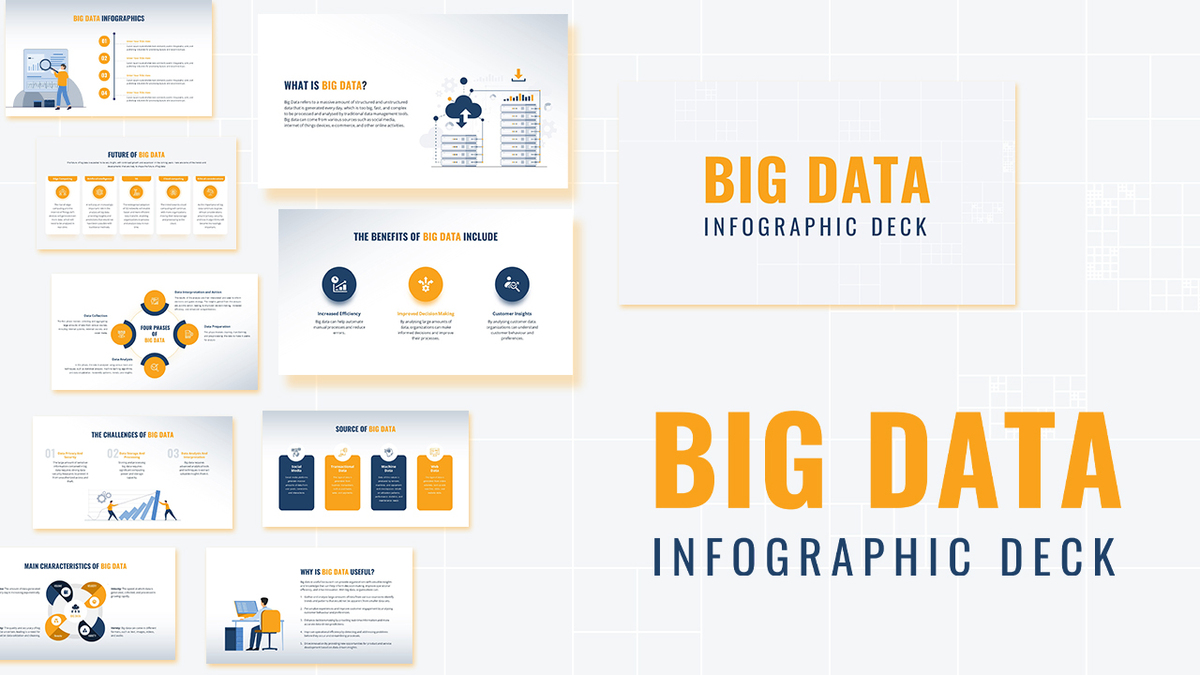
Big Data Infographic Deck For PowerPoint
PowerPoint Business Templates
Premium