


Polynomial Combination Chart PowerPoint Template and Keynote Slide


- Version
- Download 344
- File Size 0.00 KB
- File Count 1
- Create Date February 24, 2016
- Last Updated February 15, 2024
Polynomial Combination Chart PowerPoint Template and Keynote Slide
Polynomial Combination Chart PowerPoint Template and Keynote Slide
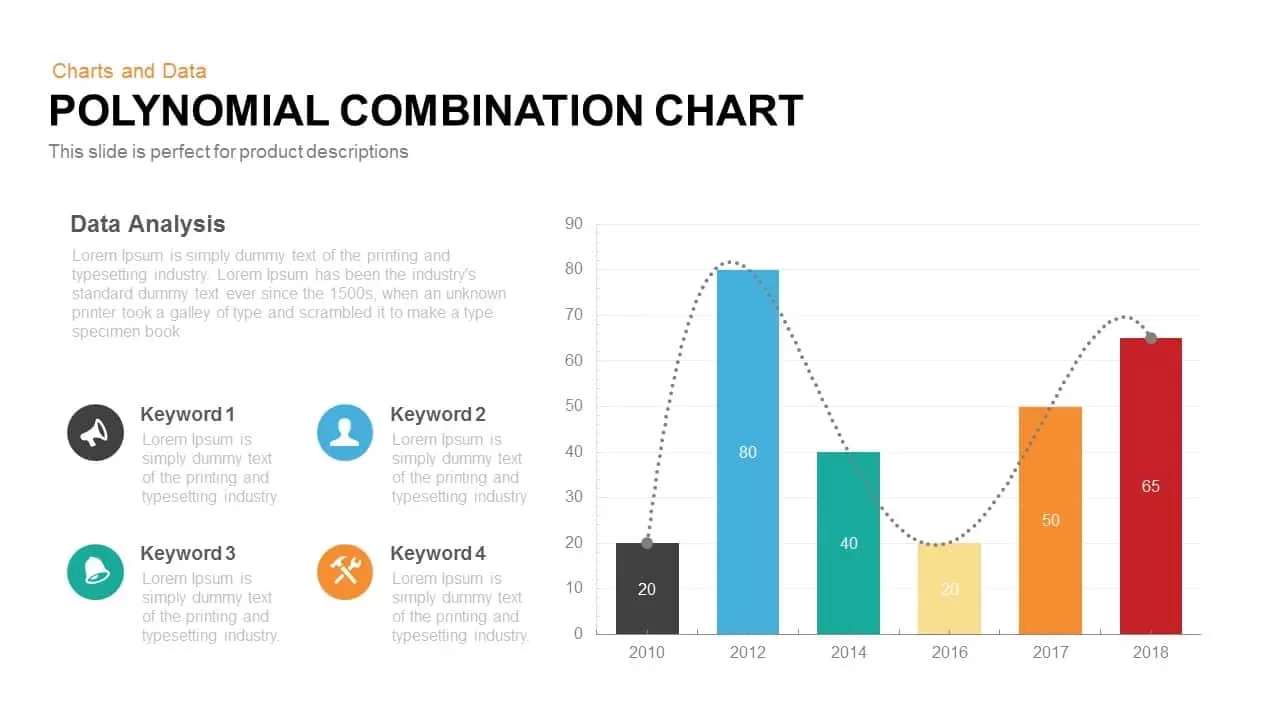
Polynomial combination chart PowerPoint template and keynote is a statistical device to show the trends of data over the periods. Basically, the polynomial chart functions as a smooth continuous curve. The curves of the graph represent the up and down movements of an event. The main aspect of this type of graph is that you can use to help put the curve together. The polynomial graph chart PowerPoint is used to show the possible number of turning points. The business professionals and researchers can use this polynomial chart template to convey more accurate information through graphical representation. Use the leading coefficient test to find the end behavior of the sales and marketing strategies.
This polynomial chart for PowerPoint template presentation shows the highest and lowest values by a dotted line graph and bar graph. Polynomial Combination Chart PowerPoint template is fashioned in the form of a bar graph which can be well used to show statistics, figures or numerical data attained over the years; best used to represent the financial returns, profit and loss since the initiation of business. The template has six bars of varying heights and colors and you may represent each according to your choice. One axis of the Polynomial Combination Chart has years as variants and the other has numbers as variants. A dotted line emerges from the first bar connecting all the bars and rests at the last bar. On the left side of the design, there is sufficient space to write report according to the idea or subject you want to depict through the presentation. The template is available in the black and white background and you may pick the subject to be revealed through this Polynomial Combination Chart PowerPoint Keynote template for your presentation.
The customizable bar charts and graph PowerPoint colored attractively, so the viewers can easily extract the presentation theme and its data. Additionally, users can change or alter the length of the bars in accordance with the data in hand. The numbers and the background color is also changeable. For more statistical tools just go through our categories and download suitable PowerPoint templates.
Attached Files
| File |
|---|
| https://premiumdownloads.s3.amazonaws.com/SB00207-Polynomial-Combination-Chart.zip |
Login to download this file
Add to favorites
Add to collection
-

Category
-

Item ID
SB00207 -

Related Templates
-

Sales Deck Free PowerPoint Template
PowerPoint Templates
Free
-

Nature PowerPoint Presentation Template
PowerPoint Business Templates
Premium
-

Free Nursing Capstone PowerPoint Deck
PowerPoint Templates
Free
-

Cab Service PowerPoint Template
PowerPoint Templates
Premium
-

Free Vertical PowerPoint Template
PowerPoint Business Templates
Free
-

Research Proposal PowerPoint Template
PowerPoint Templates
Premium
-

VET Clinic PowerPoint Template
PowerPoint Templates
Premium
-

Gym PowerPoint Template
PowerPoint Templates
Premium
-

Free Space Minimal Deck Template
PowerPoint Templates
Free
-

Free Physical Education PowerPoint Template Deck
Free PowerPoint Templates
Free
-

Travel Agency PowerPoint Template
PowerPoint Templates
Premium
-

IoT Presentation Template
PowerPoint Templates
Premium
-

Effective Communication PowerPoint Template
PowerPoint Templates
Premium
-

Graph Paper PowerPoint Template Deck
PowerPoint Templates
Premium
-

PowerPoint Quiz With Timer
PowerPoint Templates
Premium
-

Pencil Bar Chart PowerPoint Template and Keynote Slide
Column and Bar chart
Premium
-

Macroeconomics PowerPoint Template
PowerPoint Templates
Premium
-
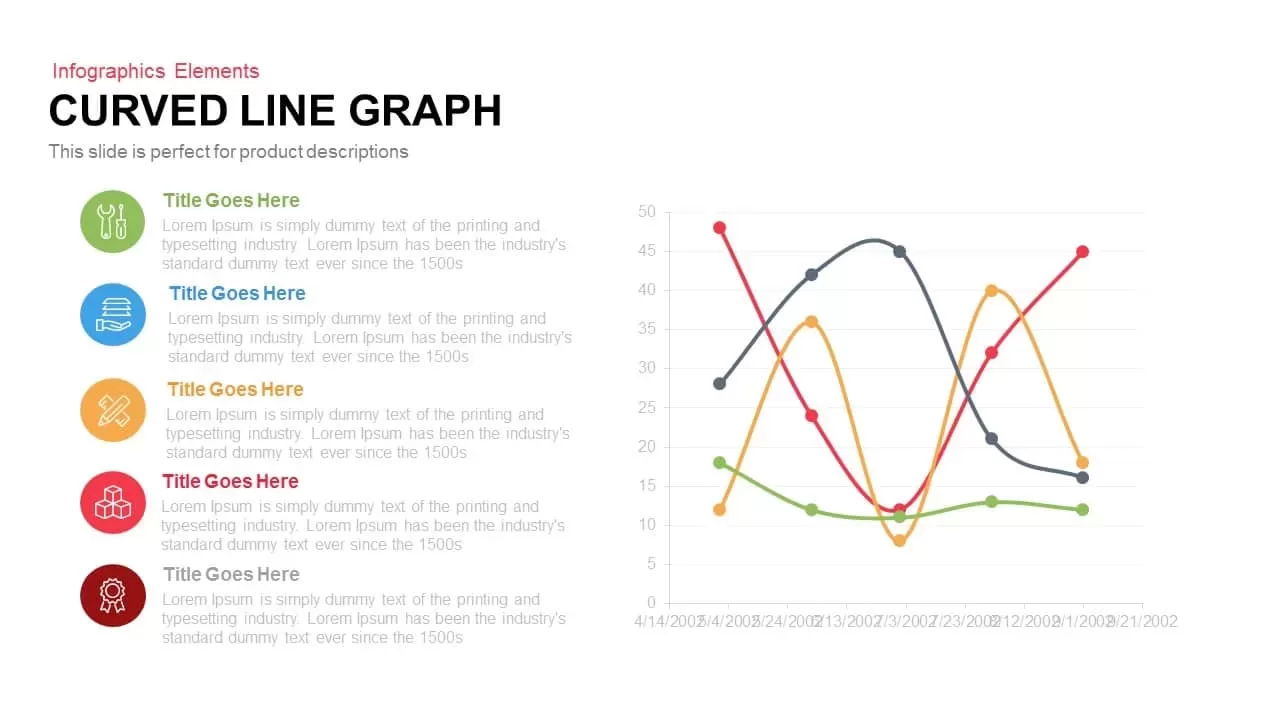
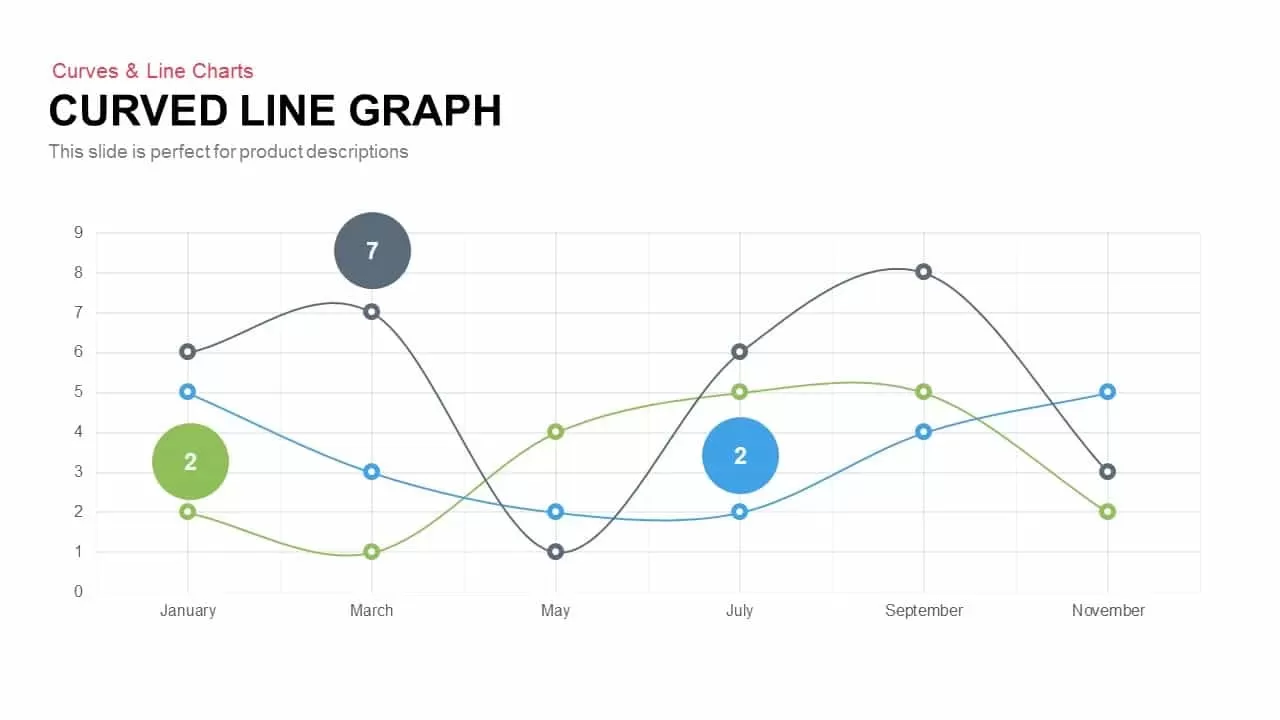
Curved Line Graph PowerPoint Template and Keynote Slide
Curves and Lines
Premium
-

Free Economics PowerPoint Template
Free PowerPoint Templates
Free
-
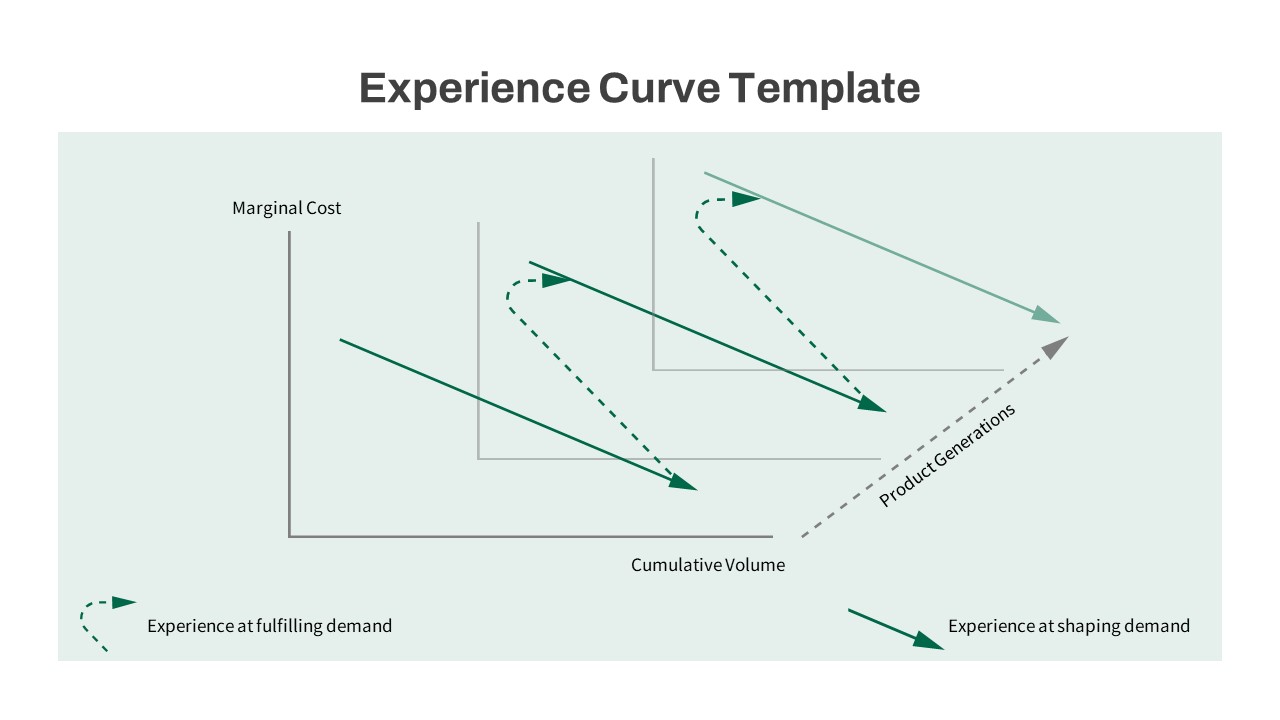
Experience Curve PowerPoint Template
Keynote Templates
Premium
-

Free Aviation PowerPoint Template
Free PowerPoint Templates
Free
-
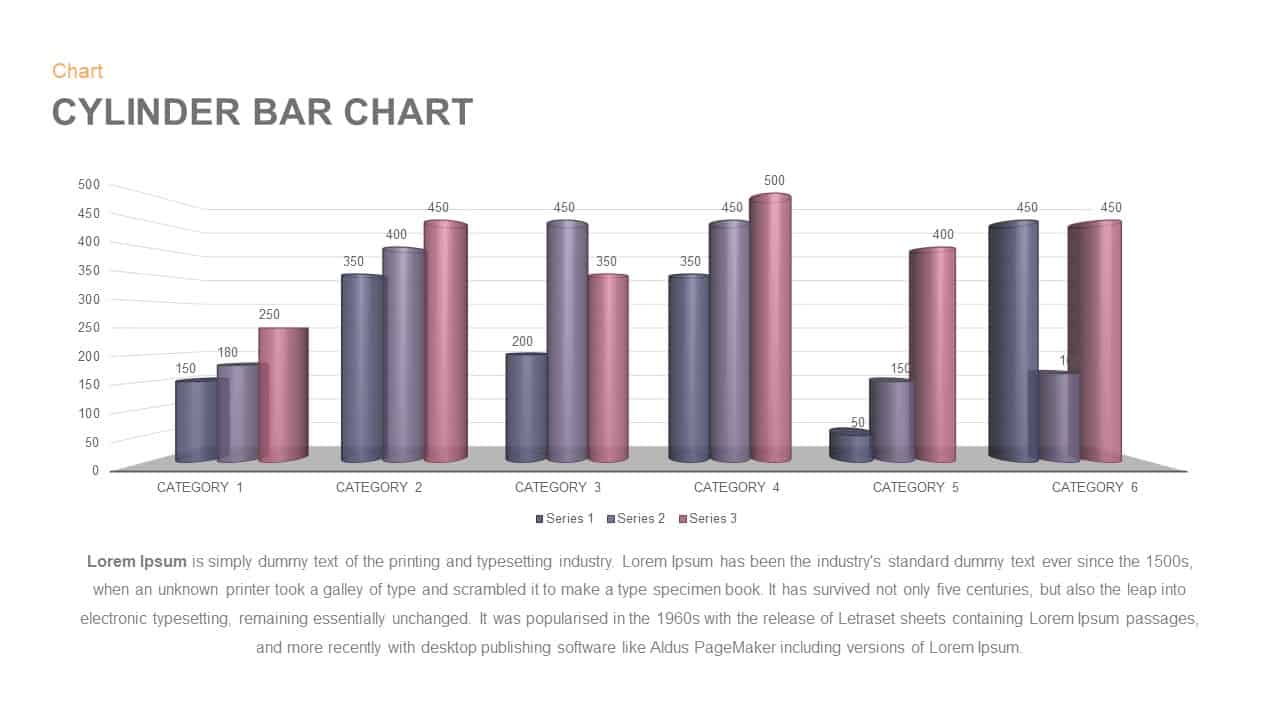
Cylinder Bar Chart PowerPoint Template and Keynote Slide
Column and Bar chart
Premium
-

Free Cartoon PowerPoint Template
Free PowerPoint Templates
Free
-

Customer Experience Loyalty PowerPoint Deck Template
PowerPoint Templates
Premium
-

Free Army PowerPoint Template
PowerPoint Templates
Free
-

Free Charity PowerPoint Template Deck
PowerPoint Templates
Free
-
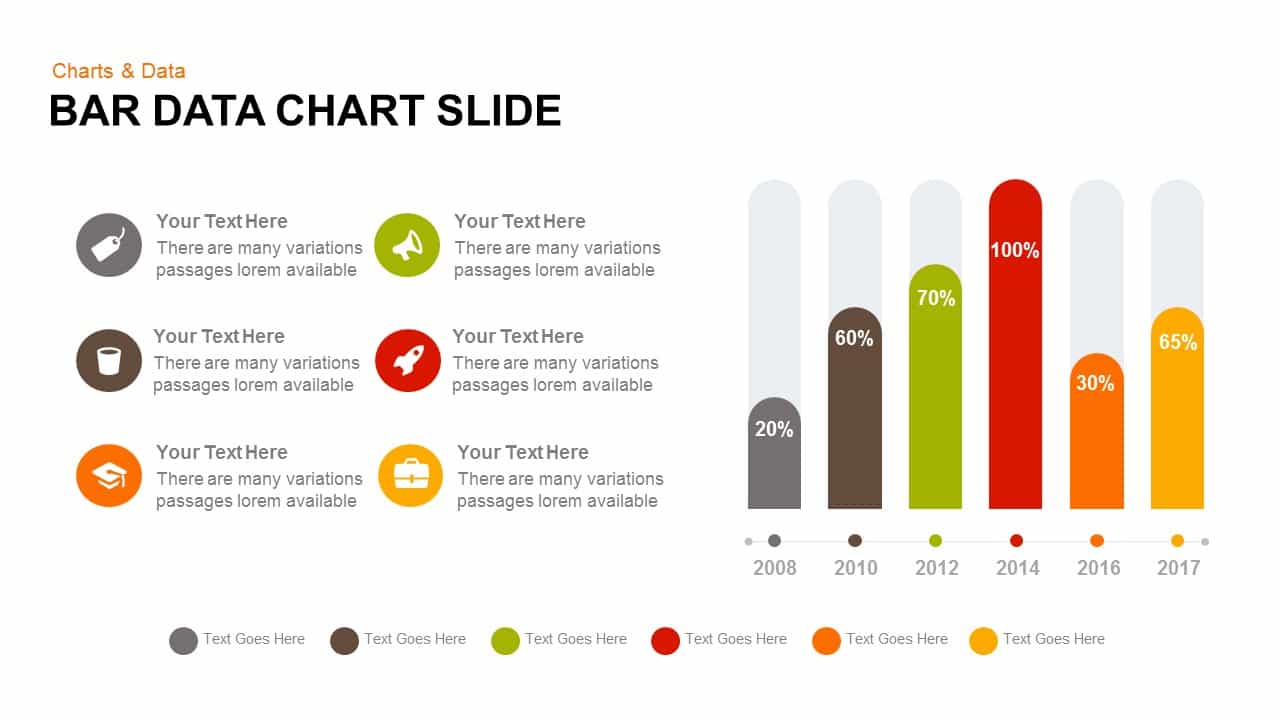
Data Bar Chart Template for PowerPoint and Keynote
Column and Bar chart
Premium
-

Combination Chart PowerPoint Template
PowerPoint Charts
Premium
-

Creative Bar Chart Data Analysis PowerPoint Template and Keynote
Infographic
Premium
-
Curved Line Graph PowerPoint Template and Keynote
Curves and Lines
Premium
-

Annual Report PowerPoint Template and Keynote
PowerPoint Templates
Premium
-

Free Real Estate Listing PowerPoint Template
Free PowerPoint Templates
Free
-
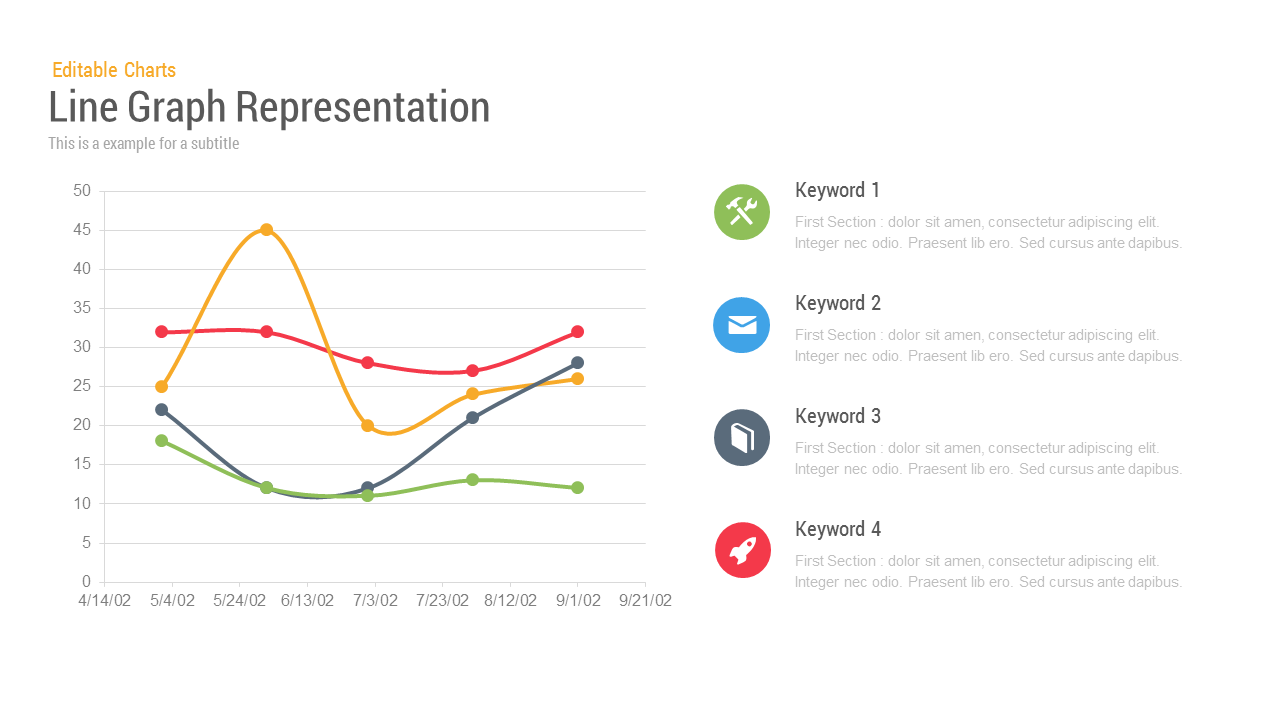
Line Chart Representation PowerPoint Templates and Keynote Slides
PowerPoint Charts
Premium
-
Sample Bar Chart Template for PowerPoint and Keynote Presentation
Column and Bar chart
Premium
-

Animated Agriculture PowerPoint Deck Template
PowerPoint Templates
Premium
-
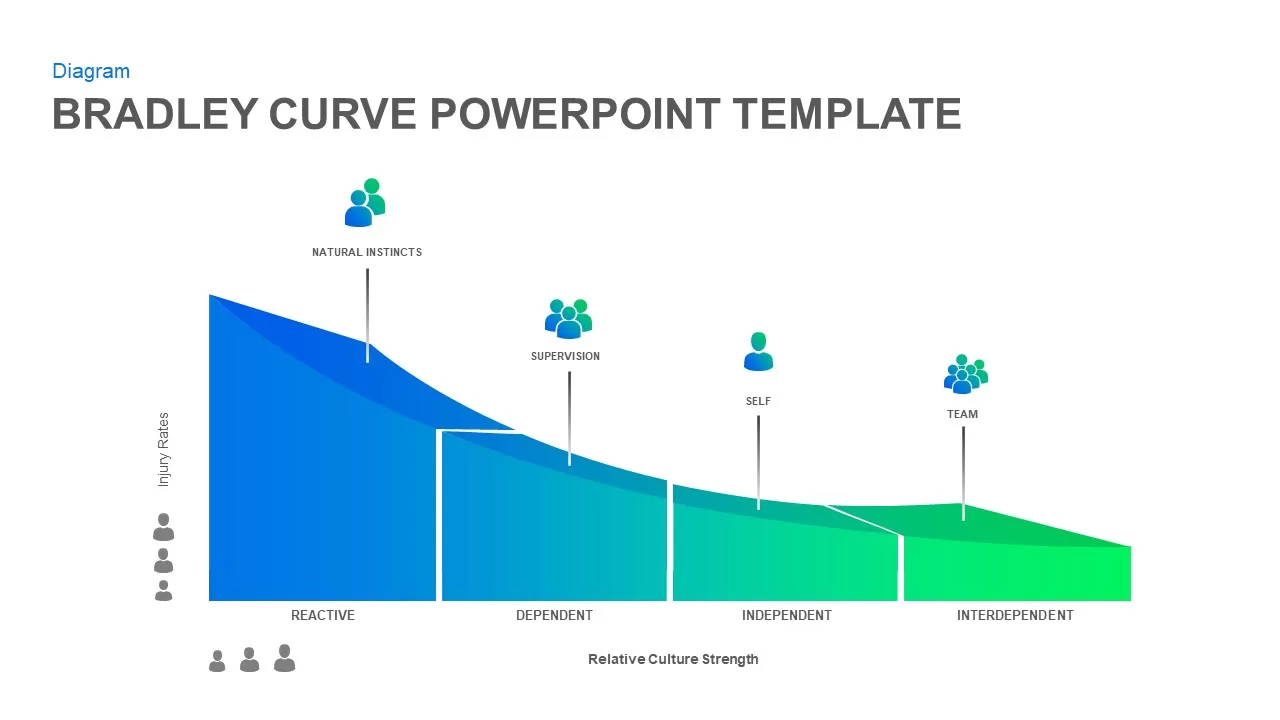
Bradley Curve PowerPoint Template
PowerPoint Charts
Premium
-
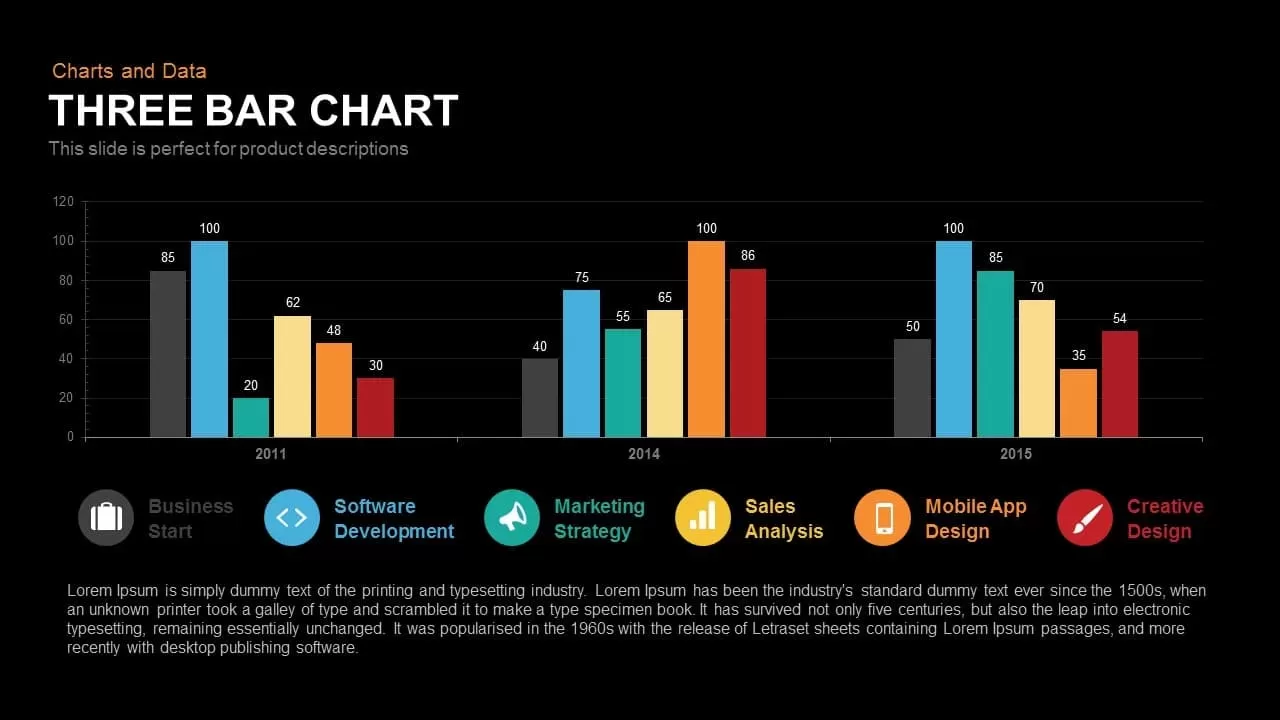
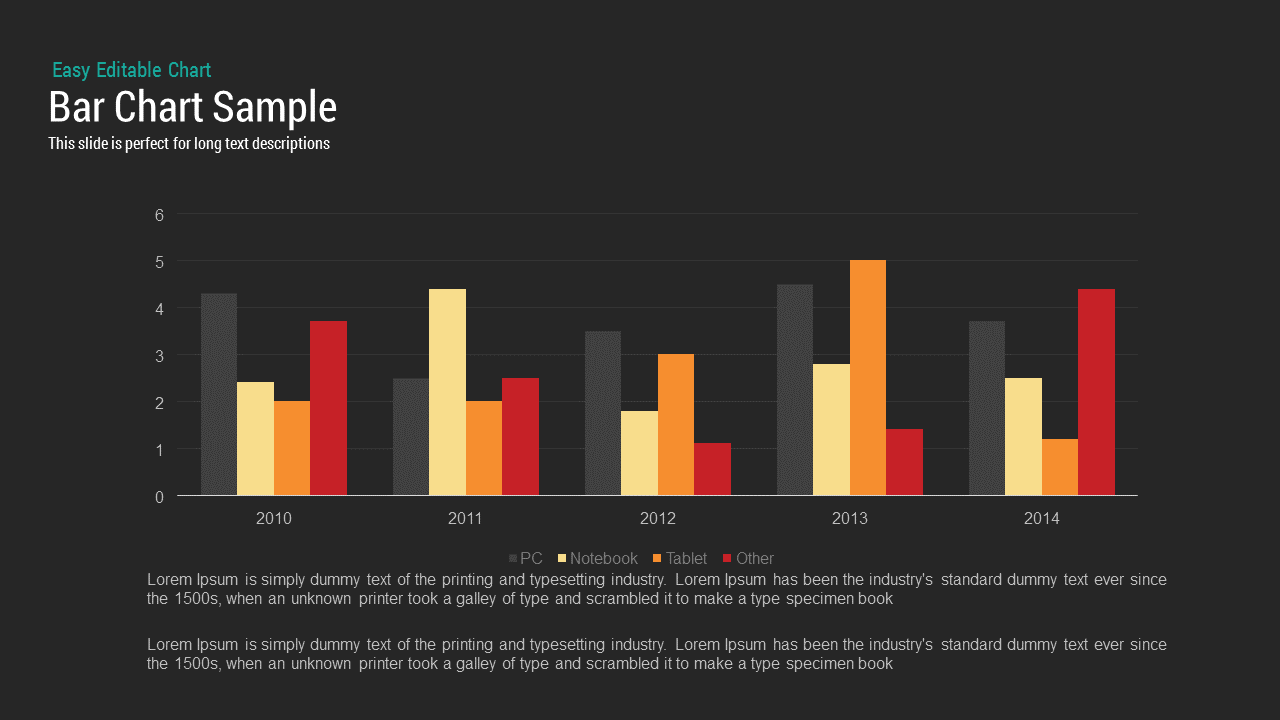
3 Bar Chart PowerPoint Template and Keynote Slide
Column and Bar chart
Premium
-

Free Book Review PowerPoint Template
Free PowerPoint Templates
Free
-

Free University Presentation PowerPoint Template
PowerPoint Templates
Free
-

Free Event Planning PowerPoint Template
Free PowerPoint Templates
Free
-
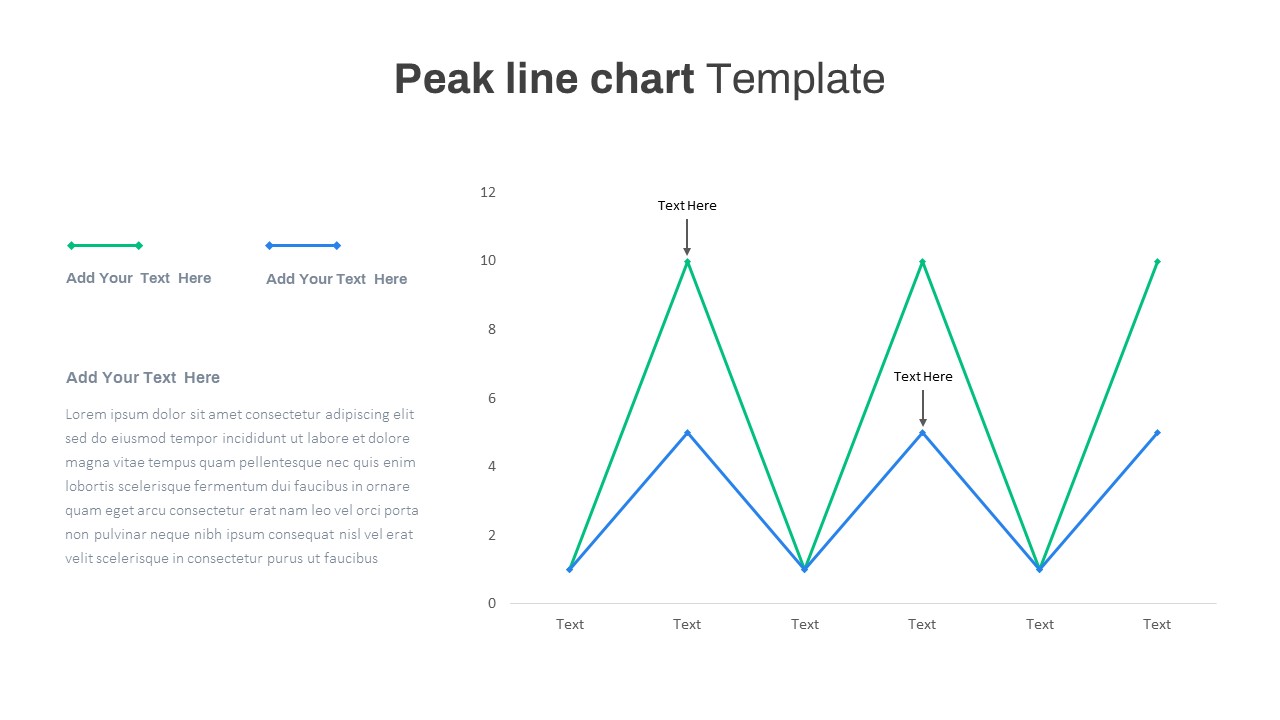
Peak Line Chart PowerPoint Template
PowerPoint Charts
Premium
-
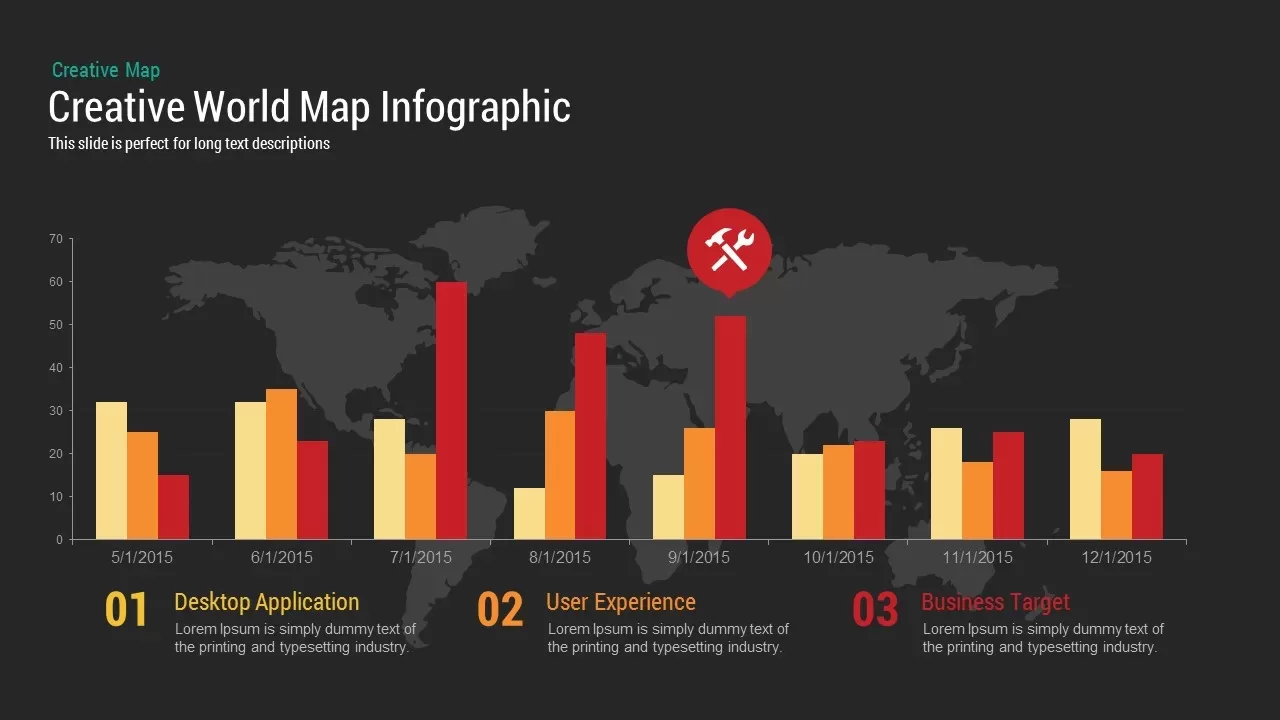
World Map Infographic PowerPoint Template and Keynote Slide
PowerPoint Charts
Premium
-
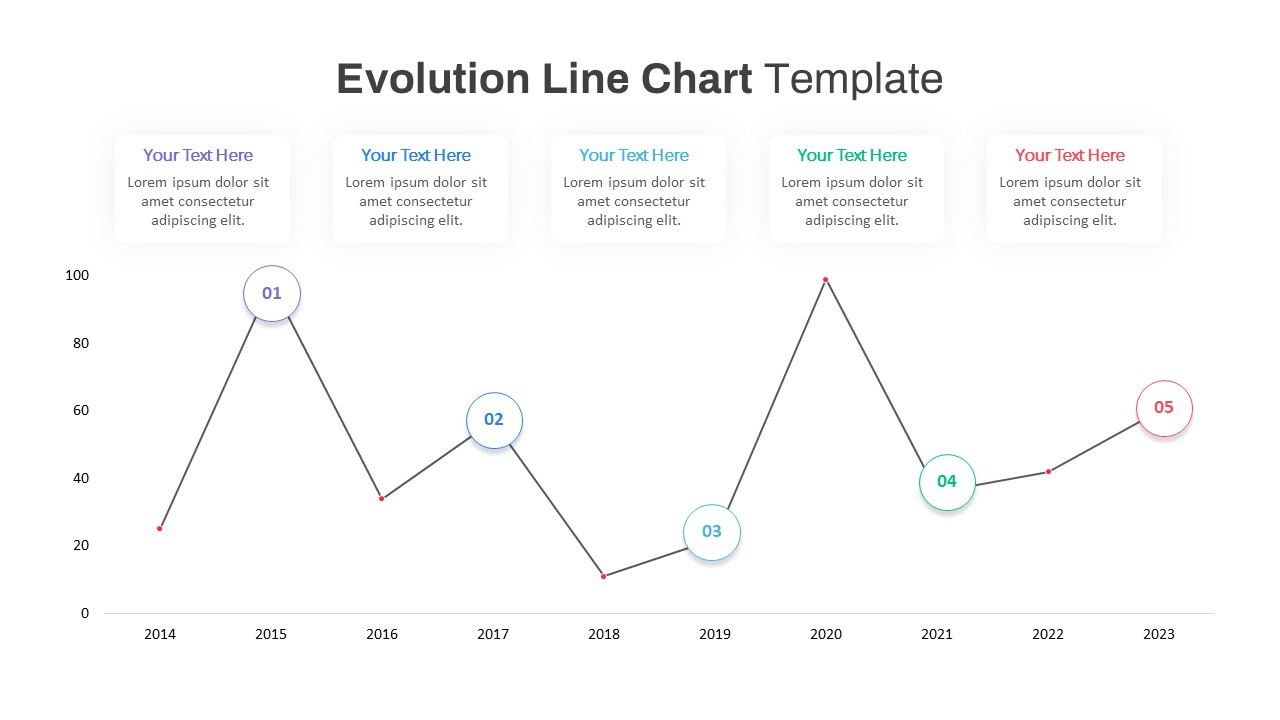
Evolution Line Chart PowerPoint Template
PowerPoint Templates
Premium
-
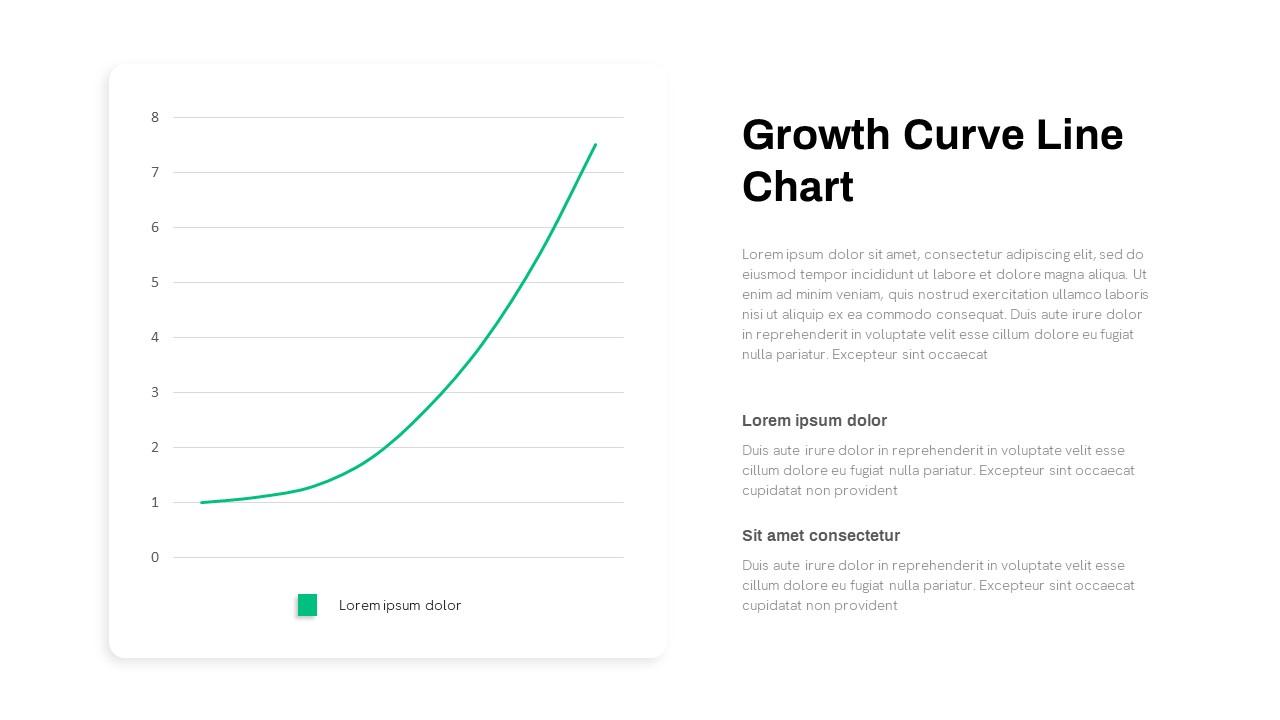
Growth Curve Line Chart PowerPoint Template
Curves and Lines
Premium
-

Radial Bar Chart PowerPoint Templates and Keynote Slides
PowerPoint Charts
Premium
-
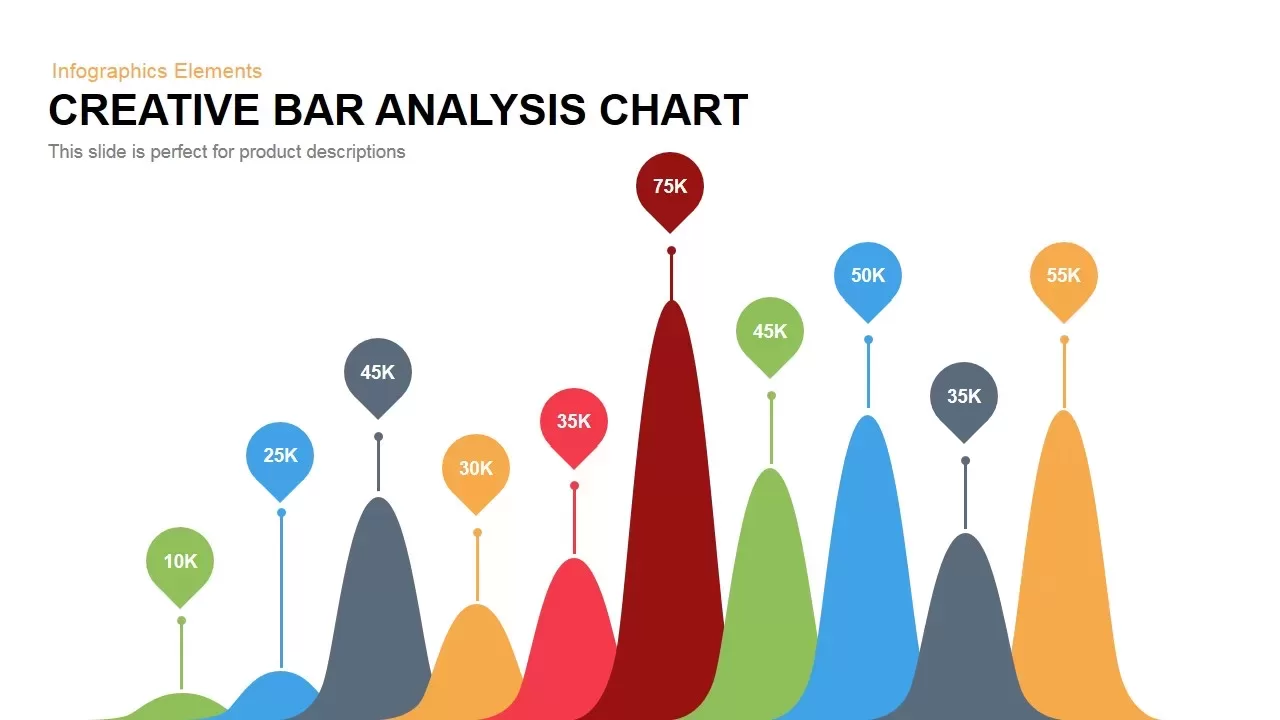
Creative Bar Chart Analysis PowerPoint Template and Keynote
Column and Bar chart
Premium
-

Global Warming Infographic PowerPoint Template Deck
PowerPoint Templates
Premium
-
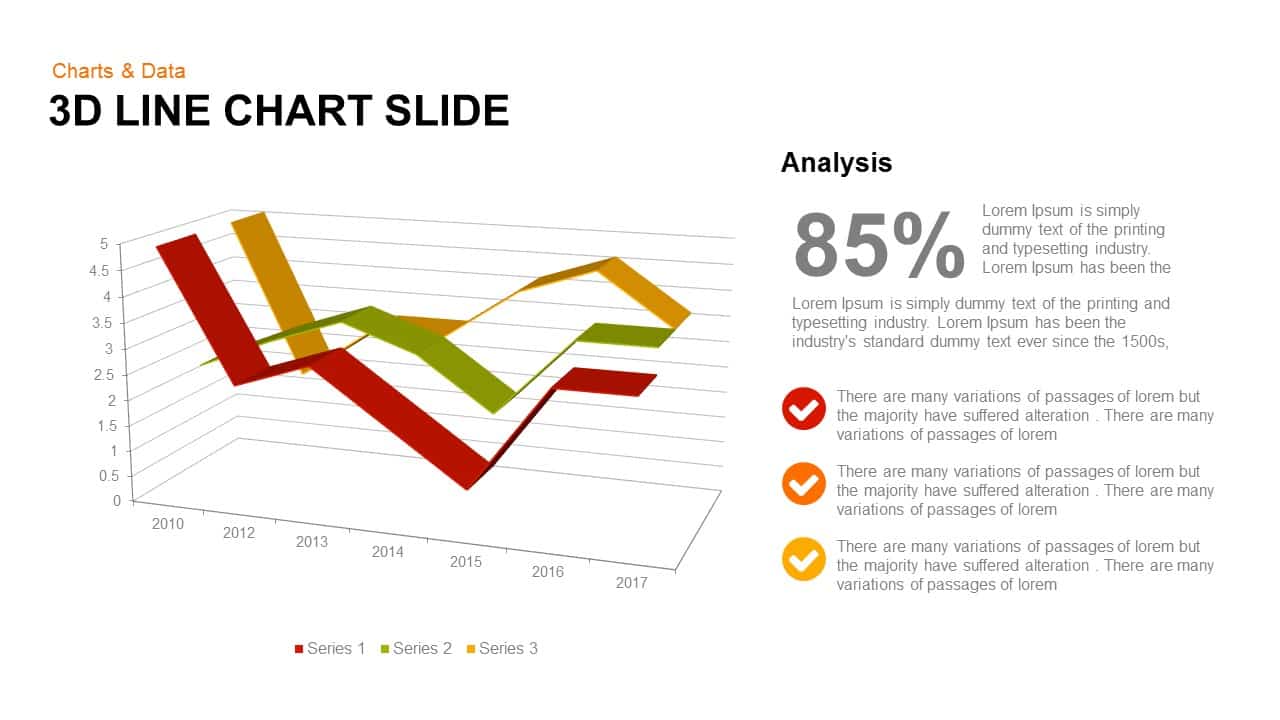
3d Line Chart PowerPoint Template and Keynote Slide
3D Shapes
Premium
-

Data Science PowerPoint Template
PowerPoint Templates
Premium
-
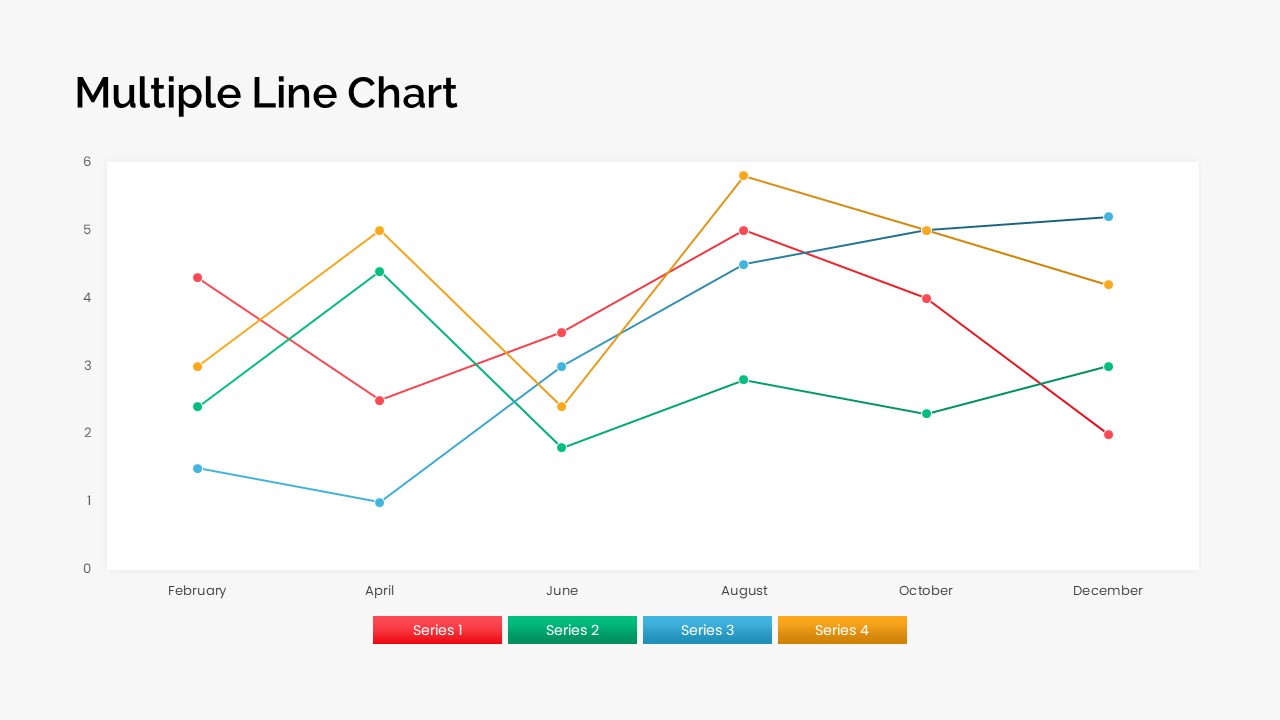
Multiple Line Chart PowerPoint Template
PowerPoint Charts
Premium
-

EFQM Model PowerPoint Template
PowerPoint Templates
Premium
-

Free Dunder Mifflin Paper Company Pitch Deck
Free PowerPoint Templates
Free
-

Real Estate PowerPoint Theme
PowerPoint Themes
Premium
-

Free Charts and Graphs PowerPoint Template
PowerPoint Templates
Free
-
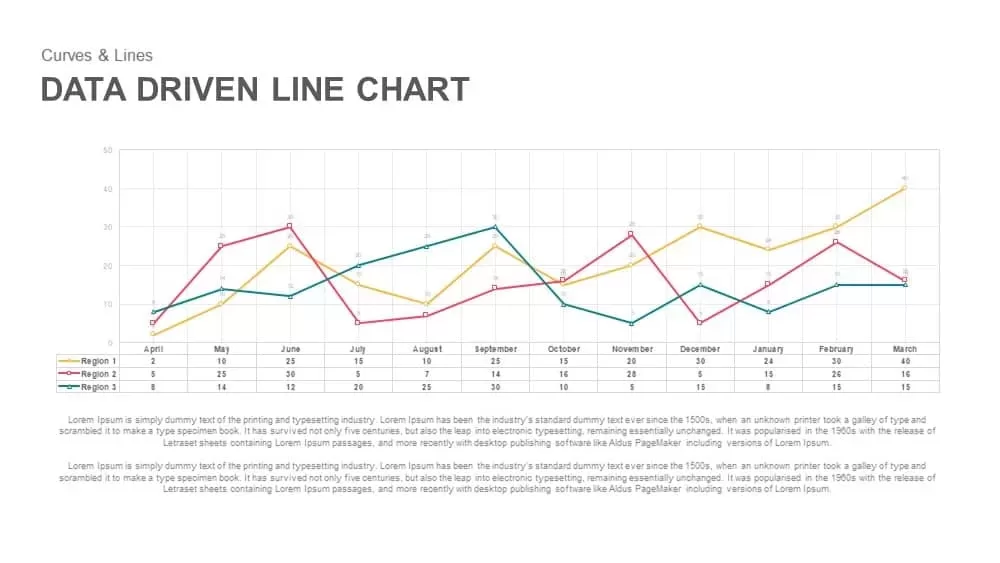
Data Driven Line Chart Template for PowerPoint & Keynote
Curves and Lines
Premium
-
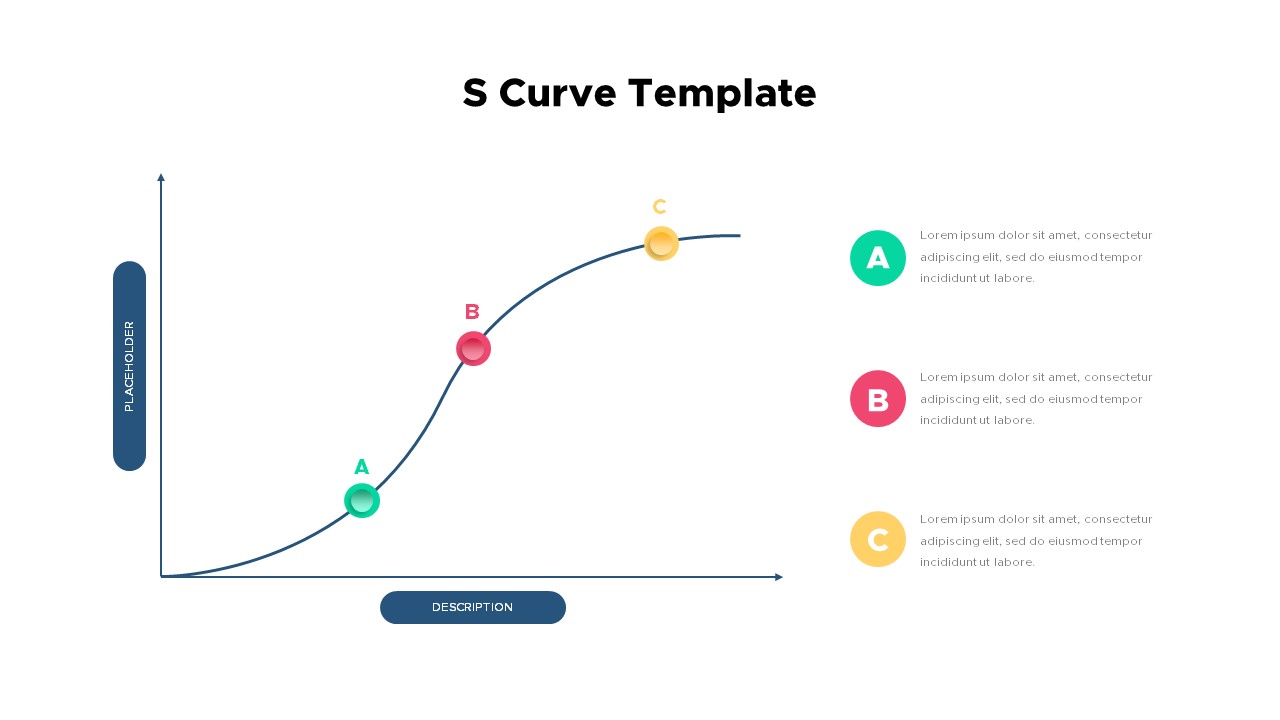
S Curve PowerPoint Template
Curves and Lines
Premium
-

Area Chart PowerPoint Template
PowerPoint Charts
Premium
-
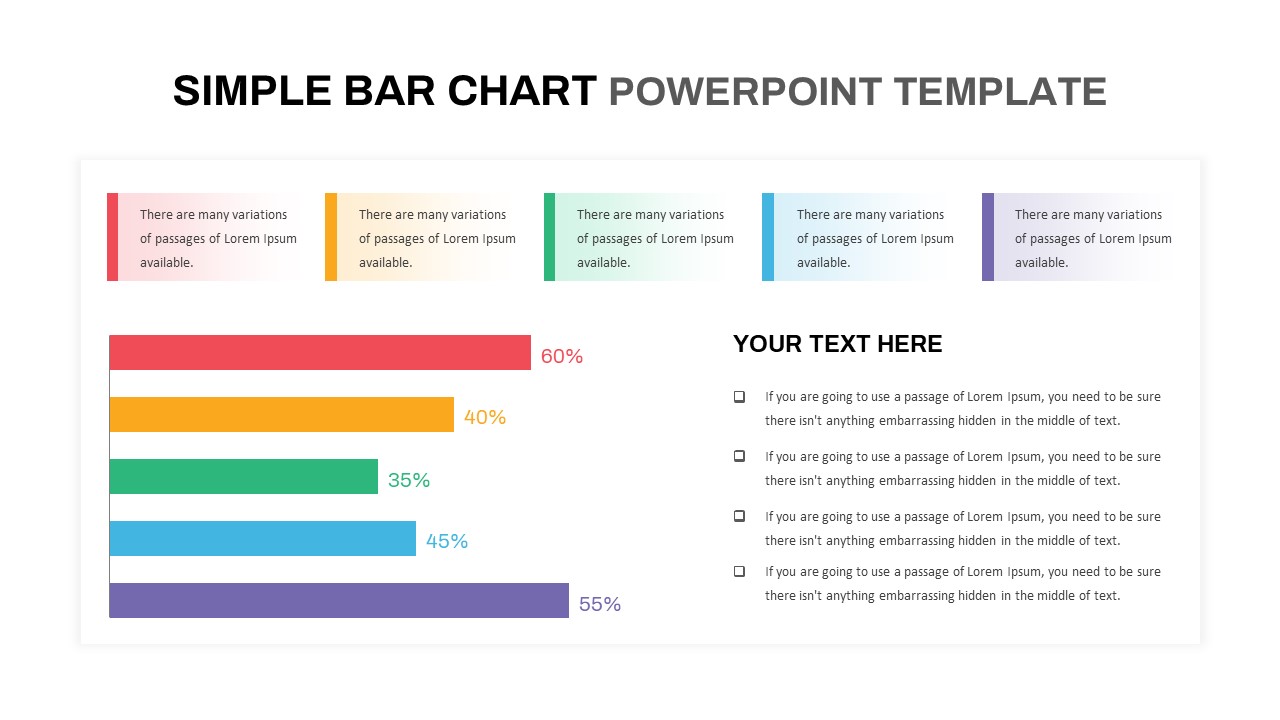
Simple Bar Chart PowerPoint Template
Column and Bar chart
Premium
-
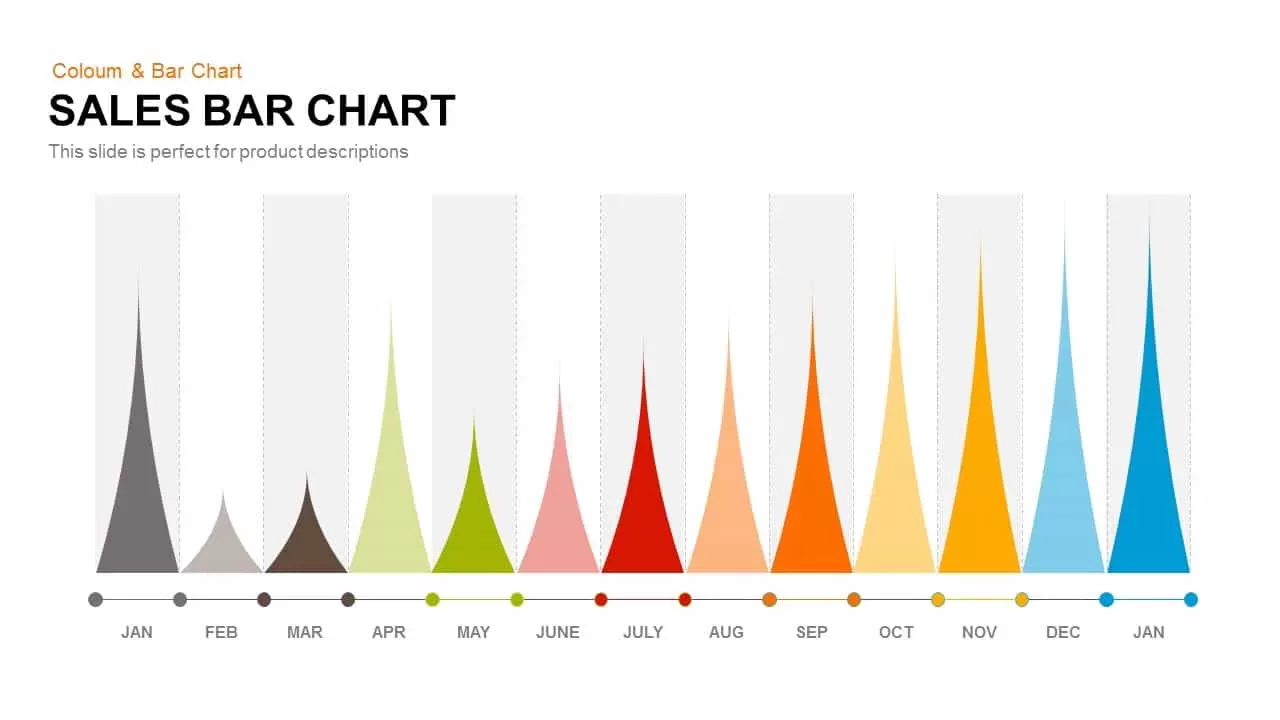
Sales Bar Chart Template for PowerPoint and Keynote
Column and Bar chart
Premium
-
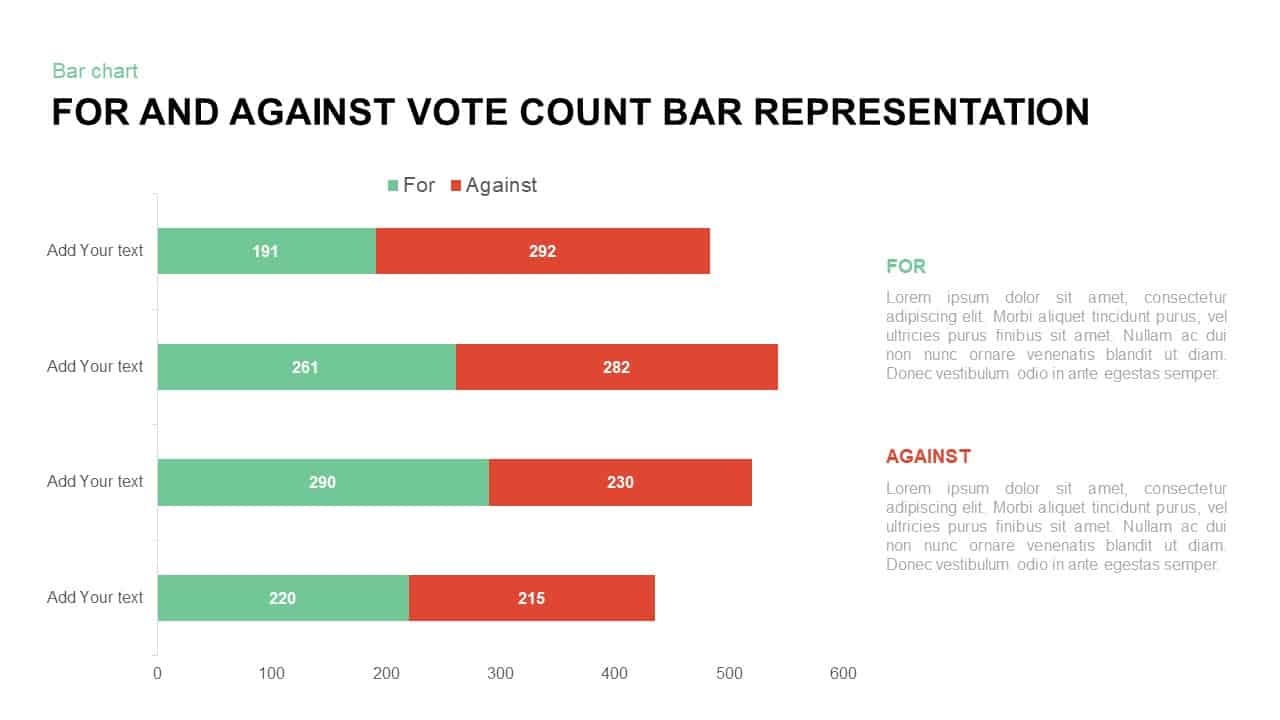
For and Against Vote Count Bar Chart for PowerPoint Presentation
Column and Bar chart
Premium
-
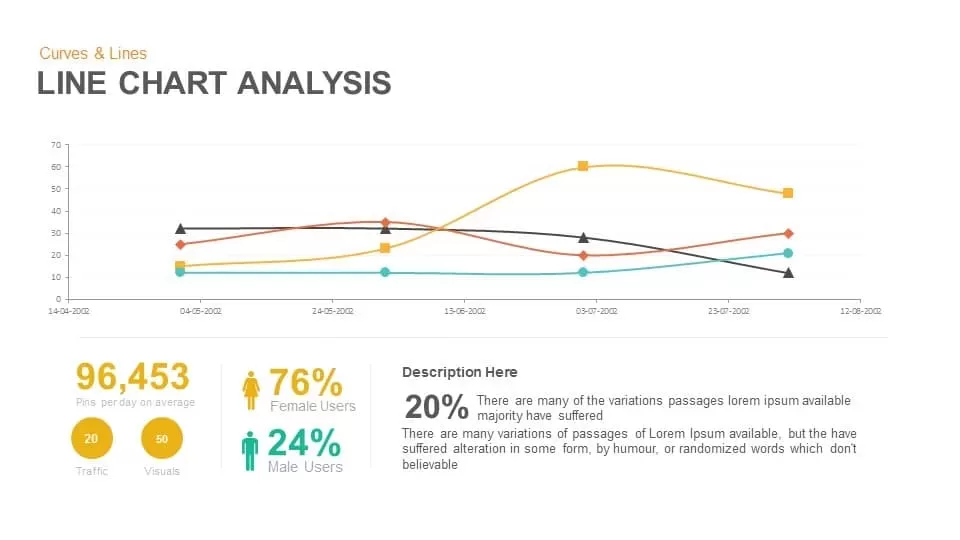
Line Chart Analysis PowerPoint Template and Keynote Slide
Curves and Lines
Premium
-
3d Bar Graph PowerPoint Template and Keynote Slide
Diagrams
Premium
-
3D Cylinder Bar Chart PowerPoint Template and Keynote Slide
Column and Bar chart
Premium
-
Bar of Pie Chart PowerPoint Template
PowerPoint Templates
Premium
-
3D Column Chart for PowerPoint and Keynote Presentation
PowerPoint Charts
Premium
-

Clustered Column Chart PowerPoint Template
PowerPoint Charts
Premium
-

Business Process Reengineering Template
PowerPoint Templates
Premium
-
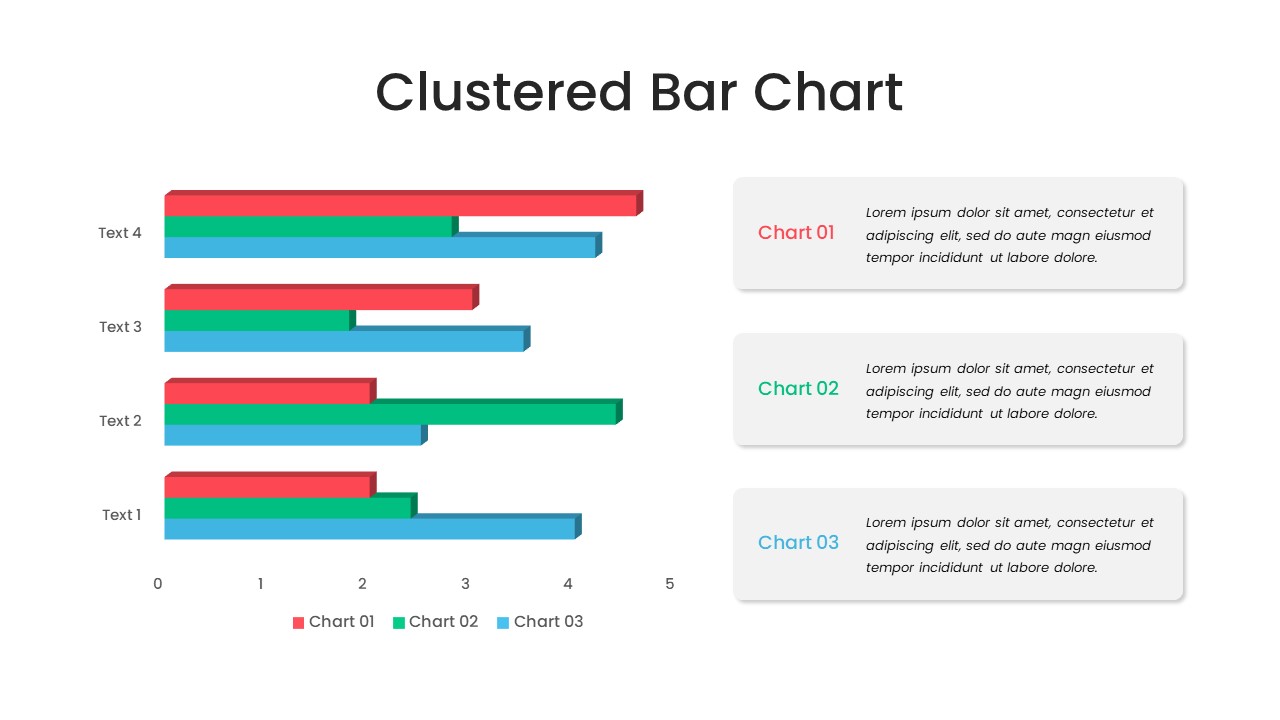
Clustered Bar Chart PowerPoint Template
Column and Bar chart
Premium
-
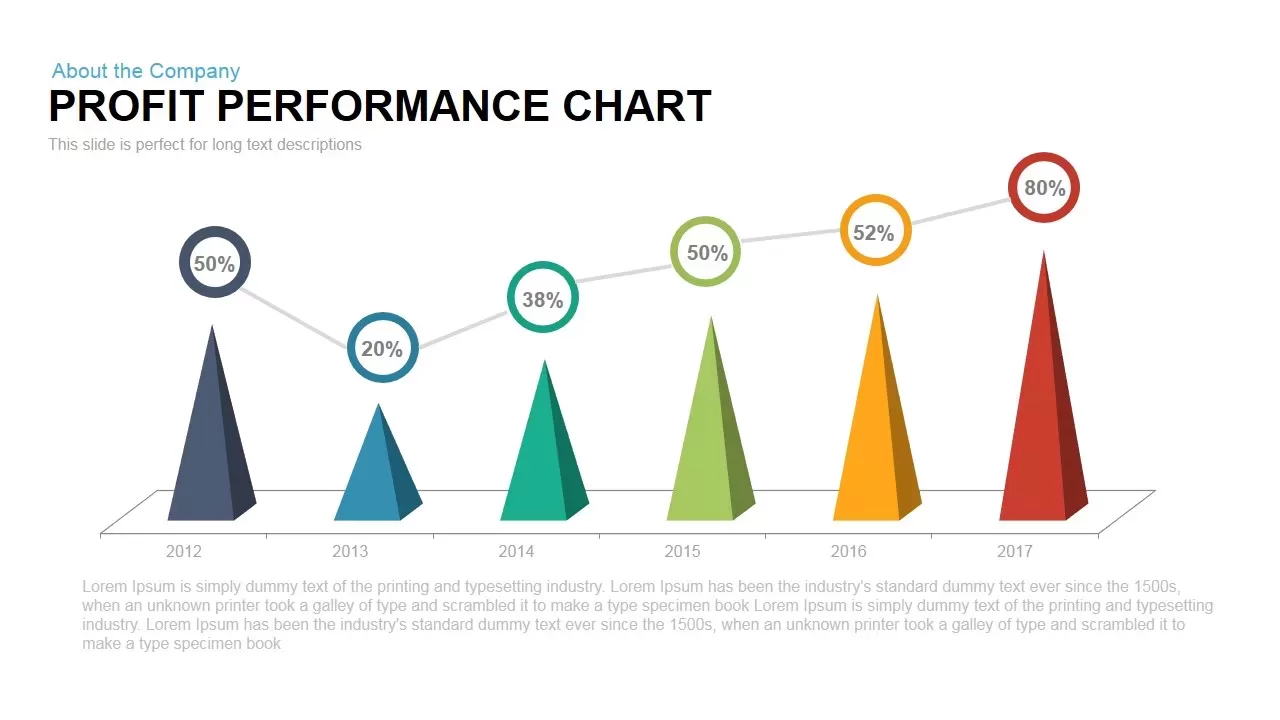
Profit Performance Chart PowerPoint Template
PowerPoint Charts
Premium
-
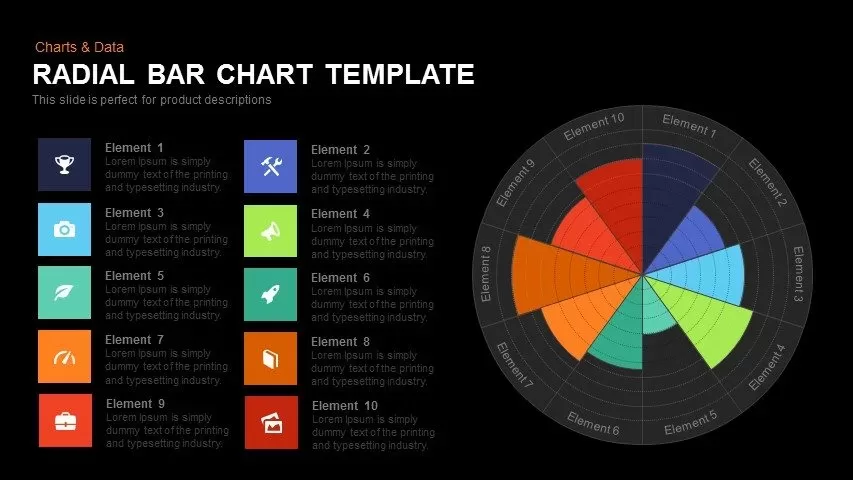
Radial Bar Chart Template for PowerPoint and Keynote
Circular Diagrams
Premium
-
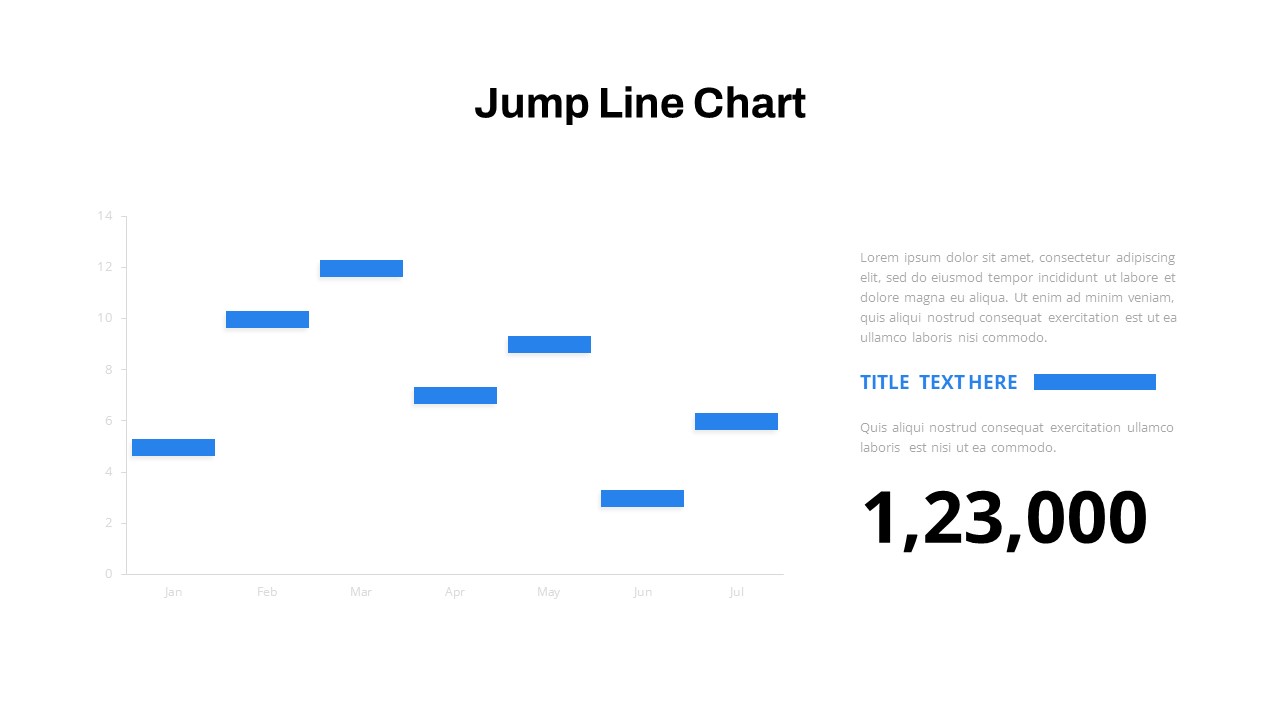
Jump Line Chart PowerPoint Template
Column and Bar chart
Premium
-

Stakeholder Register PowerPoint Template
PowerPoint Templates
Premium
-
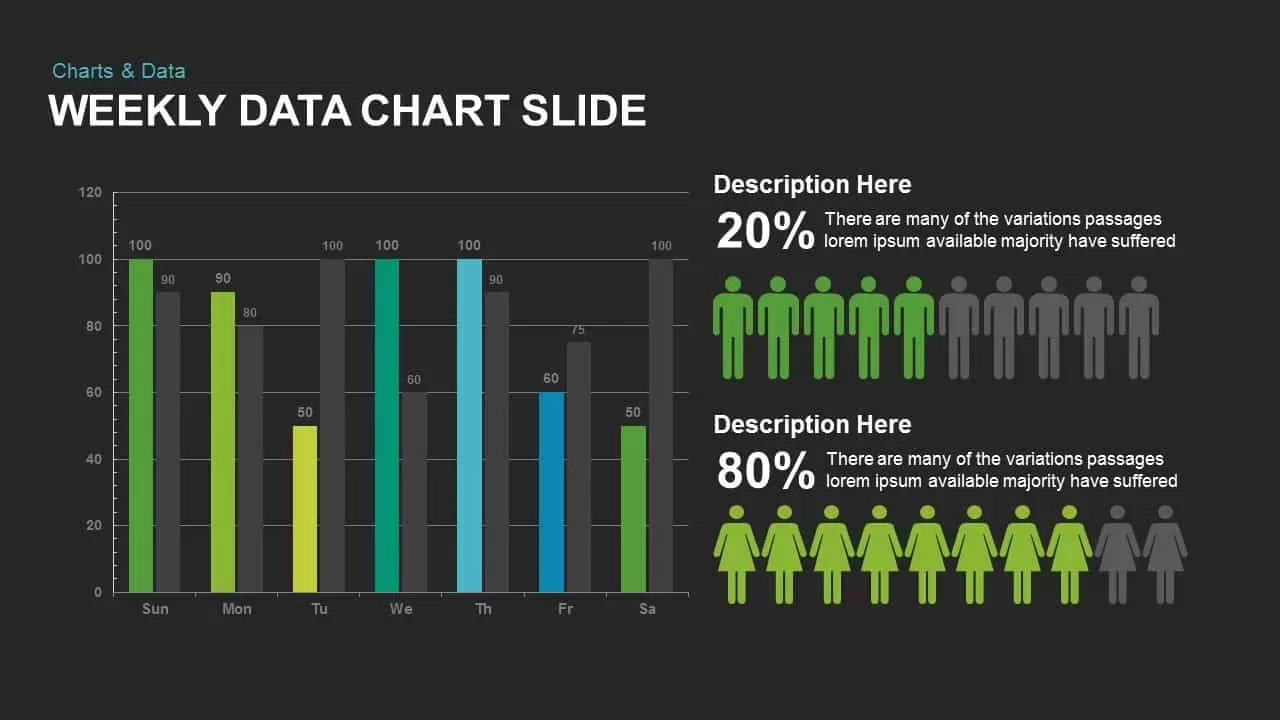
Weekly Data Charts PowerPoint Presentation Template and Keynote Slide
Infographic
Premium
-

Free AI Artificial Intelligence PowerPoint Template
PowerPoint Templates
Free
-
Free Charts & Graphs Deck PowerPoint Template
PowerPoint Templates
Free
-
Progress Chart PowerPoint Template
PowerPoint Templates
Premium
-
Data Over Time Line Chart PowerPoint Template
PowerPoint Charts
Premium
-

Animated Upcoming Event Poster PowerPoint Template
PowerPoint Templates
Premium
-

Animated Clustered Bar Chart PowerPoint Template
PowerPoint Charts
Premium
-
Bell Curve PowerPoint Template
PowerPoint Templates
Premium
-
Progress Bar Chart PowerPoint Template
PowerPoint Templates
Premium
-
Product Comparison Bar Chart Template for PowerPoint and Keynote
PowerPoint Charts
Premium
-
Set of Chart PowerPoint Template and Keynote Diagram
PowerPoint Charts
Premium
-
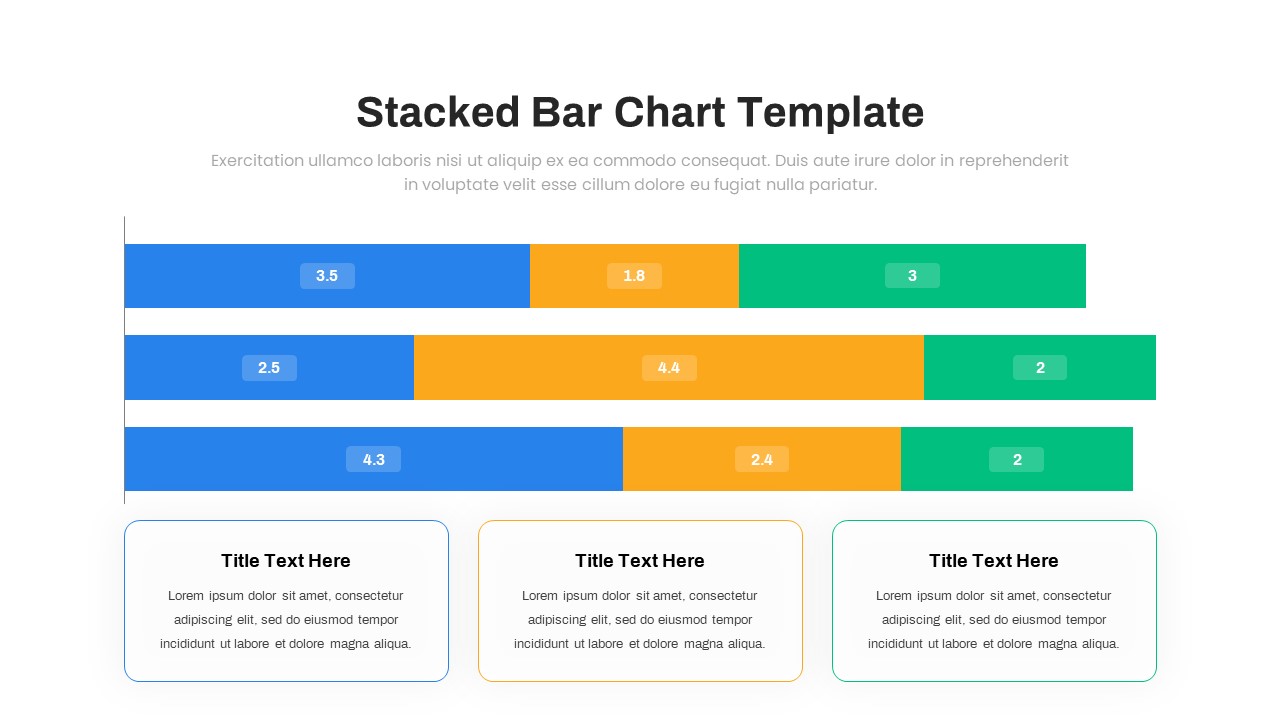
Animated Stacked Bar Chart PowerPoint Template
Column and Bar chart
Premium
-
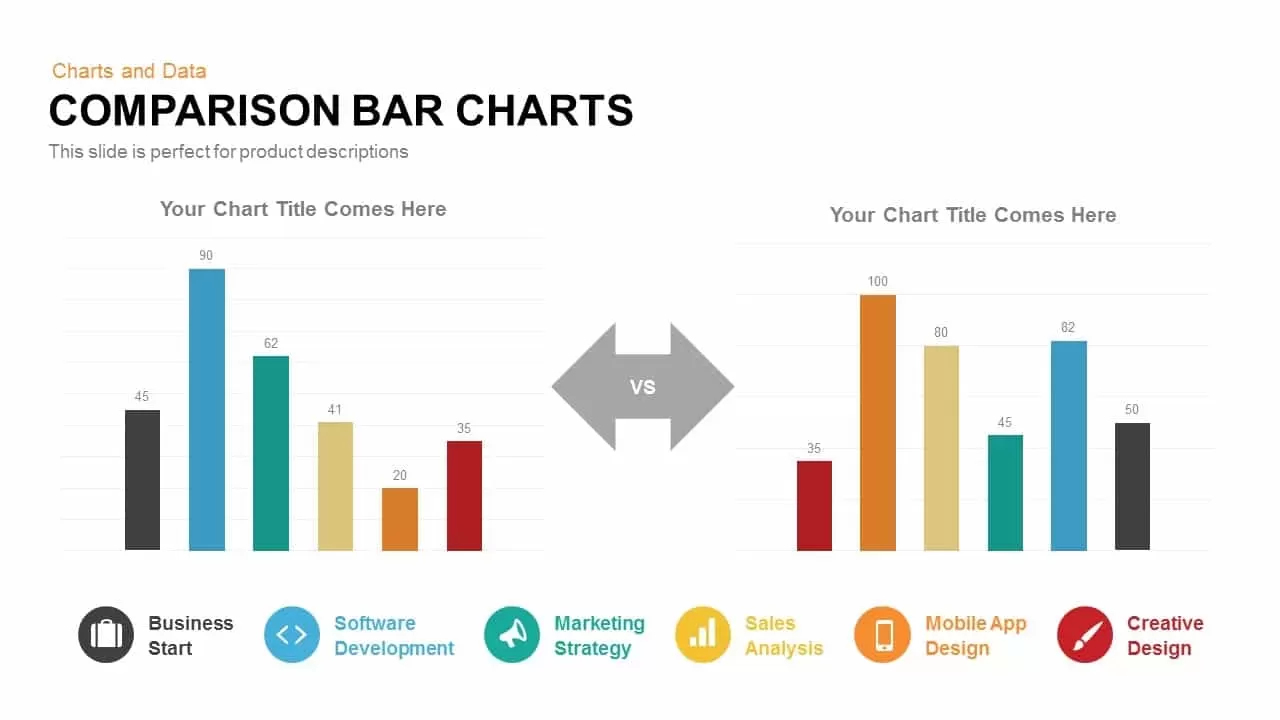
Comparison Bar Charts PowerPoint Template and Keynote Slide
Column and Bar chart
Premium
-
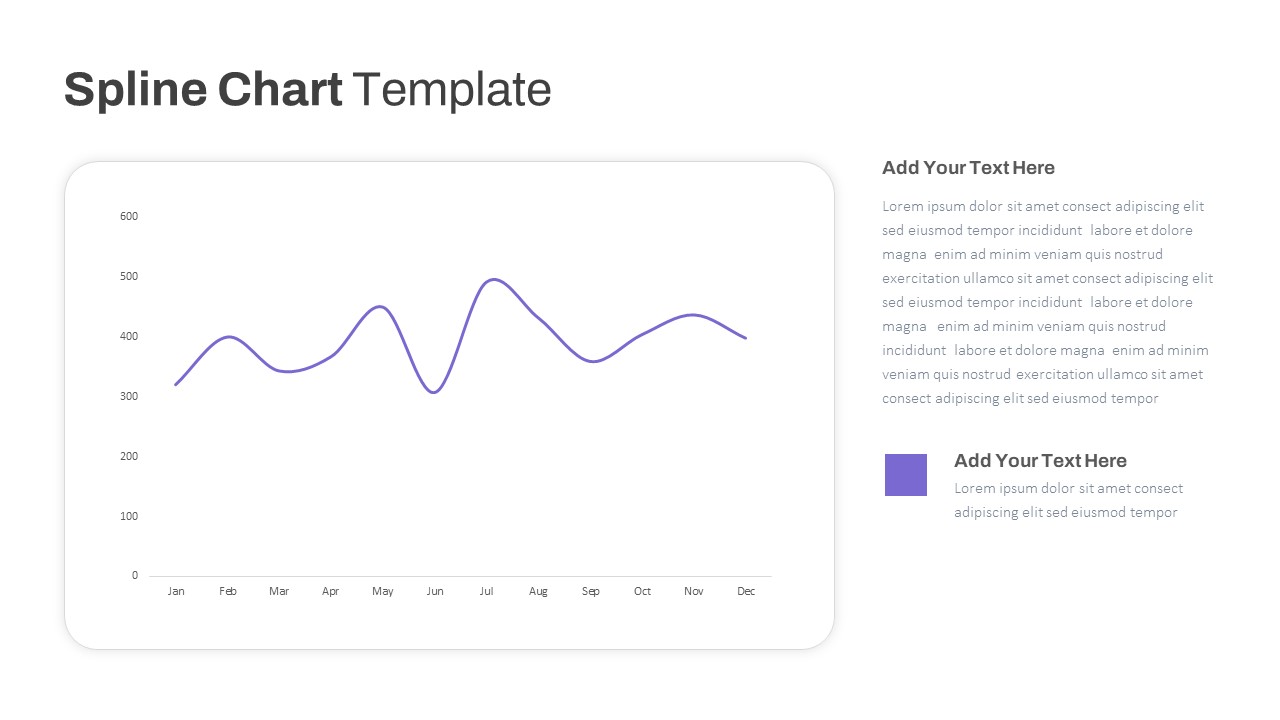
Spline Chart PowerPoint Template
PowerPoint Charts
Premium
-
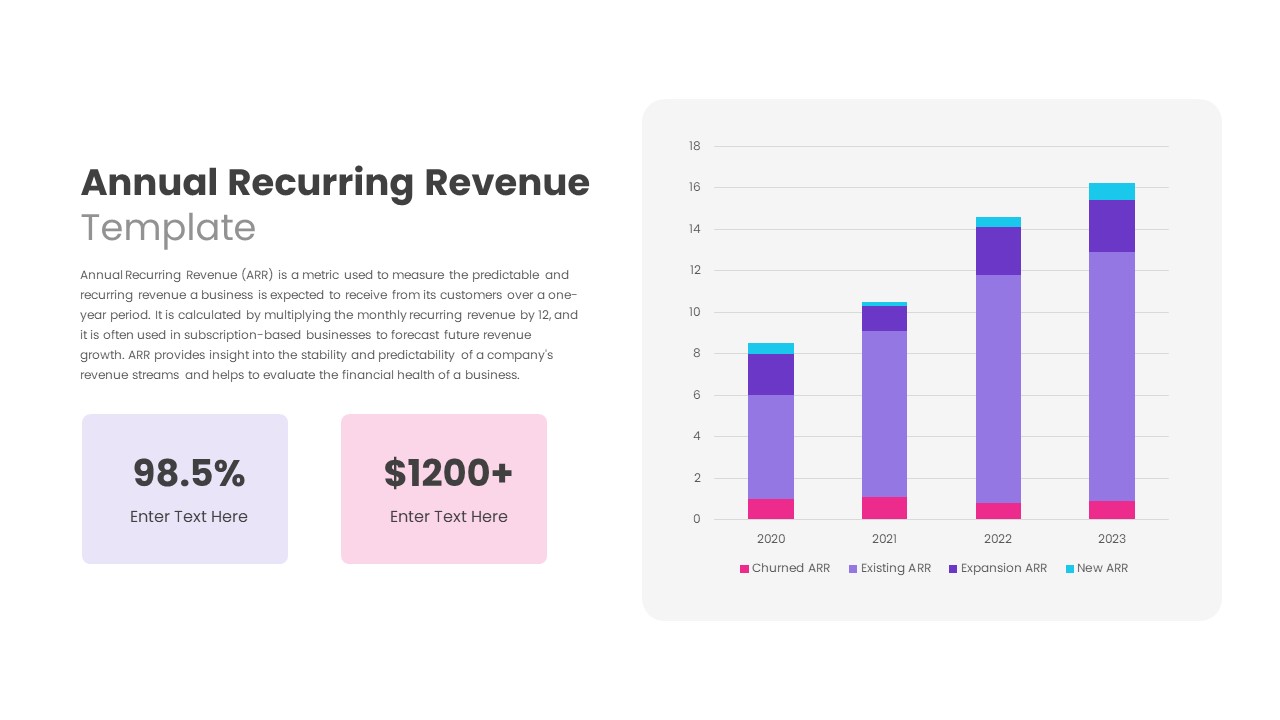
Annual Recurring Revenue PowerPoint Template
PowerPoint Templates
Premium
-
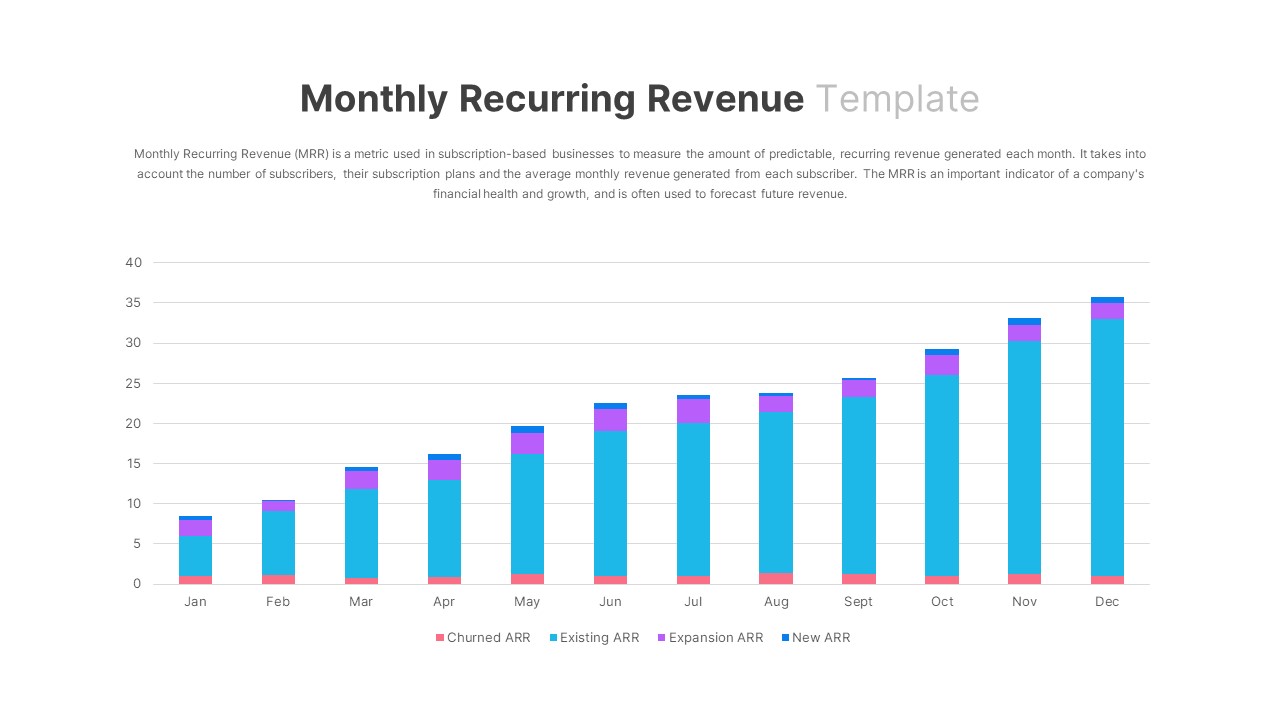
Monthly Recurring Revenue PowerPoint Template
PowerPoint Templates
Premium
-
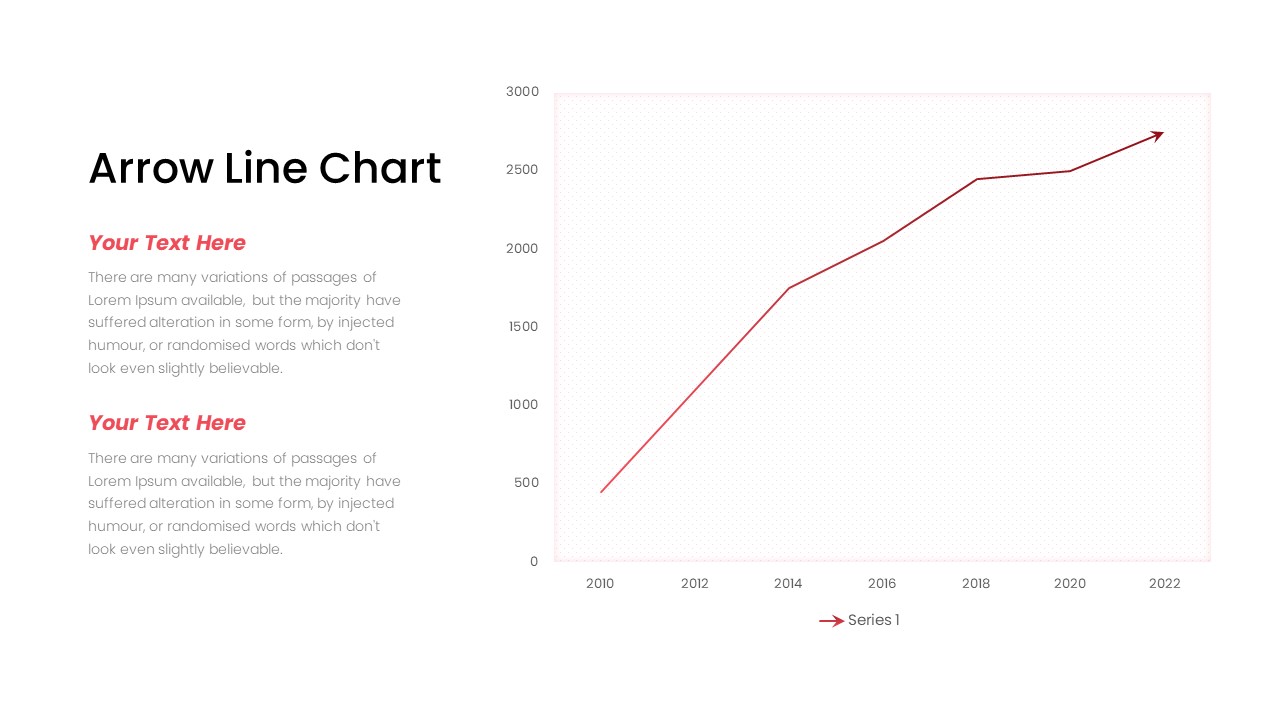
Arrow Line Chart PowerPoint Template
Arrow Diagrams
Premium
-
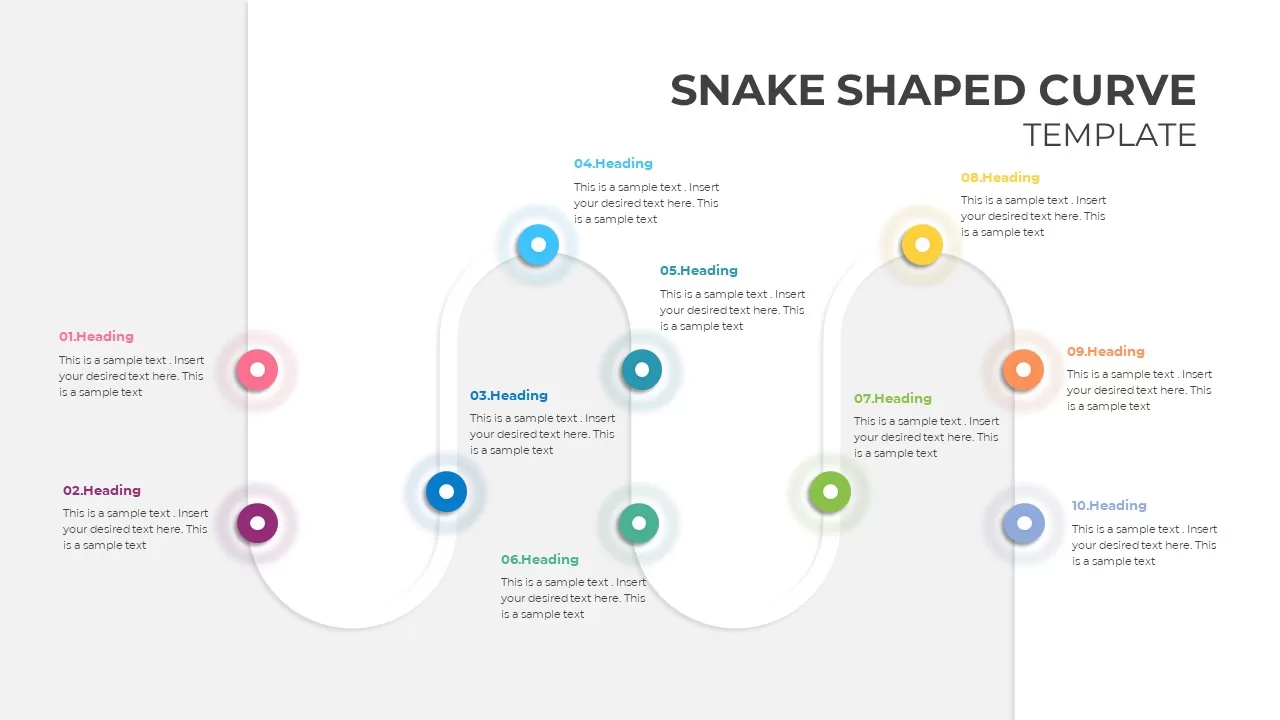
Snake Shaped Curve Diagram
Shapes
Premium
-
Timeline Bar Chart PowerPoint
Column and Bar chart
Premium
-
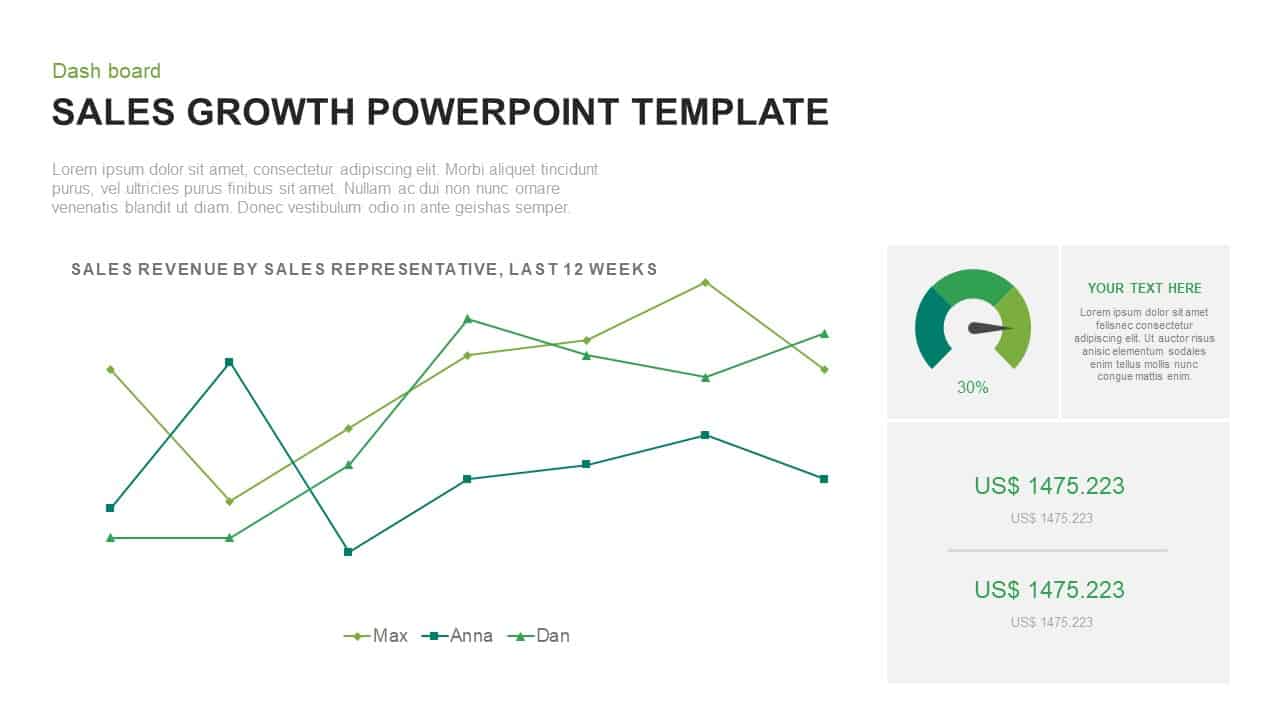
Sales Growth PowerPoint Presentation Template
Curves and Lines
Premium
-

Proportional Area Chart PowerPoint Template
PowerPoint Templates
Premium
-
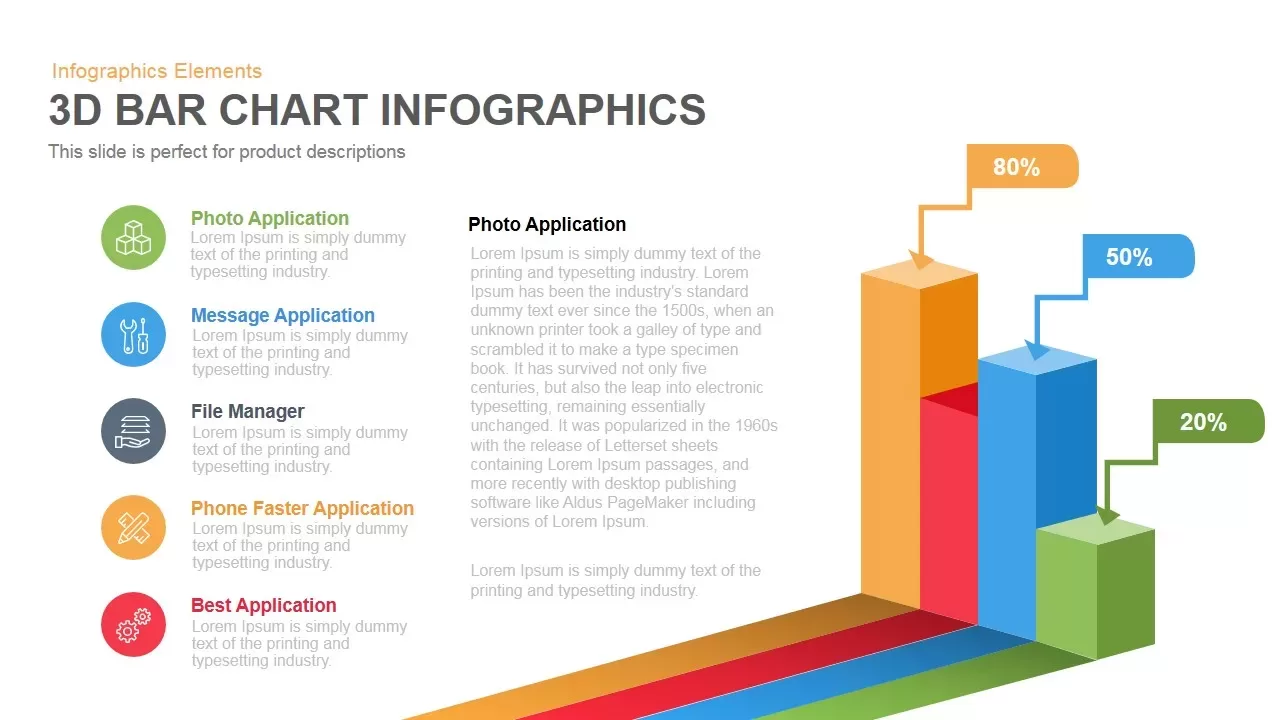
3D Bar Chart Infographics Template for PowerPoint and Keynote
Diagrams
Premium
-
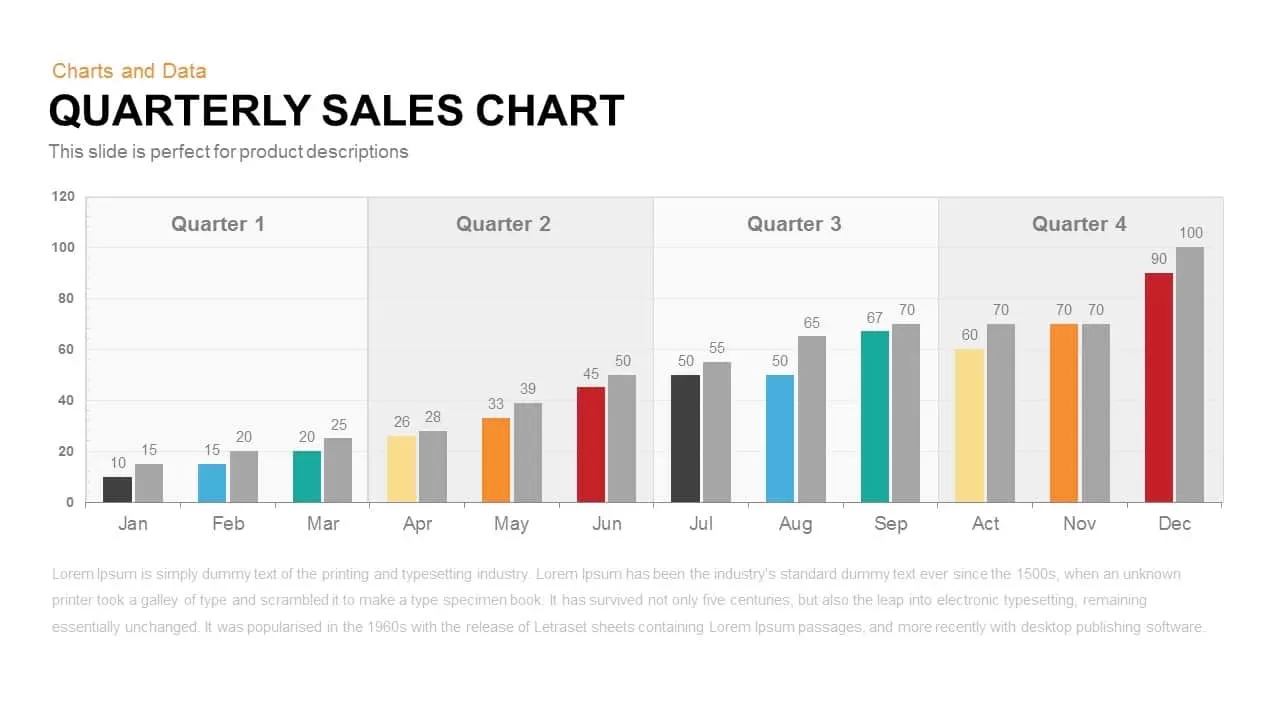
Quarterly Sales Chart PowerPoint Template and Keynote Slide
Column and Bar chart
Premium
-
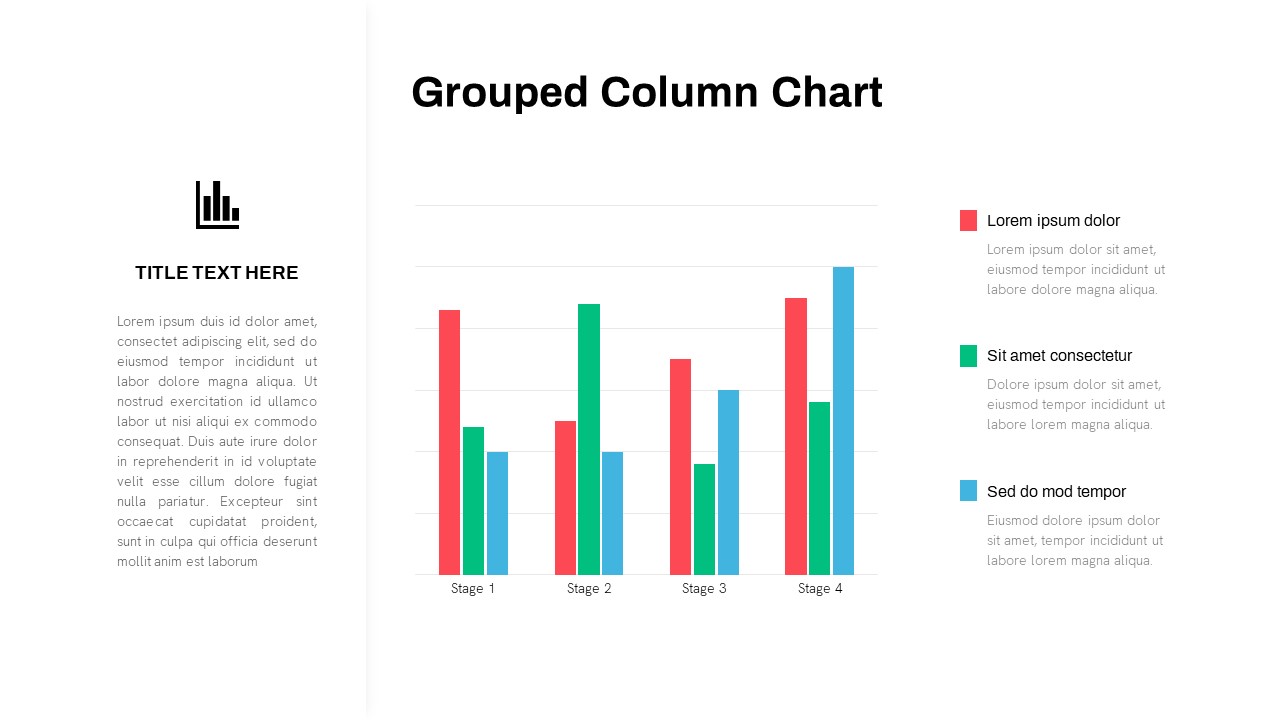
Grouped Column Chart PowerPoint Template
Column and Bar chart
Premium
-

Open Door Policy PowerPoint Template
PowerPoint Templates
Premium
-
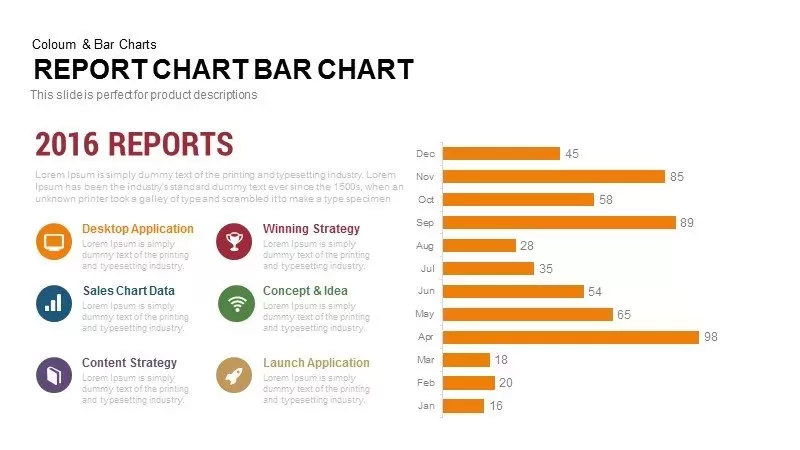
Report Bar Chart PowerPoint Template and Keynote
Column and Bar chart
Premium
-

Biotechnology PowerPoint Presentation Template
PowerPoint Templates
Premium
-
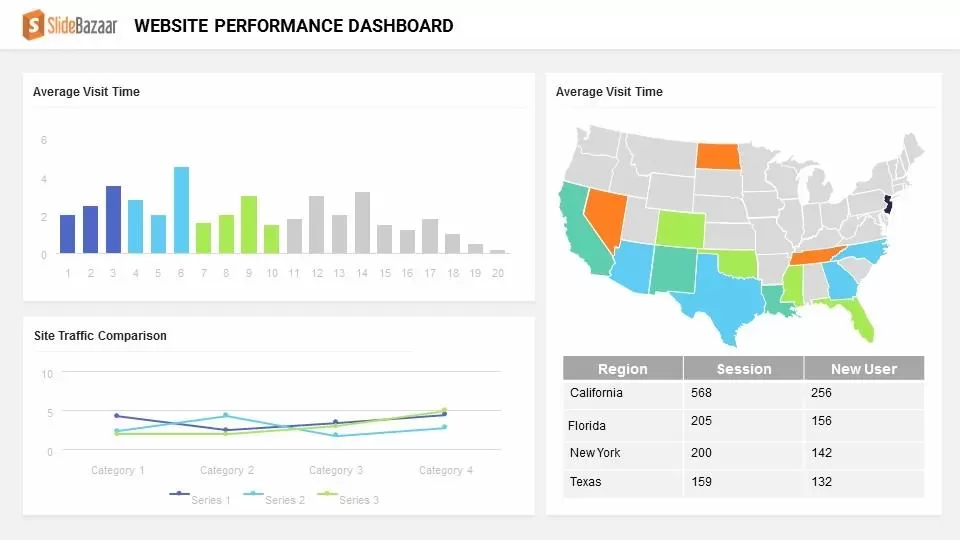
Website Performance Dashboard PowerPoint Template and Keynote
Infographic
Premium