


Polar Chart PowerPoint Template


- Version
- Download 23
- File Size 0.00 KB
- File Count 1
- Create Date December 27, 2023
- Last Updated December 21, 2023
Polar Chart PowerPoint Template
Use editable polar chart template for PowerPoint
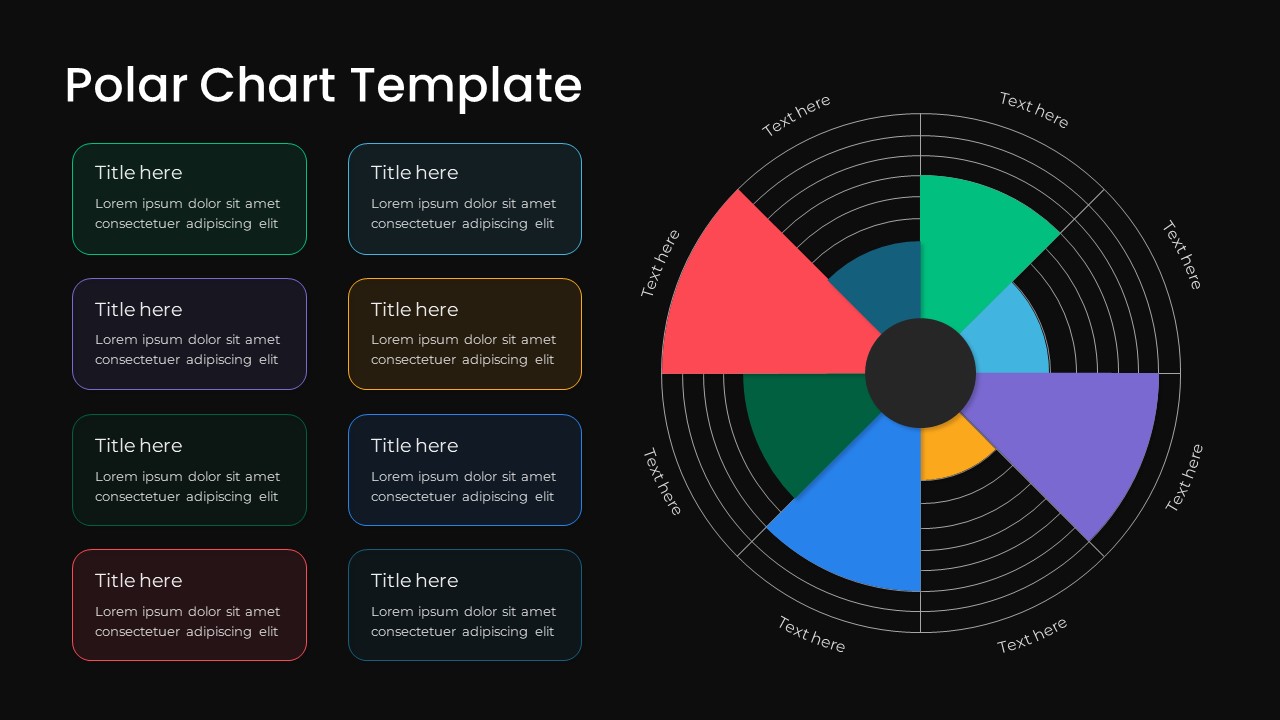
Polar charts, radial charts, or radar charts are clockwise diagrams that show data in a rotational format. So, this polar chart PowerPoint template is adapted to visualize your business phases, marketing strategies, academic reviews, and research outcomes. The Charts are created in compatibility with PowerPoint, Google Slides, and Mac keynote functionality and with the help of customizable properties, manipulated to generate different visual representations. Plus, the customizable properties allow you to create diverse visual representations, making it easier than ever to convey your data with precision and impact. Elevate your presentations with this adaptable and user-friendly Polar Chart template.
How do you create a polar chart in PowerPoint?
Creating a polar chart for PowerPoint is a straightforward process for visualizing data in a radial format. Begin by preparing your data with clear labels and values. Then, insert a radar or polar chart through the "Insert" tab and input your data into the chart's spreadsheet. Customize the chart with labels, colors, and other visual elements to enhance clarity. Add data labels and a title to provide context. Review and tweak the chart to your liking, and it's ready for your PowerPoint presentation. This simple process empowers you to effectively communicate data in a compelling radial format, capturing your audience's attention and understanding.
The polar chart template PowerPoint enables you to transform and visualize raw data through clear and appealing graphics. These radial charts are perfect for displaying data that varies across multiple categories and angles. Besides, this template helps monitor progress or performance across different sectors by identifying strengths and weaknesses. Further, the recurring layout allows us to easily compare data points at a glance. Moreover, it is best for highlighting trends or patterns, making your presentation more impactful. Whether you're a student, researcher, or professional, this template is perfect for displaying research findings in a visually appealing way.
Designed with precision and impact in mind, this polar chart slide is tailored for a diverse audience. It caters to business professionals, educators, data analysts, researchers, and marketing and sales teams, as well as anyone seeking to convey their data effectively.
Customizing the editable polar chart template for PowerPoint is a breeze, allowing you to incorporate additional features as desired. The template boasts an innovative design with eight text boxes arranged in a radial diagram configuration. Alternatively, explore our marketing radar chart for PowerPoint, providing you with an alternative visual tool for your specific needs.
Attached Files
| File |
|---|
| https://premiumdownloads.s3.amazonaws.com/SB03826-Polar Chart PowerPoint Template.ZIP |
Login to download this file
Add to favorites
Add to collection
-

Item ID
SB03826 -

Related Templates
-

Research Proposal PowerPoint Template
PowerPoint Templates
Premium
-

Free Nursing Capstone PowerPoint Deck
PowerPoint Templates
Free
-

Nature PowerPoint Presentation Template
PowerPoint Business Templates
Premium
-

Cab Service PowerPoint Template
PowerPoint Templates
Premium
-

Sales Deck Free PowerPoint Template
PowerPoint Templates
Free
-

Free Vertical PowerPoint Template
PowerPoint Business Templates
Free
-

VET Clinic PowerPoint Template
PowerPoint Templates
Premium
-

Gym PowerPoint Template
PowerPoint Templates
Premium
-

Free Space Minimal Deck Template
PowerPoint Templates
Free
-

Travel Agency PowerPoint Template
PowerPoint Templates
Premium
-

Free Physical Education PowerPoint Template Deck
Free PowerPoint Templates
Free
-

IoT Presentation Template
PowerPoint Templates
Premium
-

Effective Communication PowerPoint Template
PowerPoint Templates
Premium
-

PowerPoint Quiz With Timer
PowerPoint Templates
Premium
-

Radial Bar Chart PowerPoint Templates and Keynote Slides
PowerPoint Charts
Premium
-
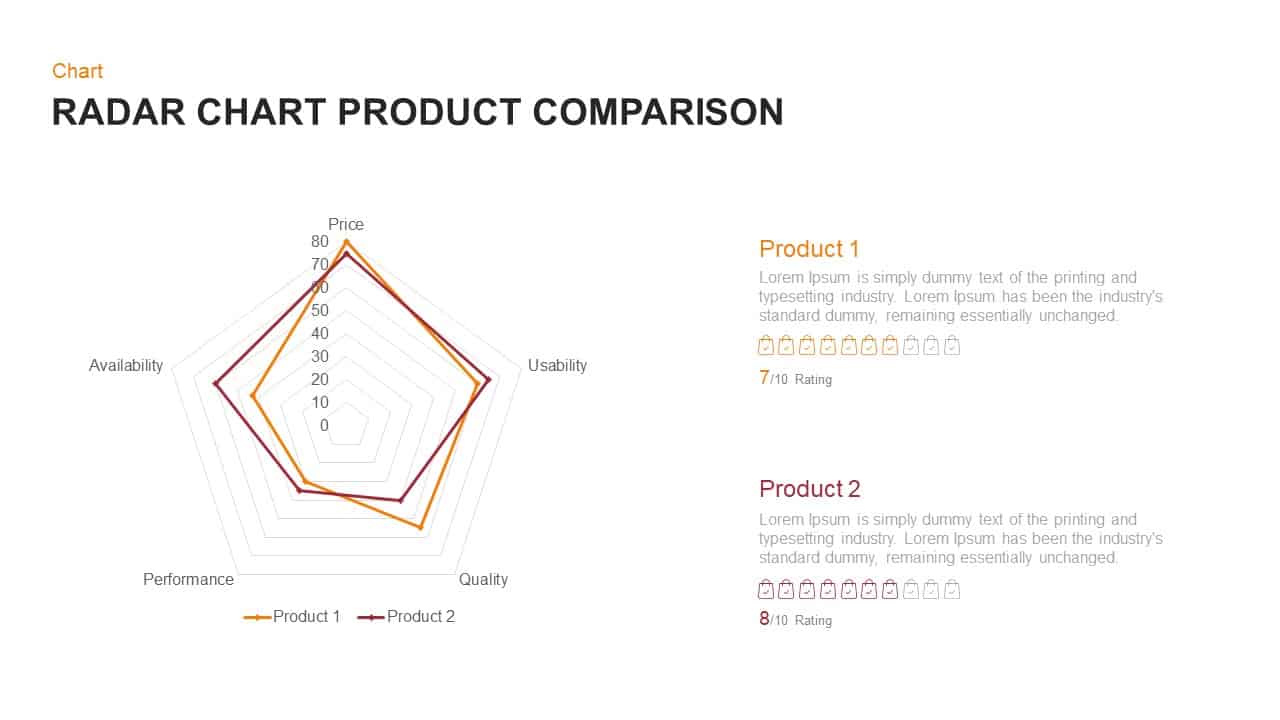
Radar Chart Product Comparison PowerPoint Template
Business Models
Premium
-
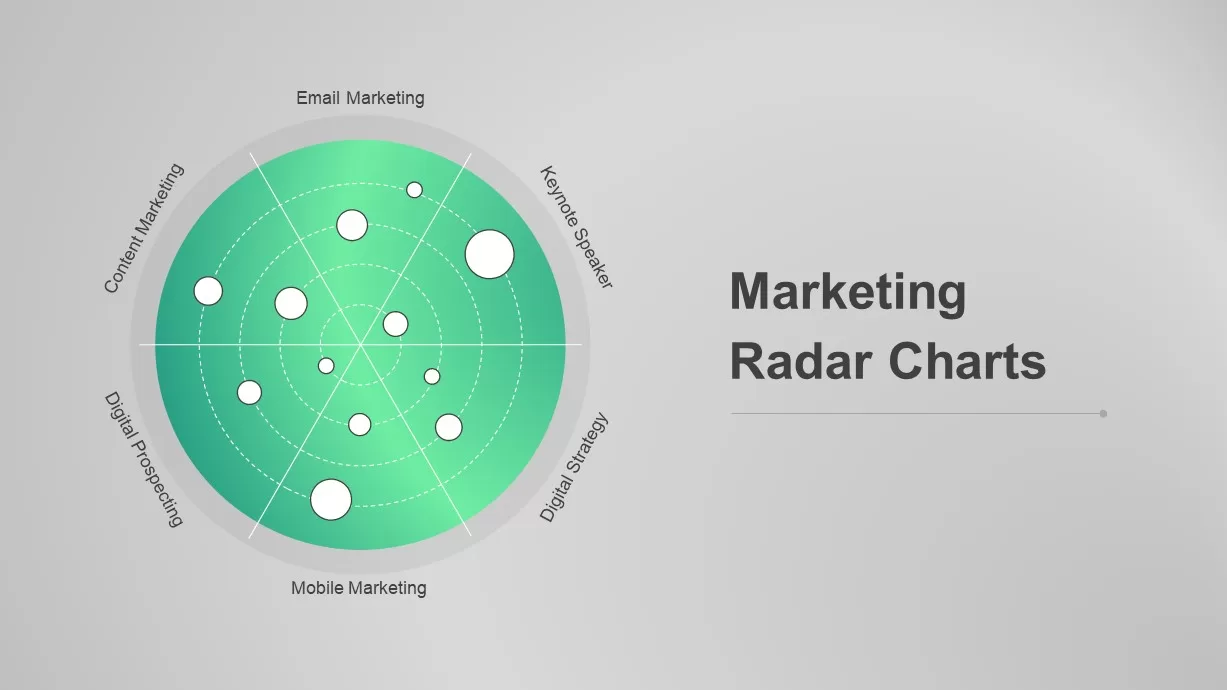
Marketing Radar Charts for PowerPoint
PowerPoint Charts
Premium
-
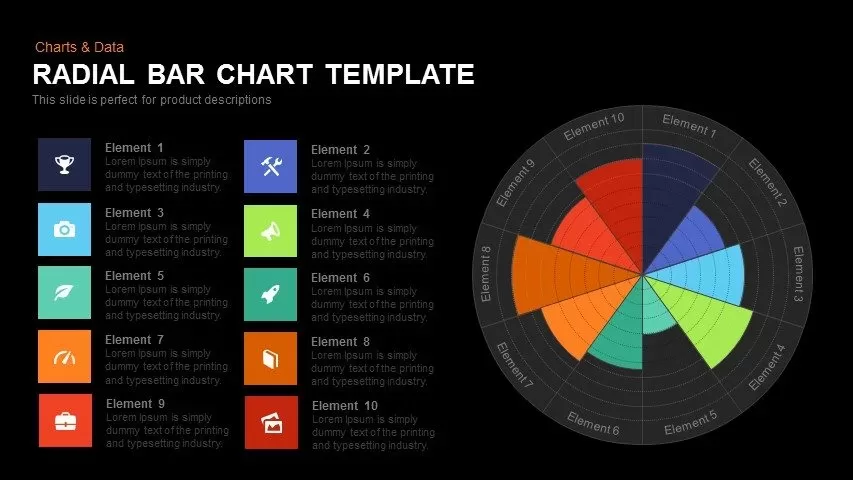
Radial Bar Chart Template for PowerPoint and Keynote
Circular Diagrams
Premium
-

Free Economics PowerPoint Template
Free PowerPoint Templates
Free
-

Graph Paper PowerPoint Template Deck
PowerPoint Templates
Premium
-

Free Charity PowerPoint Template Deck
PowerPoint Templates
Free
-

Free Event Planning PowerPoint Template
Free PowerPoint Templates
Free
-

Customer Experience Loyalty PowerPoint Deck Template
PowerPoint Templates
Premium
-

Free Army PowerPoint Template
PowerPoint Templates
Free
-

Macroeconomics PowerPoint Template
PowerPoint Templates
Premium
-

Free Aviation PowerPoint Template
Free PowerPoint Templates
Free
-
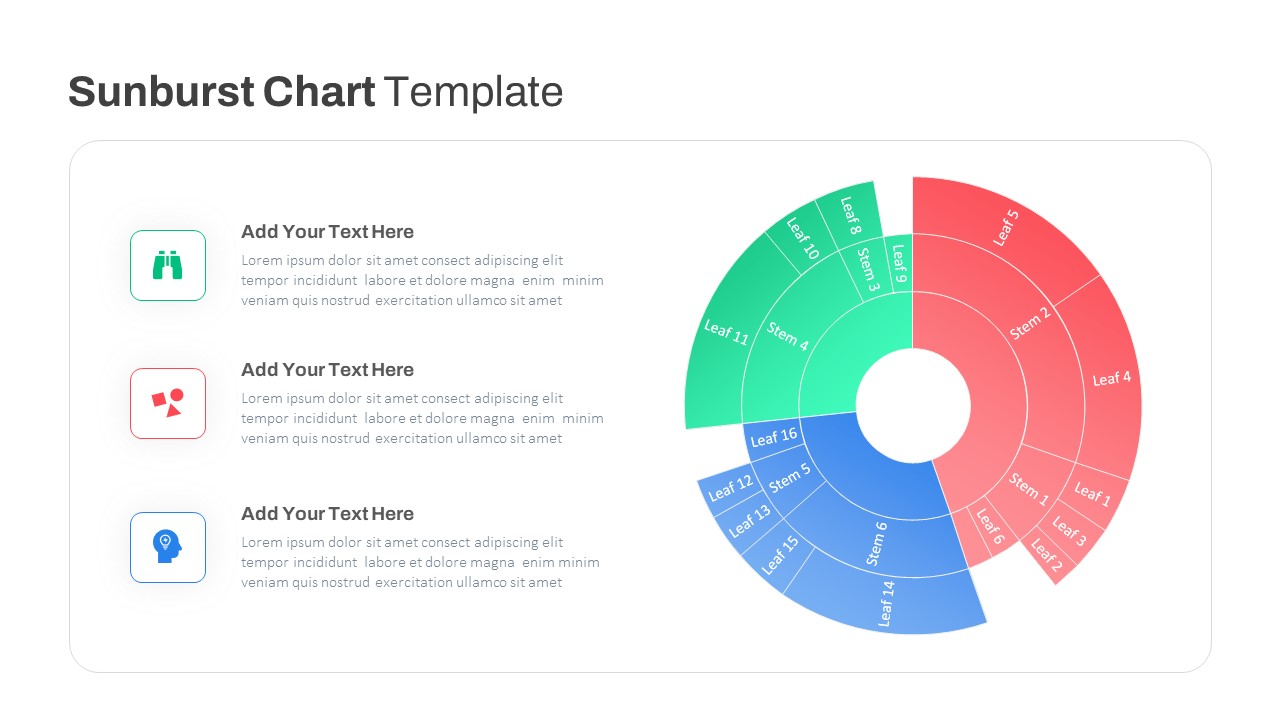
Sun Burst Chart PowerPoint Template
Circular Diagrams
Premium
-

Free Cartoon PowerPoint Template
Free PowerPoint Templates
Free
-

Animated Agriculture PowerPoint Deck Template
PowerPoint Templates
Premium
-

Free University Presentation PowerPoint Template
PowerPoint Templates
Free
-

Free Real Estate Listing PowerPoint Template
Free PowerPoint Templates
Free
-

Global Warming Infographic PowerPoint Template Deck
PowerPoint Templates
Premium
-

Free Book Review PowerPoint Template
Free PowerPoint Templates
Free
-
Free Charts & Graphs Deck PowerPoint Template
PowerPoint Templates
Free
-

Data Science PowerPoint Template
PowerPoint Templates
Premium
-

Annual Report PowerPoint Template and Keynote
PowerPoint Templates
Premium
-

Real Estate PowerPoint Theme
PowerPoint Themes
Premium
-

EFQM Model PowerPoint Template
PowerPoint Templates
Premium
-

Free Dunder Mifflin Paper Company Pitch Deck
Free PowerPoint Templates
Free
-
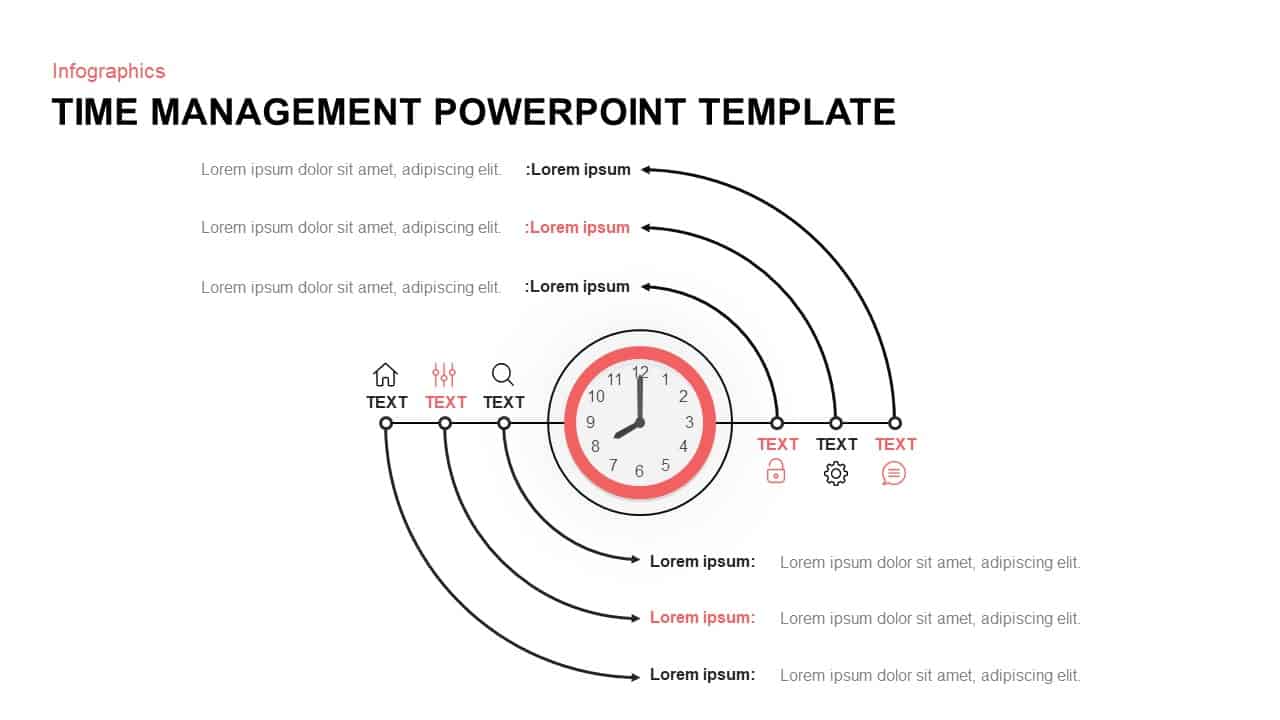
Time Management PowerPoint Template & Keynote Diagram
Timeline PowerPoint Template
Premium
-

Stakeholder Register PowerPoint Template
PowerPoint Templates
Premium
-

Free AI Artificial Intelligence PowerPoint Template
PowerPoint Templates
Free
-
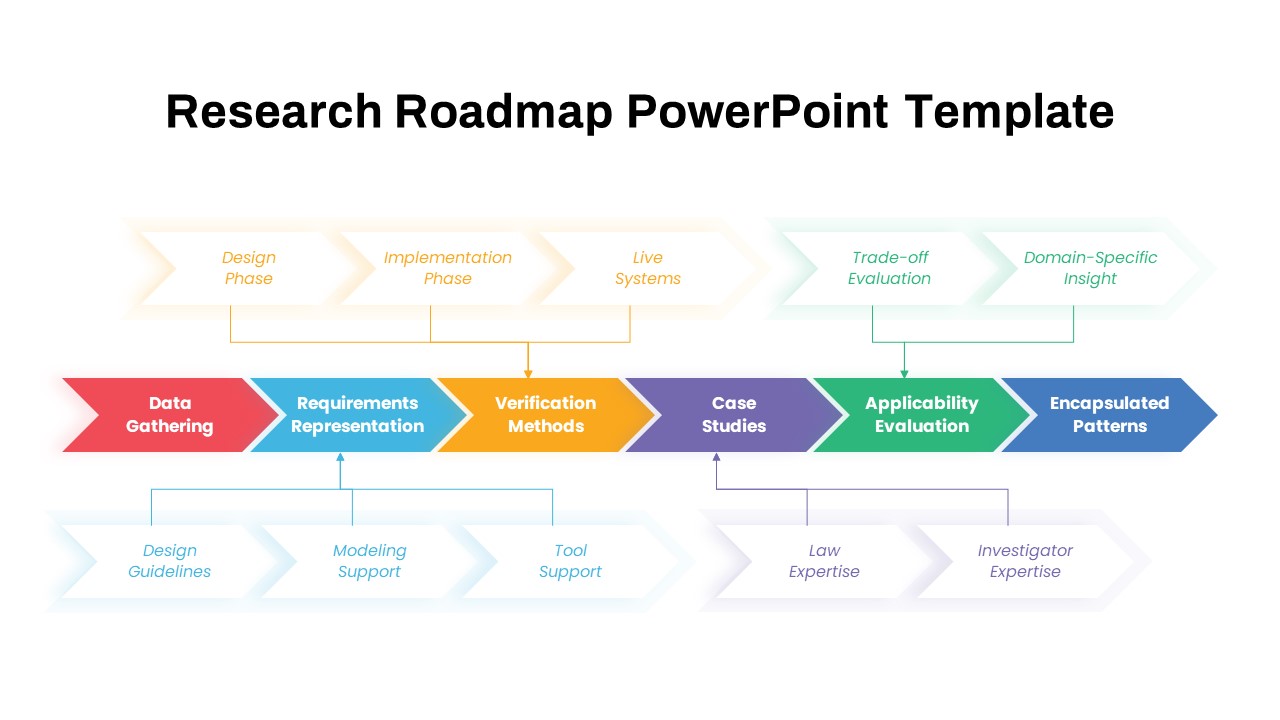
Research Roadmap PowerPoint Template
PowerPoint Templates
Premium
-

Business Process Reengineering Template
PowerPoint Templates
Premium
-
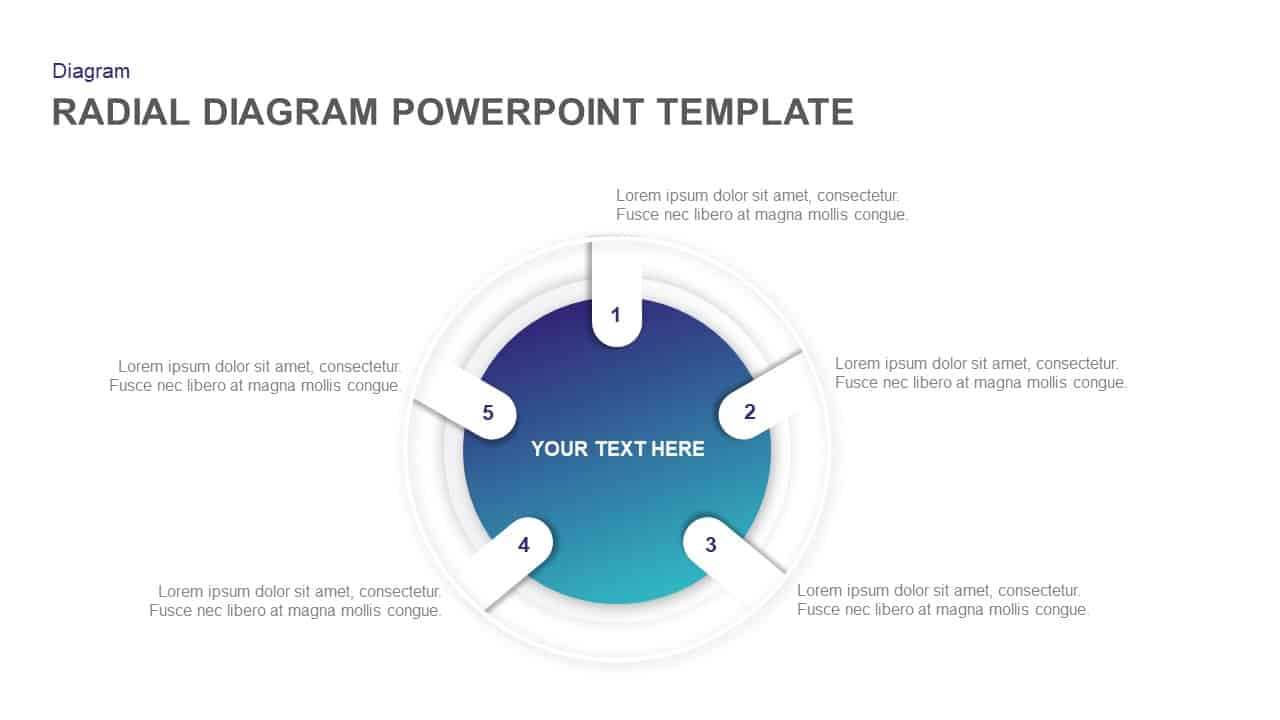
Radial Diagram PowerPoint Template and Keynote Slide
Circular Diagrams
Premium
-

Animated Upcoming Event Poster PowerPoint Template
PowerPoint Templates
Premium
-

Biotechnology PowerPoint Presentation Template
PowerPoint Templates
Premium
-
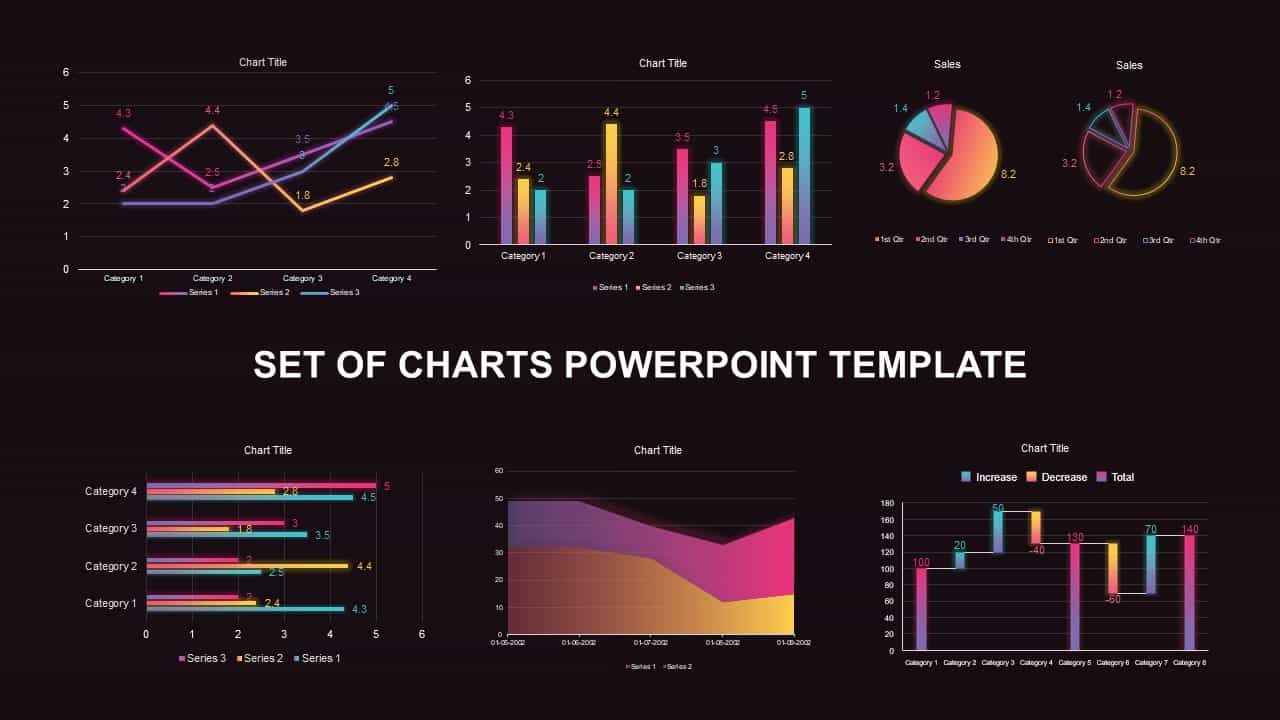
Set of Chart PowerPoint Template and Keynote Diagram
PowerPoint Charts
Premium
-

Research Presentation PowerPoint Template Free
PowerPoint Templates
Free
-

Free Charts and Graphs PowerPoint Template
PowerPoint Templates
Free
-

Mekko Chart Template
PowerPoint Templates
Premium
-

Combination Chart PowerPoint Template
PowerPoint Charts
Premium
-

Cyber Monday PowerPoint Template
PowerPoint Business Templates
Premium
-

Proportional Area Chart PowerPoint Template
PowerPoint Templates
Premium
-

Research PowerPoint Template and Metaphor Keynote Template
Keynote Templates
Premium
-
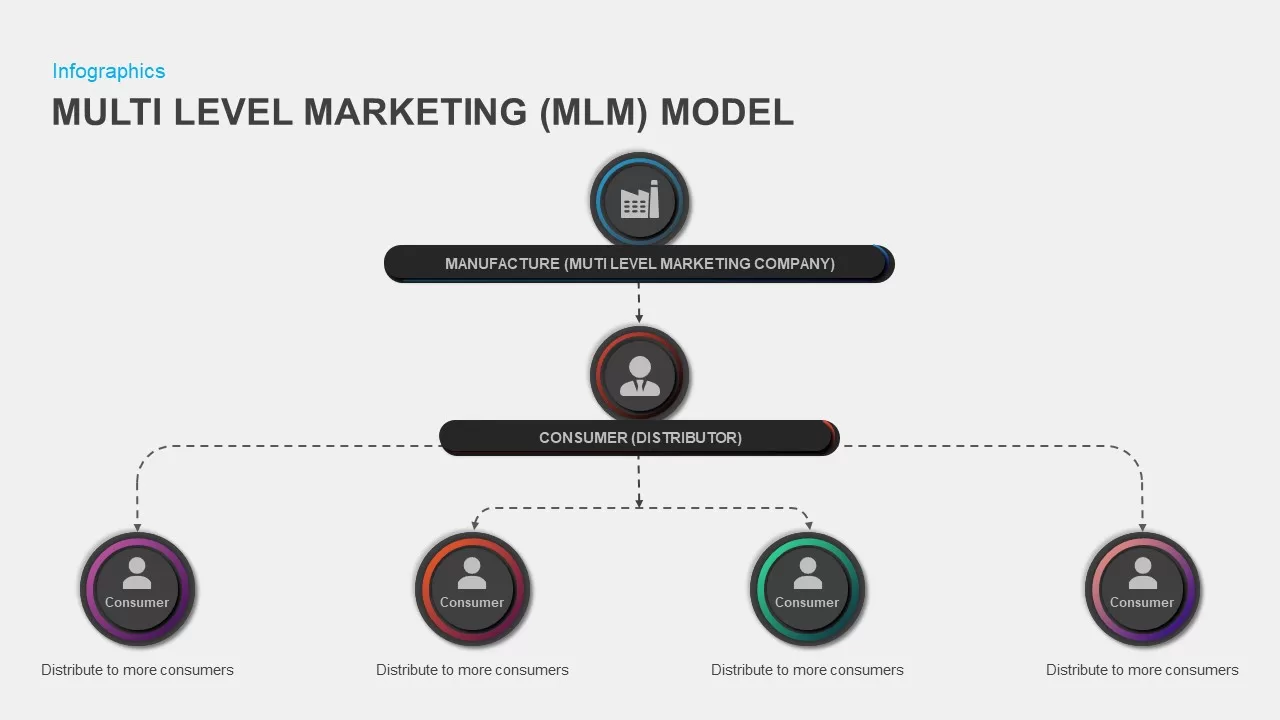
Multi-Level Marketing PowerPoint Template
PowerPoint Templates
Premium
-

Open Door Policy PowerPoint Template
PowerPoint Templates
Premium
-
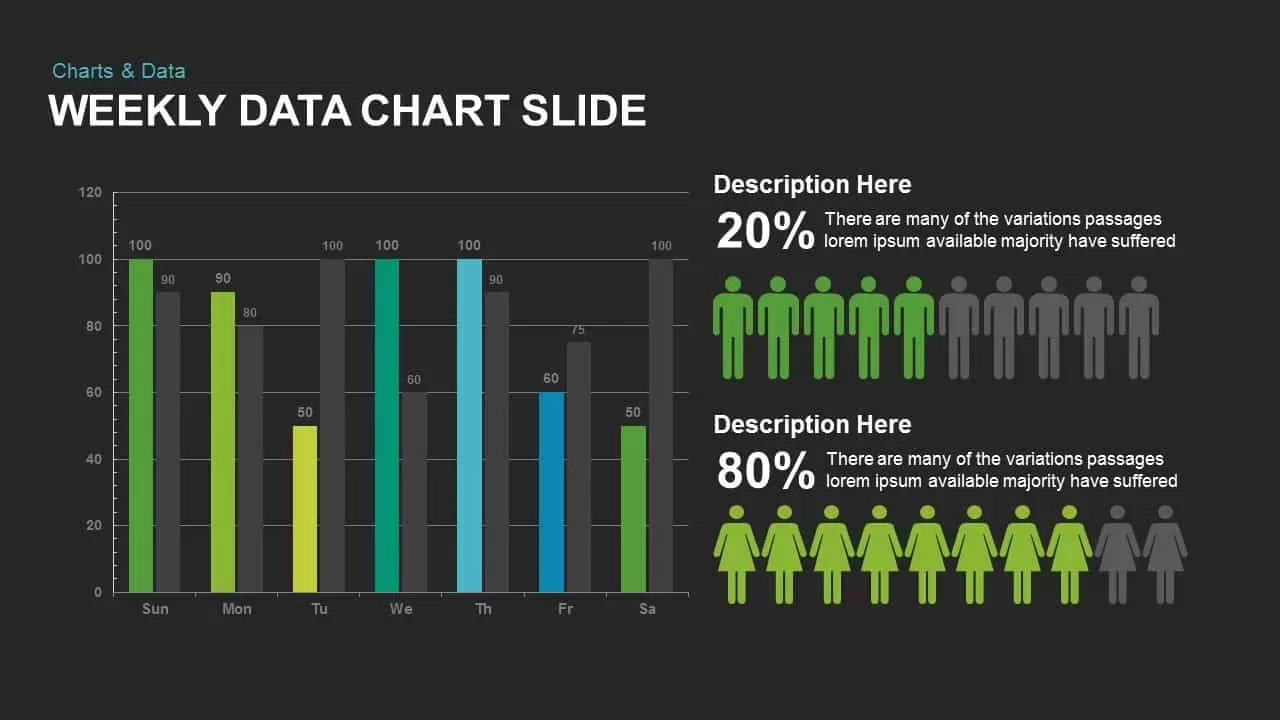
Weekly Data Charts PowerPoint Presentation Template and Keynote Slide
Infographic
Premium
-
Go To Market PowerPoint Template
PowerPoint Templates
Premium
-
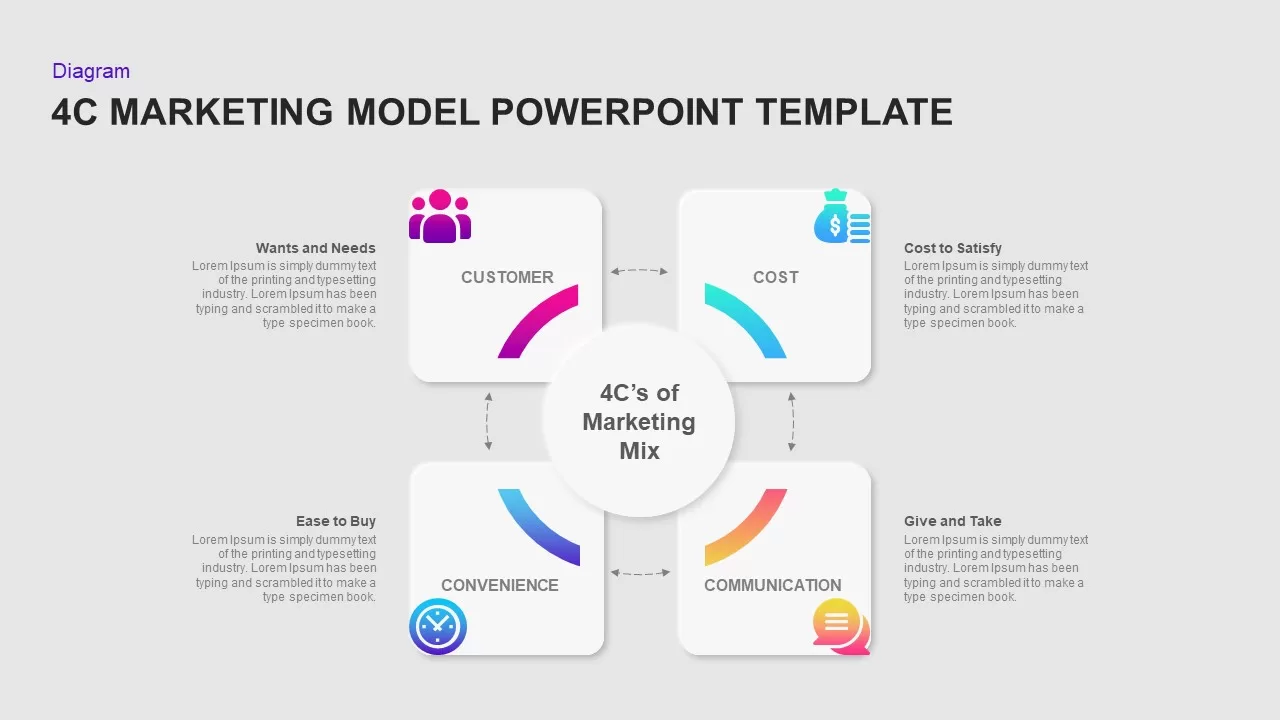
4C marketing model PowerPoint template
PowerPoint Templates
Premium
-
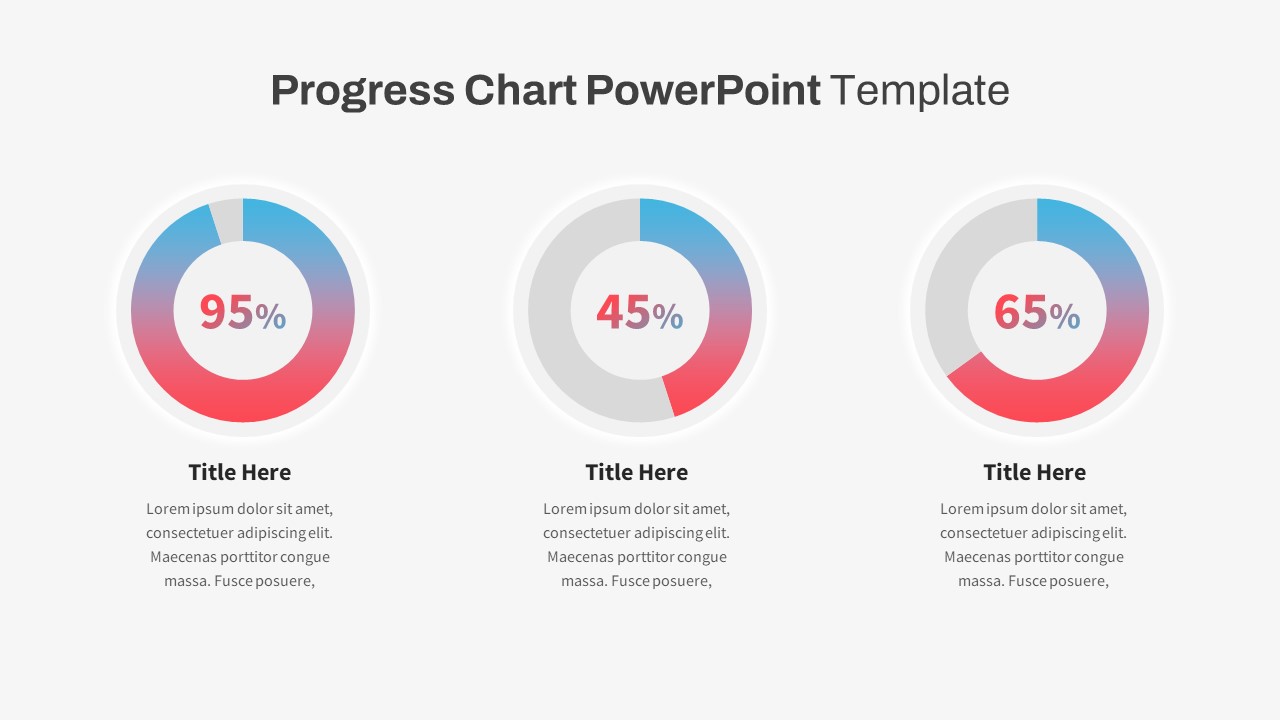
Progress Chart PowerPoint Template
PowerPoint Templates
Premium
-
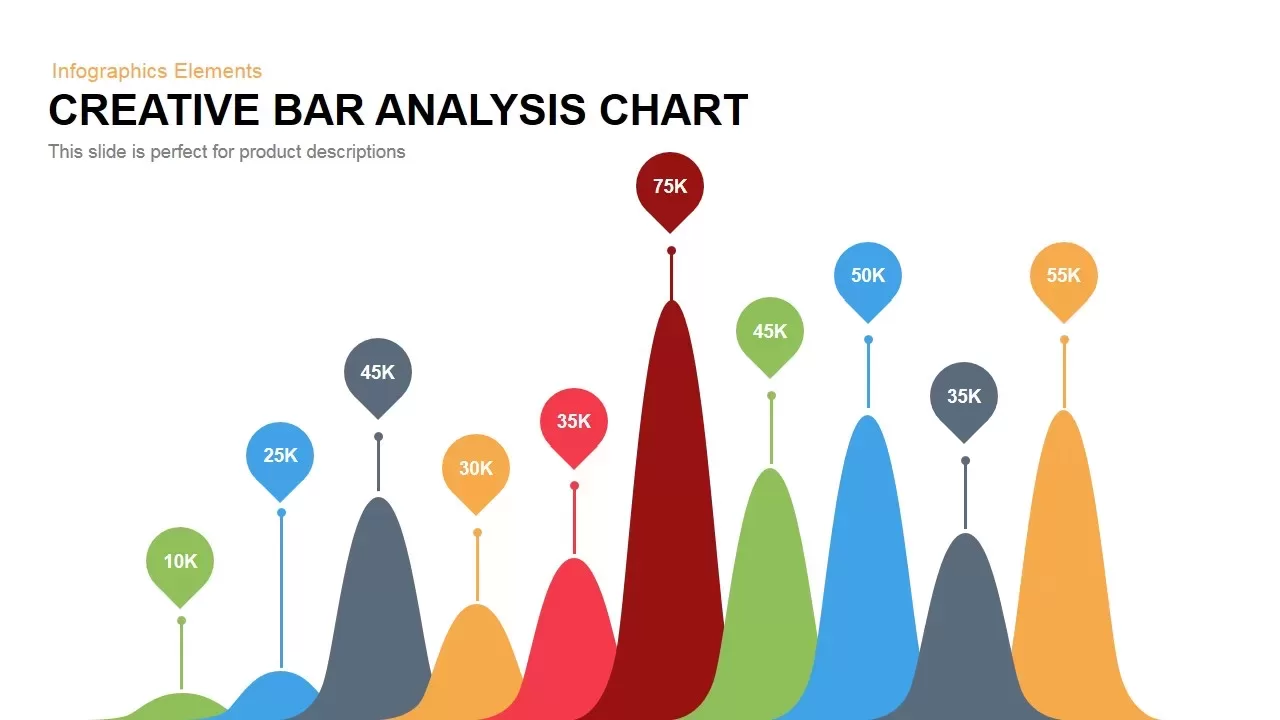
Creative Bar Chart Analysis PowerPoint Template and Keynote
Column and Bar chart
Premium
-
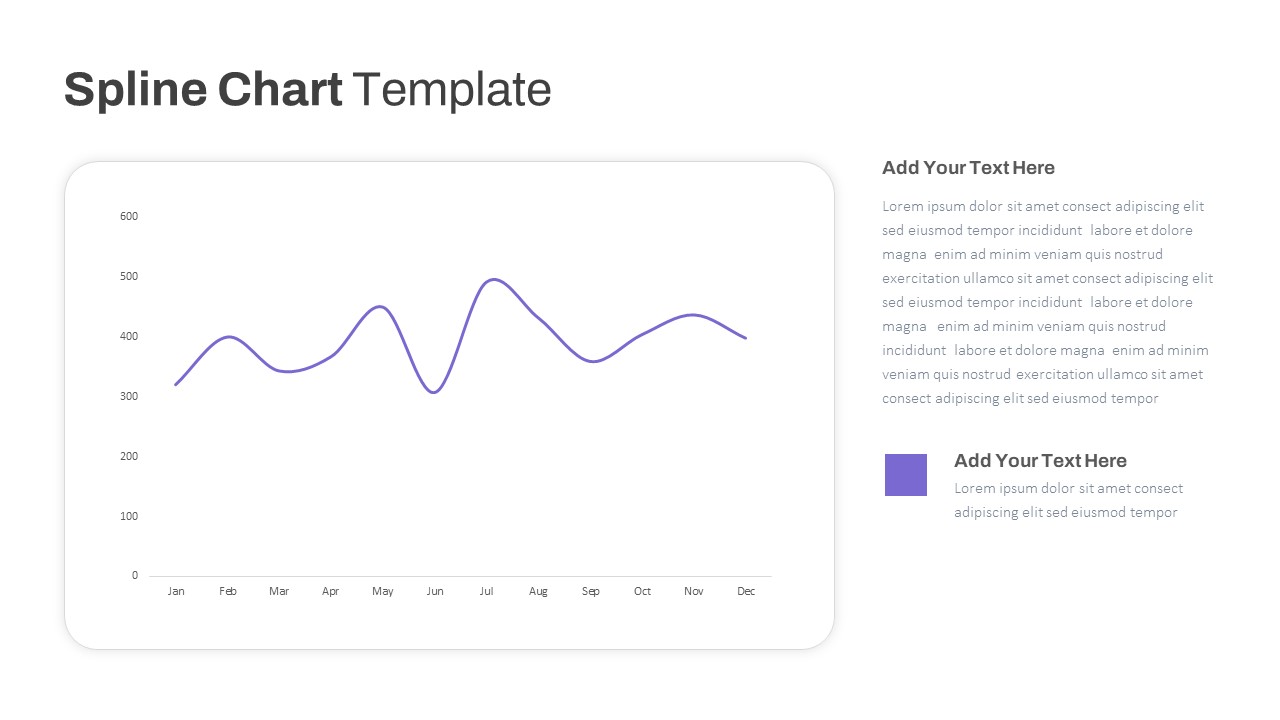
Spline Chart PowerPoint Template
PowerPoint Charts
Premium
-
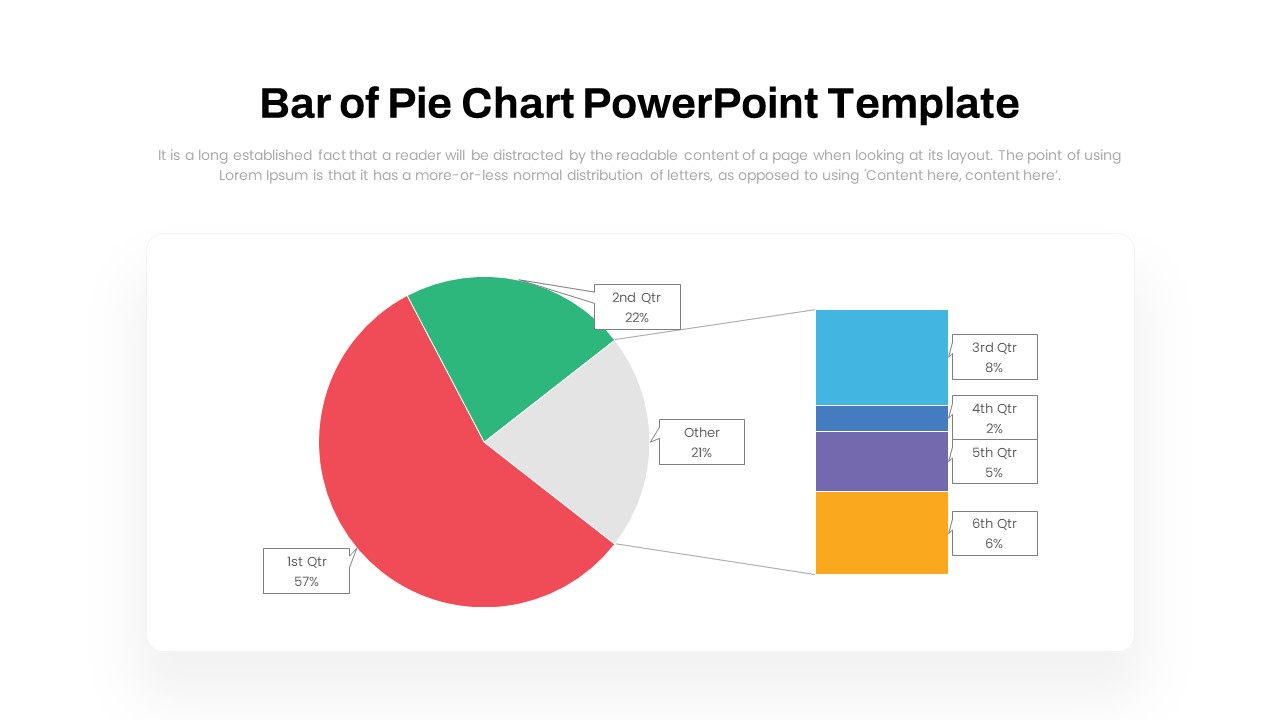
Bar of Pie Chart PowerPoint Template
PowerPoint Templates
Premium
-
Creative Studio PowerPoint Template
PowerPoint Business Templates
Premium
-

Area Chart PowerPoint Template
PowerPoint Charts
Premium
-

Power Analogy Metaphor PowerPoint Template
Metaphor, Simile & Analogy
Premium
-

Digital Marketing Templates
Infographic
Premium
-
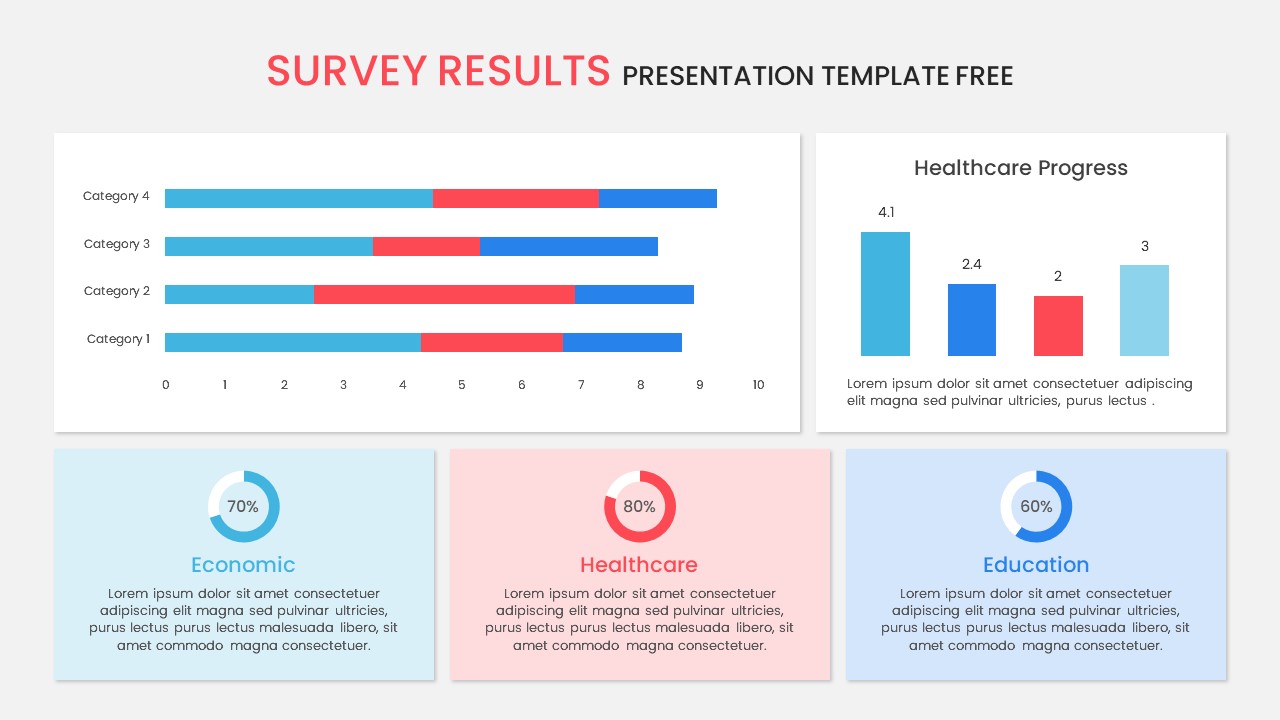
Survey Results PowerPoint Template Free
Free PowerPoint Templates
Free
-

Creative Bar Chart Data Analysis PowerPoint Template and Keynote
Infographic
Premium
-
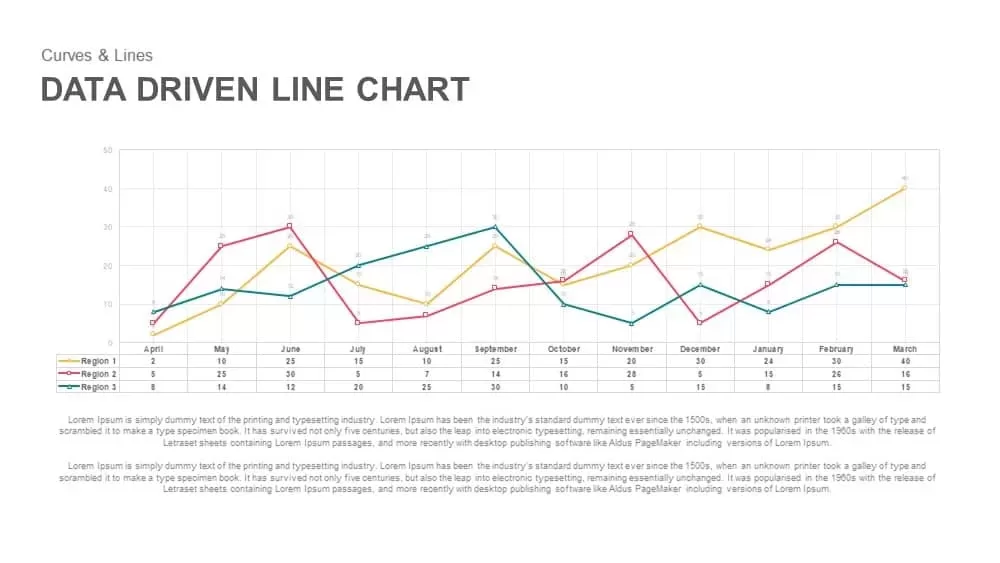
Data Driven Line Chart Template for PowerPoint & Keynote
Curves and Lines
Premium
-

Case Study PowerPoint and Keynote Template
PowerPoint Templates
Premium
-

Digital Marketing PowerPoint Template
Social Media
Premium
-

Clustered Column Chart PowerPoint Template
PowerPoint Charts
Premium
-
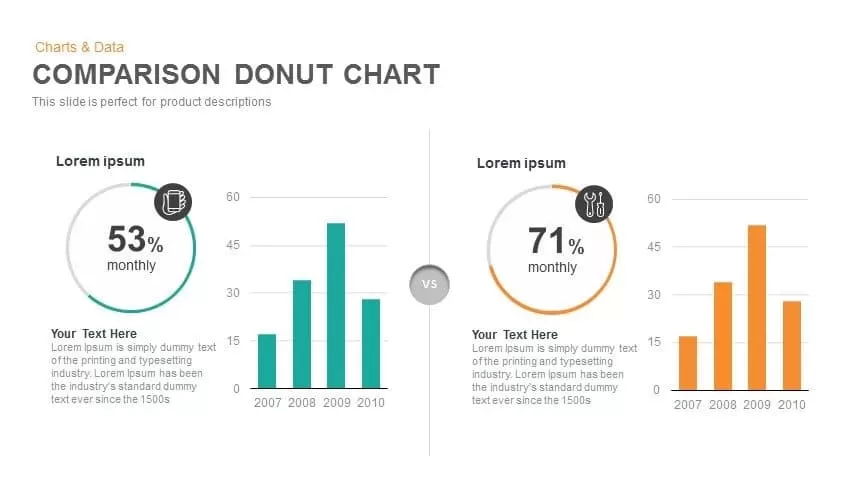
Comparison Donut Chart PowerPoint Template and Keynote
Keynote Templates
Premium
-

Multipurpose Business PowerPoint Template
PowerPoint Business Templates
Premium
-
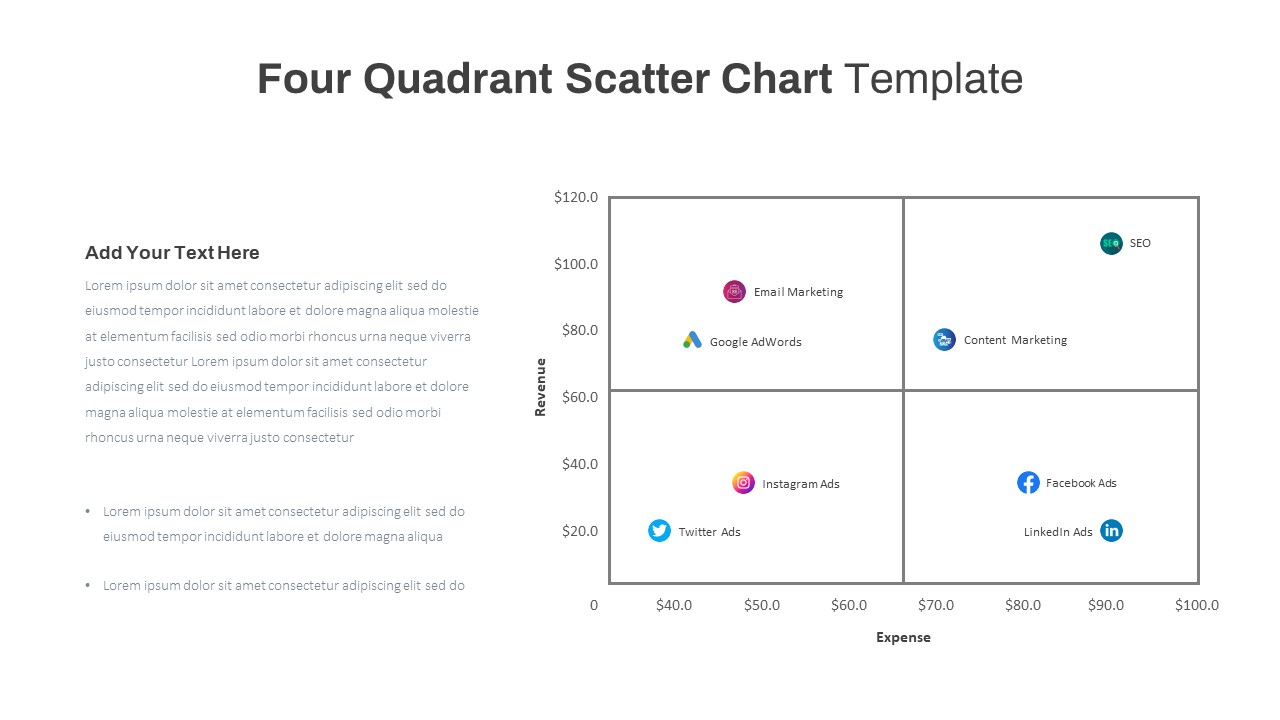
Four Quadrant Scatter Chart PowerPoint Template
PowerPoint Charts
Premium
-
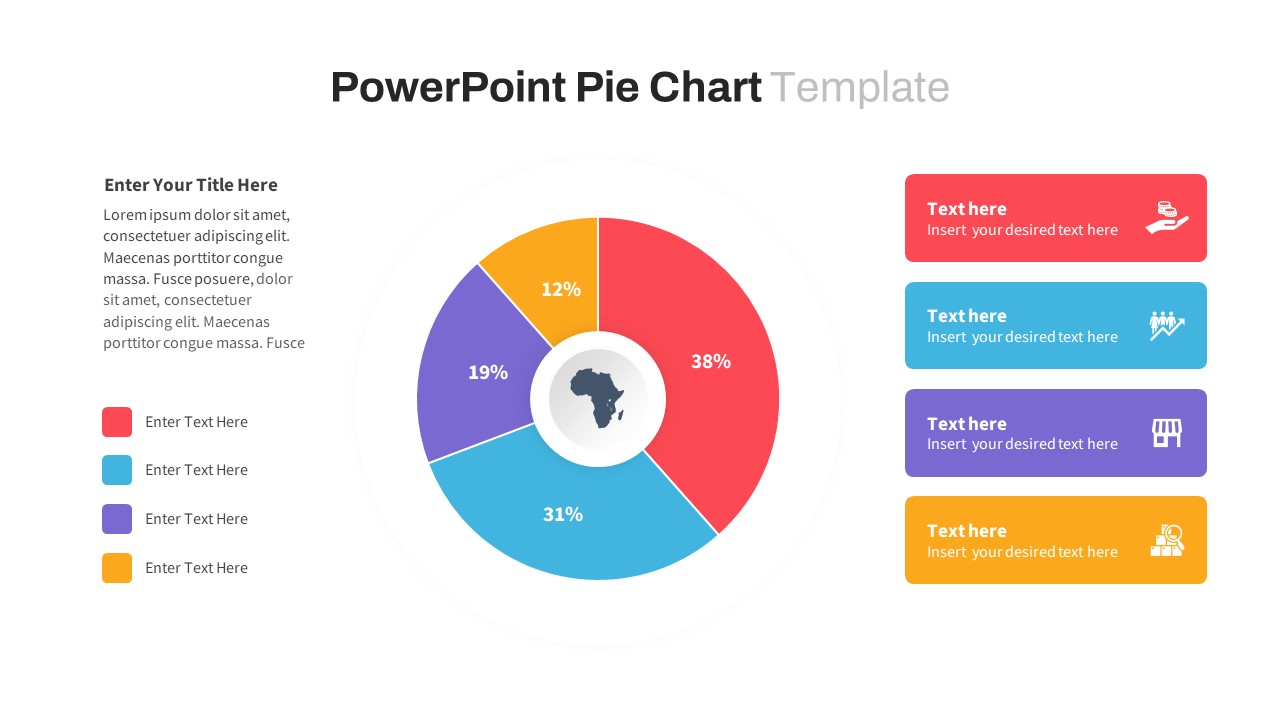
Pie Chart PowerPoint Template
Infographic
Premium
-
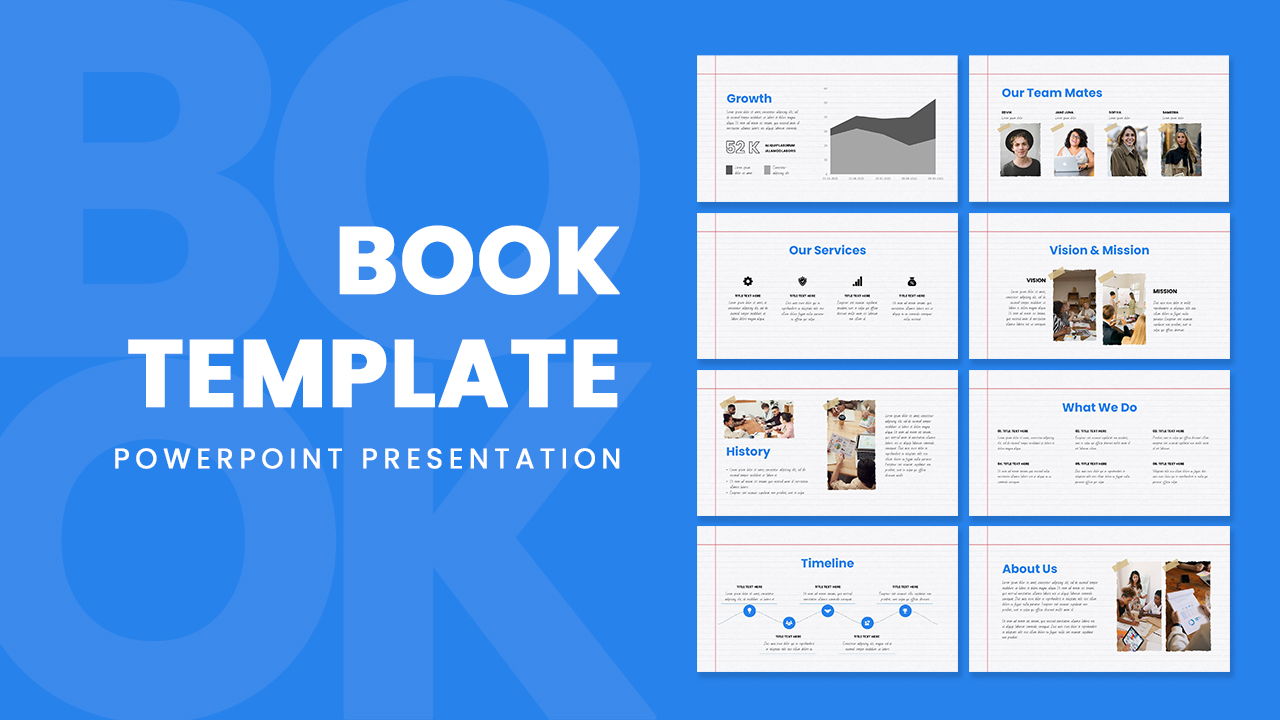
Free PowerPoint Book Template
Free slides
Free
-
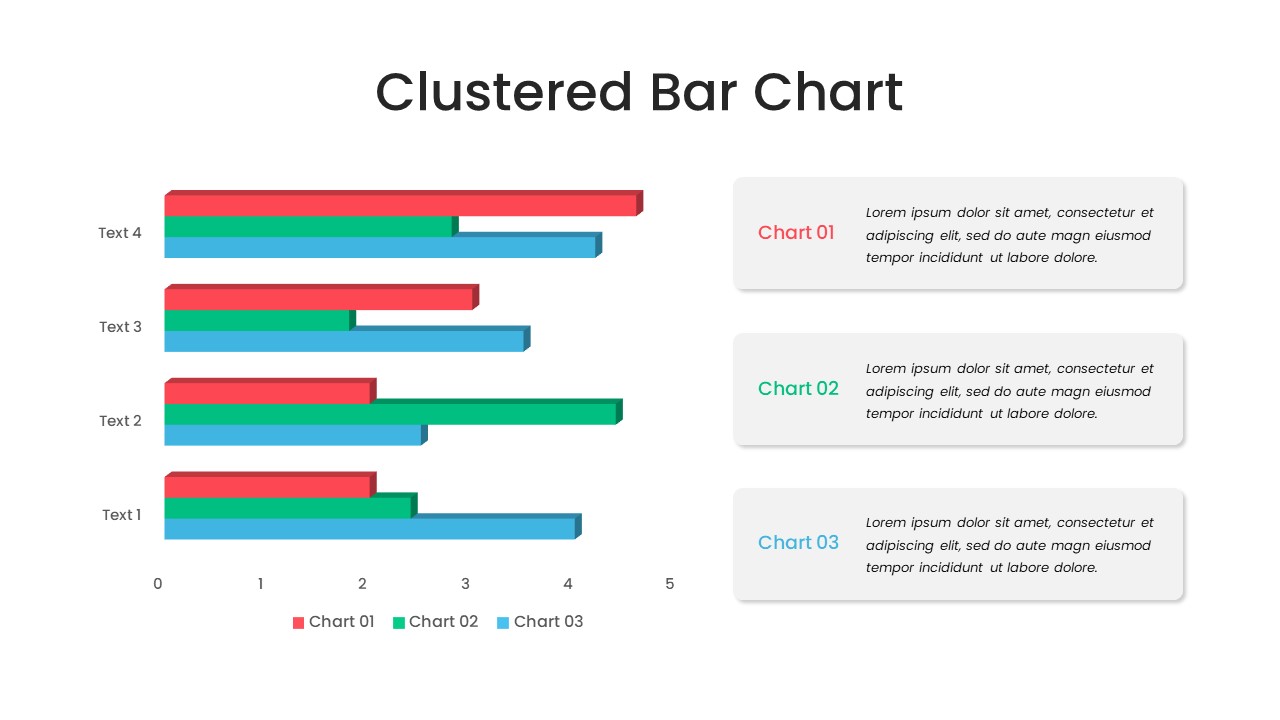
Clustered Bar Chart PowerPoint Template
Column and Bar chart
Premium
-
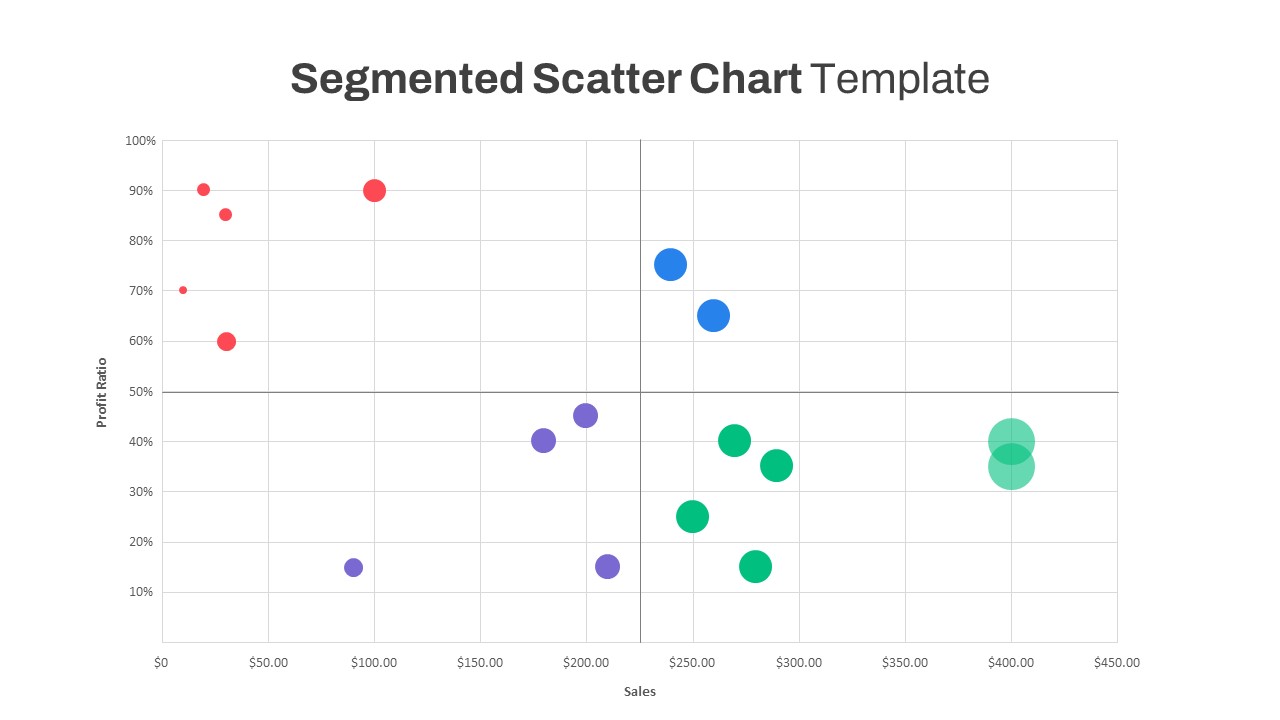
Segmented Scatter Chart PowerPoint Template
PowerPoint Charts
Premium
-
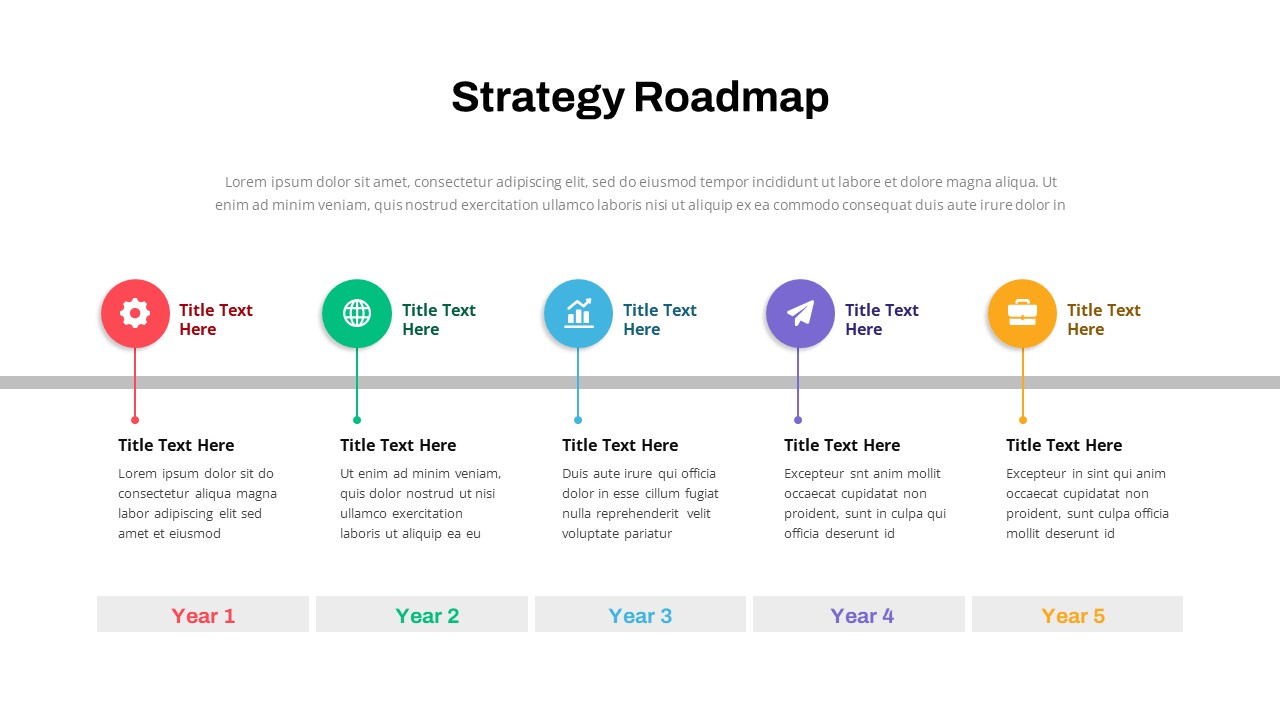
Data Strategy Roadmap PowerPoint Template
PowerPoint Templates
Premium
-
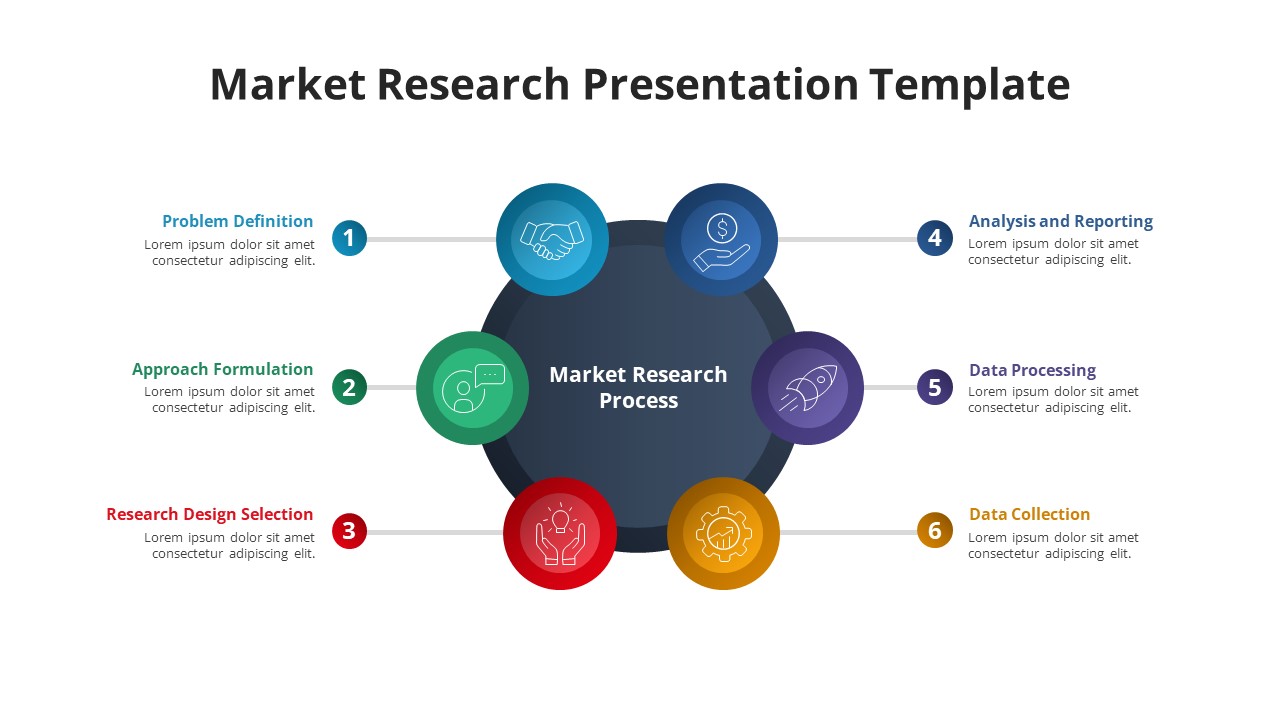
Market Research PowerPoint Template Free
PowerPoint Templates
Free
-
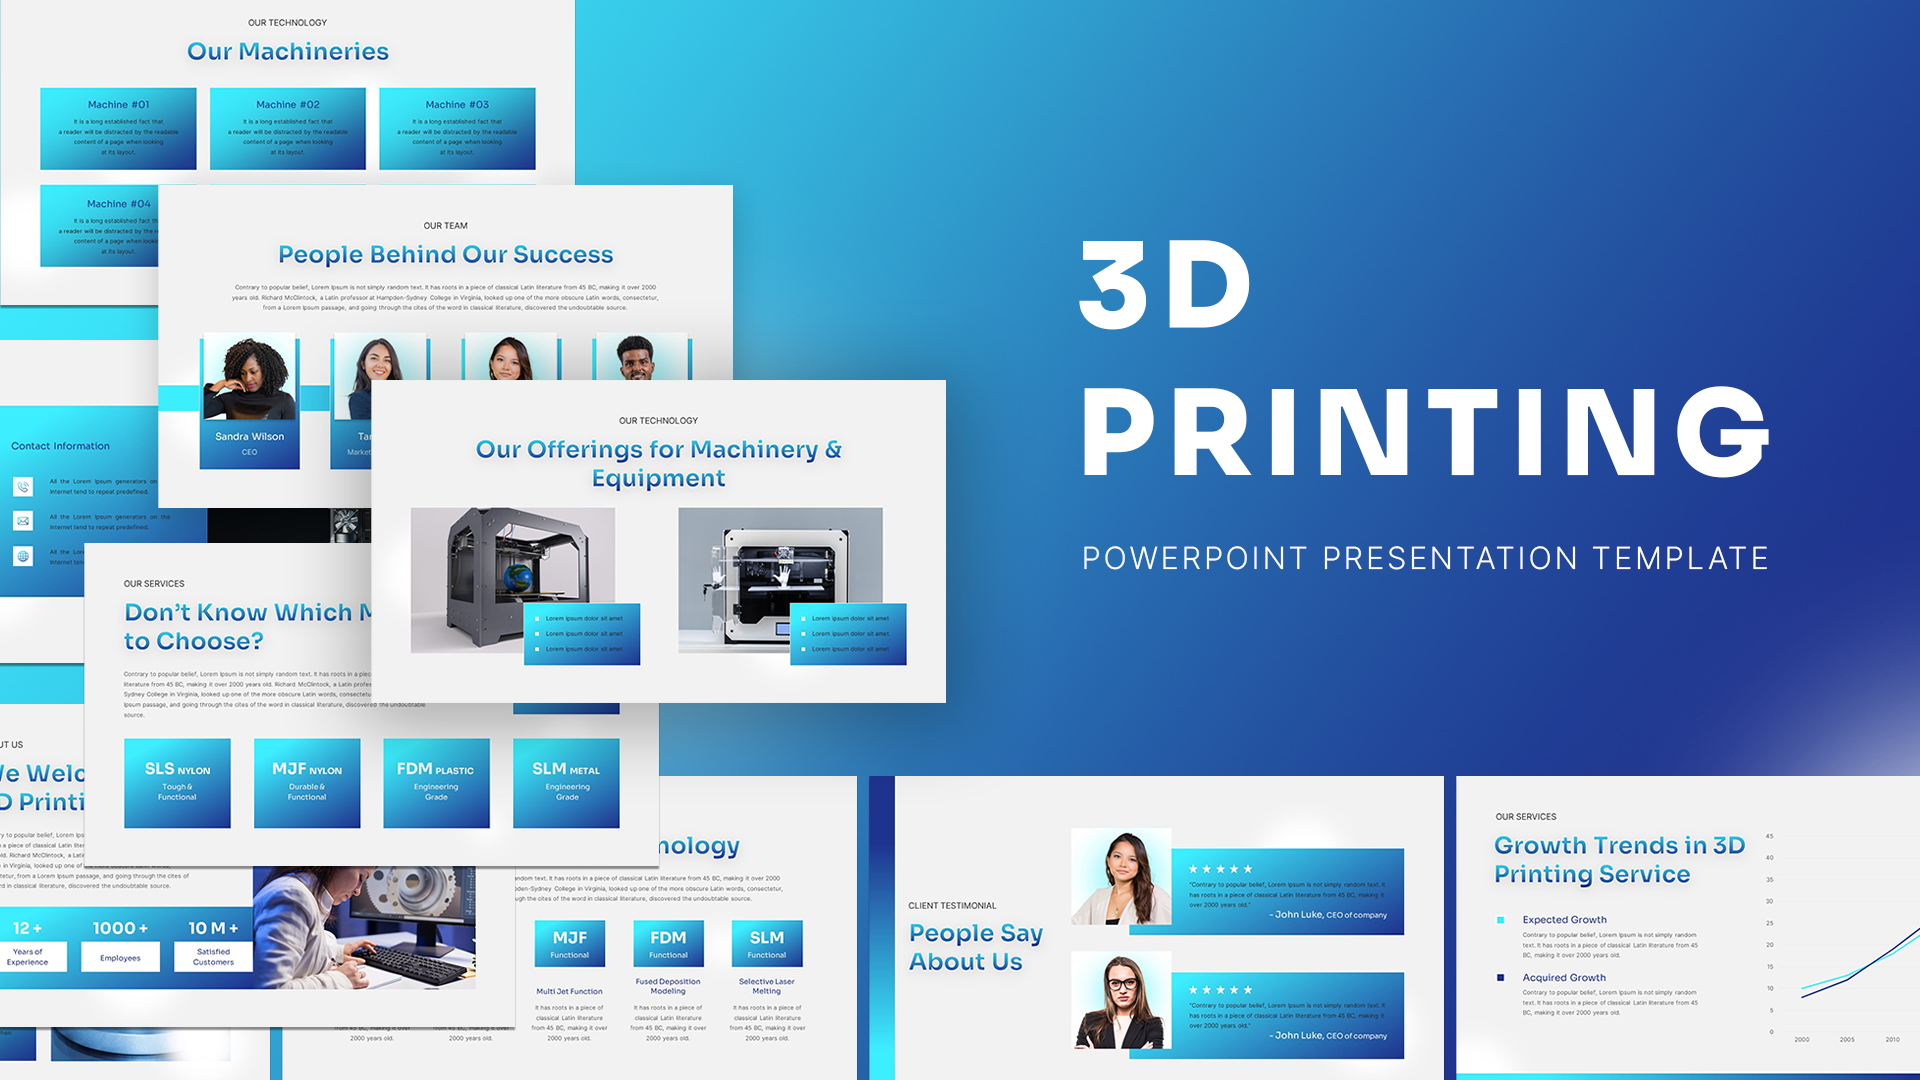
3D Printing Deck PowerPoint Template
PowerPoint Templates
Premium
-

Finance Consulting PowerPoint Template
PowerPoint Templates
Premium
-
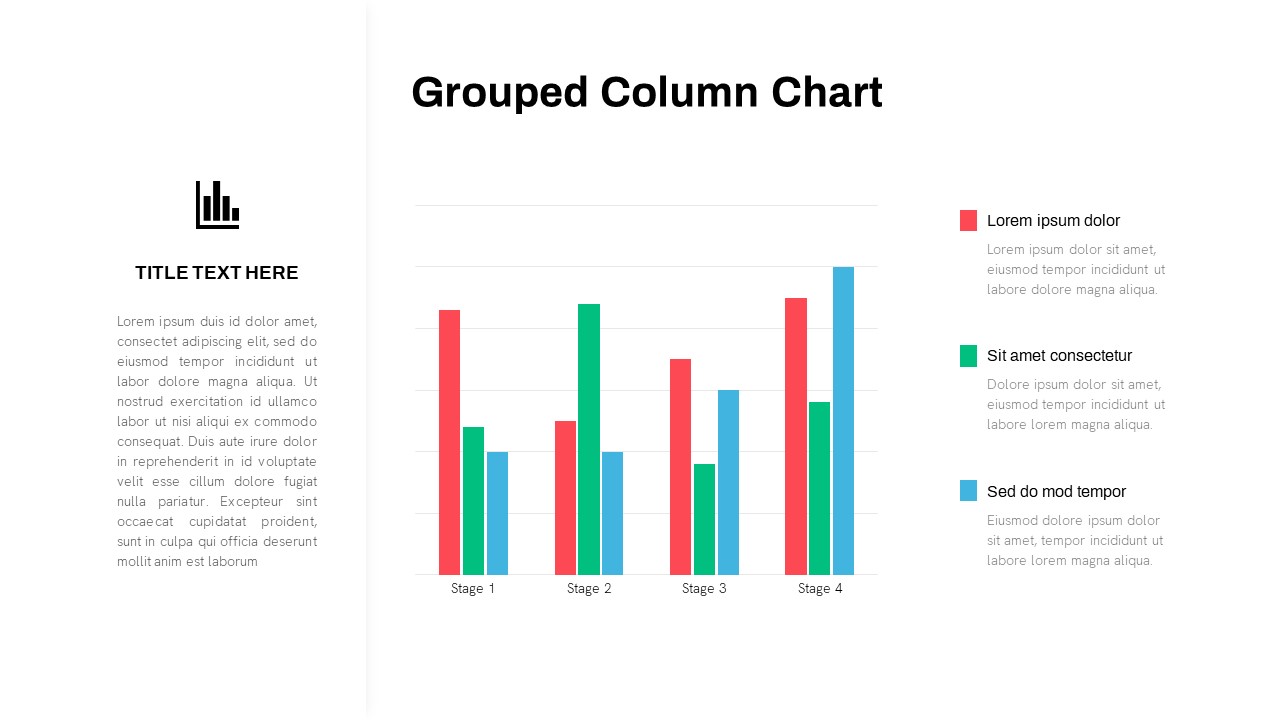
Grouped Column Chart PowerPoint Template
Column and Bar chart
Premium
-

Animated Clustered Bar Chart PowerPoint Template
PowerPoint Charts
Premium
-
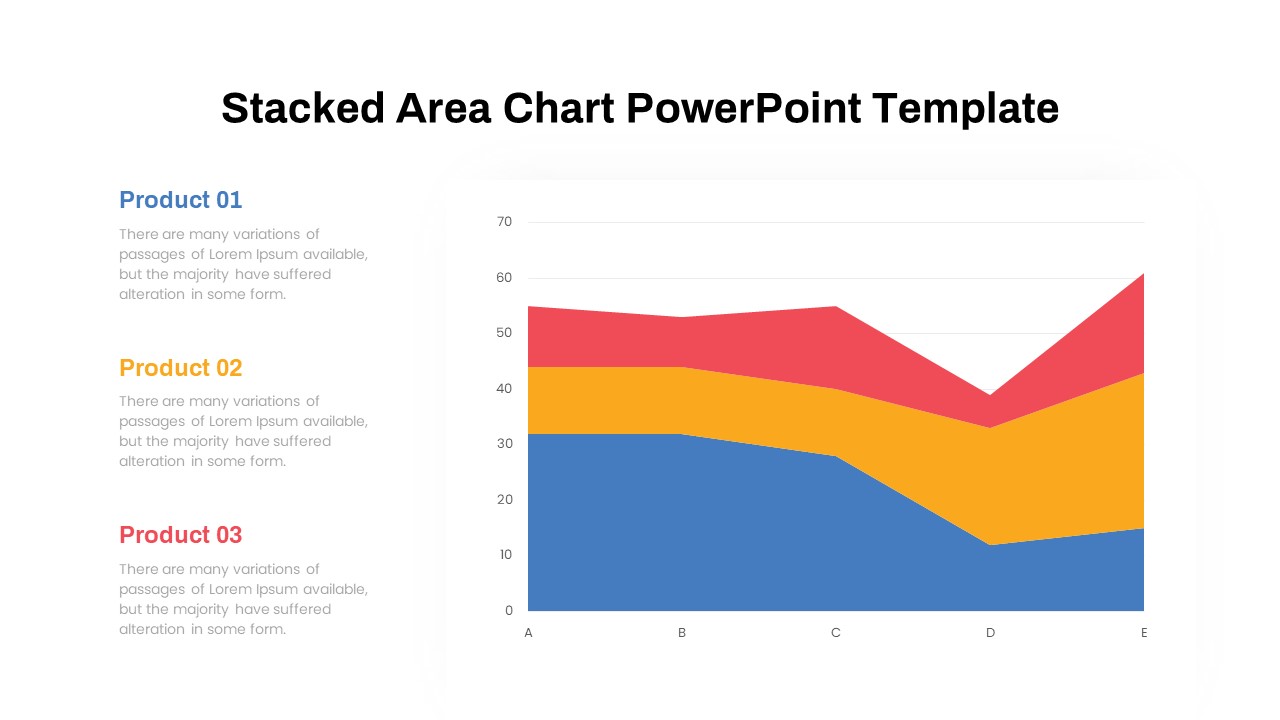
Stacked Area Chart PowerPoint Template
PowerPoint Charts
Premium
-
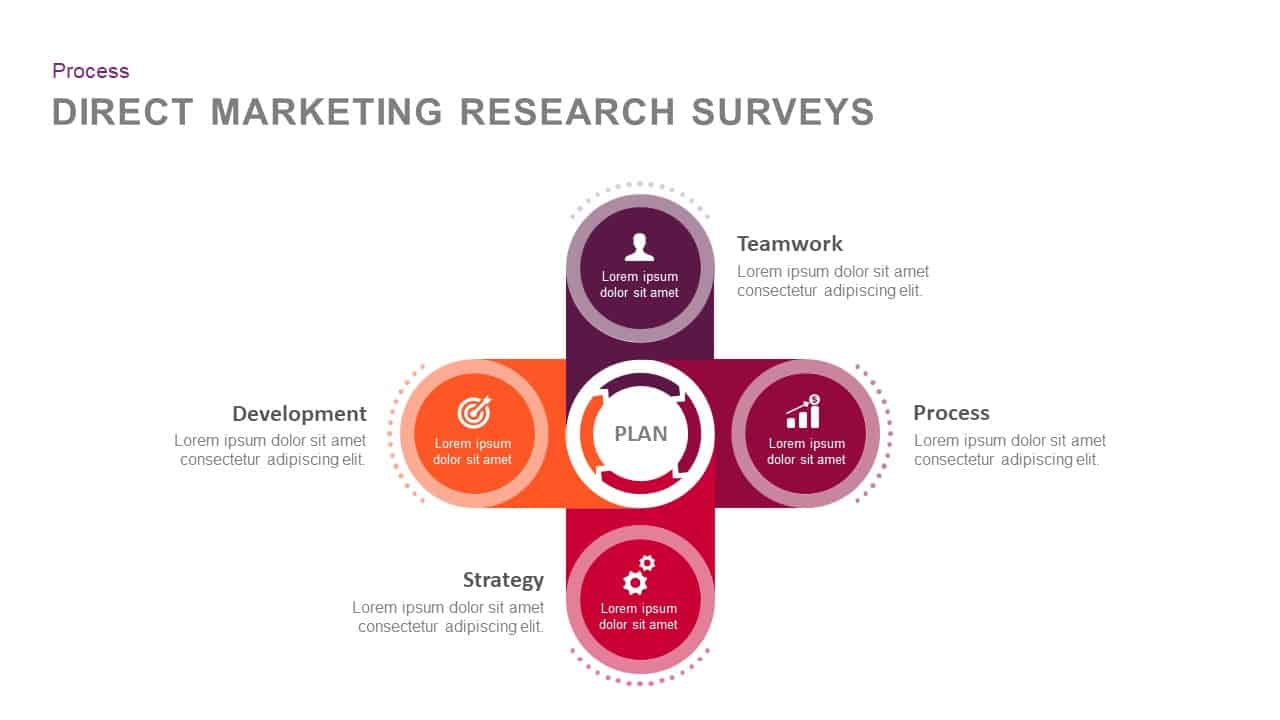
Direct Marketing Research Survey PowerPoint and Keynote Slides
Diagrams
Premium
-
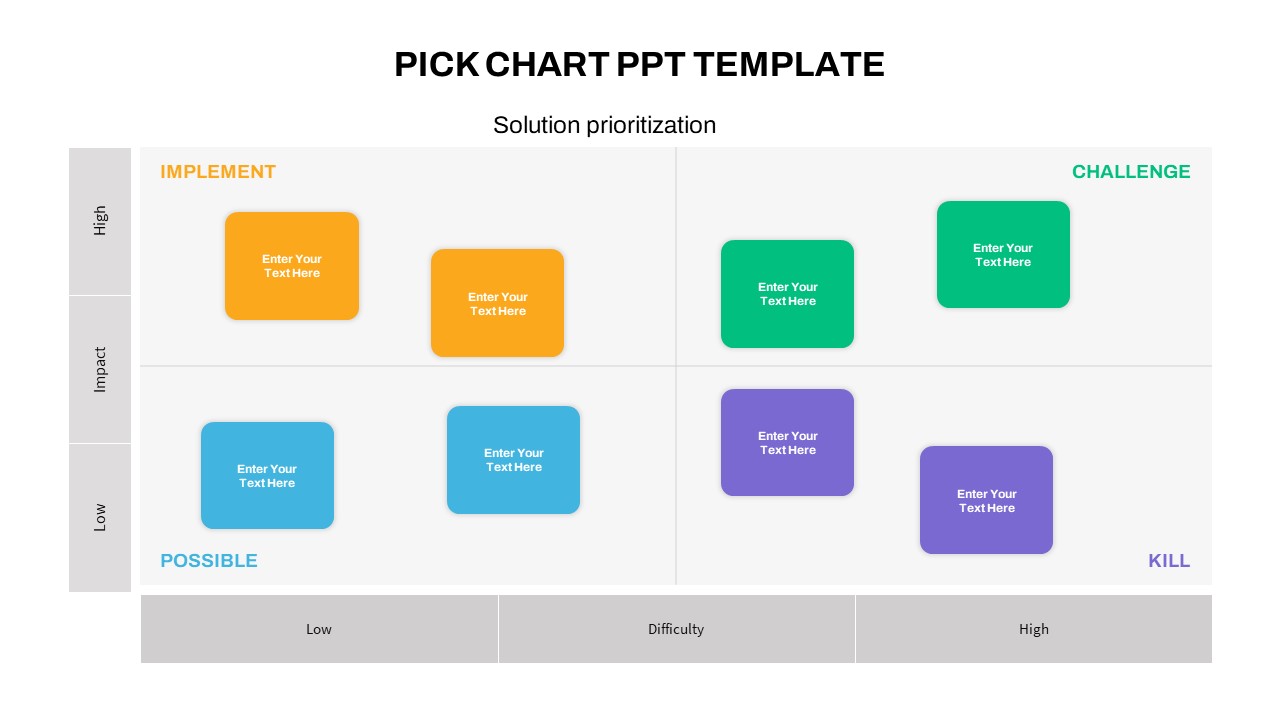
Kaizen Pick Chart PowerPoint Template
PowerPoint Templates
Premium
-
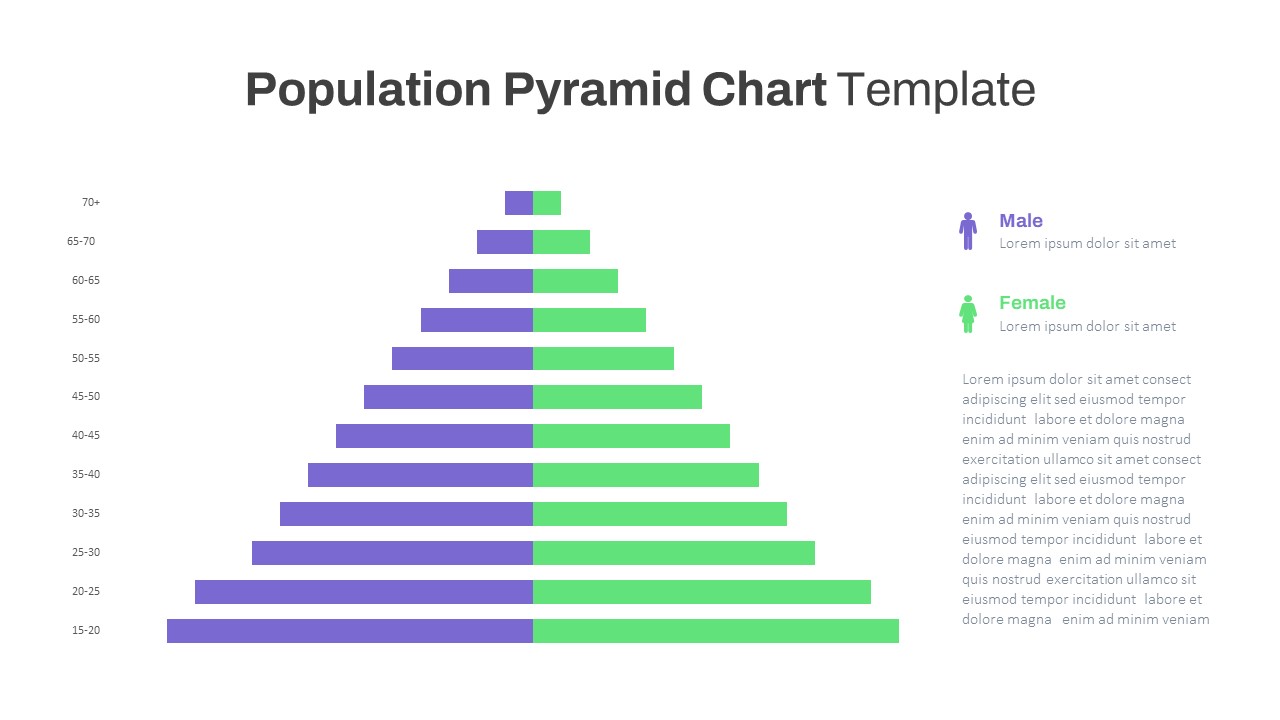
Population Pyramid Chart PowerPoint Template
PowerPoint Templates
Premium
-
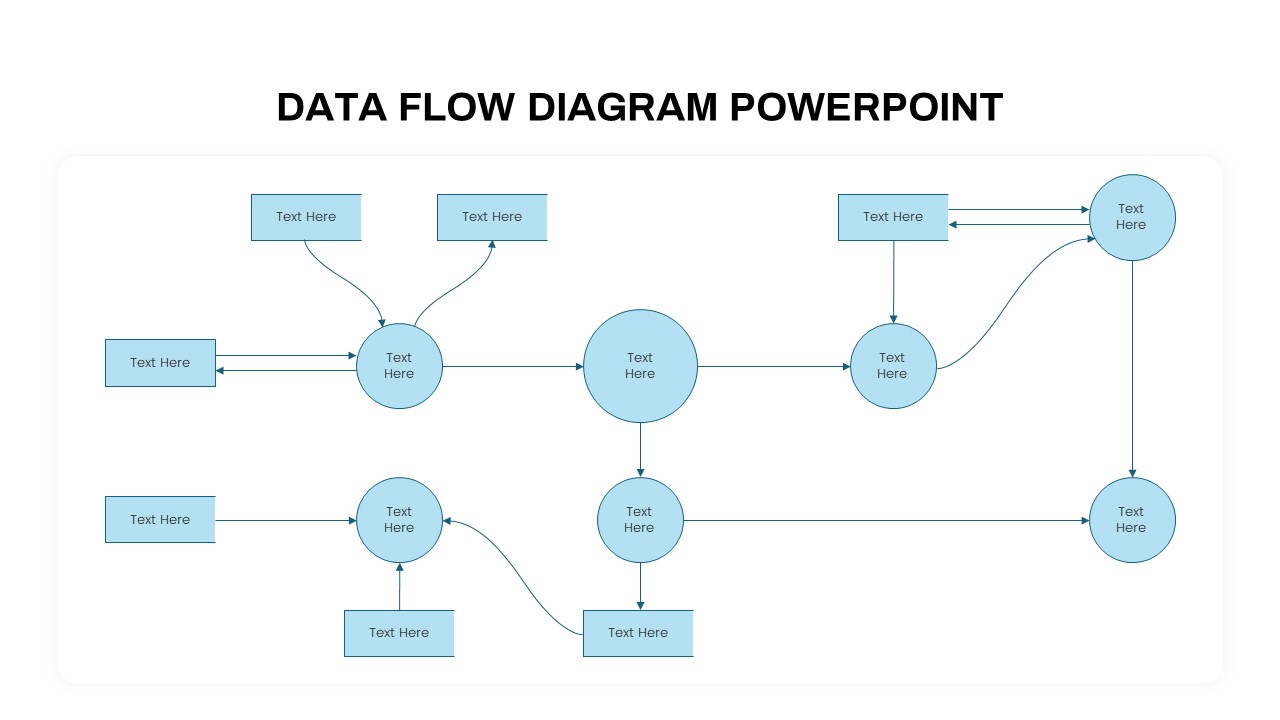
Data Flow PowerPoint Presentation Template
PowerPoint Templates
Premium
-
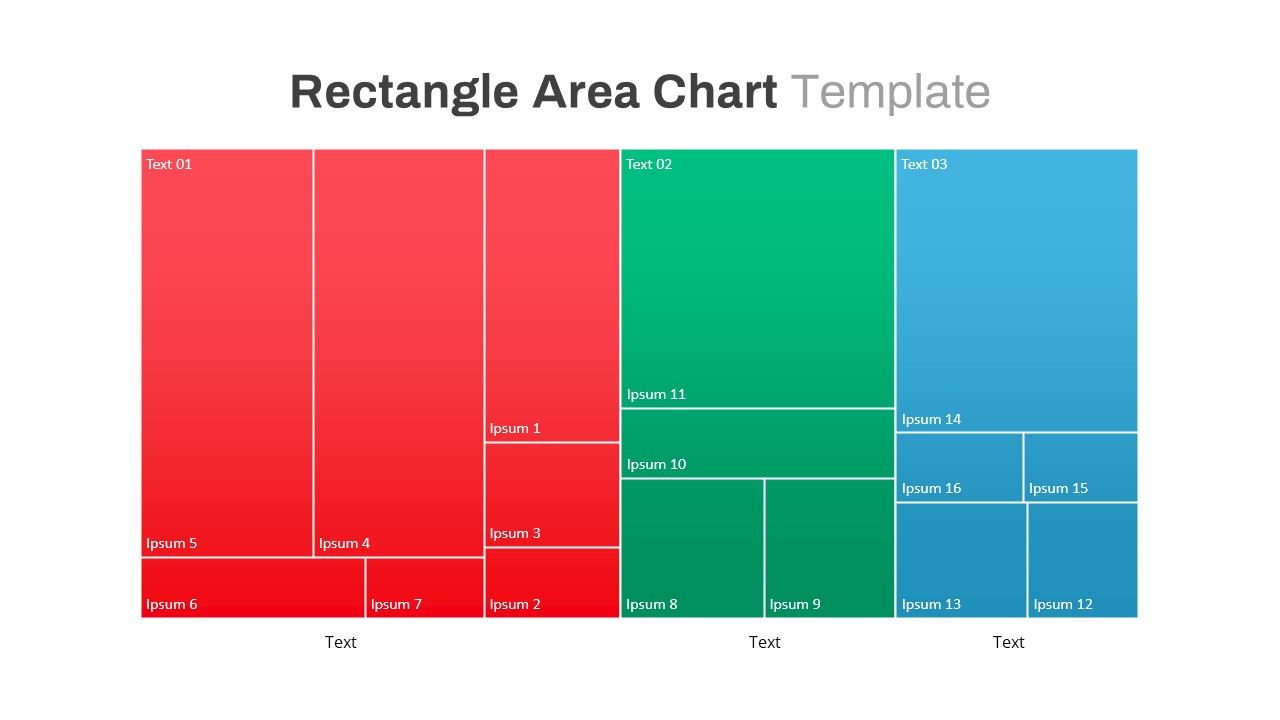
Rectangle Area Chart Template
PowerPoint Charts
Premium
-
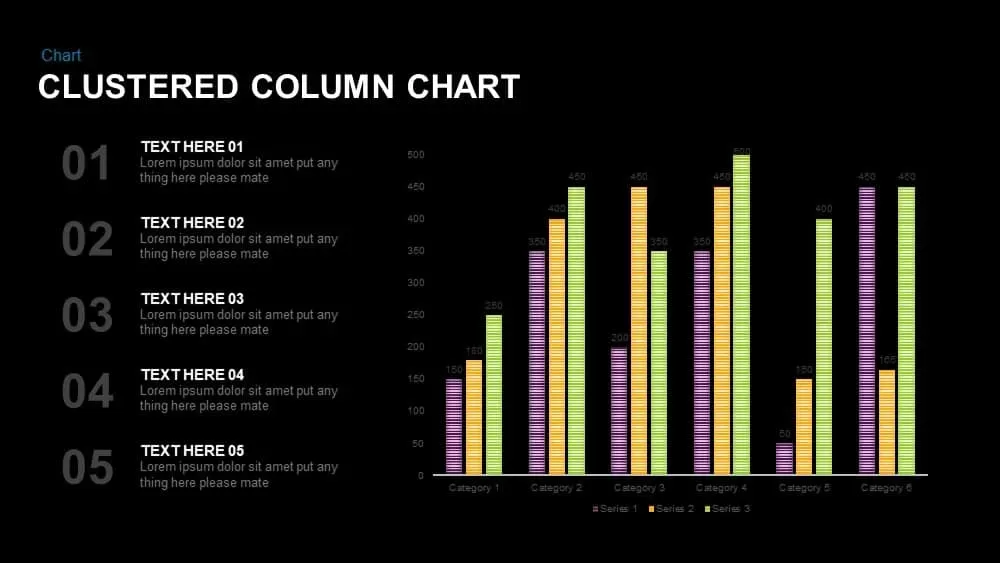
Clustered Column Chart PowerPoint and Keynote Slide
PowerPoint Charts
Premium
-
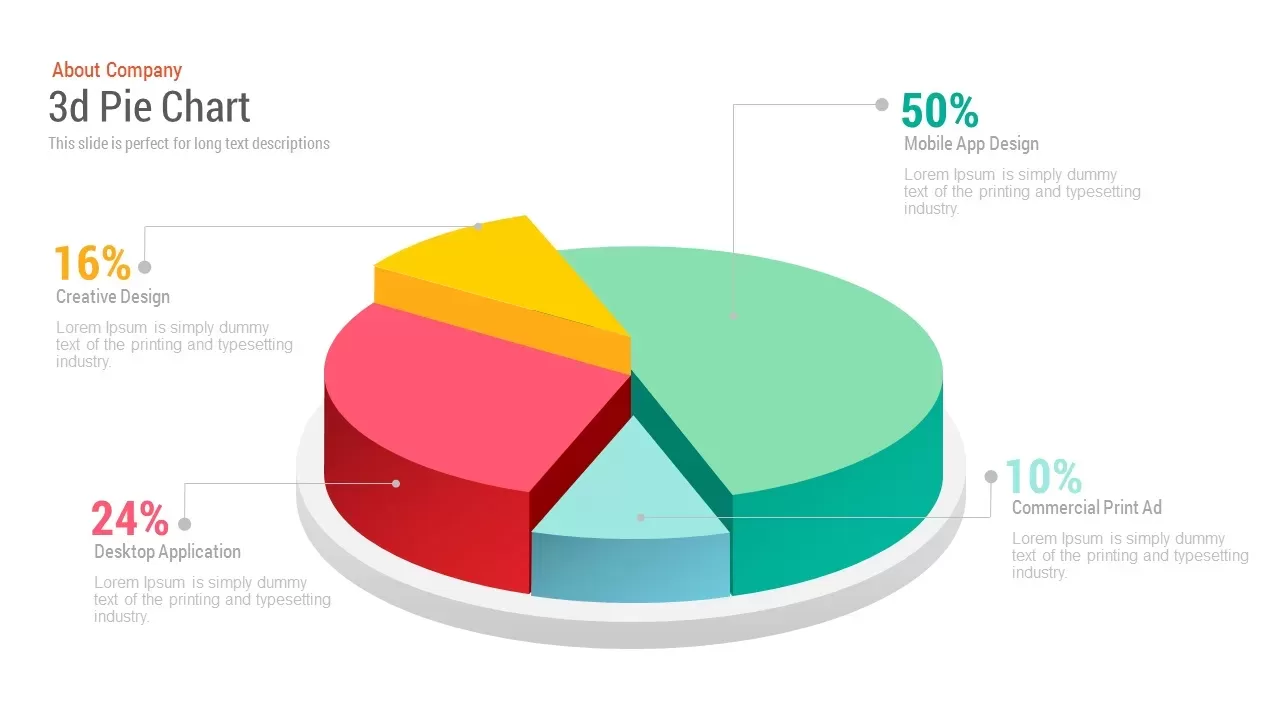
Free 3d Pie Chart PowerPoint Template & Keynote slide
Pie & Donut
Free
-
Free PowerPoint Gantt Chart Template
PowerPoint Charts
Free
-

Corporate PowerPoint Presentation Template
PowerPoint Business Templates
Premium
-
Split Representation Donut Chart Template for PowerPoint and Keynote
Keynote Templates
Premium
-
Content Marketing Matrix Template for PowerPoint & Keynote
Business Models
Premium
-

Digital Marketing PowerPoint Theme
PowerPoint Themes
Premium