Pencil Bar Chart Template for Powerpoint and Keynote Presentation
Bars and graphs are common in business presentations. These are used for the discussion of several statistical and trend analysis. Any presentation whether it is business or academic, which is based on statistical data can be used with the help of graphs and bars. Our
pencil bar chart PowerPoint and keynote template is a different design in the bar diagram category. Our creative designers produce this
bar chart diagram template because to avoid the boring elements of the presentation. The
bar chart template for PowerPoint presentation can show the variety of data related to a business organization. The graphical illustration of data is a convenient method to pass the accurate and quantitative information to the viewers.
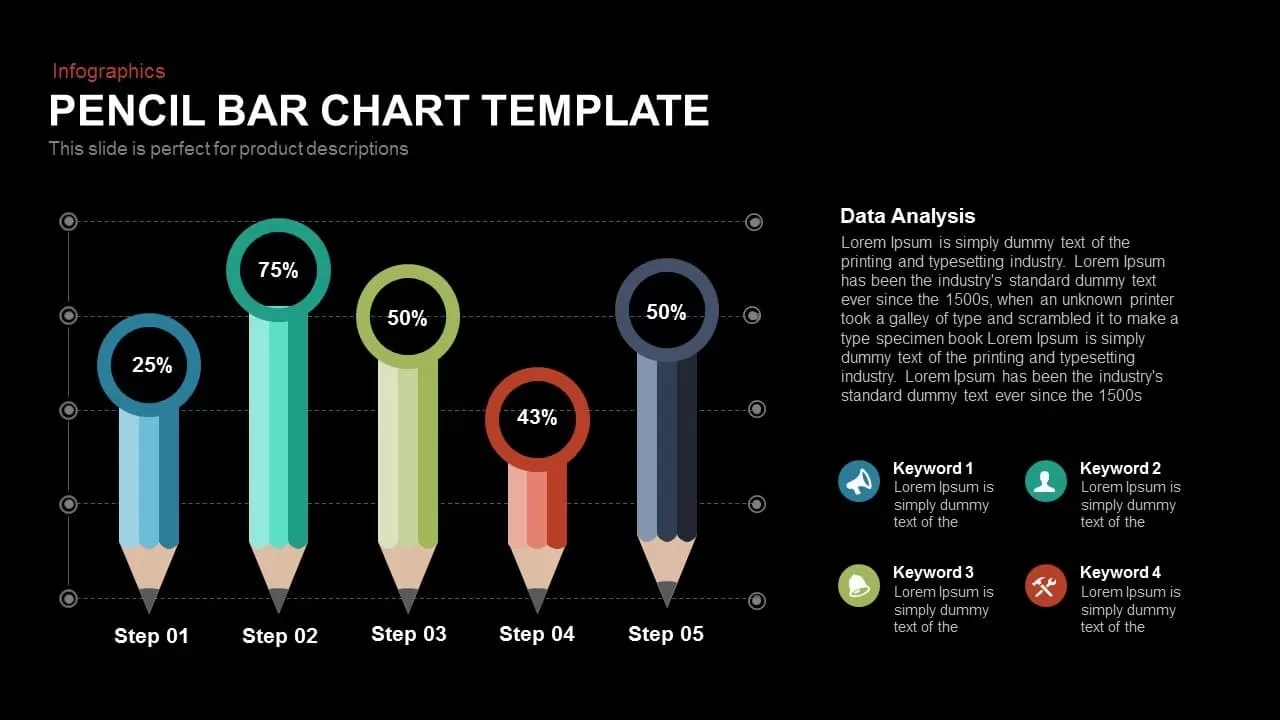
Pencil bar chart diagram for PowerPoint is an editable diagram. The presenters can resize or change the height of the pencils and line graphs according to the data in hand. Pencil Bar Chart template is a creative artistic take on the bar chart. A bar chart or bar graph is a chart that presents clustered data with rectangular bars with lengths proportional to the standards that they represent. Here the vertical bar is portrayed creatively in the shape of a pencil. Bar charts offer a visual presentation of qualitative and quantitative categorical data. One axis of the chart shows the specific categories being compared, and the other axis represents a discrete value.
Pencil Bar Chart template is perfect for any data-driven presentations such as marketing and sales. It is ideal for statistics and inventory. Business concepts may find it tremendously useful applied in areas such as financial reporting and in weighing strategies. Each pencil bar is created using completely editable shapes along with a value indicator to write down values corresponding to each pencil bar. The colors of the pencils comprise of a soothing color pallet in a 5 color scheme. The slide is available in PowerPoint and Keynote templates.
You may also like: