


Mekko Chart Template


- Version
- Download 7
- File Size 0.00 KB
- File Count 1
- Create Date August 14, 2023
- Last Updated August 11, 2023
Mekko Chart Template
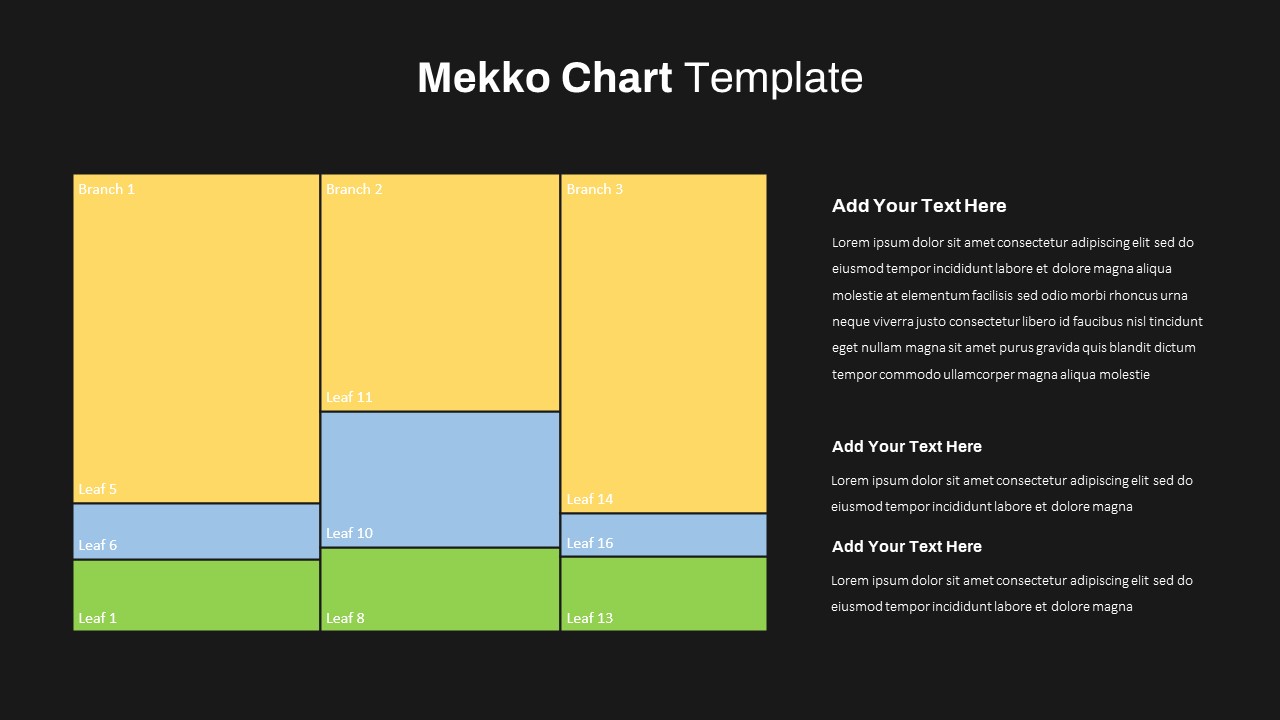
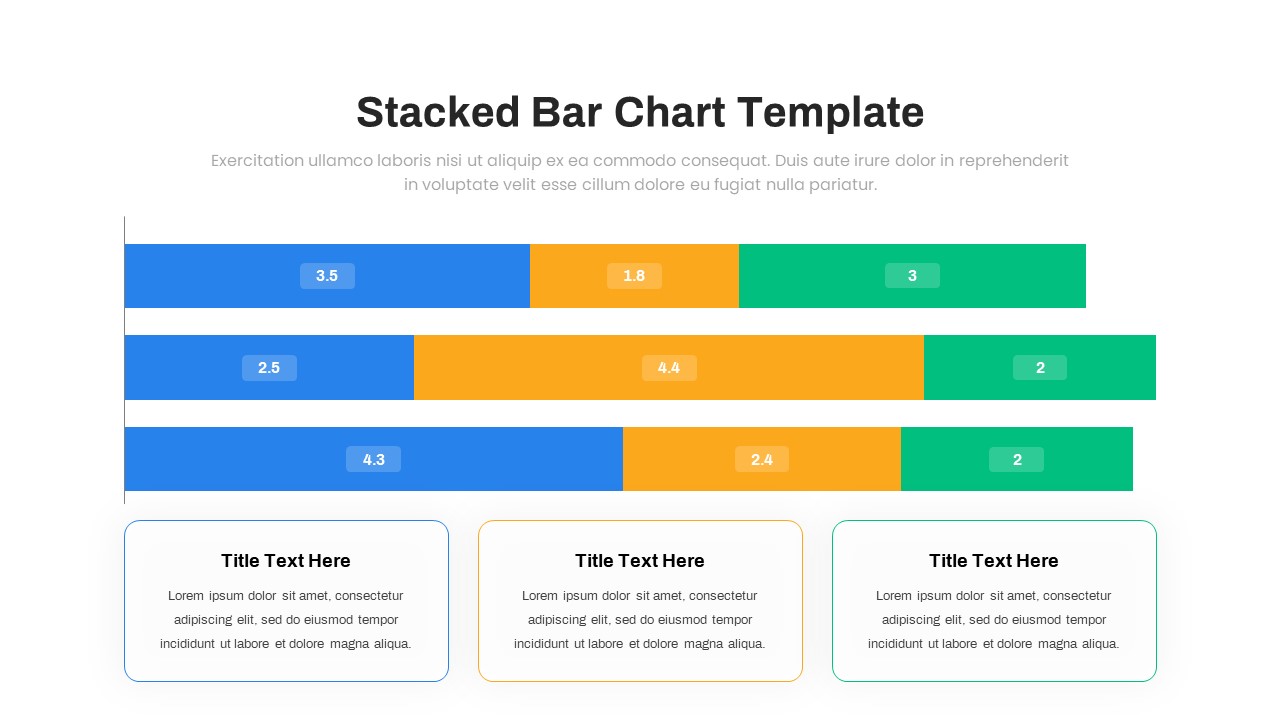
Mekko Chart PowerPoint Template will display data in a two-dimensional rectangular grid. It combines the features of a stacked bar chart and a 100% stacked bar chart, allowing you to visualize the relative sizes of different categories and the proportions within each category. In this Mekko chart template, the width of each bar represents the proportion or percentage of the total value, and the height represents another dimension or category. The bars are typically arranged side by side to form a grid, where the width and height of each bar are proportional to the values it represents.
The Mekko chart template for PowerPoint presentations is useful for analysing and comparing multiple variables simultaneously. They can show how different factors contribute to the whole and help identify patterns and relationships within the data. When creating a Mekko chart template, it's important to ensure that the data is appropriately structured, with values for both the width and height dimensions. The chart should be labelled clearly to convey the information accurately to the audience.
Mekko charts are commonly used in business, marketing, economics, and other fields where multi-dimensional data analysis is required. They can provide insights into market share, product sales, revenue distribution, and other complex relationships within a dataset. Here are four potential uses of a Mekko chart PowerPoint template:
- Market Segmentation: Mekko charts can be used to analyse and illustrate market segmentation data.
- Product Analysis: Mekko charts are effective for comparing and analyzing product performance.
- Financial Analysis: Mekko charts can be applied to financial analysis, such as analysing revenue streams or cost breakdowns
- Project Management: Mekko charts can be used to track and visualize project progress or resource allocation.
The Mekko chart template features rectangle grids that have been color-coded in yellow, blue, and green. This color combination allows for easy visualization of the relationships between variables, providing flexibility and visual appeal. Mekko charts are highly versatile and can be effectively used in various industries and data-driven presentations. Explore our latest collection of PowerPoint charts and graphs to enhance your visual presentations.
Attached Files
| File | Action |
|---|---|
| https://premiumdownloads.s3.amazonaws.com/SB03705-Mekko Chart Template.ZIP | Download |
Login to download this file
Add to favorites
Add to collection
-

Item ID
SB03705 -

Related Templates
-

Sales Deck Free PowerPoint Template
PowerPoint Templates
Free
-

Nature PowerPoint Presentation Template
PowerPoint Business Templates
Premium
-

Free Vertical PowerPoint Template
PowerPoint Business Templates
Free
-

Cab Service PowerPoint Template
PowerPoint Templates
Premium
-

Research Proposal PowerPoint Template
PowerPoint Templates
Premium
-

Free Nursing Capstone PowerPoint Deck
PowerPoint Templates
Free
-

Gym PowerPoint Template
PowerPoint Templates
Premium
-

VET Clinic PowerPoint Template
PowerPoint Templates
Premium
-

Free Space Minimal Deck Template
PowerPoint Templates
Free
-

Travel Agency PowerPoint Template
PowerPoint Templates
Premium
-

Free Physical Education PowerPoint Template Deck
Free PowerPoint Templates
Free
-

IoT Presentation Template
PowerPoint Templates
Premium
-

Effective Communication PowerPoint Template
PowerPoint Templates
Premium
-

Macroeconomics PowerPoint Template
PowerPoint Templates
Premium
-

PowerPoint Quiz With Timer
PowerPoint Templates
Premium
-

Graph Paper PowerPoint Template Deck
PowerPoint Templates
Premium
-

Free Economics PowerPoint Template
Free PowerPoint Templates
Free
-

Free Aviation PowerPoint Template
Free PowerPoint Templates
Free
-

Customer Experience Loyalty PowerPoint Deck Template
PowerPoint Templates
Premium
-
Stacked Area Chart PowerPoint Template
PowerPoint Charts
Premium
-

Creative Bar Chart Data Analysis PowerPoint Template and Keynote
Infographic
Premium
-

Free Charity PowerPoint Template Deck
PowerPoint Templates
Free
-

Free Cartoon PowerPoint Template
Free PowerPoint Templates
Free
-

Annual Report PowerPoint Template and Keynote
PowerPoint Templates
Premium
-

Free Real Estate Listing PowerPoint Template
Free PowerPoint Templates
Free
-

Free Army PowerPoint Template
PowerPoint Templates
Free
-

Animated Agriculture PowerPoint Deck Template
PowerPoint Templates
Premium
-

Free University Presentation PowerPoint Template
PowerPoint Templates
Free
-

Free Book Review PowerPoint Template
Free PowerPoint Templates
Free
-

Free Event Planning PowerPoint Template
Free PowerPoint Templates
Free
-

Pencil Bar Chart PowerPoint Template and Keynote Slide
Column and Bar chart
Premium
-
Simple Bar Chart PowerPoint Template
Column and Bar chart
Premium
-

Global Warming Infographic PowerPoint Template Deck
PowerPoint Templates
Premium
-

Data Science PowerPoint Template
PowerPoint Templates
Premium
-
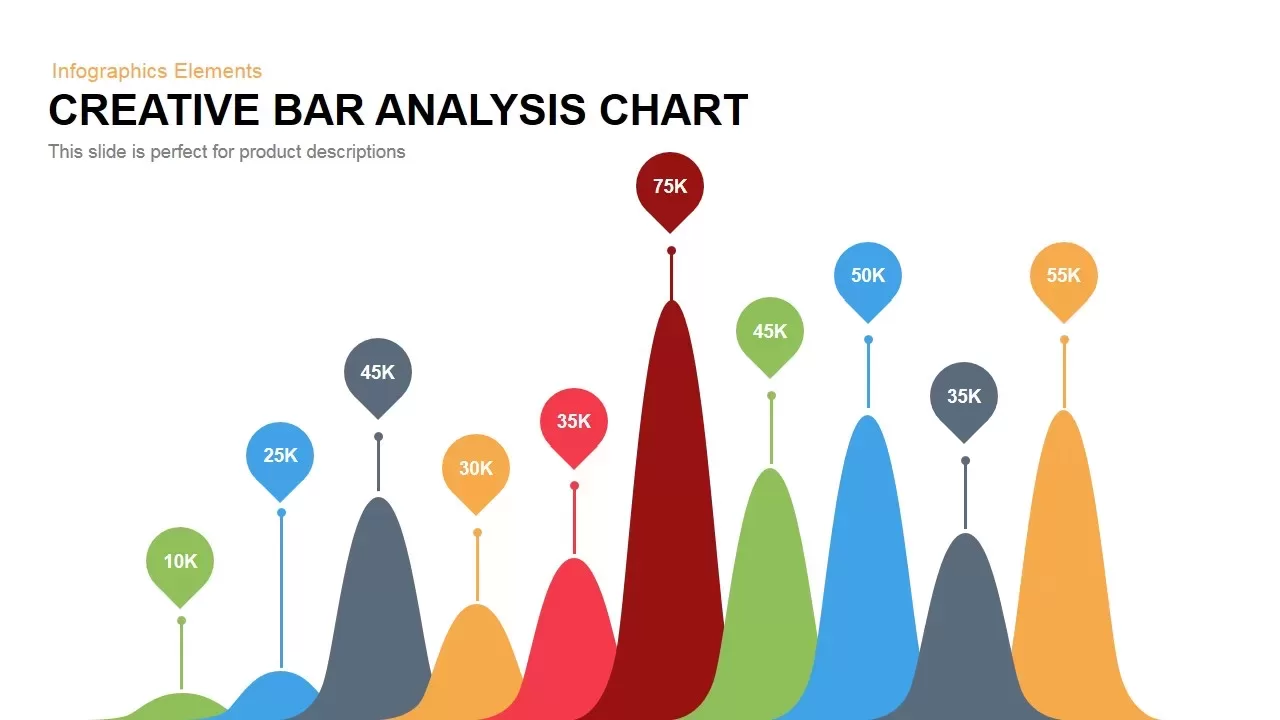
Creative Bar Chart Analysis PowerPoint Template and Keynote
Column and Bar chart
Premium
-
Free Charts & Graphs Deck PowerPoint Template
PowerPoint Templates
Free
-
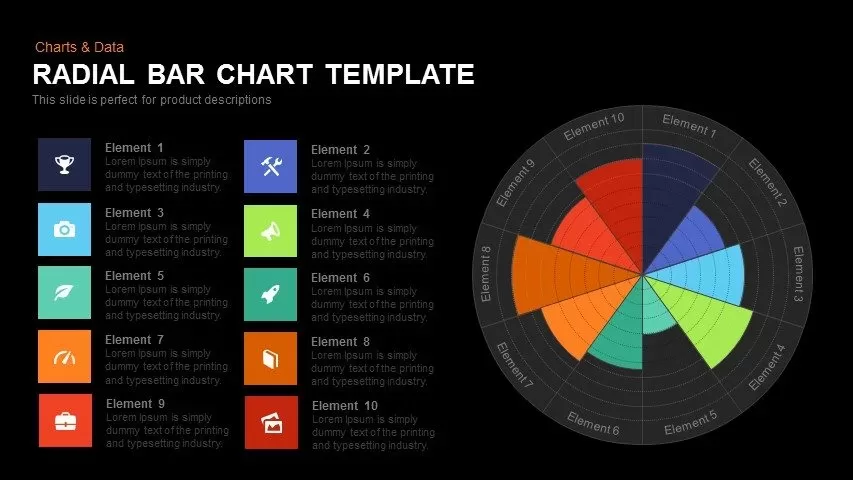
Radial Bar Chart Template for PowerPoint and Keynote
Circular Diagrams
Premium
-

Real Estate PowerPoint Theme
PowerPoint Themes
Premium
-

EFQM Model PowerPoint Template
PowerPoint Templates
Premium
-
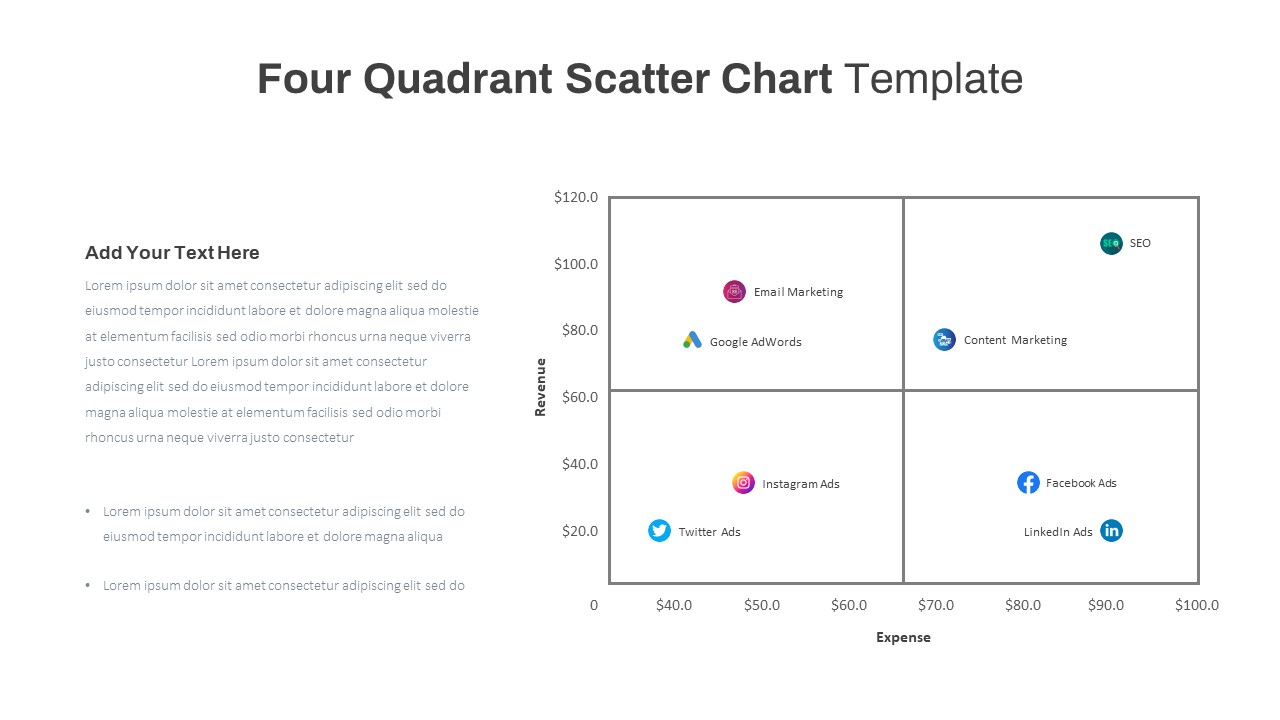
Four Quadrant Scatter Chart PowerPoint Template
PowerPoint Charts
Premium
-
Stacked Waterfall Chart PowerPoint Template
PowerPoint Templates
Premium
-

Free Dunder Mifflin Paper Company Pitch Deck
Free PowerPoint Templates
Free
-

Animated Clustered Bar Chart PowerPoint Template
PowerPoint Charts
Premium
-

Go To Market PowerPoint Template
PowerPoint Templates
Premium
-

Radial Bar Chart PowerPoint Templates and Keynote Slides
PowerPoint Charts
Premium
-
Product Comparison Bar Chart Template for PowerPoint and Keynote
PowerPoint Charts
Premium
-
Clustered Bar Chart PowerPoint Template
Column and Bar chart
Premium
-
Weekly Data Charts PowerPoint Presentation Template and Keynote Slide
Infographic
Premium
-

Free Charts and Graphs PowerPoint Template
PowerPoint Templates
Free
-

Clustered Column Chart PowerPoint Template
PowerPoint Charts
Premium
-
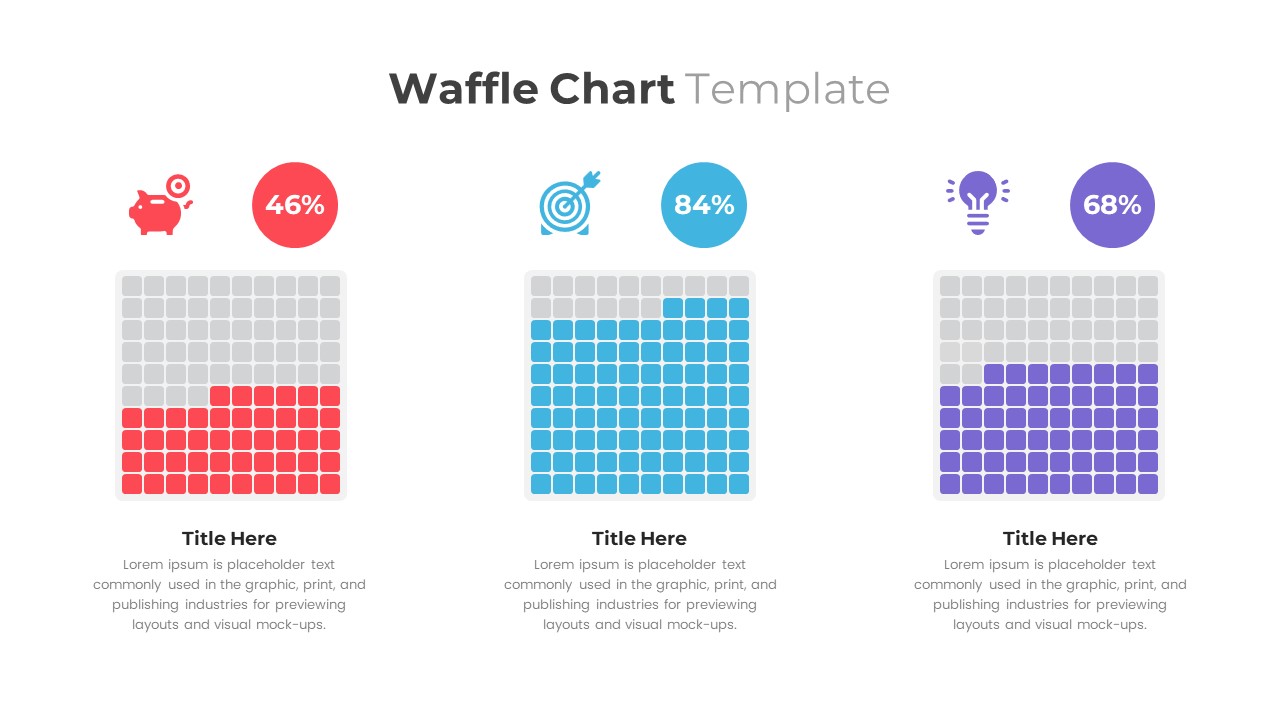
Waffle Chart PowerPoint Template
PowerPoint Templates
Premium
-
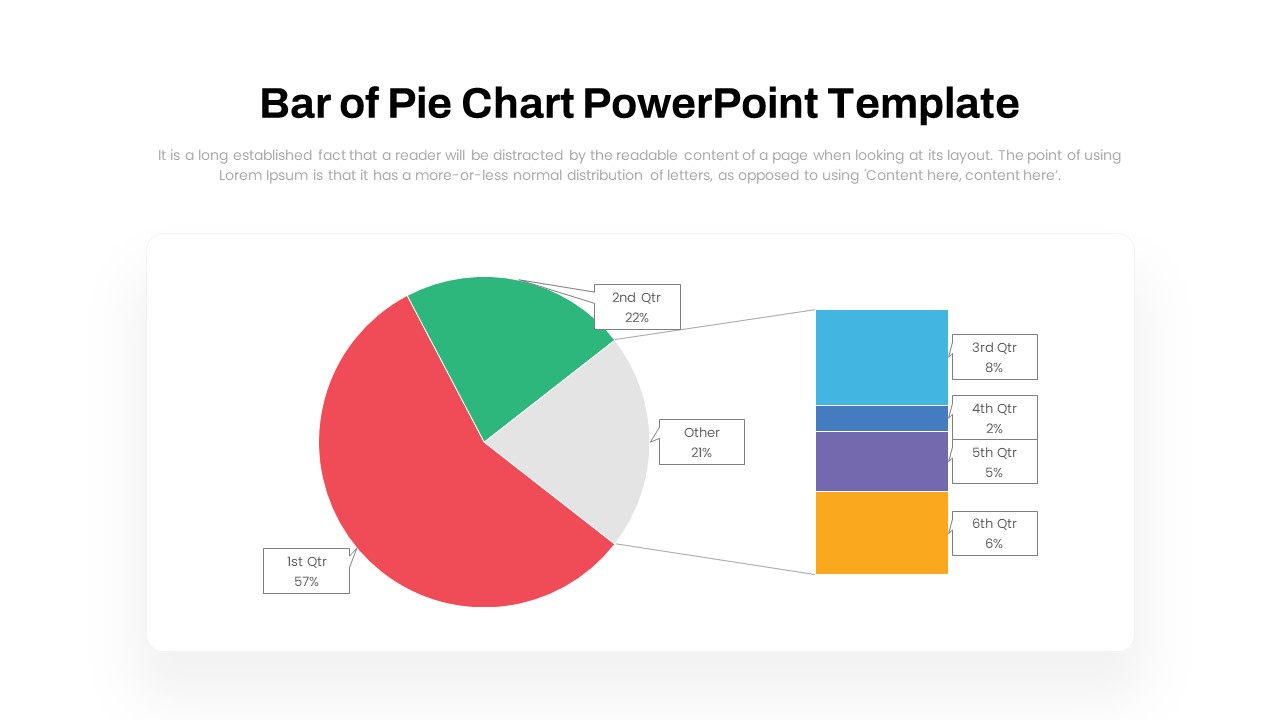
Bar of Pie Chart PowerPoint Template
PowerPoint Templates
Premium
-

Combination Chart PowerPoint Template
PowerPoint Charts
Premium
-
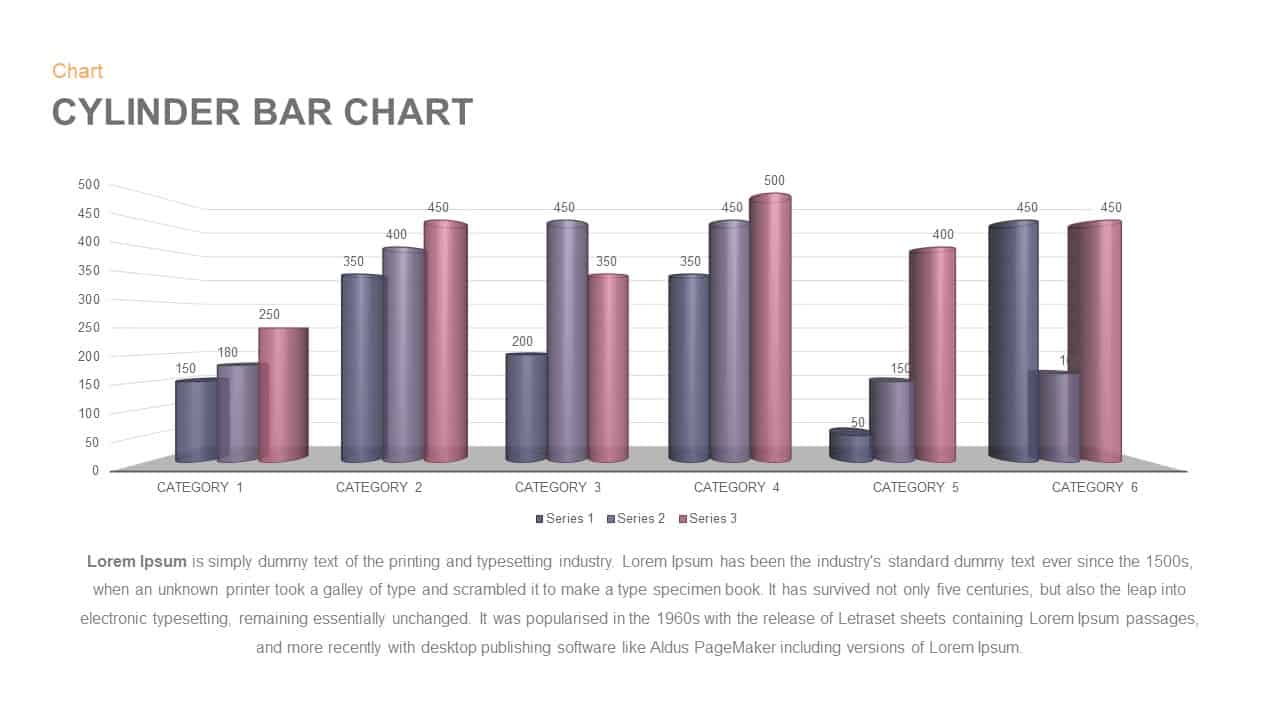
Cylinder Bar Chart PowerPoint Template and Keynote Slide
Column and Bar chart
Premium
-
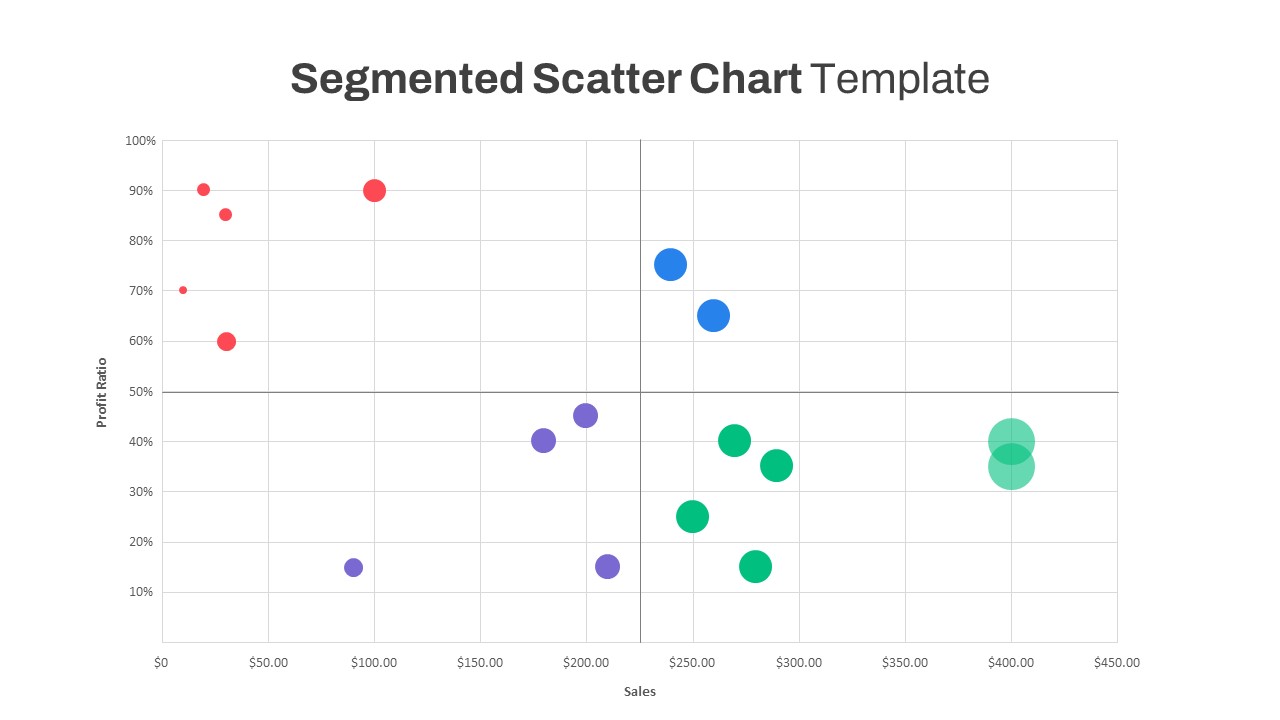
Segmented Scatter Chart PowerPoint Template
PowerPoint Charts
Premium
-

Free AI Artificial Intelligence PowerPoint Template
PowerPoint Templates
Free
-
Grouped Column Chart PowerPoint Template
Column and Bar chart
Premium
-
Waterfall Column Chart PowerPoint Template
Column and Bar chart
Premium
-

Free Stock Market PowerPoint Template
PowerPoint Templates
Free
-

Stakeholder Register PowerPoint Template
PowerPoint Templates
Premium
-

Area Chart PowerPoint Template
PowerPoint Charts
Premium
-
100% Stacked Column Chart PowerPoint Template
Column and Bar chart
Premium
-
For and Against Vote Count Bar Chart for PowerPoint Presentation
Column and Bar chart
Premium
-

Business Process Reengineering Template
PowerPoint Templates
Premium
-
Comparison Bar Charts PowerPoint Template and Keynote Slide
Column and Bar chart
Premium
-

Animated Upcoming Event Poster PowerPoint Template
PowerPoint Templates
Premium
-
3 Bar Chart PowerPoint Template and Keynote Slide
Column and Bar chart
Premium
-

Proportional Area Chart PowerPoint Template
PowerPoint Templates
Premium
-
Sun Burst Chart PowerPoint Template
Circular Diagrams
Premium
-
3D Cylinder Bar Chart PowerPoint Template and Keynote Slide
Column and Bar chart
Premium
-
Data Bar Chart Template for PowerPoint and Keynote
Column and Bar chart
Premium
-

Open Door Policy PowerPoint Template
PowerPoint Templates
Premium
-
Progress Chart PowerPoint Template
PowerPoint Templates
Premium
-

Biotechnology PowerPoint Presentation Template
PowerPoint Templates
Premium
-
Free Stacked Column Chart Template
Column and Bar chart
Free
-
Blake and Mouton Managerial Grid
Text and Table
Premium
-
Animated Stacked Bar Chart PowerPoint Template
Column and Bar chart
Premium
-
Spline Chart PowerPoint Template
PowerPoint Charts
Premium
-
Timeline Bar Chart PowerPoint
Column and Bar chart
Premium
-

Product Catalog Slide Presentation PowerPoint Template
PowerPoint Templates
Premium
-
Forecast Chart PowerPoint Template
PowerPoint Charts
Premium
-
Bubble Chart PowerPoint Template
PowerPoint Templates
Premium
-
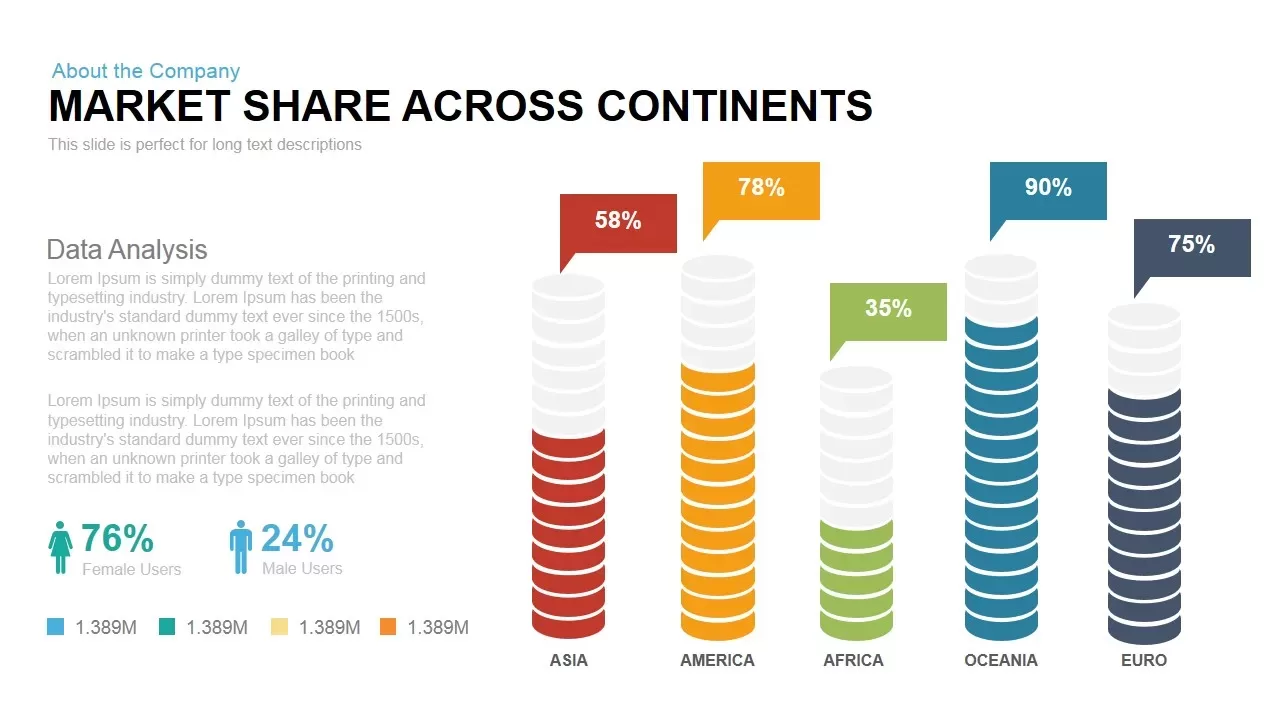
Market Share across Continents PowerPoint & Keynote template
Diagrams
Premium
-
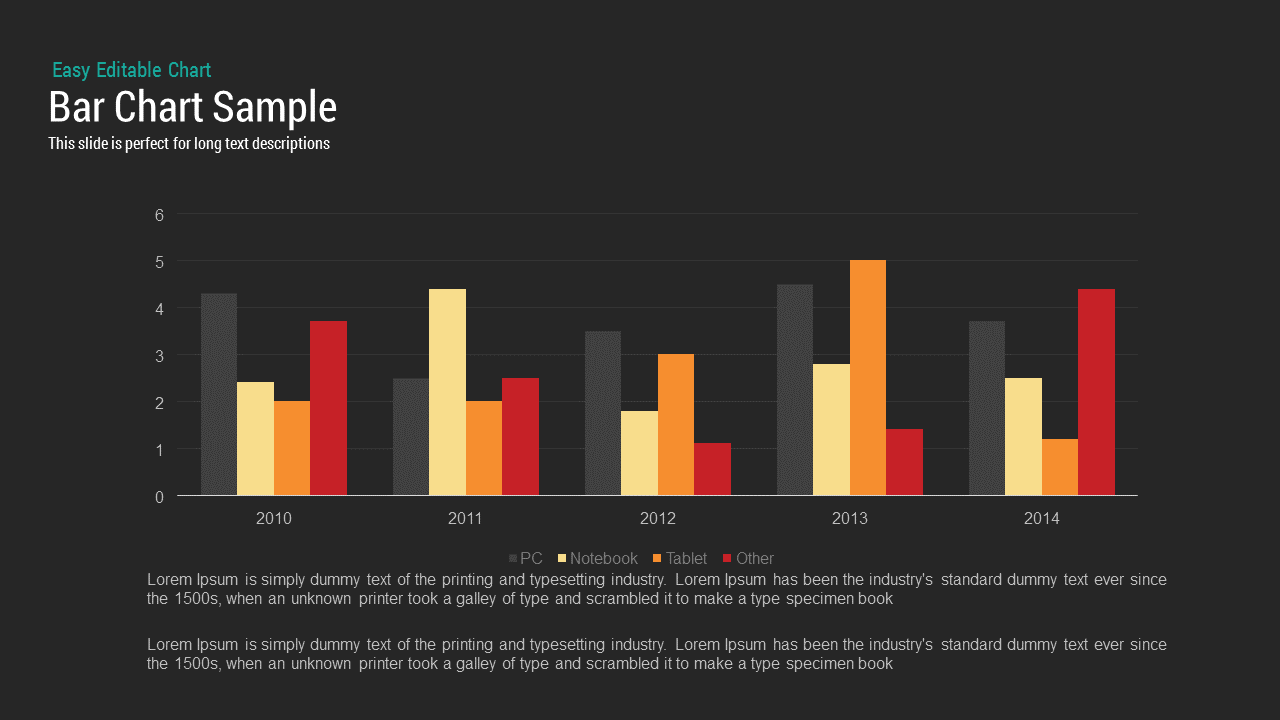
Sample Bar Chart Template for PowerPoint and Keynote Presentation
Column and Bar chart
Premium
-

Cyber Monday PowerPoint Template
PowerPoint Business Templates
Premium
-
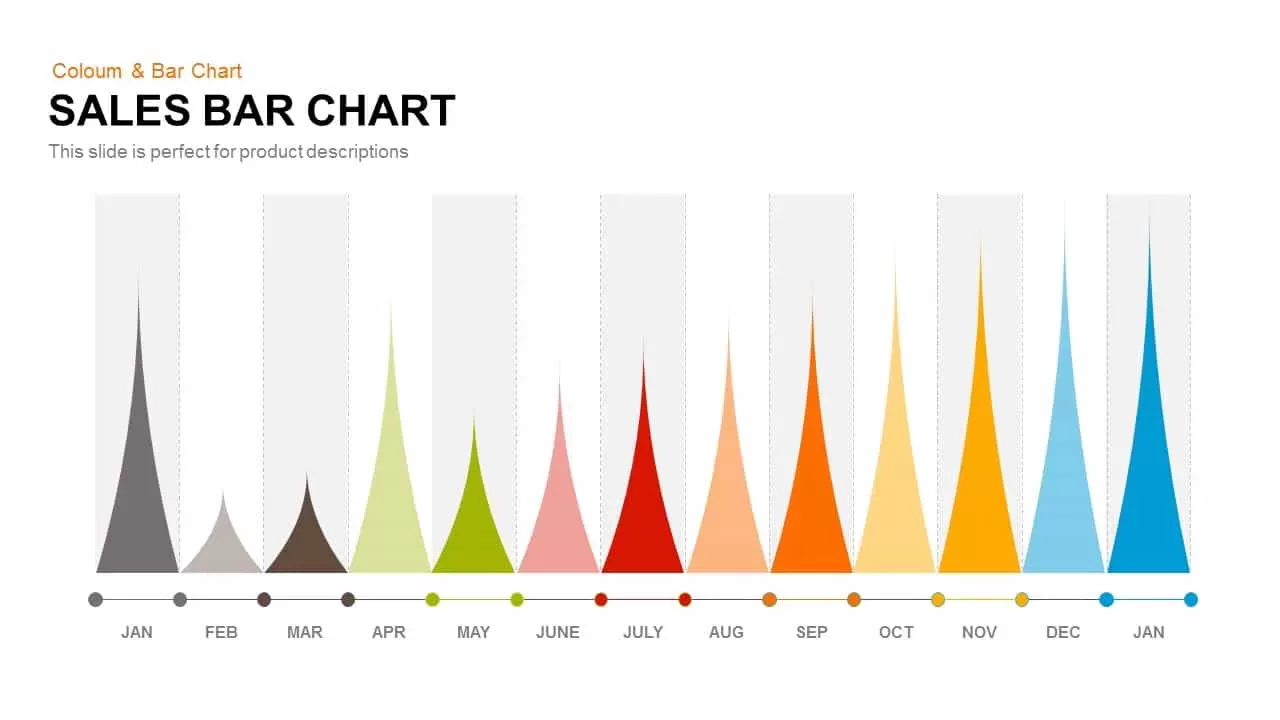
Sales Bar Chart Template for PowerPoint and Keynote
Column and Bar chart
Premium
-
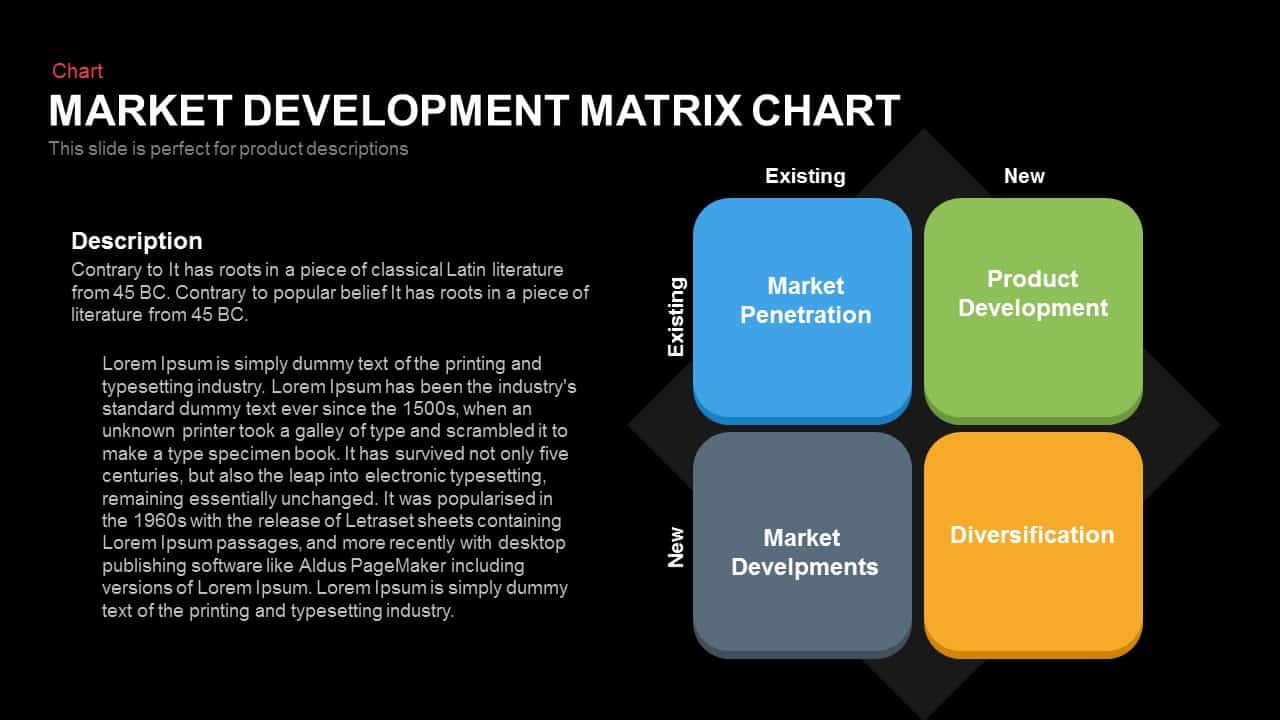
Market Development Matrix Chart – Ansoff Matrix PowerPoint Template
Business Models
Premium
-
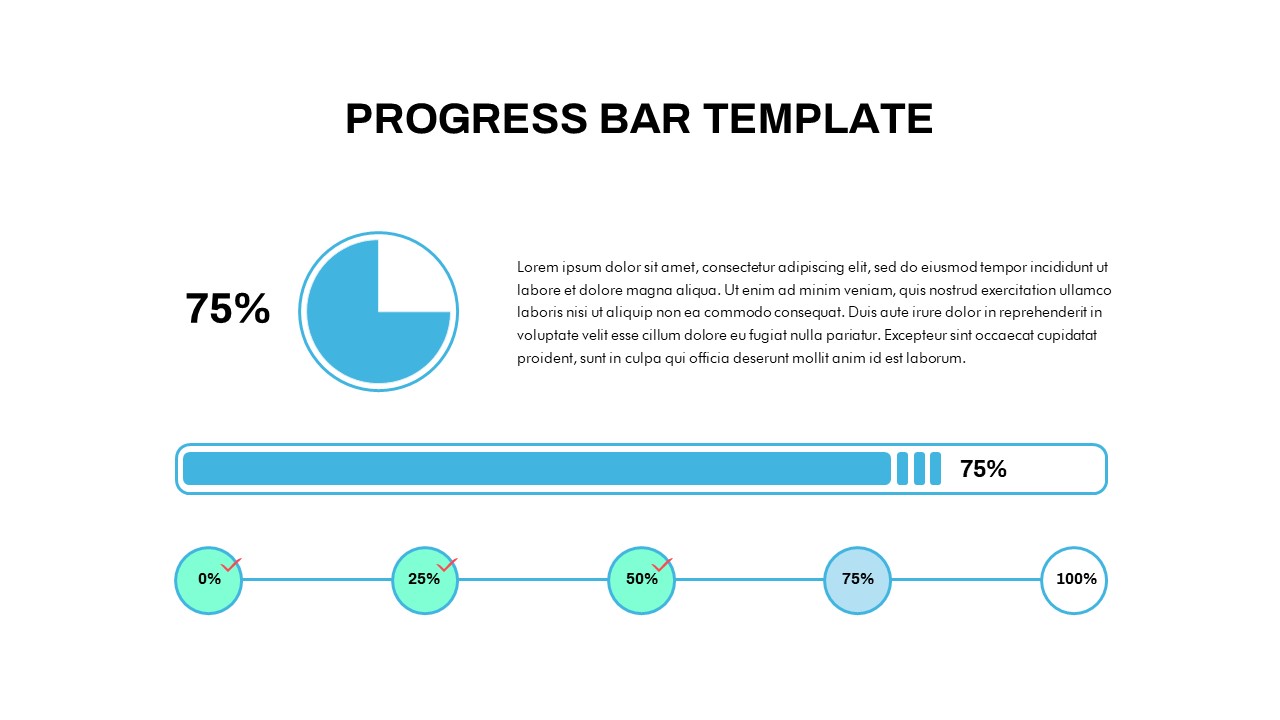
Progress Bar Chart PowerPoint Template
PowerPoint Templates
Premium
-
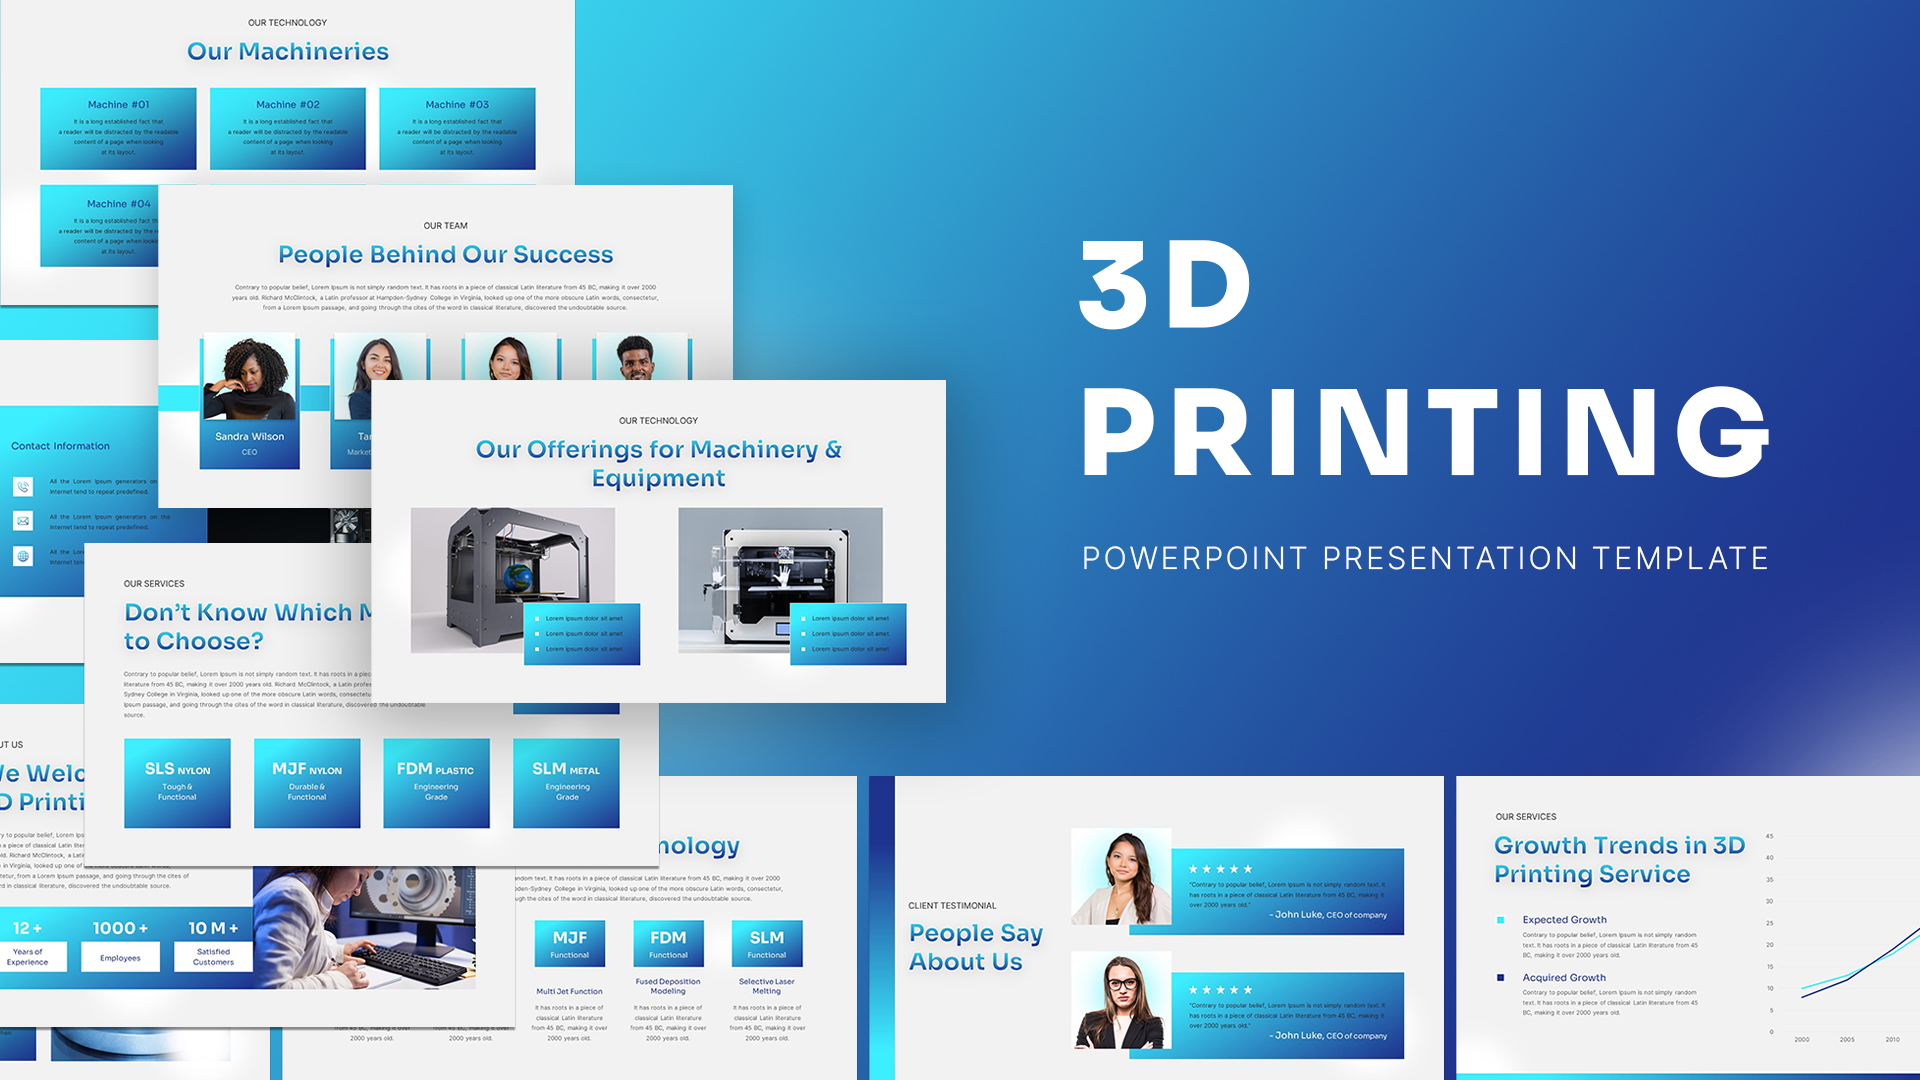
3D Printing Deck PowerPoint Template
PowerPoint Templates
Premium
-
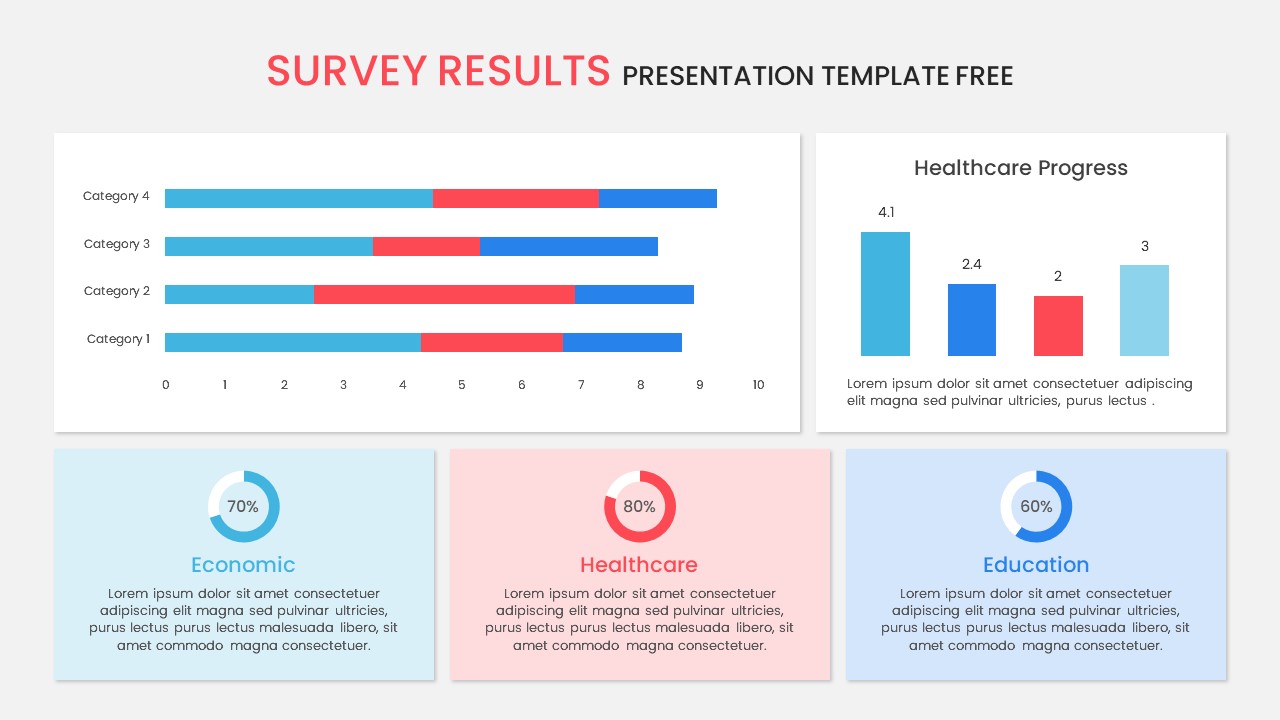
Survey Results PowerPoint Template Free
Free PowerPoint Templates
Free
-
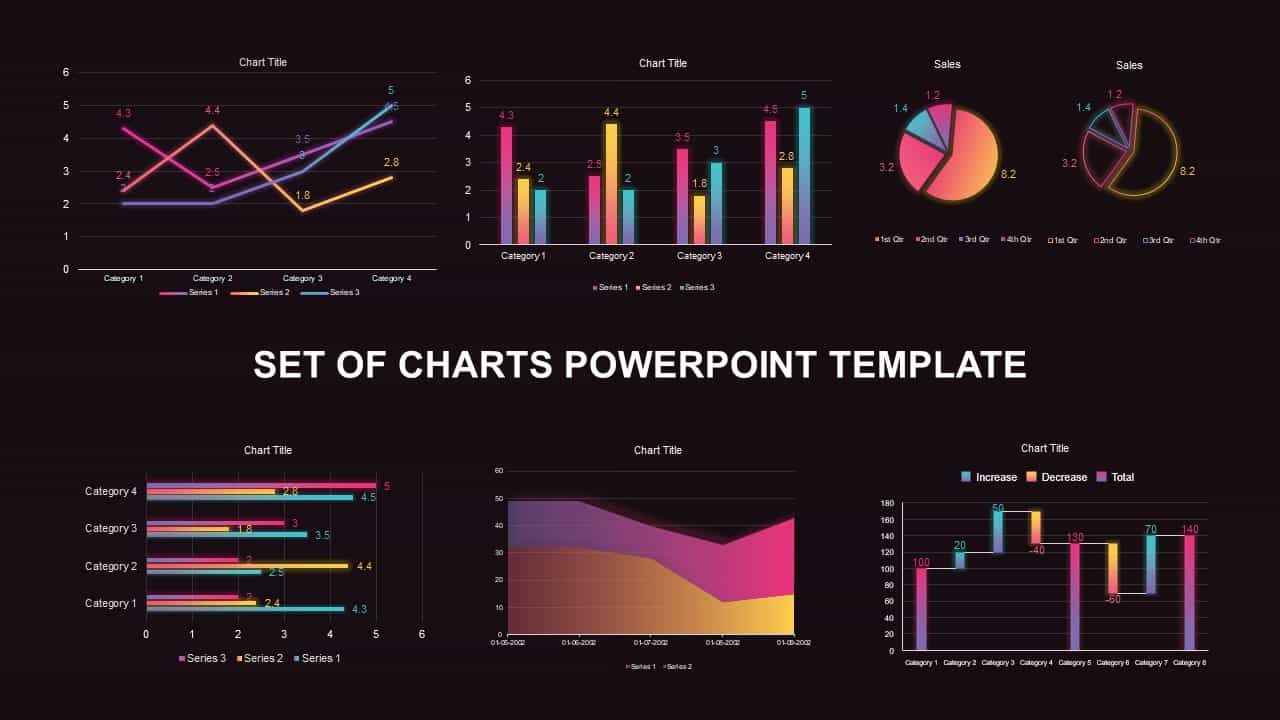
Set of Chart PowerPoint Template and Keynote Diagram
PowerPoint Charts
Premium
-
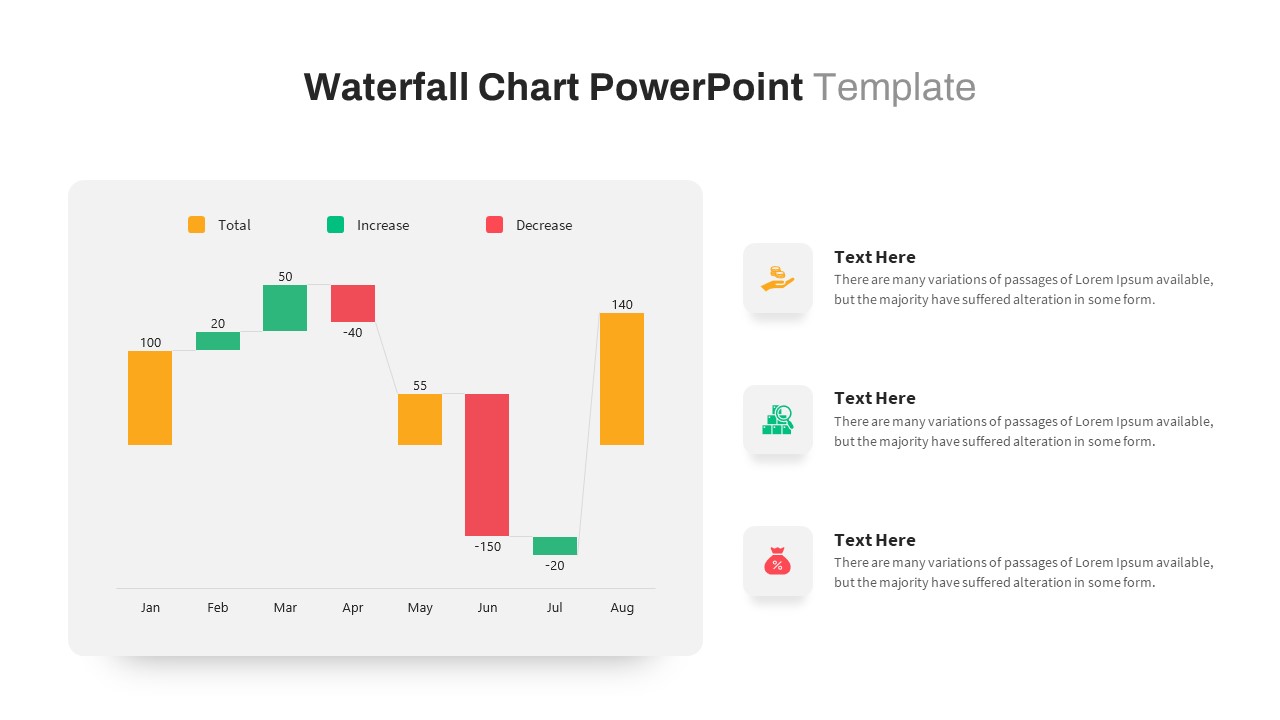
Waterfall Chart PowerPoint Template
PowerPoint Charts
Premium
-

Free Go To Market Strategy PowerPoint Template
Circular Diagrams
Free
-
Big Data Infographic Deck For PowerPoint
PowerPoint Business Templates
Premium
-
Product Comparison A vs B PowerPoint Template
Business Models
Premium
-
Data Flow PowerPoint Presentation Template
PowerPoint Templates
Premium
-

Case Study PowerPoint and Keynote Template
PowerPoint Templates
Premium
-

Power Analogy Metaphor PowerPoint Template
Metaphor, Simile & Analogy
Premium
-

Multipurpose Business PowerPoint Template
PowerPoint Business Templates
Premium
-
Mirror Bar Chart PowerPoint Template
PowerPoint Templates
Premium