


Marketing Radar Chart Ppt Template 6
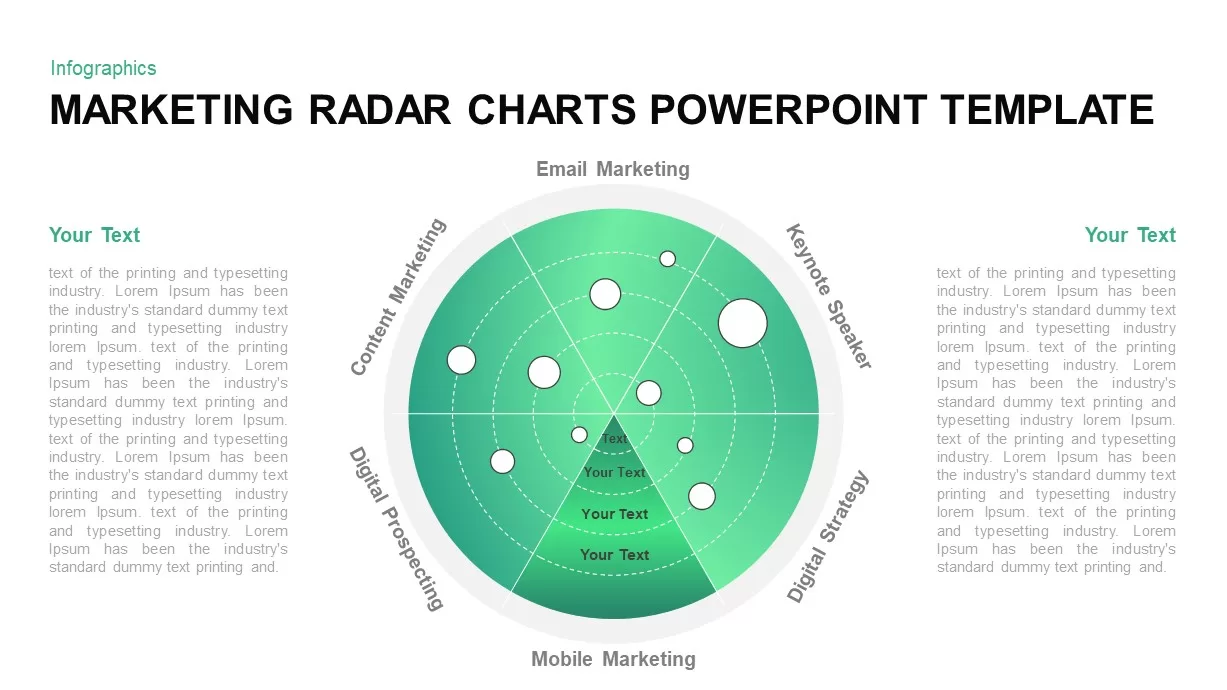
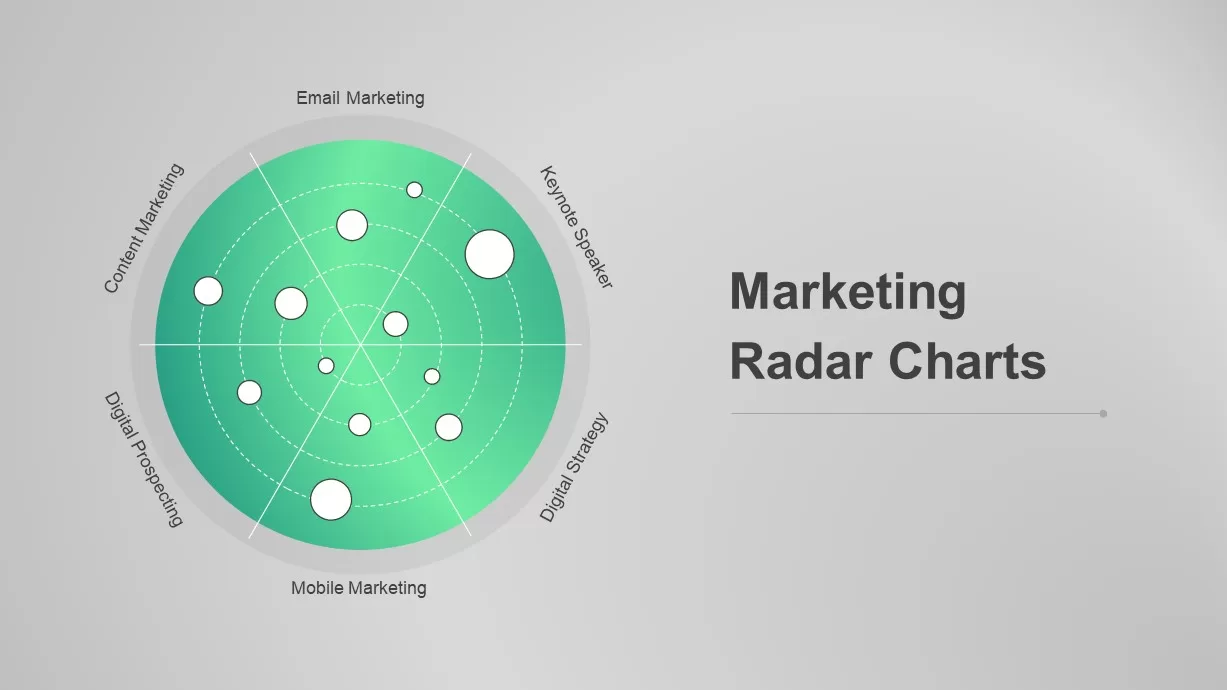
Marketing radar charts PowerPoint template is a circle diagram showing the different approaches to marketing. This is a clockwise PowerPoint fit to show a process's recurring movements of activity. However, a radar chart demonstrates the web of relationships between elements, so it is biennial to provide the relationship between entities. The presenters can use this diagram for multiple purposes, including marketing and repetitive concepts. If you are selecting for marketing presentation purposes, this diagram will be the best aid for presenting digital marketing concepts such as content marketing, email marketing, digital strategy, etc. On the other hand, if you are picking for business presentation, it is fit to present business process development, business continuity plan, business cycle presentation, and so on. Besides, if you want this template for displaying academic concepts, it is fit to present historical evolution as a cycle. The marketing radar chart ppt template is a single-color template having six divisions of spider web illustration. The green gradient effects, web circles, and spotted circles illustrate the relationship between variables. So, the template provides multiple opportunities for the users. For example, researchers can use this radar chart to show the cause-and-effect relationship between the variables. A radar chart is a visual method of displaying a bunch of data in the form of a two-dimensional chart. Radar charts are also known as web charts, spider charts, polar charts, etc. With special color effects and projections, the users can deliver elaborate descriptions highlighting each marketing radar chart PowerPoint template division. The editable diagram allows customization of text arrangements and sequentially follow through. For instance, the two side text zones can be rearranged as a single zone while moving the circle diagram to the left or right extreme of the template. Similarly, the user can add separate colors for each division that may create easy extraction of the topics. The PowerPoint objects and the outlines are fully customizable to suit the needs of the anchors. The users can change the color and the inner web chart according to their liking.