


Key Financial Ratios PowerPoint Template


- Version
- Download 3
- File Size 0.00 KB
- File Count 1
- Create Date June 12, 2024
- Last Updated June 7, 2024
Key Financial Ratios PowerPoint Template
Unlock Financial reports with our key financial ratios PowerPoint template
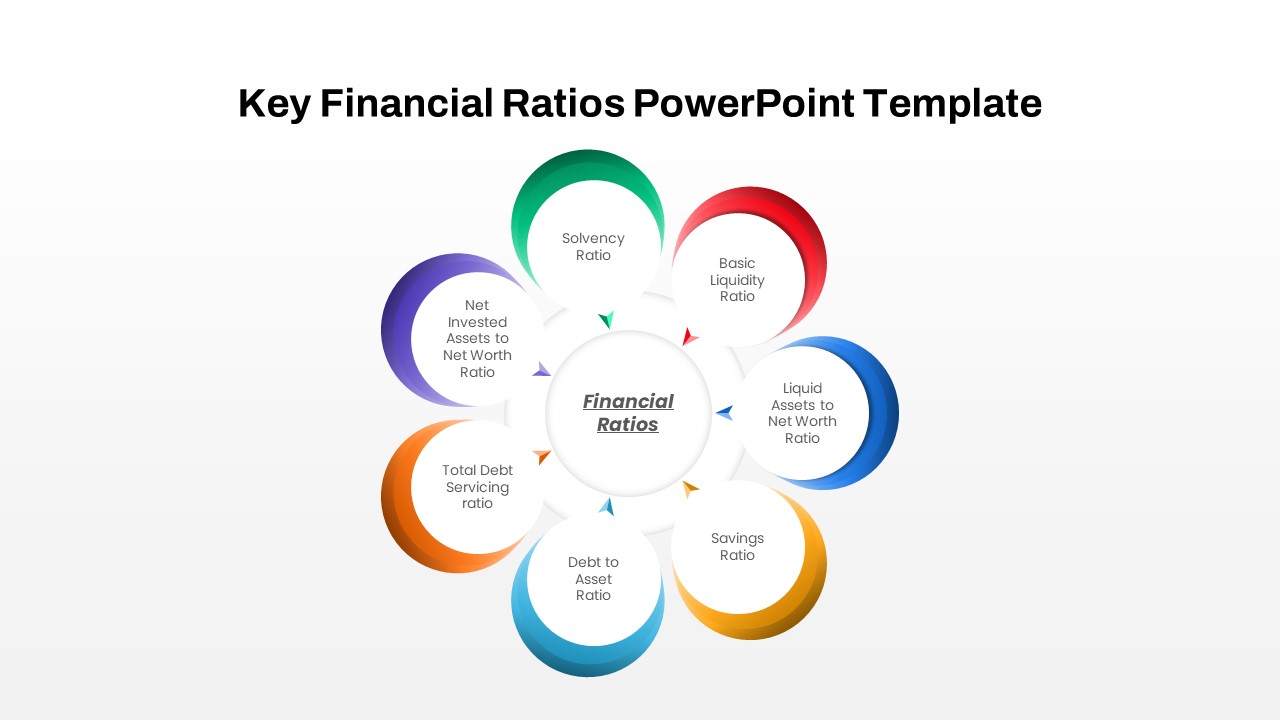
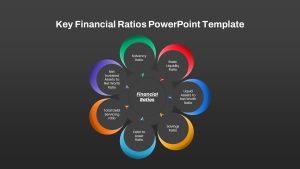
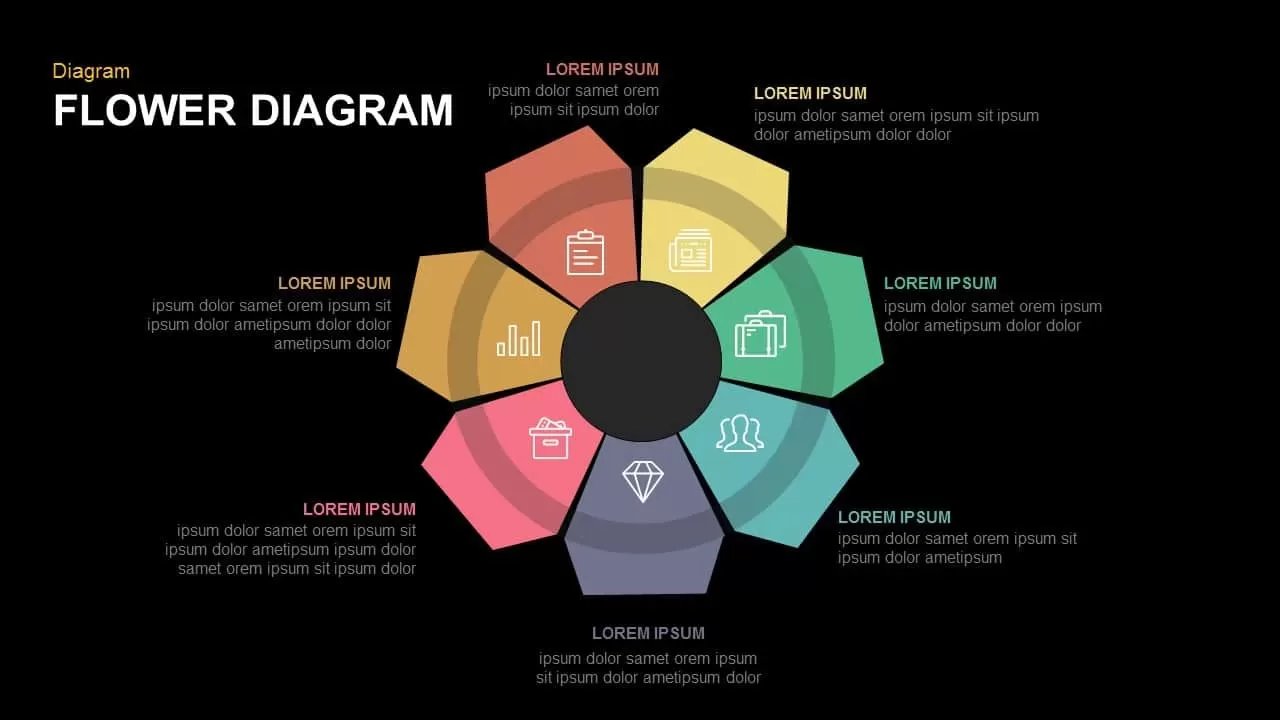
The innovative Key Financial Ratio PowerPoint template introduces a unique approach to visualizing finance ratios. Departing from conventional statistical diagrams like pie charts or graphs, it uses a traditional flower diagram format. This unconventional design allows users to impeccably integrate financial ratios into the petals of the flower, presenting complex financial data in an engaging and easily digestible manner. With its natural flower palette interface, users can effortlessly customize and showcase various financial metrics, enhancing the clarity and impact of their presentations. This refreshing take on financial visualization brings a creative edge to financial reporting and analysis, captivating audiences with its fresh perspective.
How to make a circular diagram in PowerPoint?
Creating a circular diagram in PowerPoint is straightforward and offers a visually appealing way to present information. Start by inserting a circle shape from the Shapes menu. Then, adjust its size and position as needed. Next, divide the circle into segments by inserting lines or using the Pie Chart tool. Customize each segment with text, colors, and icons to represent different categories or data points. Utilize PowerPoint's alignment and distribution tools to ensure precision and consistency in your diagram. Finally, add visual enhancements such as shadows or gradients to make the diagram pop. With these simple steps, you can effectively communicate your ideas and data using a circular diagram in PowerPoint.
The key financial ratio PowerPoint presentation is best for discussing financial indicators such as profitability, liquidity, solvency, quality, and efficiency ratios. Finance professionals can prepare reports using the circle diagram to communicate their company’s financial performance. Similarly, educators can use it for delivering multiple subjects including finance and social science.
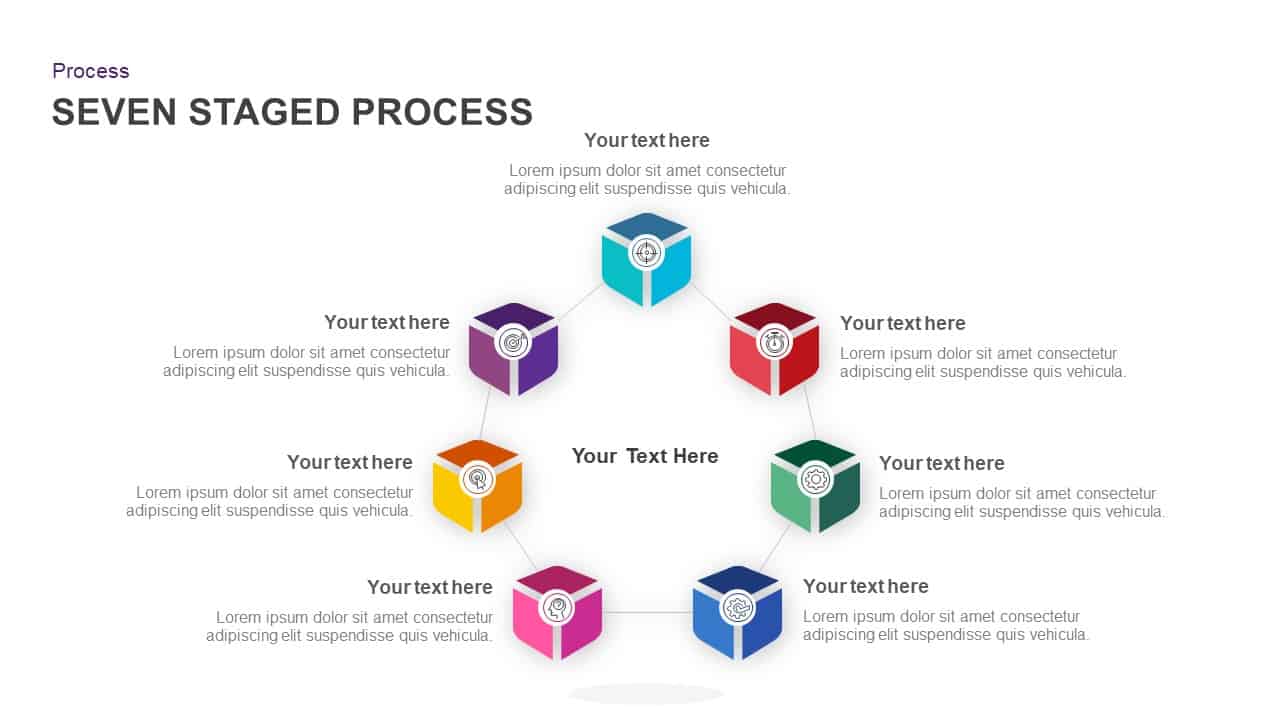
The circular PowerPoint diagram for the key finance ratios presentation has seven peripheral petals to insert financial elements. each petal seems circular in shape with shadow color borders. It depicts the preset texts like solvency ratio, basic liquidity ratio, liquid asset to net worth ratio, savings ratio, debt to asset ratio, total debt servicing ratio, and nest invested asset to net worth ratio. These default characteristics ideally showcase the financial strength and weakness of a company. It is worthwhile when a business owner is required to share their financial performance with investors. The circle diagram for PowerPoint allows the presenter to insert their key heading on the center zone while inserting sub-elements in peripheral circle designs. you can customize and add new features to the diagram including the preset text and colors. Download it now!
Attached Files
| File |
|---|
| https://premiumdownloads.s3.amazonaws.com/SB04169-Key Financial Ratios PowerPoint Template.zip |
Login to download this file
Add to favorites
Add to collection
-

Item ID
SB04169 -

Related Templates
-
Leverage Ratios PowerPoint Template
PowerPoint Templates
Premium
-

Nature PowerPoint Presentation Template
PowerPoint Business Templates
Premium
-

Sales Deck Free PowerPoint Template
PowerPoint Templates
Free
-

Free Vertical PowerPoint Template
PowerPoint Business Templates
Free
-

Research Proposal PowerPoint Template
PowerPoint Templates
Premium
-

Cab Service PowerPoint Template
PowerPoint Templates
Premium
-

Free Nursing Capstone PowerPoint Deck
PowerPoint Templates
Free
-

Free Space Minimal Deck Template
PowerPoint Templates
Free
-

Travel Agency PowerPoint Template
PowerPoint Templates
Premium
-

VET Clinic PowerPoint Template
PowerPoint Templates
Premium
-

Gym PowerPoint Template
PowerPoint Templates
Premium
-

Free Physical Education PowerPoint Template Deck
Free PowerPoint Templates
Free
-

IoT Presentation Template
PowerPoint Templates
Premium
-

Effective Communication PowerPoint Template
PowerPoint Templates
Premium
-

PowerPoint Quiz With Timer
PowerPoint Templates
Premium
-
Liquidity Ratios PowerPoint Template
PowerPoint Templates
Premium
-

Graph Paper PowerPoint Template Deck
PowerPoint Templates
Premium
-

Free Economics PowerPoint Template
Free PowerPoint Templates
Free
-

Free Army PowerPoint Template
PowerPoint Templates
Free
-

Macroeconomics PowerPoint Template
PowerPoint Templates
Premium
-

Free Charity PowerPoint Template Deck
PowerPoint Templates
Free
-

Free Aviation PowerPoint Template
Free PowerPoint Templates
Free
-

Customer Experience Loyalty PowerPoint Deck Template
PowerPoint Templates
Premium
-

Free Real Estate Listing PowerPoint Template
Free PowerPoint Templates
Free
-
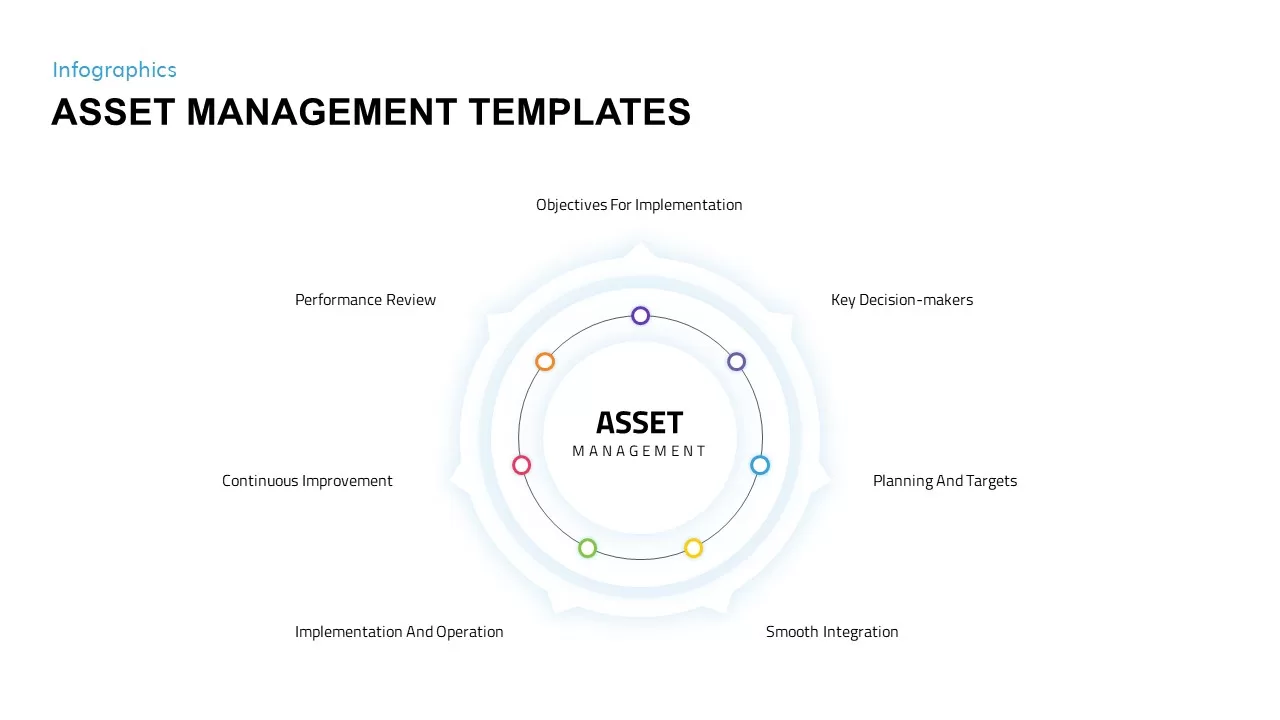
Asset Management PowerPoint Template
Infographic
Premium
-

Animated Agriculture PowerPoint Deck Template
PowerPoint Templates
Premium
-

Free Cartoon PowerPoint Template
Free PowerPoint Templates
Free
-
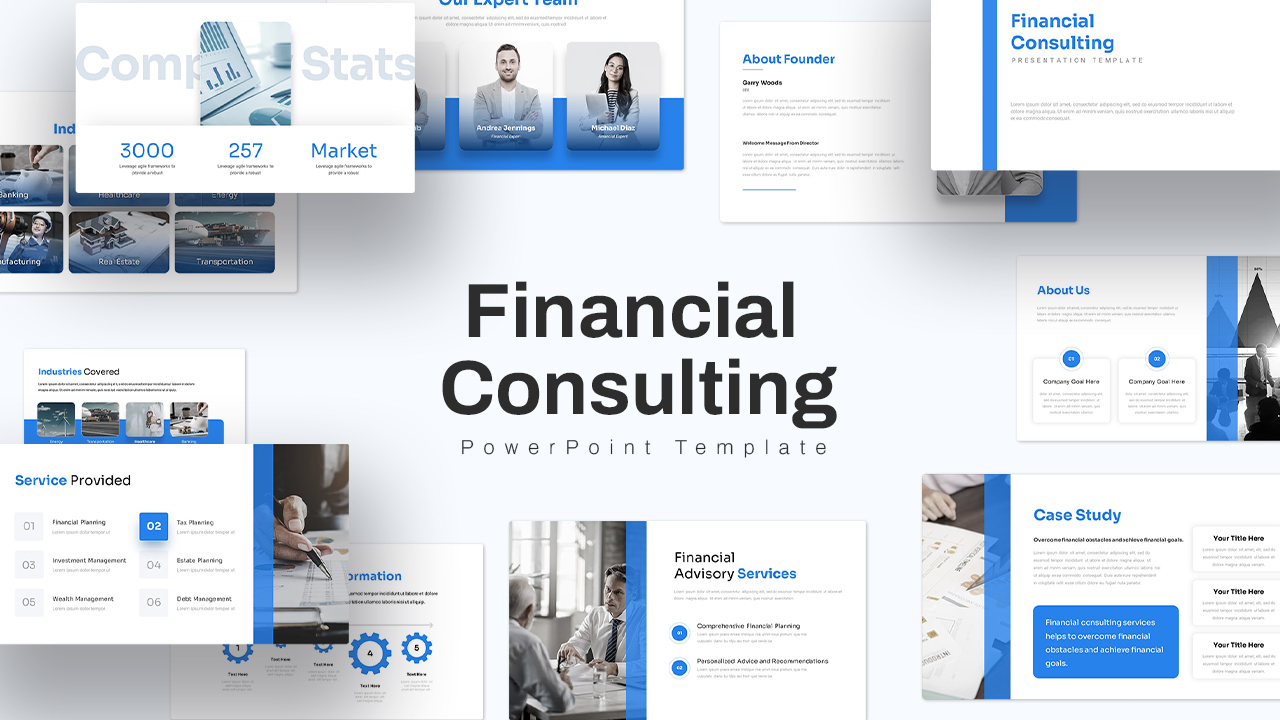
Finance Consulting PowerPoint Template
PowerPoint Templates
Premium
-
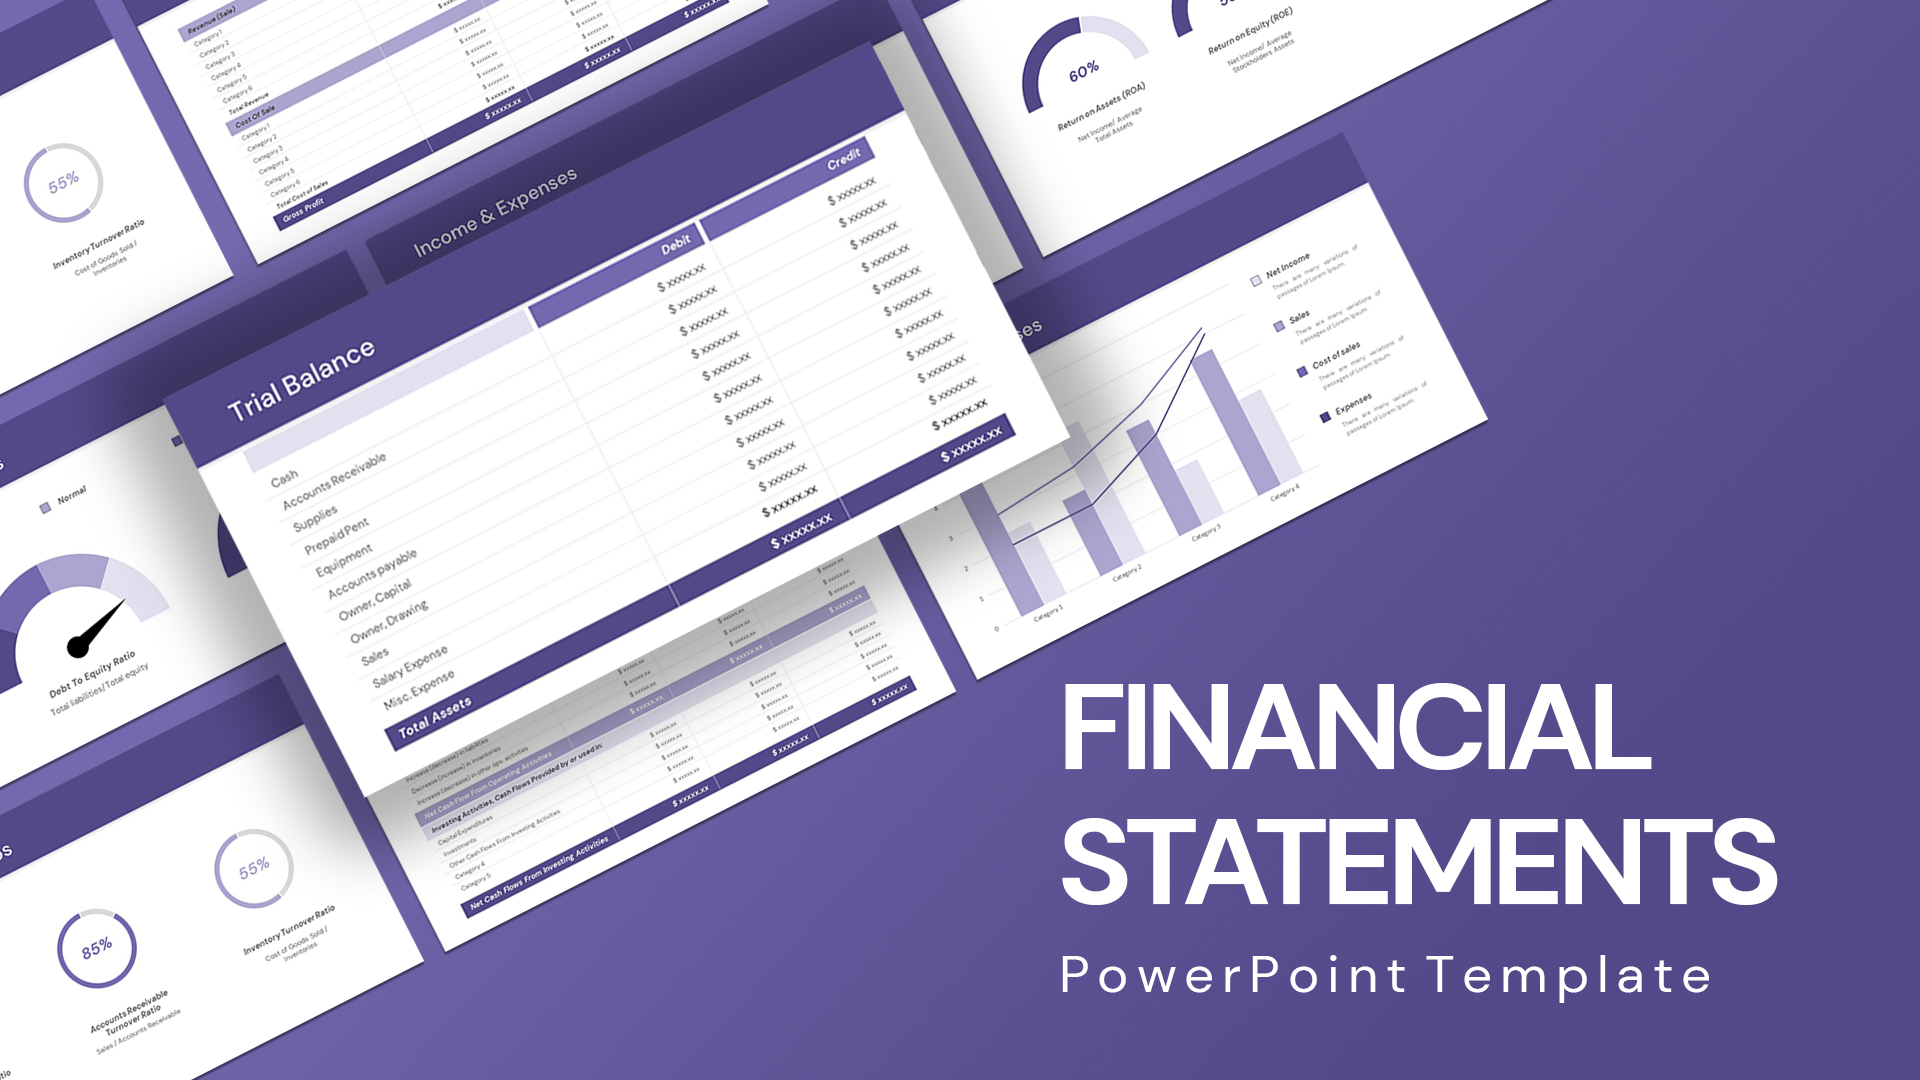
Financial Statement PowerPoint Template
PowerPoint Templates
Premium
-

Free University Presentation PowerPoint Template
PowerPoint Templates
Free
-

Global Warming Infographic PowerPoint Template Deck
PowerPoint Templates
Premium
-
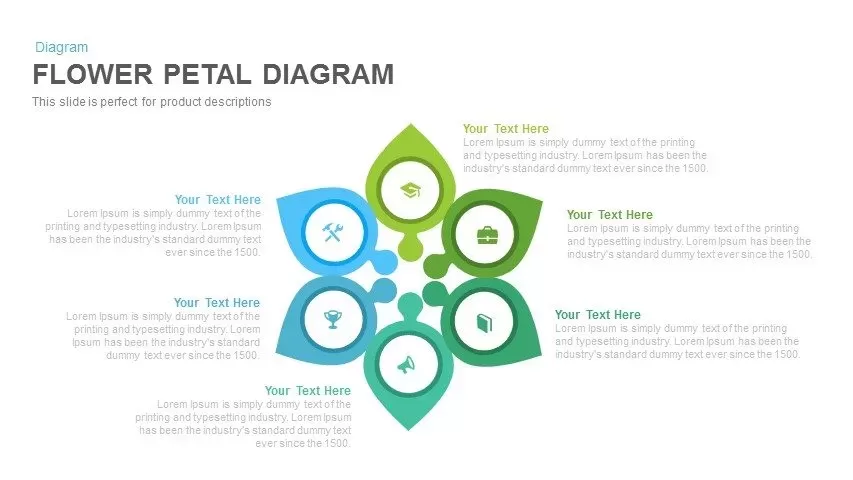
Flower Petal Diagram PowerPoint Template and Keynote Slide
Diagrams
Premium
-

Free Event Planning PowerPoint Template
Free PowerPoint Templates
Free
-

Free Book Review PowerPoint Template
Free PowerPoint Templates
Free
-
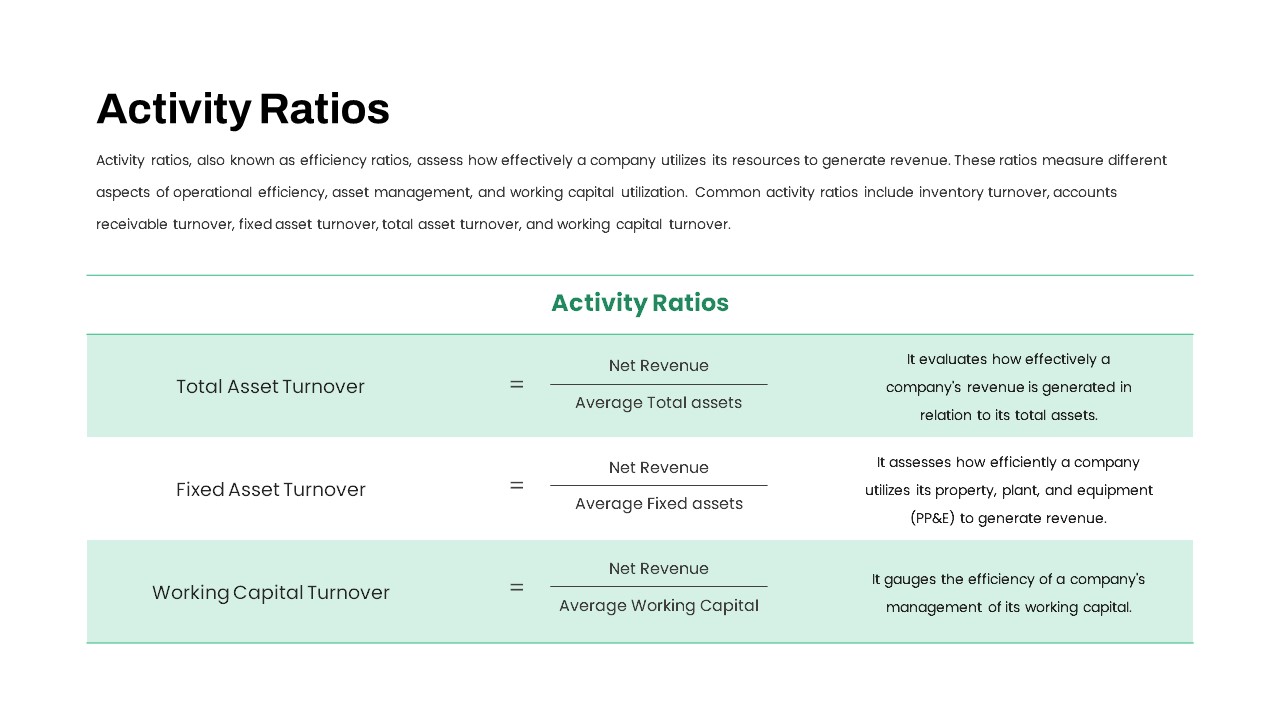
Activity Ratios PowerPoint Template
PowerPoint Templates
Premium
-

Data Science PowerPoint Template
PowerPoint Templates
Premium
-

EFQM Model PowerPoint Template
PowerPoint Templates
Premium
-
7 Step Flower Diagram Template for PowerPoint and Keynote
Circular Diagrams
Premium
-
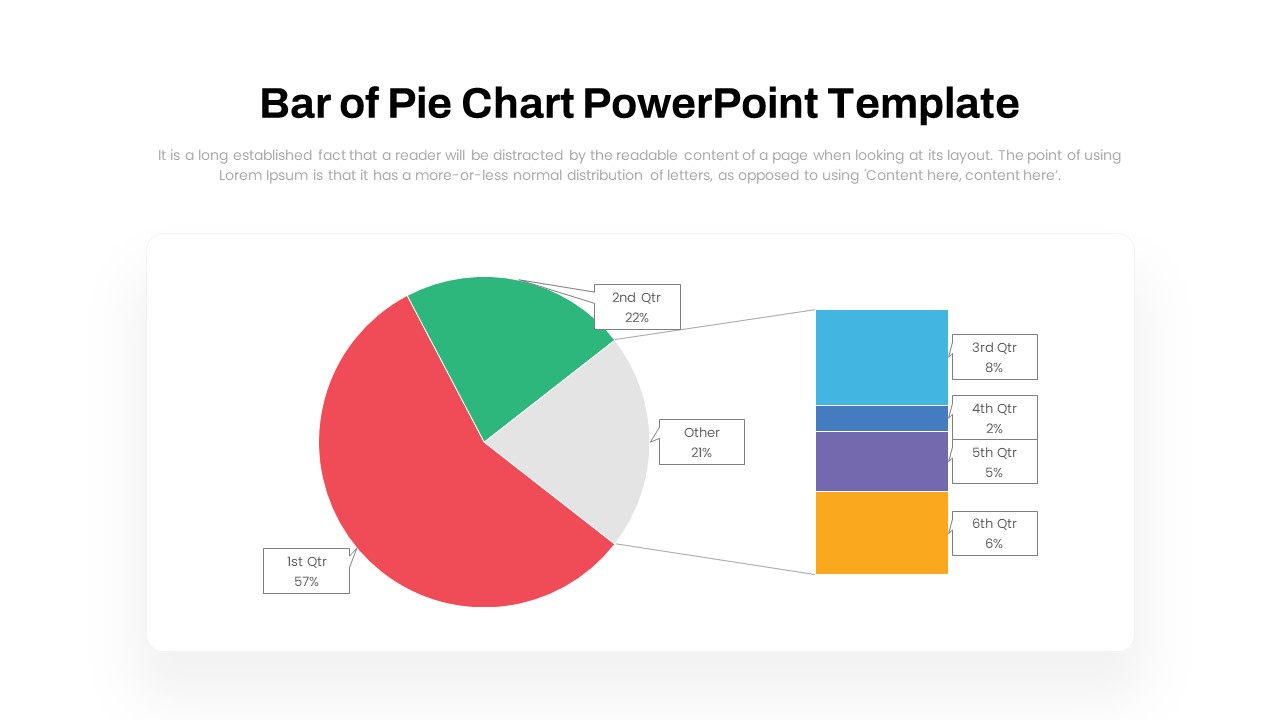
Bar of Pie Chart PowerPoint Template
PowerPoint Templates
Premium
-
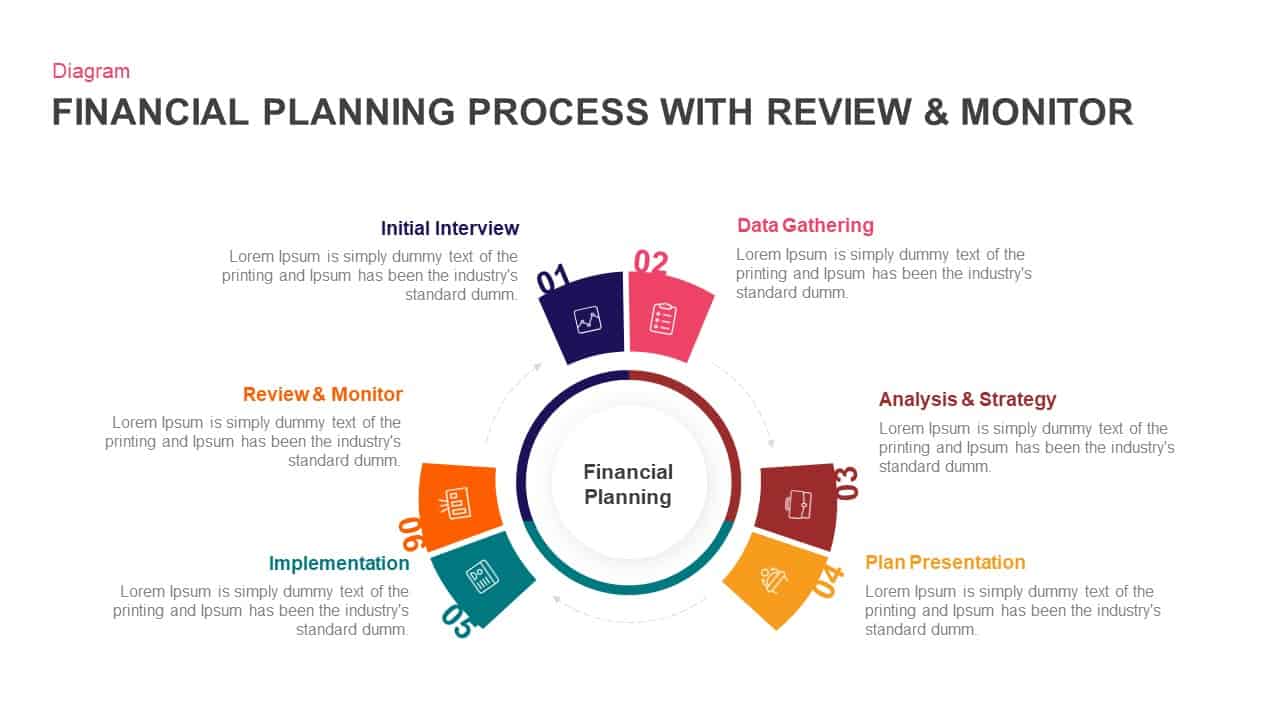
Financial Planning Process With Review and Monitor Template for PowerPoint & Keynote
Business Models
Premium
-

Free Dunder Mifflin Paper Company Pitch Deck
Free PowerPoint Templates
Free
-
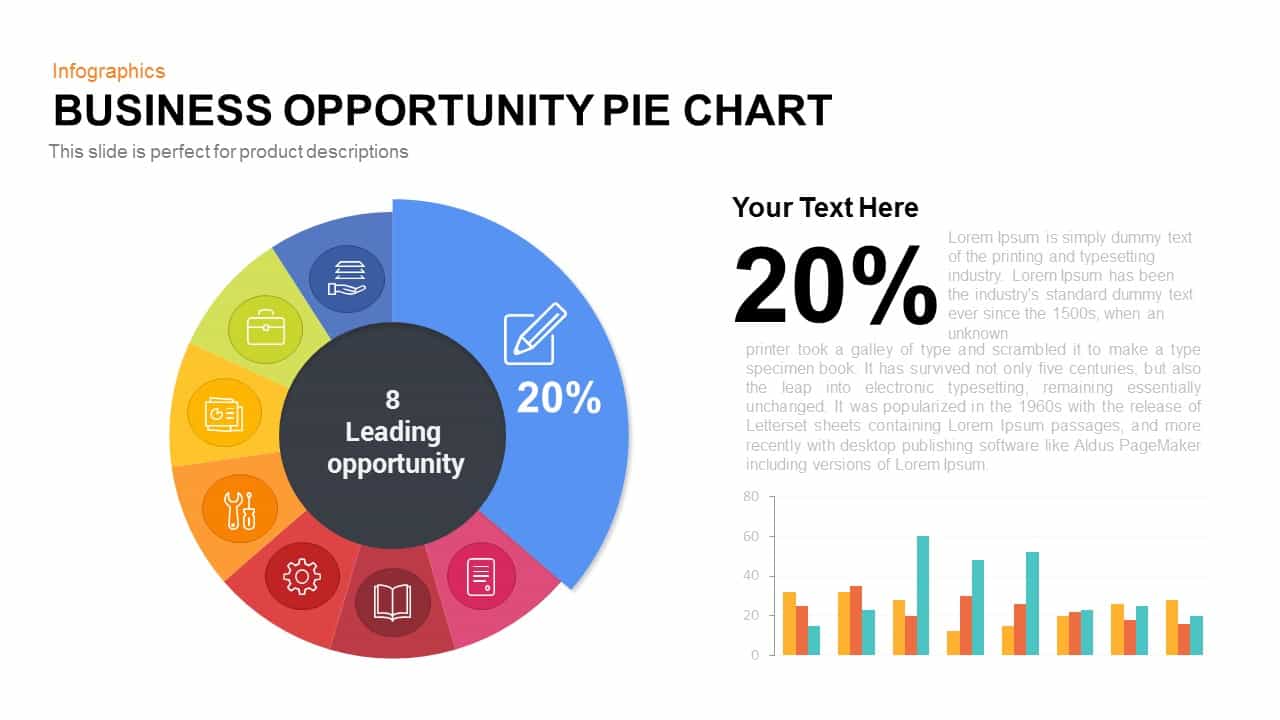
Business Opportunity PowerPoint Pie-Chart Template
Business Models
Premium
-

Real Estate PowerPoint Theme
PowerPoint Themes
Premium
-

Annual Report PowerPoint Template and Keynote
PowerPoint Templates
Premium
-

Free Finance Deck PowerPoint Template
PowerPoint Templates
Free
-
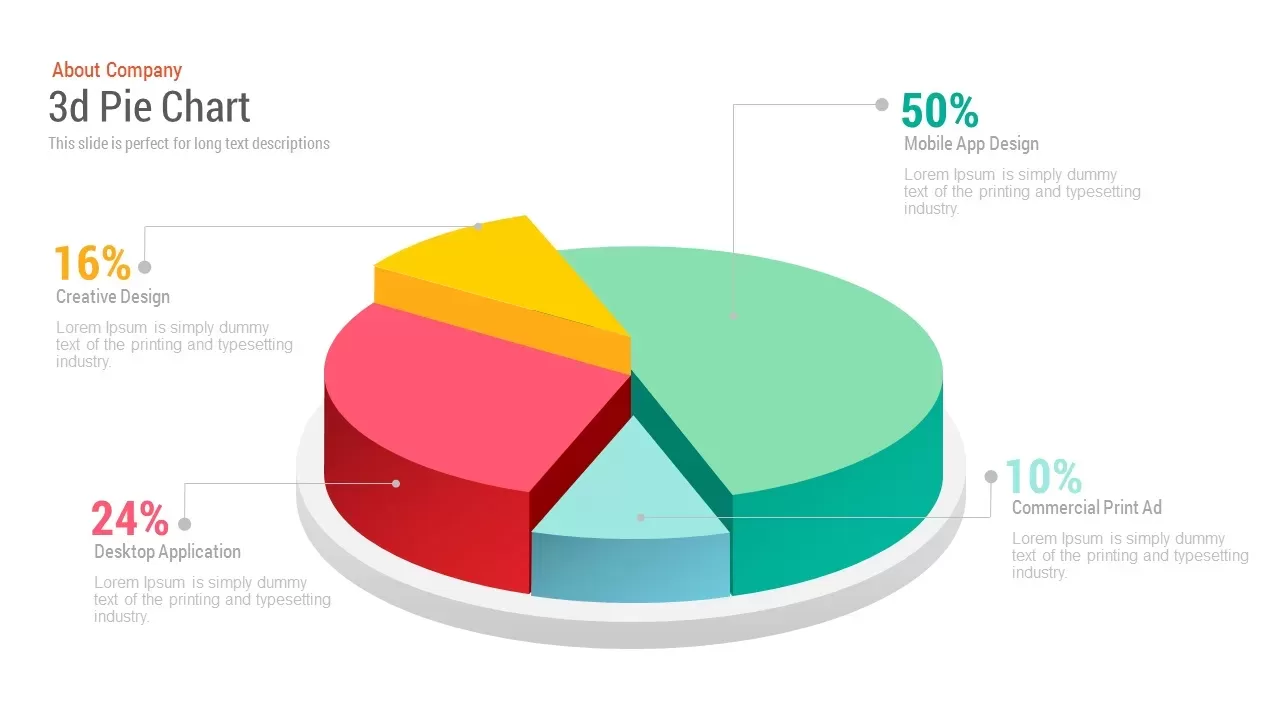
Free 3d Pie Chart PowerPoint Template & Keynote slide
Pie & Donut
Free
-
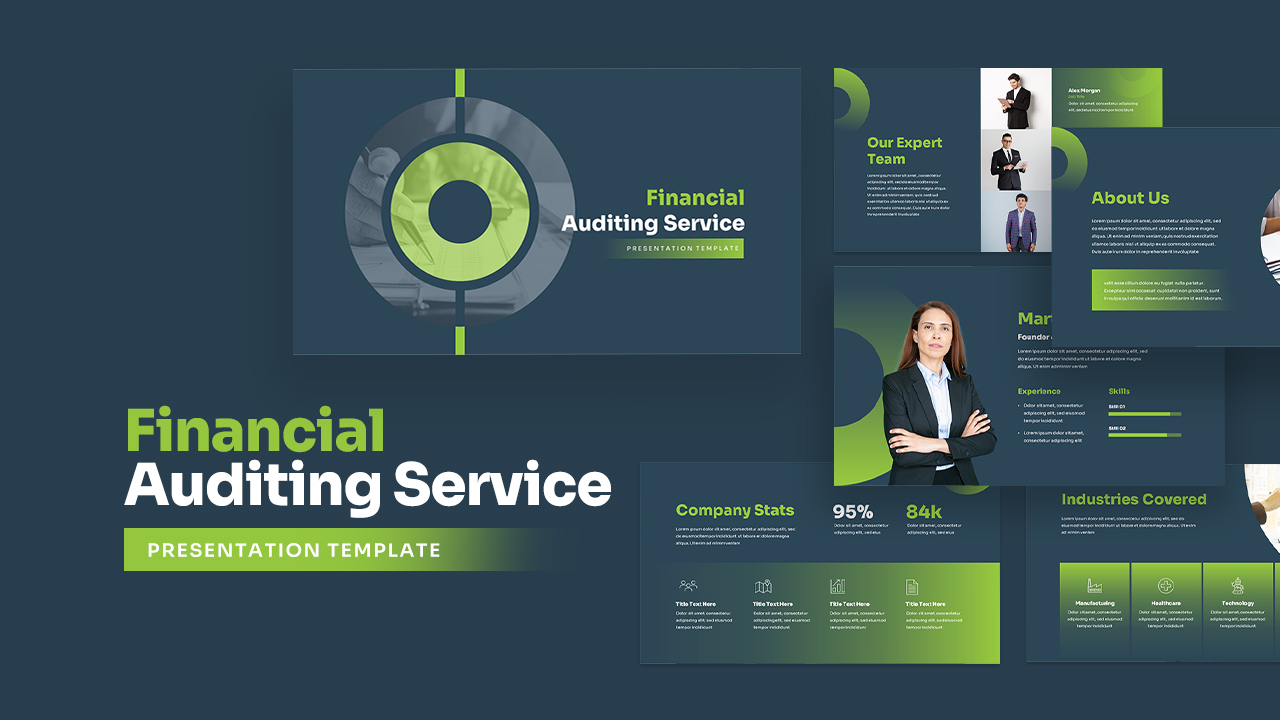
Financial Auditing Service Presentation Template
PowerPoint Templates
Premium
-

Business Process Reengineering Template
PowerPoint Templates
Premium
-
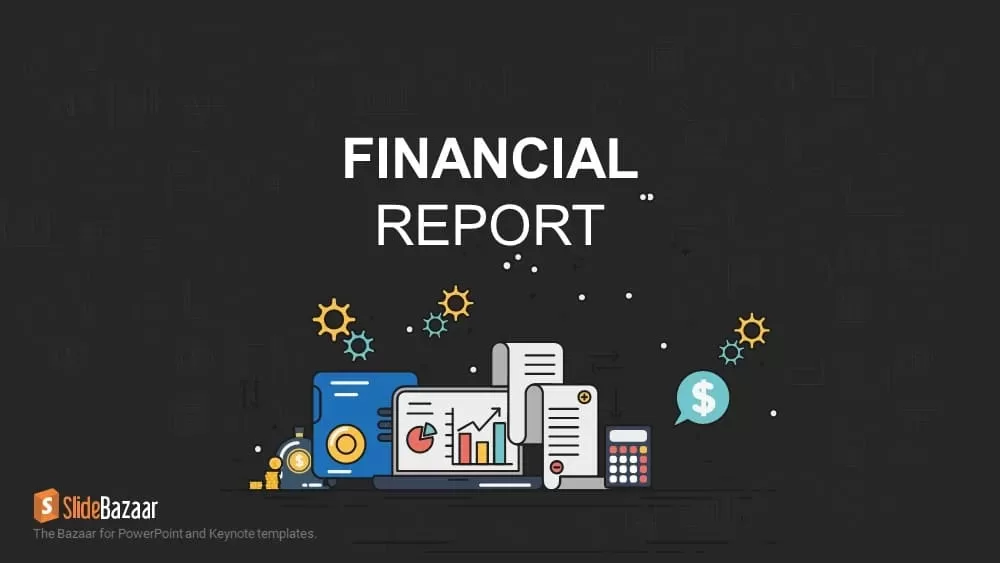
Financial Report PowerPoint Template & Keynote
PowerPoint Templates
Premium
-

Free AI Artificial Intelligence PowerPoint Template
PowerPoint Templates
Free
-
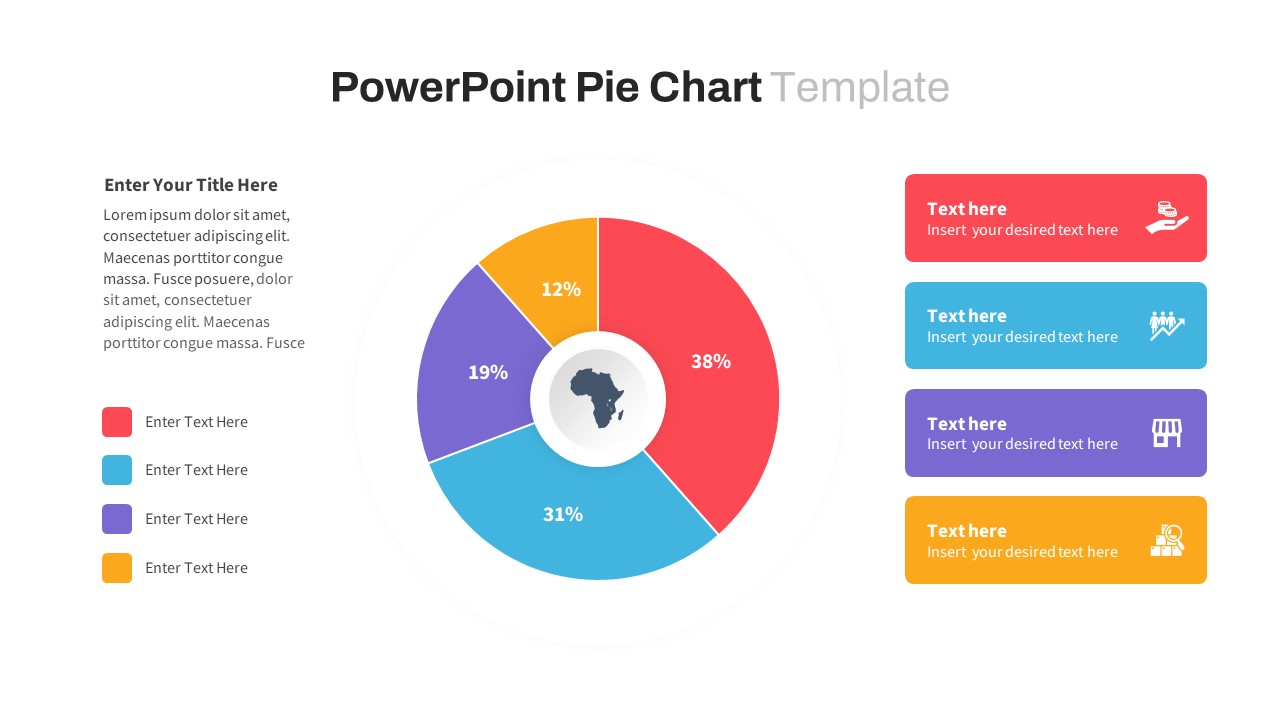
Pie Chart PowerPoint Template
Infographic
Premium
-
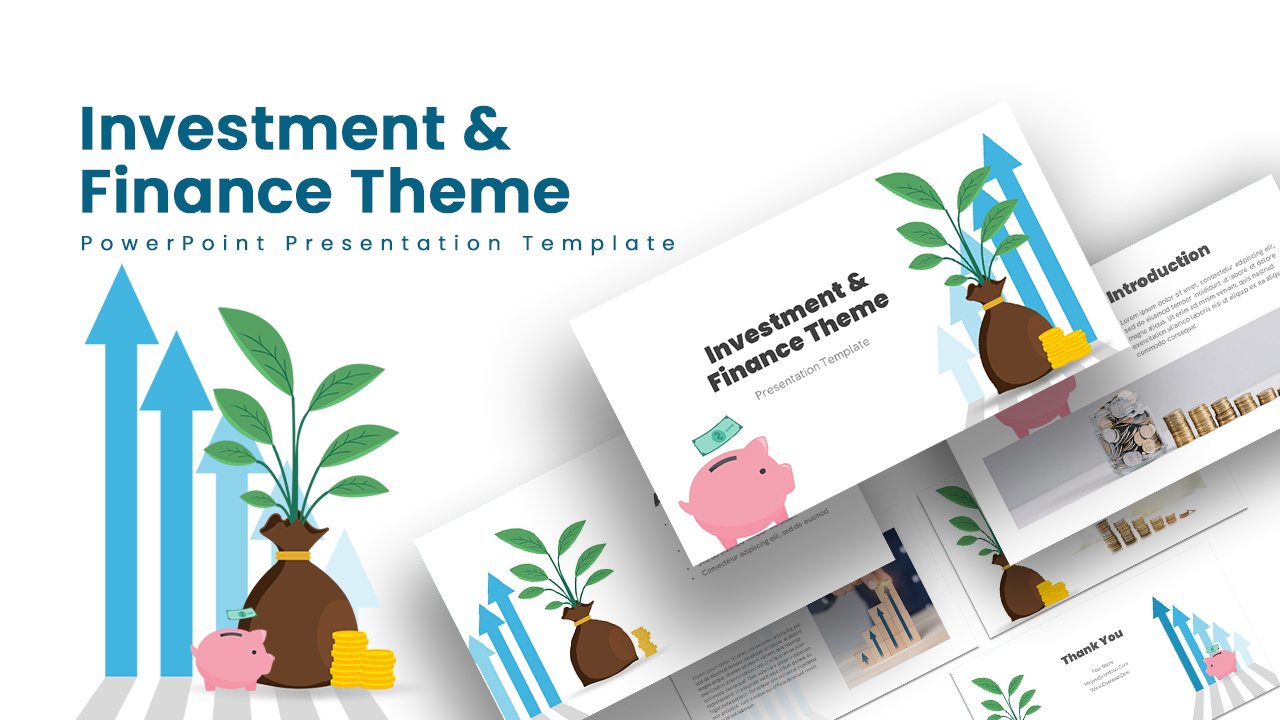
Investment & Finance PowerPoint Theme
PowerPoint Themes
Premium
-

Stakeholder Register PowerPoint Template
PowerPoint Templates
Premium
-
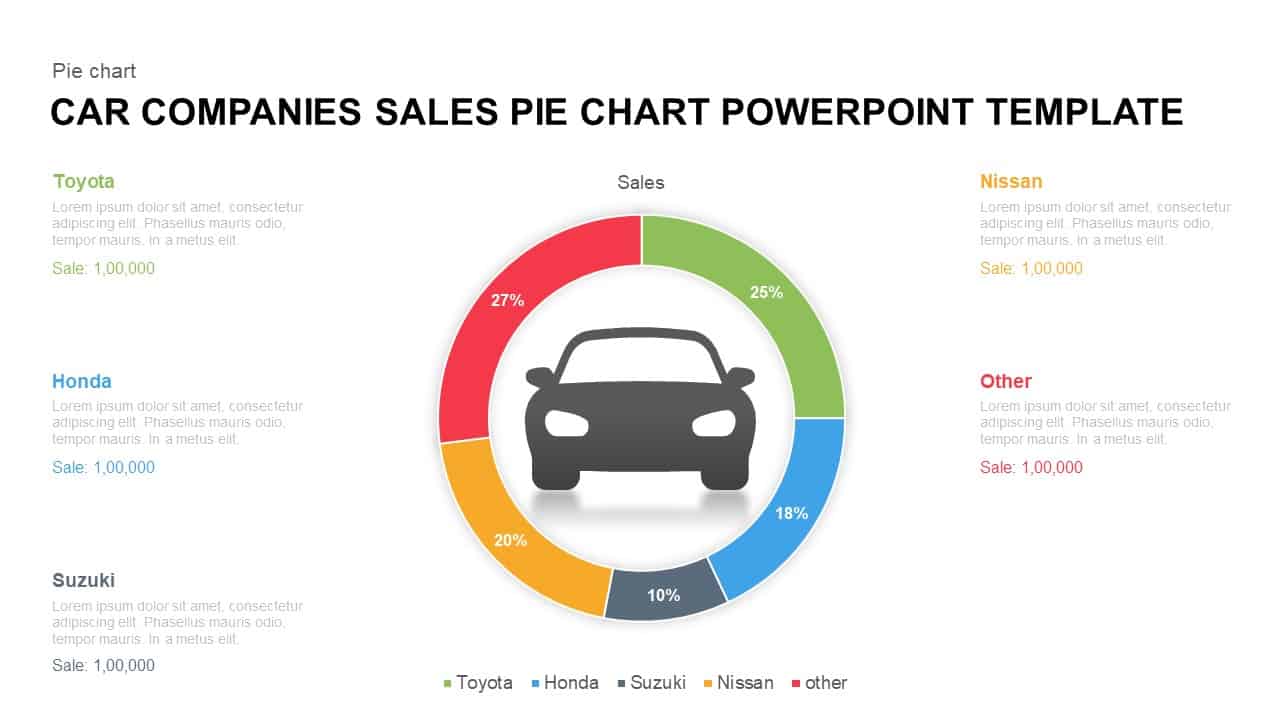
Car Companies Sales Pie Chart Template for PowerPoint & Keynote
Column and Bar chart
Premium
-

Animated Upcoming Event Poster PowerPoint Template
PowerPoint Templates
Premium
-
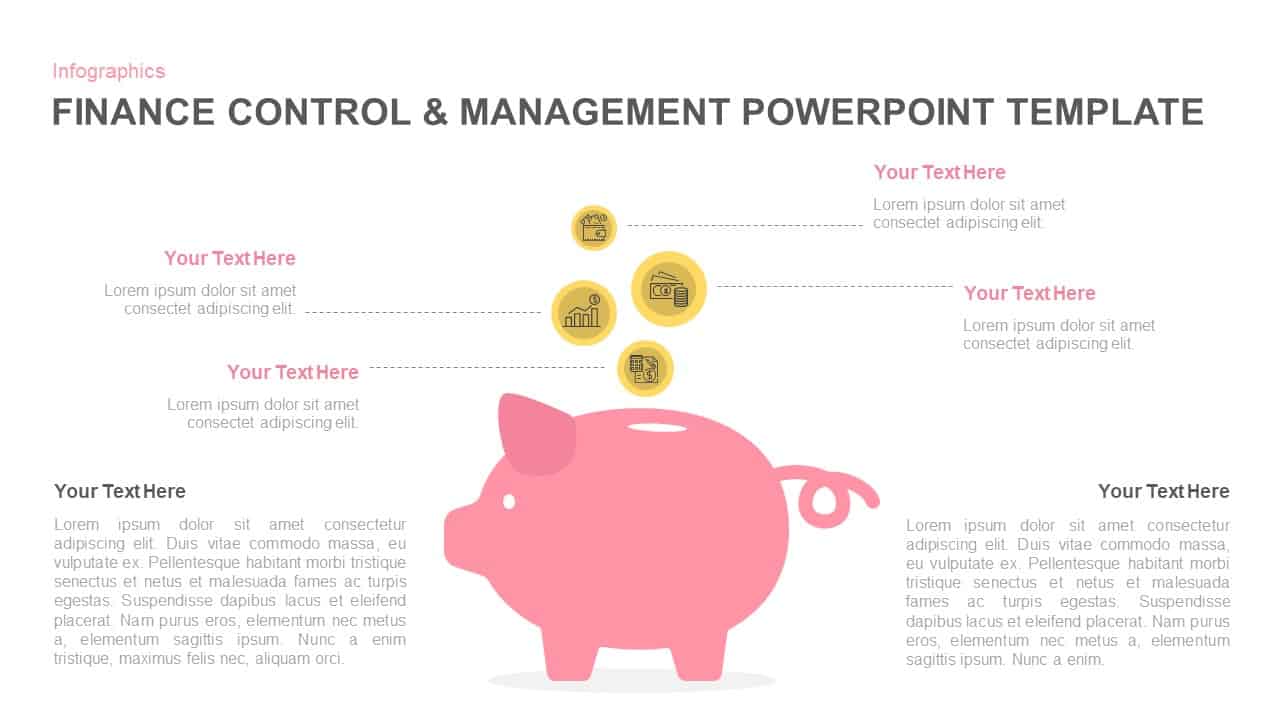
Financial Management PowerPoint Template and Keynote Slide
Infographic
Premium
-
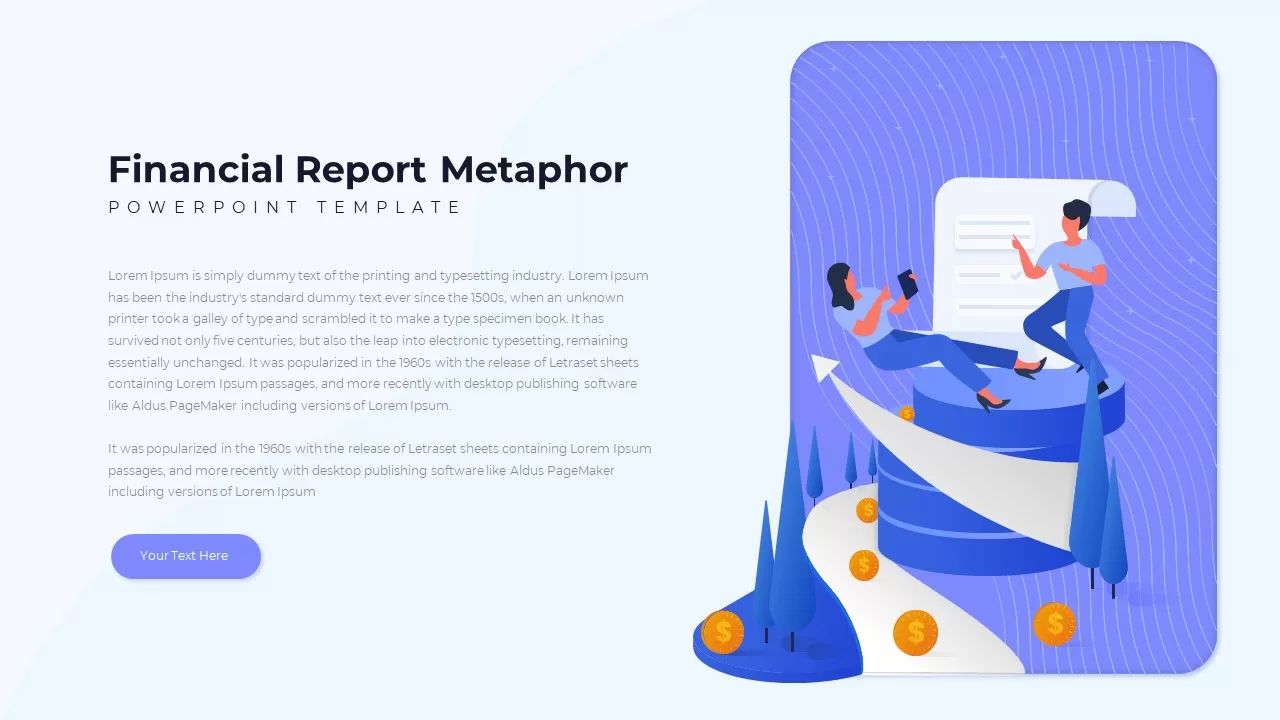
Financial Report Metaphor PowerPoint Presentation Template
Metaphor, Simile & Analogy
Premium
-
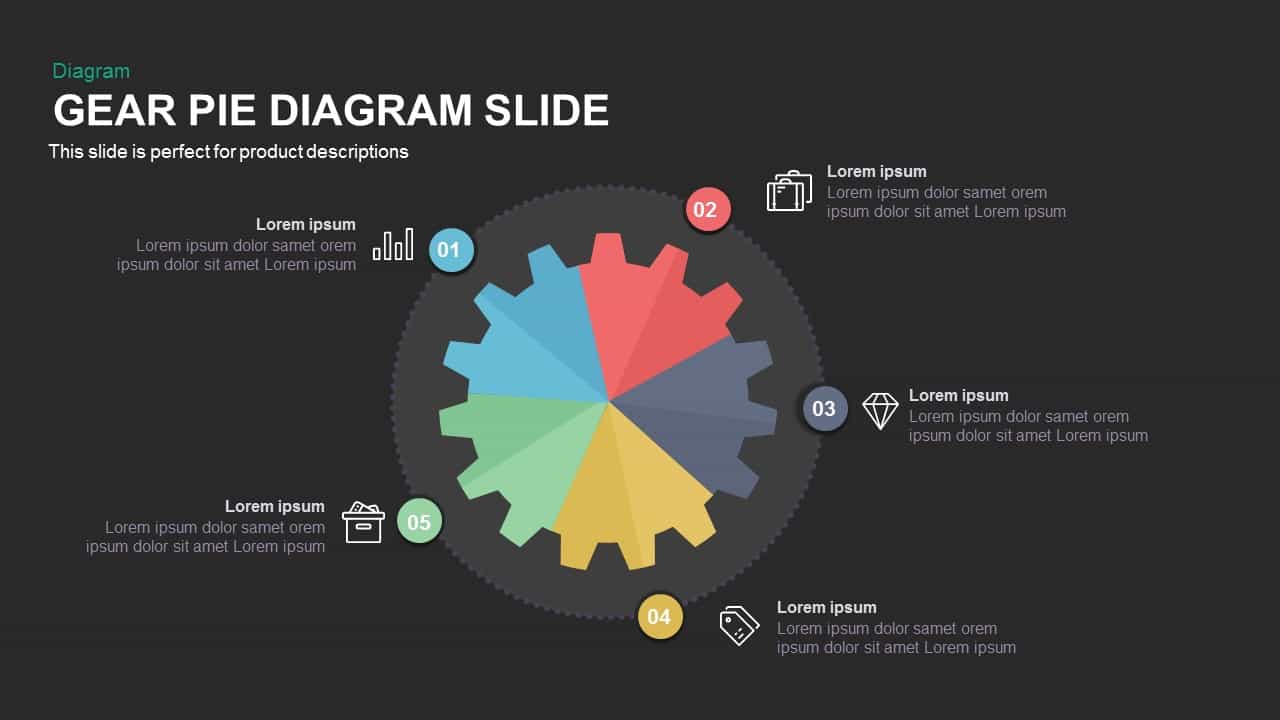
Gear Pie chart PowerPoint Template and Keynote Slide
Diagrams
Premium
-
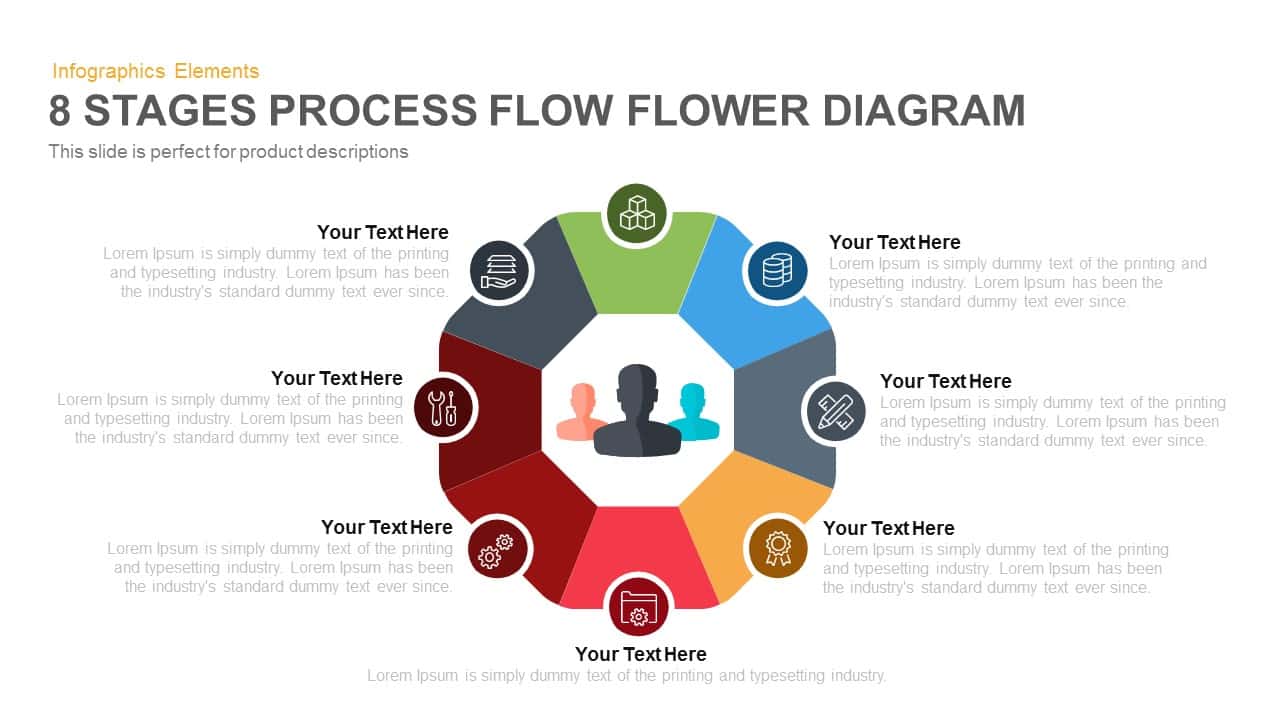
8 Stages Flower Process Flow Diagram PowerPoint Template and Keynote
Diagrams
Premium
-
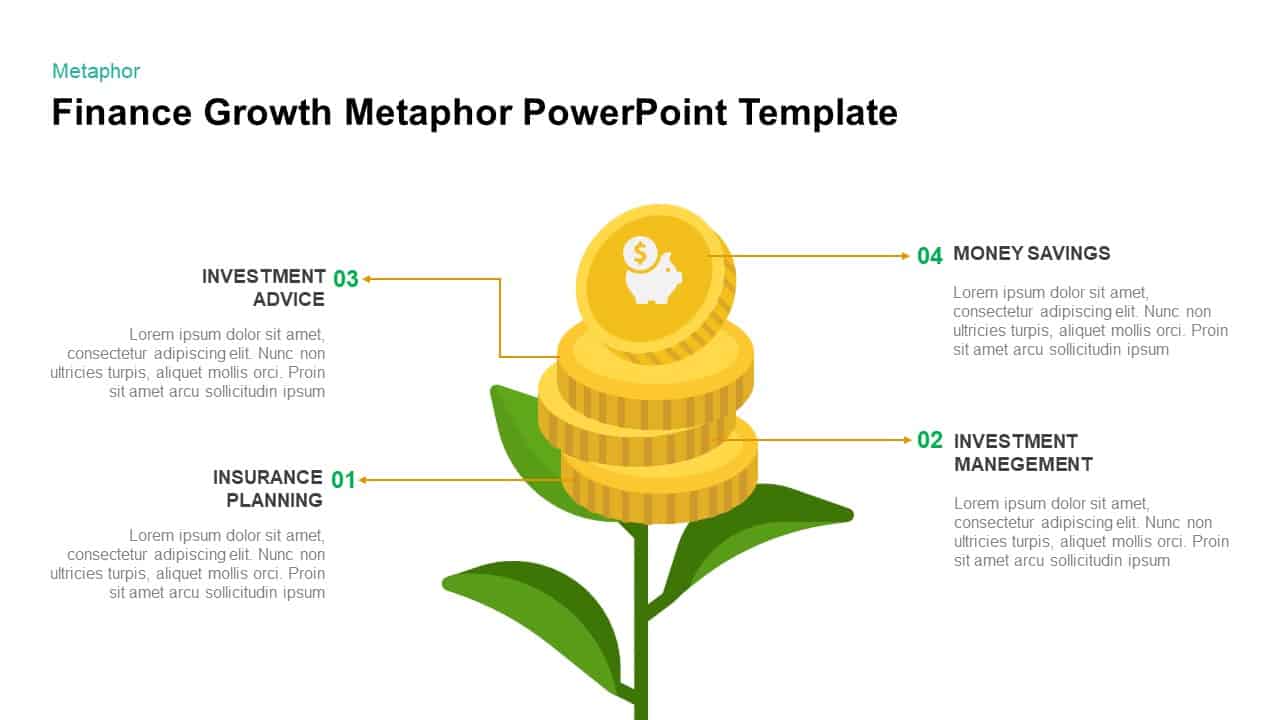
Financial Growth Template for PowerPoint & Keynote
Business Models
Premium
-

Finance Advisor PowerPoint Template
PowerPoint Templates
Premium
-

Open Door Policy PowerPoint Template
PowerPoint Templates
Premium
-
Go To Market PowerPoint Template
PowerPoint Templates
Premium
-
CAPM Model Template
Curves and Lines
Premium
-

Biotechnology PowerPoint Presentation Template
PowerPoint Templates
Premium
-
Finance Pitch Deck Prezi Style PowerPoint Template
PowerPoint Templates
Premium
-

Power Analogy Metaphor PowerPoint Template
Metaphor, Simile & Analogy
Premium
-
6 Step Circular Diagram Template for PowerPoint and Keynote
Circular Diagrams
Premium
-
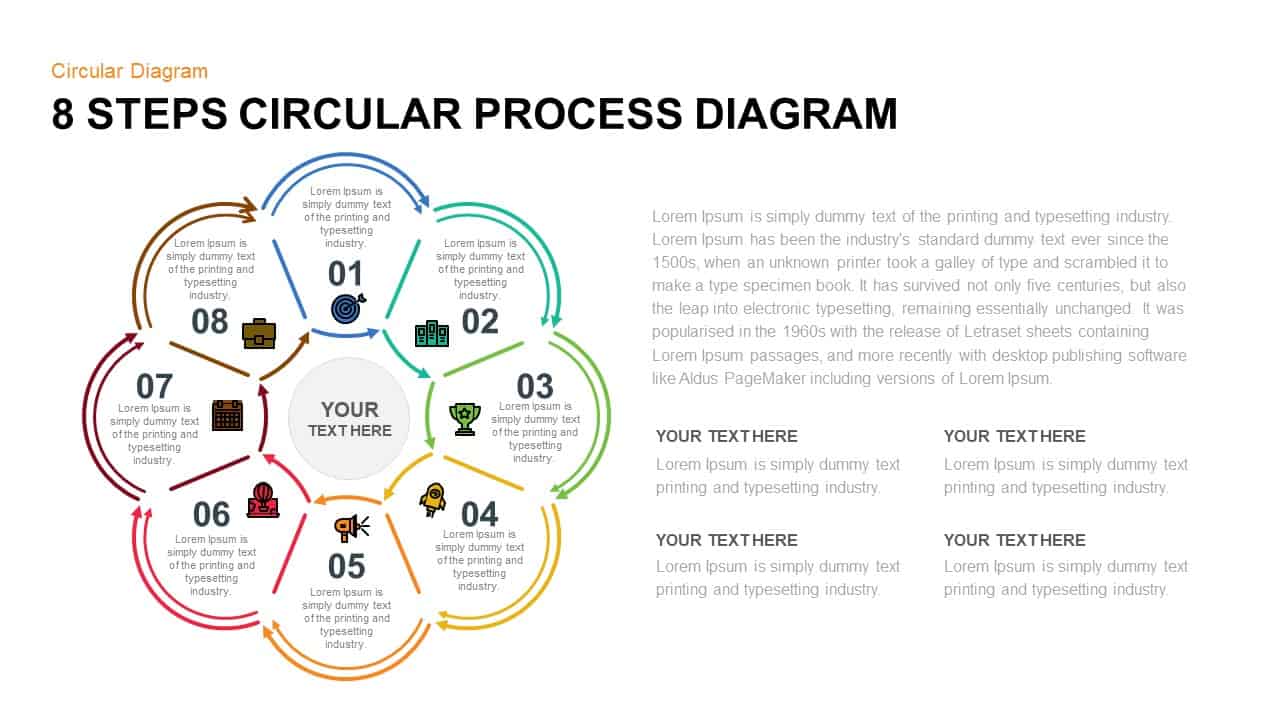
8 Step Circular Process Diagram PowerPoint & Keynote Template
Circular Diagrams
Premium
-
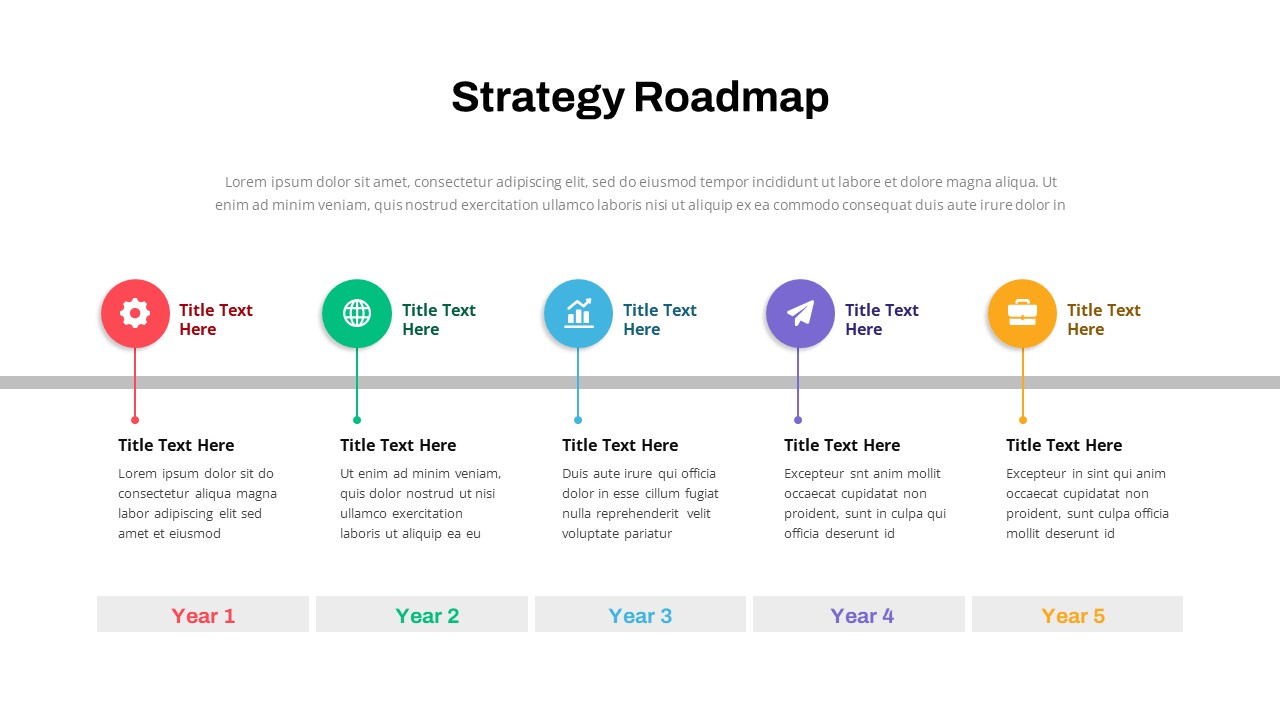
Data Strategy Roadmap PowerPoint Template
PowerPoint Templates
Premium
-
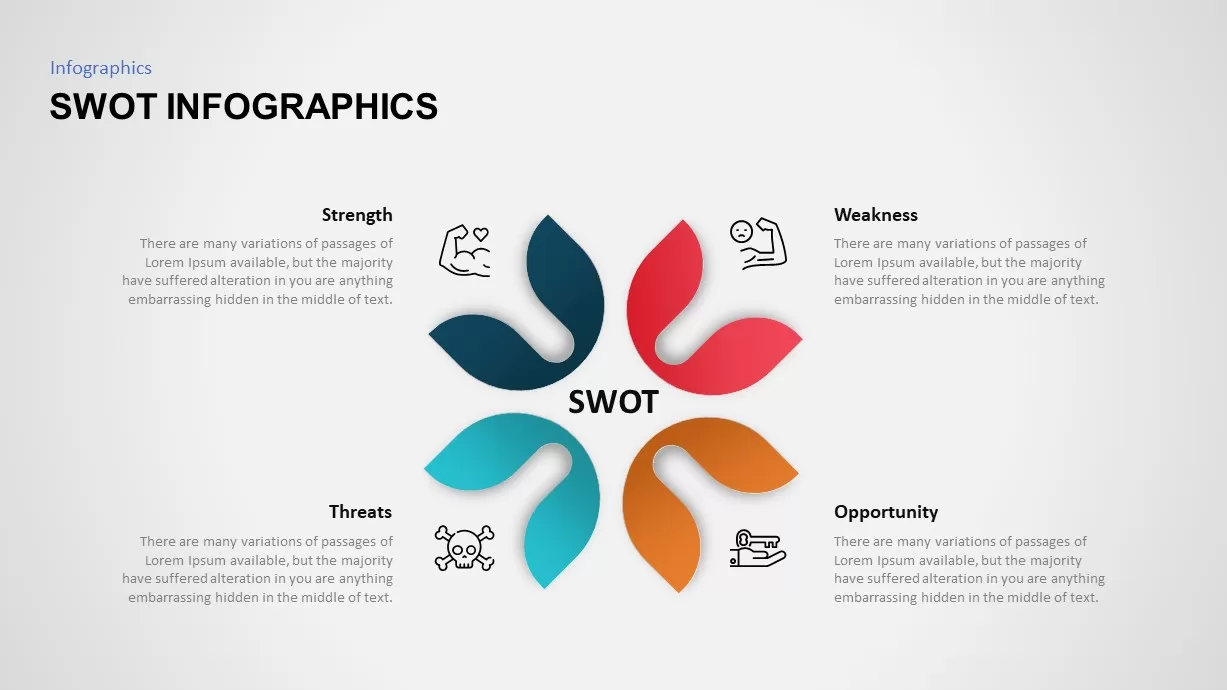
SWOT Infographic Template
Business Models
Premium
-
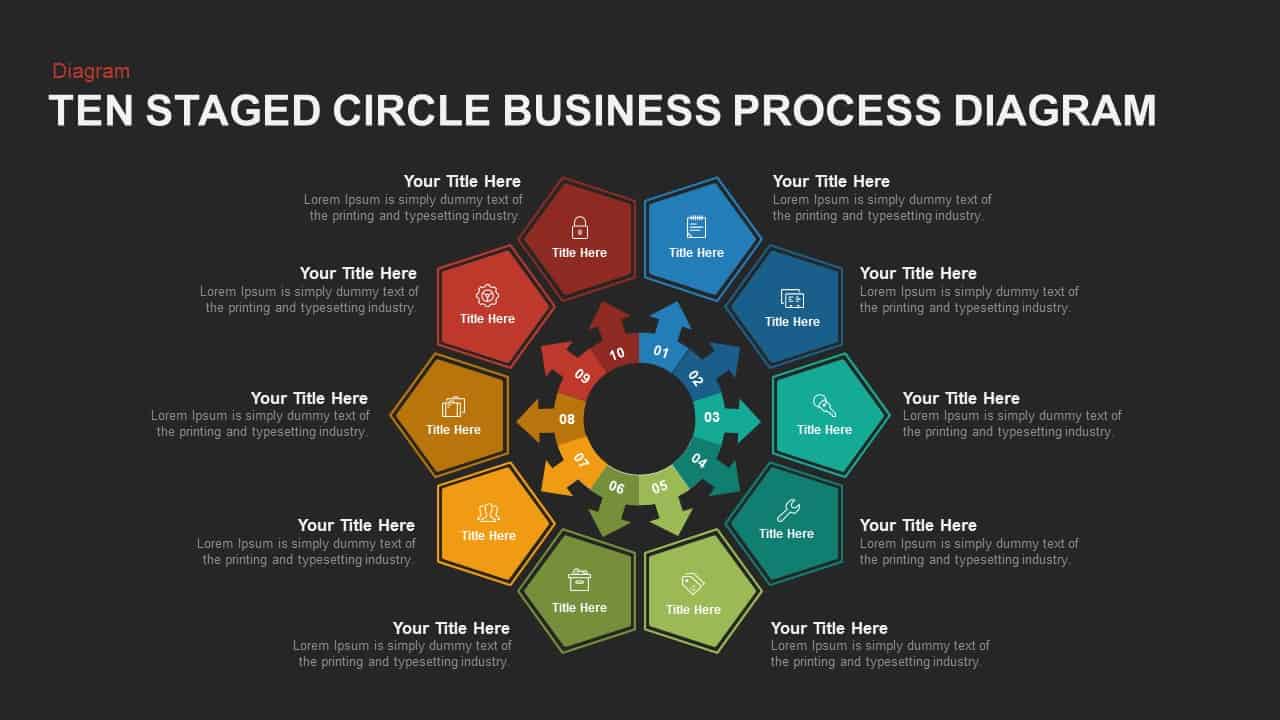
10 Staged Business Circle Process Diagram Template for PowerPoint and Keynote
Process Flow Diagrams
Premium
-
3, 5 & 7 Stages Process Circular Diagrams for PowerPoint and Keynote
Process Flow Diagrams
Premium
-
Free Accounting Presentation Template
PowerPoint Templates
Free
-
6 Staged Flower Diagram PowerPoint Template and Keynote
Circular Diagrams
Premium
-
6 Stage Circle Diagram PowerPoint Template and Keynote
Circular Diagrams
Premium
-
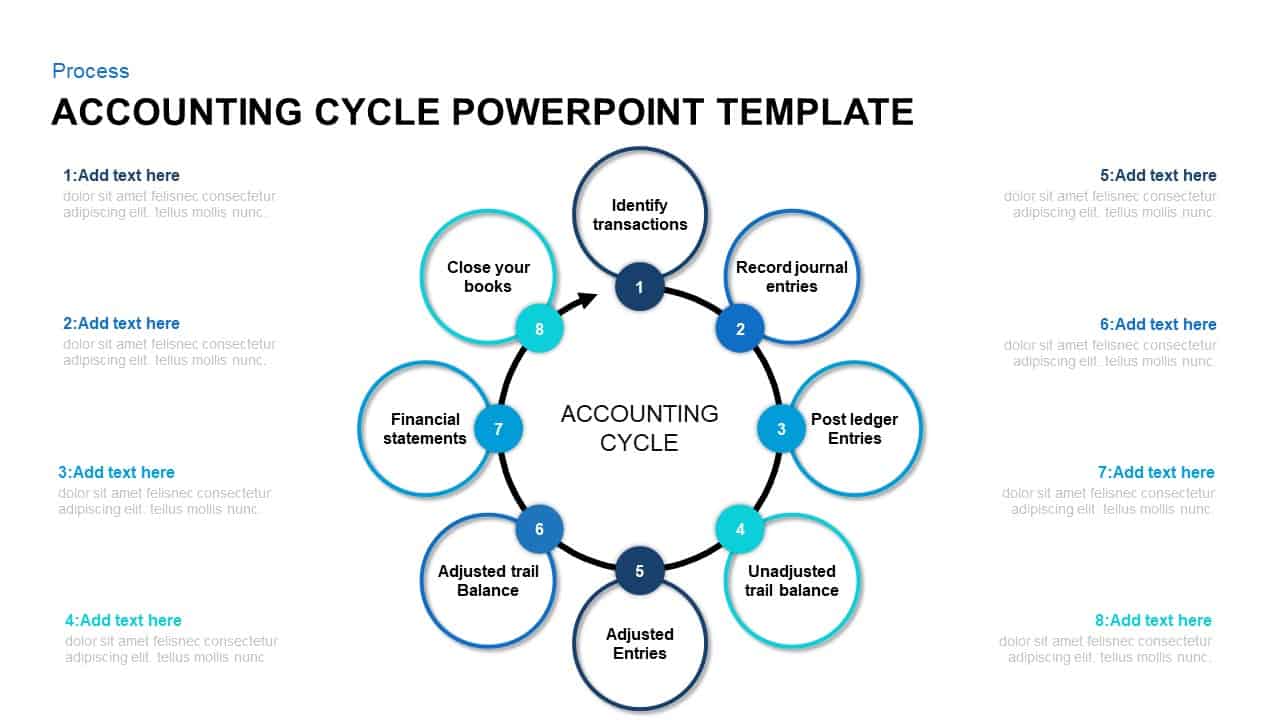
8 Step of Accounting Cycle PowerPoint Template
Circular Diagrams
Premium
-

Black and Green Theme PowerPoint Template
PowerPoint Templates
Premium
-
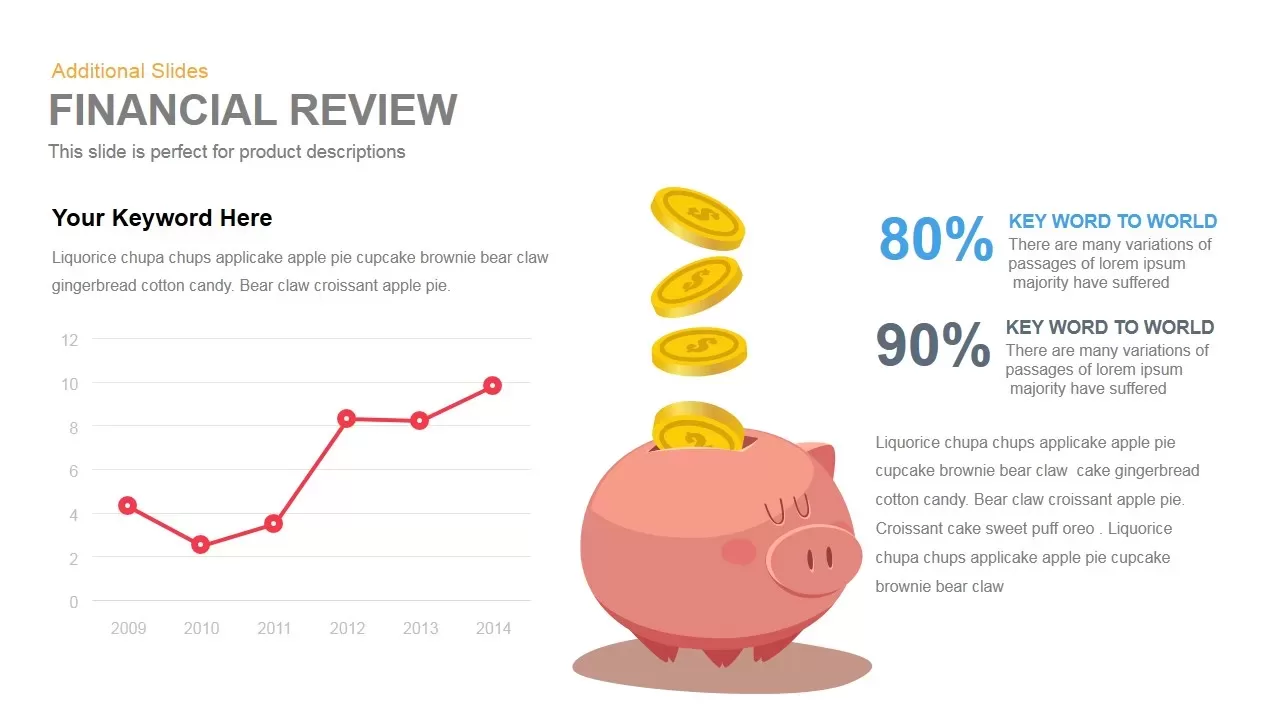
Financial Review Template for PowerPoint and Keynote
Infographic
Premium
-
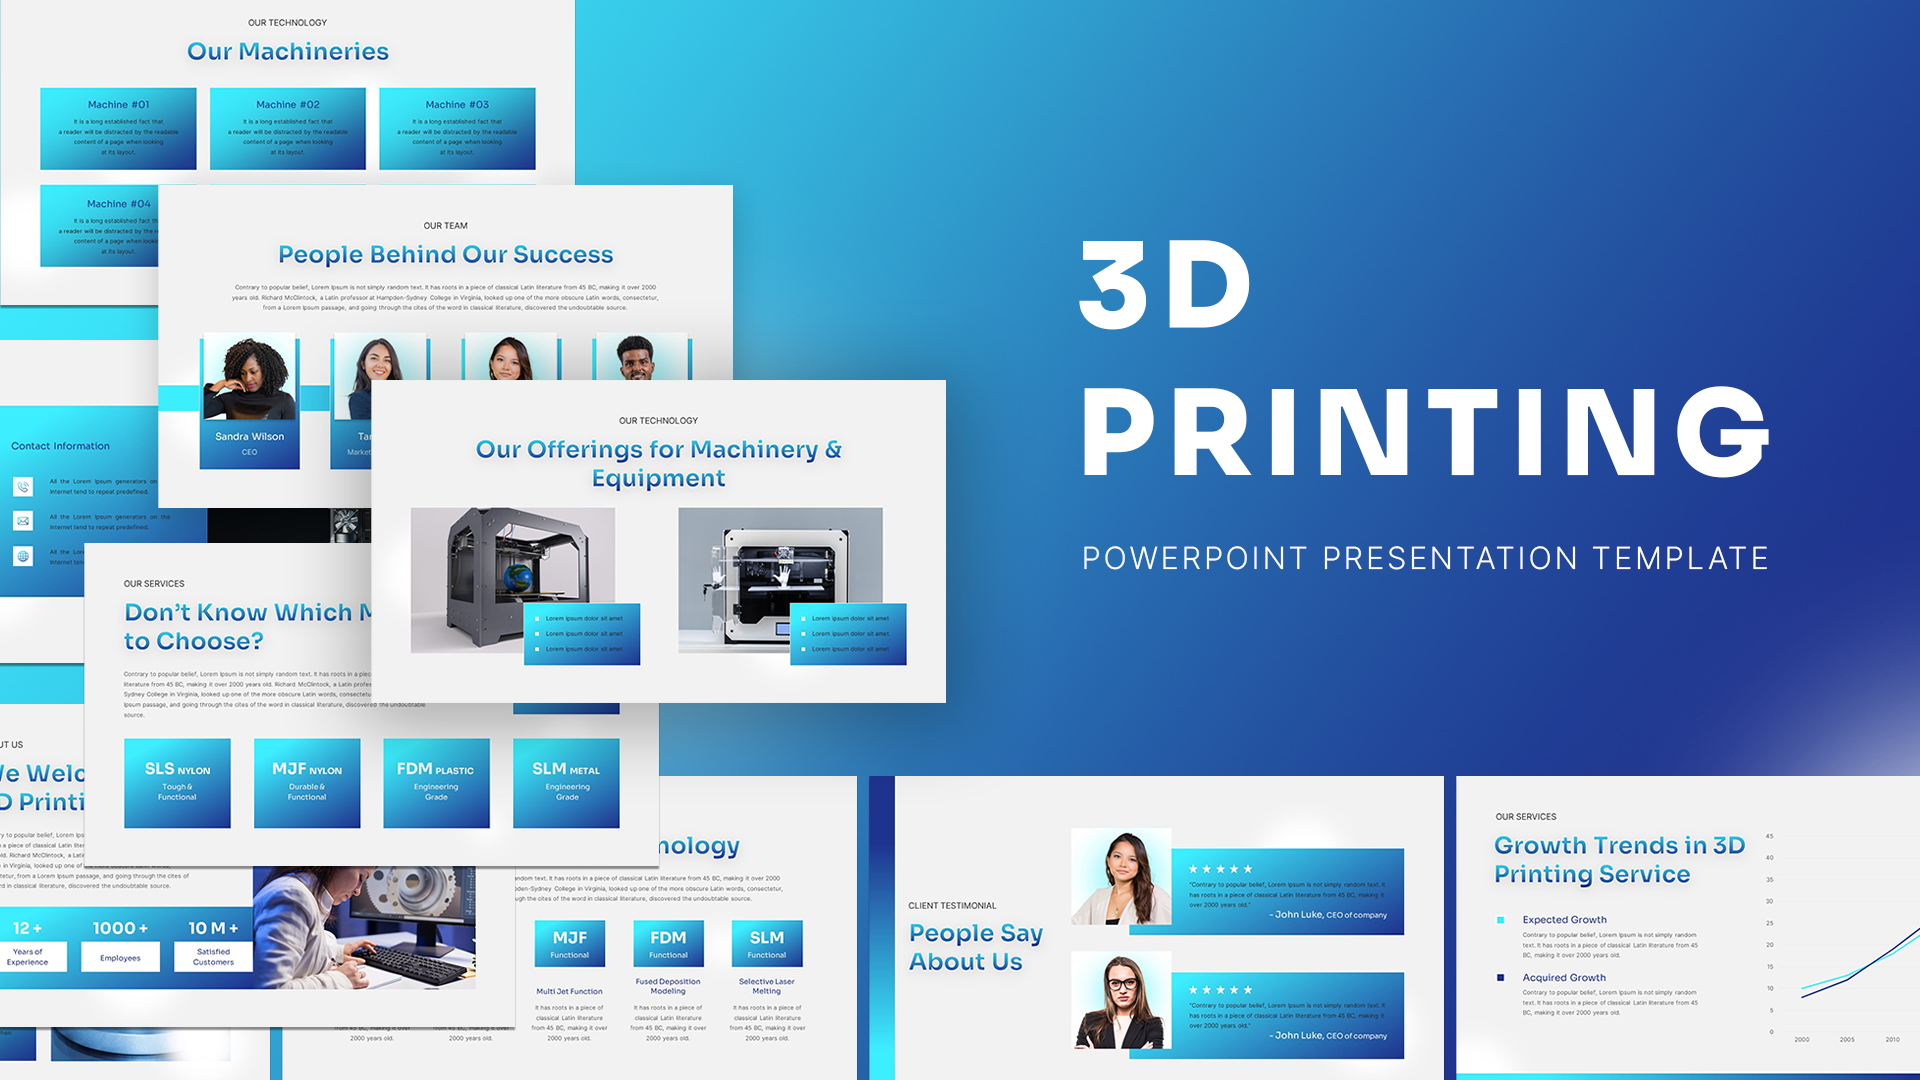
3D Printing Deck PowerPoint Template
PowerPoint Templates
Premium
-
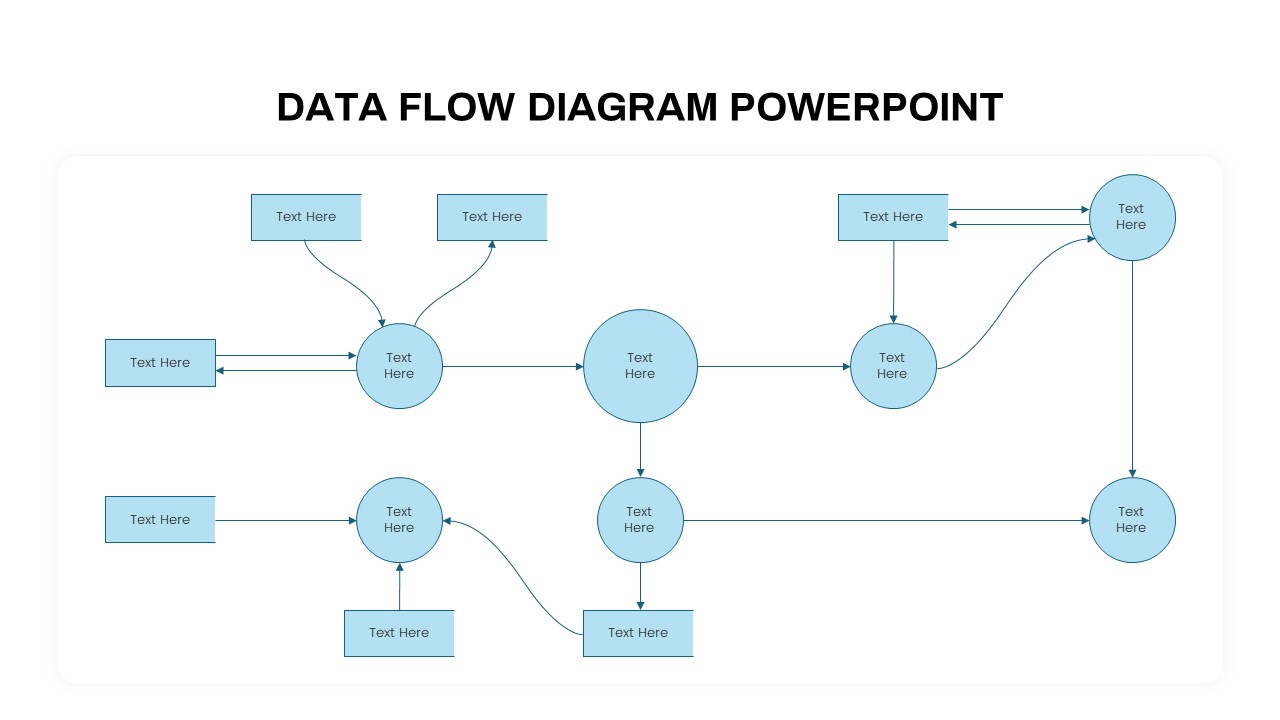
Data Flow PowerPoint Presentation Template
PowerPoint Templates
Premium
-
Corporate PowerPoint Presentation Template
PowerPoint Business Templates
Premium
-

Cyber Monday PowerPoint Template
PowerPoint Business Templates
Premium
-
Venn Diagram PPT Template and Keynote Slide
Diagrams
Premium
-
Flower Of Service Template
Circular Diagrams
Premium
-
Big Data Infographic Deck For PowerPoint
PowerPoint Business Templates
Premium
-
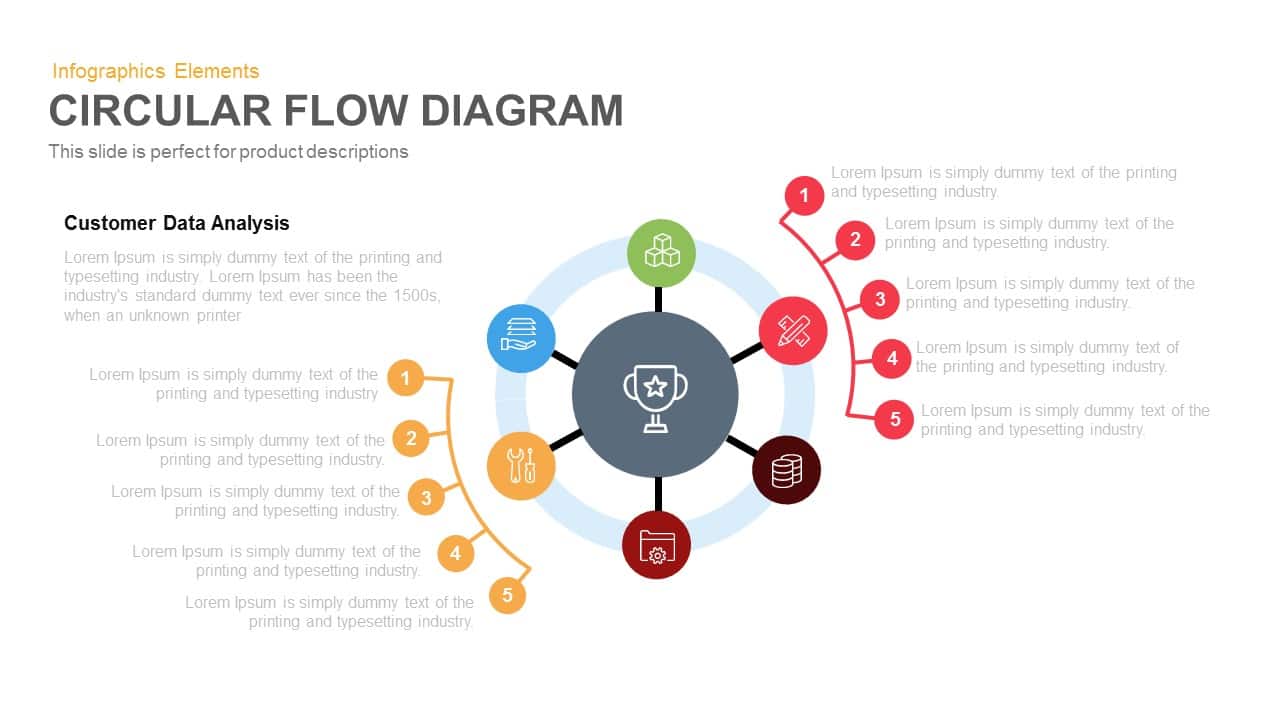
Circular Flow Diagram Template for PowerPoint and Keynote
Circular Diagrams
Premium
-
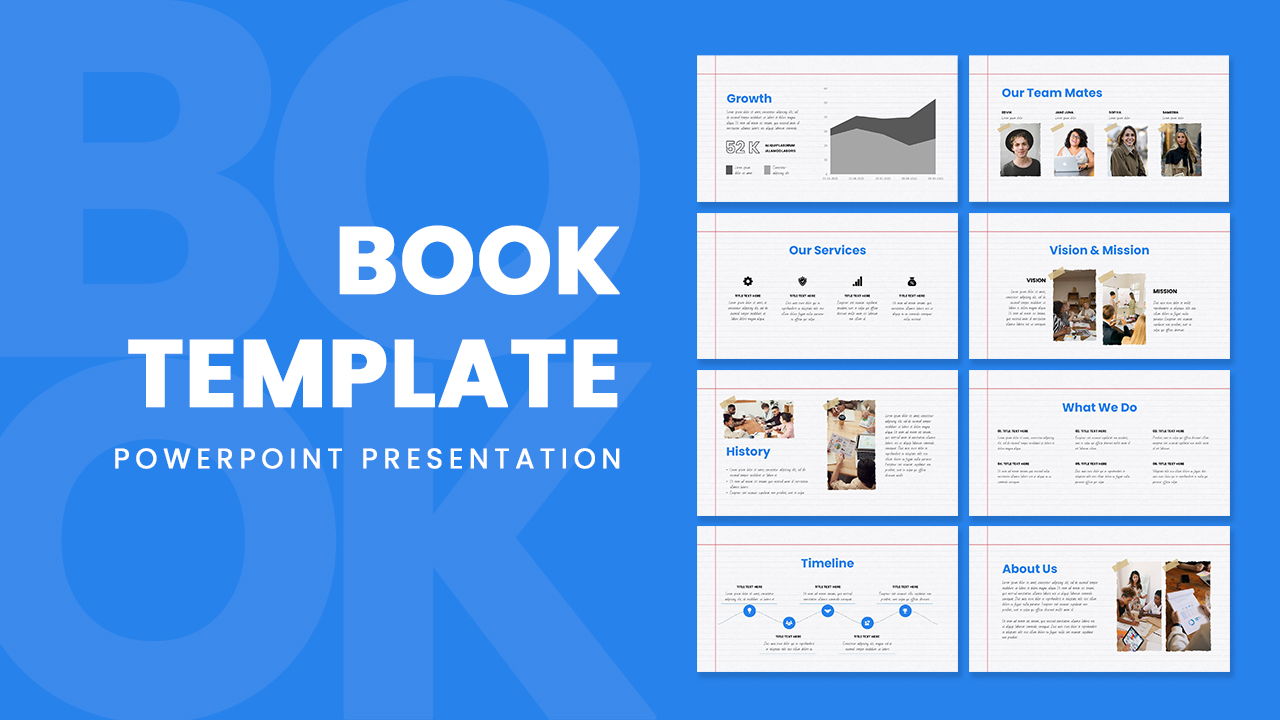
Free PowerPoint Book Template
Free slides
Free
-
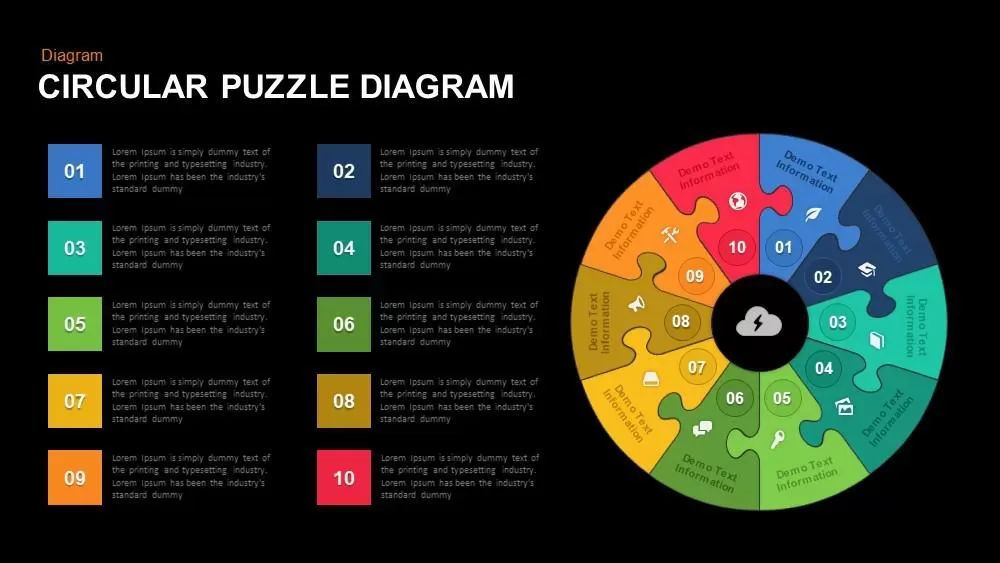
Circular Puzzle Diagram Template for PowerPoint and Keynote
Puzzle
Premium
-
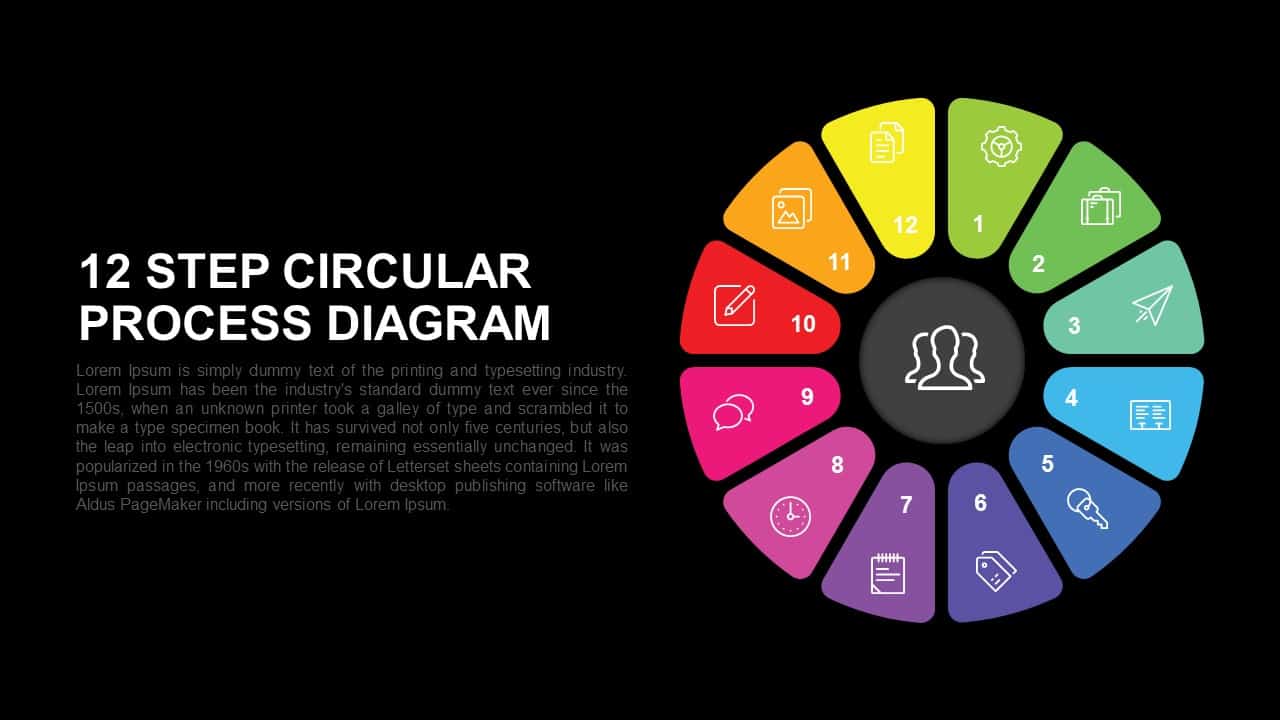
12 Step Circular Process Diagram PowerPoint Template and Keynote
Circular Diagrams
Premium
-
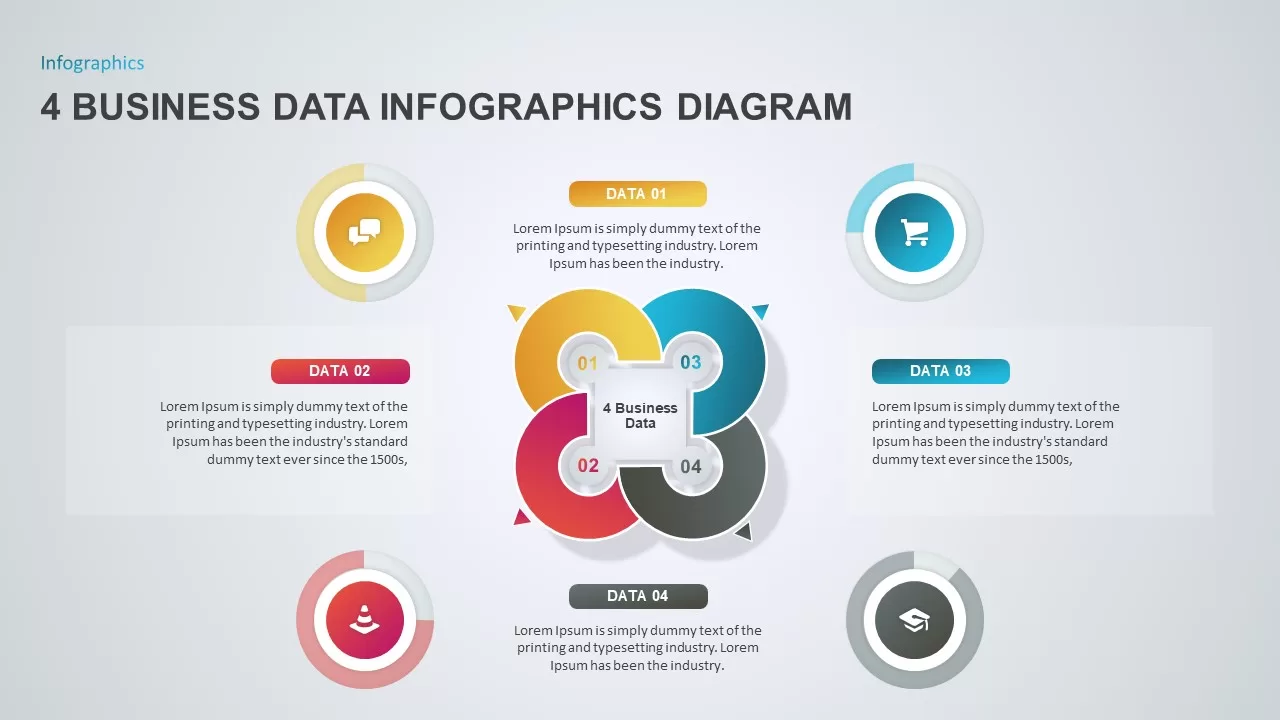
4 Section PowerPoint for Business Data Presentation
Infographic
Premium
-
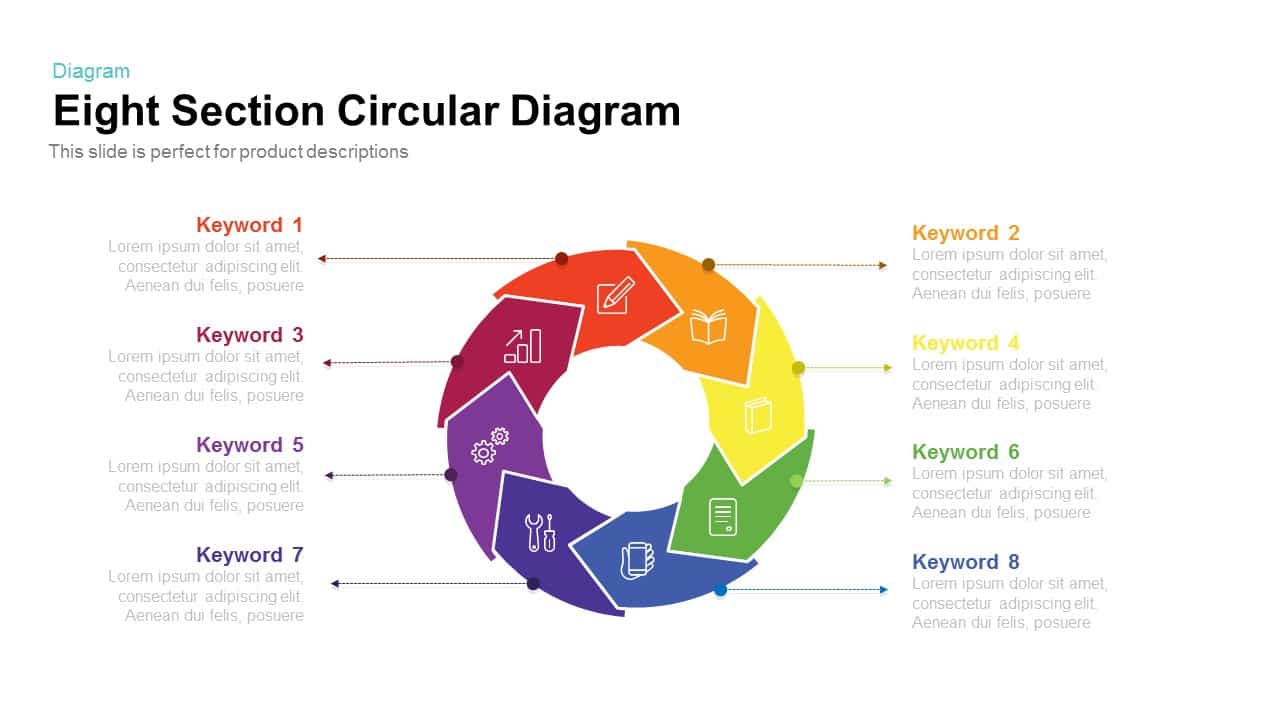
Section Circular Diagram PowerPoint Template and Keynote
Arrow Diagrams
Premium
-
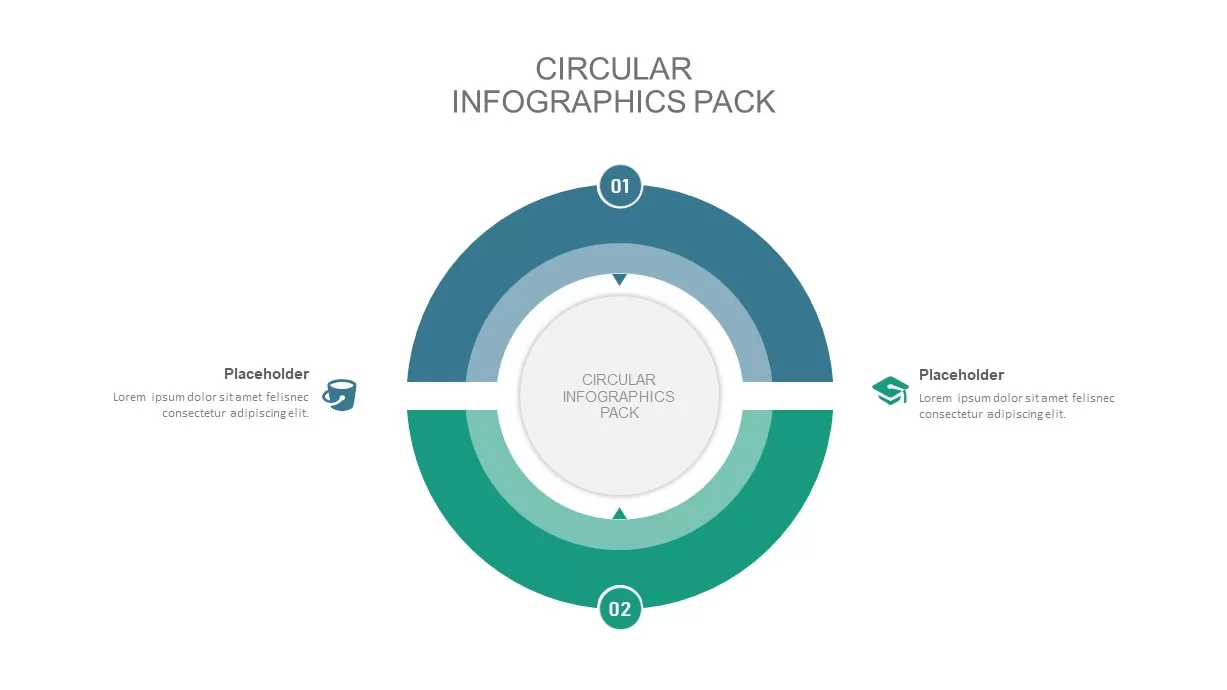
2 – 8 Step Circular Diagram Ppt Template
Circular Diagrams
Premium
-
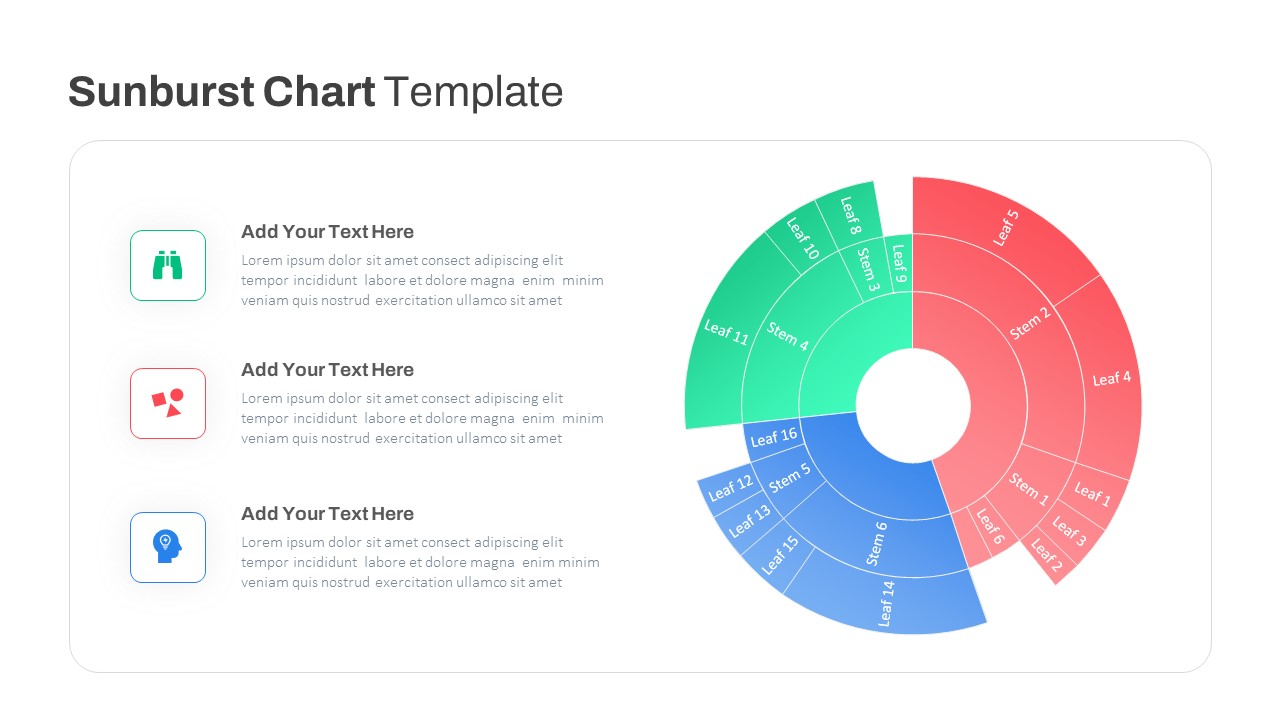
Sun Burst Chart PowerPoint Template
Circular Diagrams
Premium
-
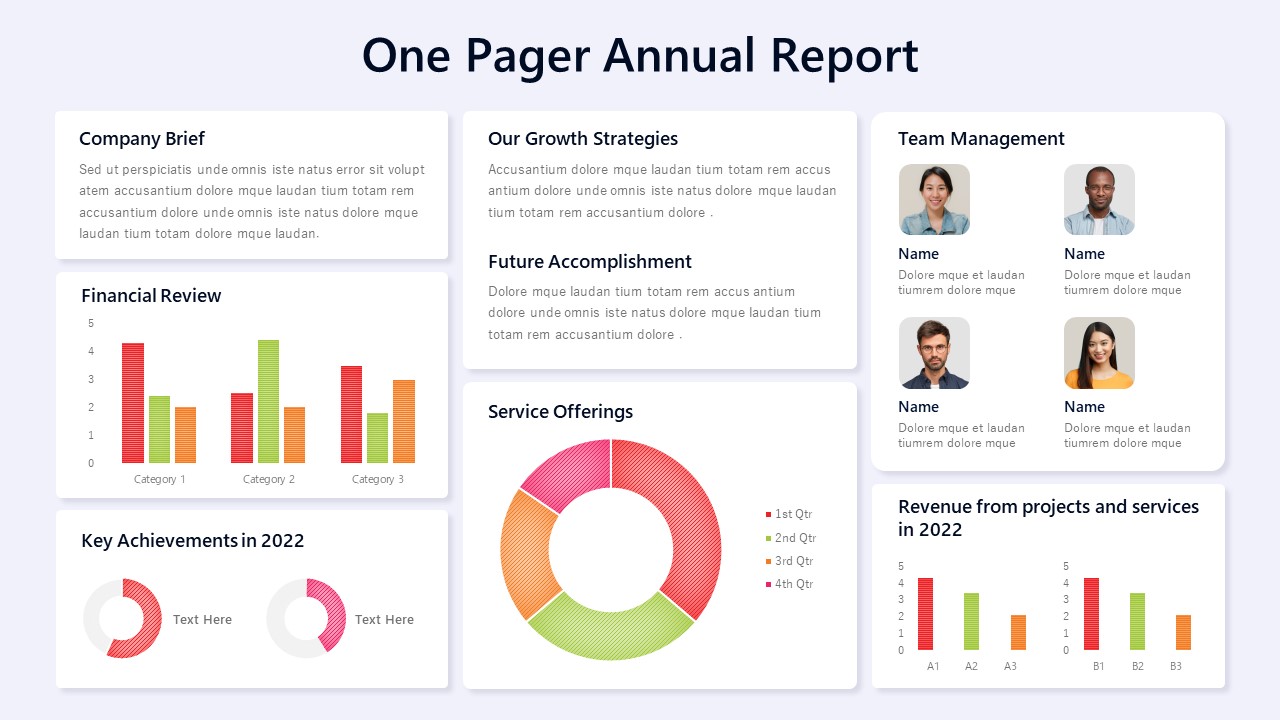
One Pager Annual Report Template
Column and Bar chart
Premium
-
3 to 9 Step Circular Process PowerPoint Templates
Puzzle
Premium
-
3D Circular Process Diagram PowerPoint Template and Keynote Slide Presentation
Circular Diagrams
Premium
-

Multipurpose Business PowerPoint Template
PowerPoint Business Templates
Premium
-
Key Highlights PowerPoint Template Free
Free PowerPoint Templates
Free
-
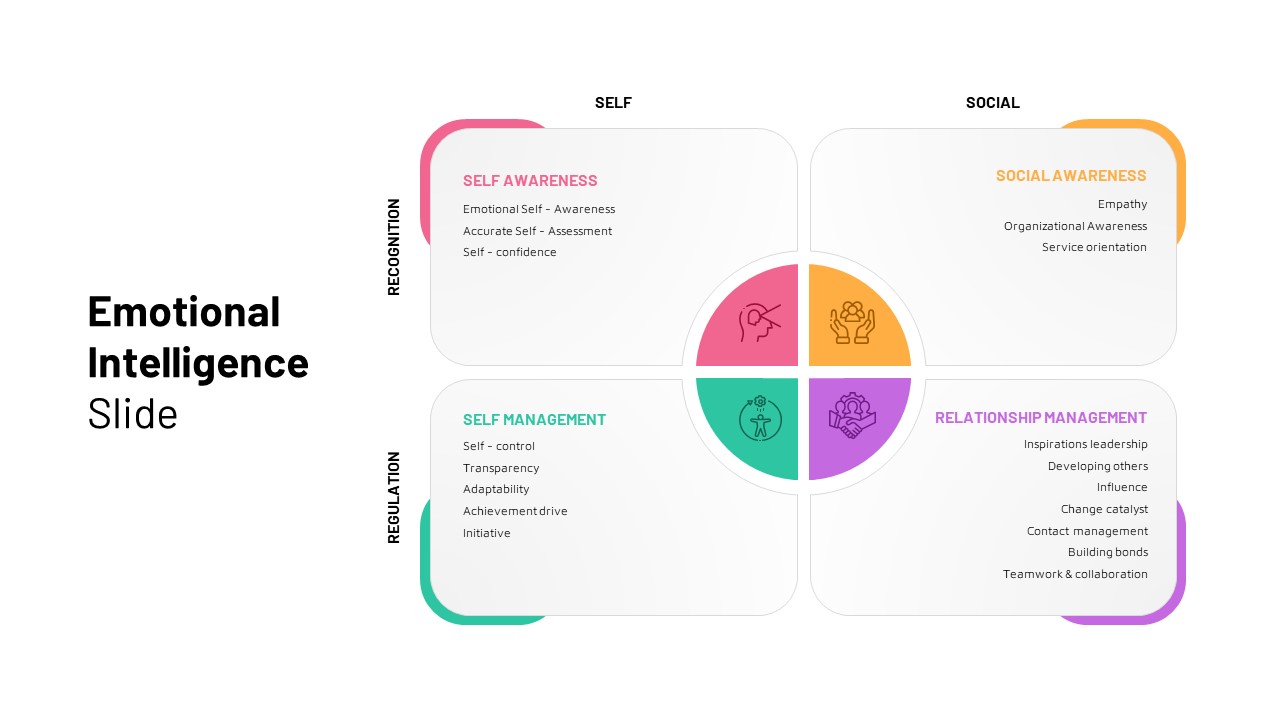
Emotional Intelligence Slide
PowerPoint Templates
Premium