


Growth Curve Line Chart Ppt Template
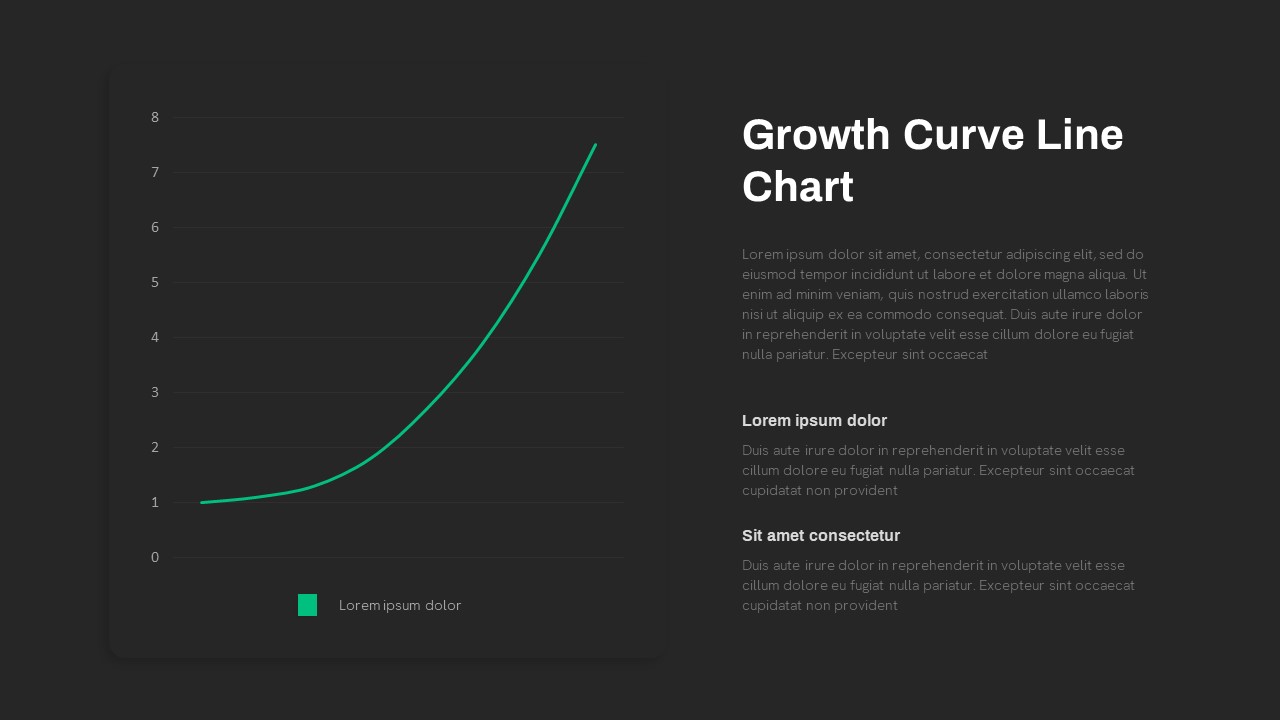
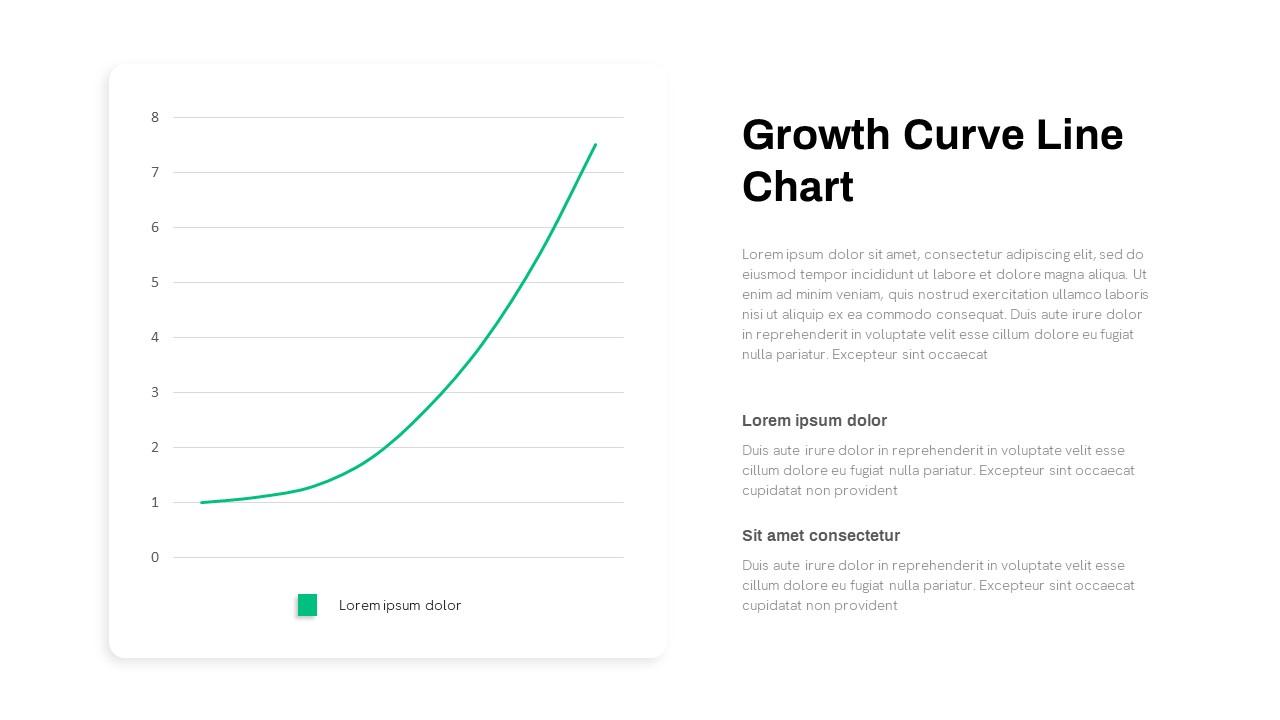
Create quality presentations using the Growth Curve Line Chart PowerPoint template, featuring visually appealing graphics. With its simple color scheme and organized design, this template offers a straightforward and effective way to deliver your message. By reducing the reliance on excessive text, the chart enhances the entertainment value of the presentation, attracting the audience and fostering engagement. It serves as a simple yet comprehensive tool for effectively conveying information. In PowerPoint, a growth curve chart or upward line graph is a powerful tool for visually representing the progressive increase of a statistical value. A classic example of a growth curve is a chart illustrating the population growth of a country over time. Growth curves are extensively employed in statistical analysis to identify and understand patterns of change in various quantities, whether they follow an exponential, linear, or cubic progression. Businesses frequently utilize growth curves to track and predict numerous factors, such as future sales, enabling informed decision-making and strategic planning. The growth curve line chart template is essential for academic and business presentations in PowerPoint. This two-slide PowerPoint presentation features black and white background designs, providing a sleek and professional appearance. Users can easily customize the template by inputting their data, making it versatile for various purposes. For instance, a business professional can effectively showcase the annual growth of sales data by utilizing the upward line chart, highlighting the progress and success of the company's sales performance. The growth curve line chart PowerPoint template is also a valuable tool for educational presentations. Teachers and educators can utilize them to showcase students' academic progress over a semester or academic year. By plotting students' grades or performance scores, educators can identify areas of improvement, recognize trends, and communicate progress to students and parents. The growth curve line chart PowerPoint template is a multifunctional design that aids in visually presenting data, analyzing trends, and making informed decisions in various fields and contexts. Use alternative graphs and chart templates for data presentation.