


Grouped Column Chart PowerPoint Template
- Version
- Download 7
- File Size 0.00 KB
- File Count 1
- Create Date July 19, 2023
- Last Updated July 19, 2023
Grouped Column Chart PowerPoint Template
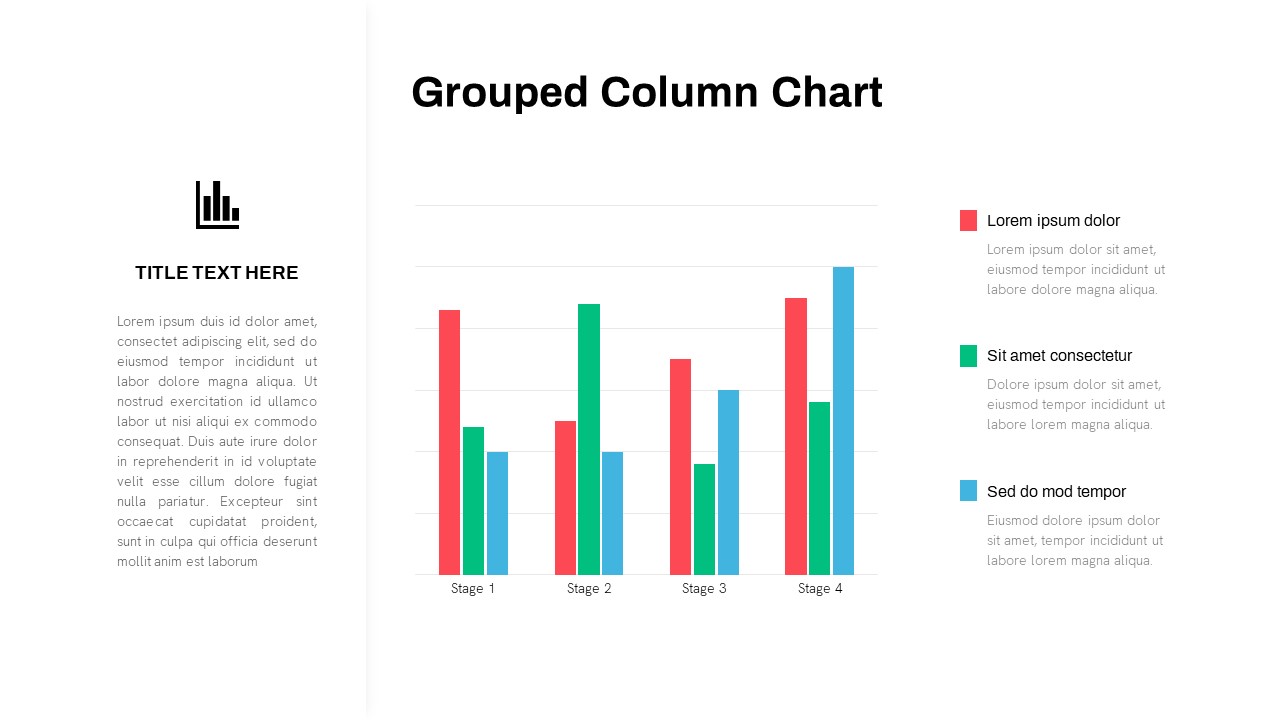
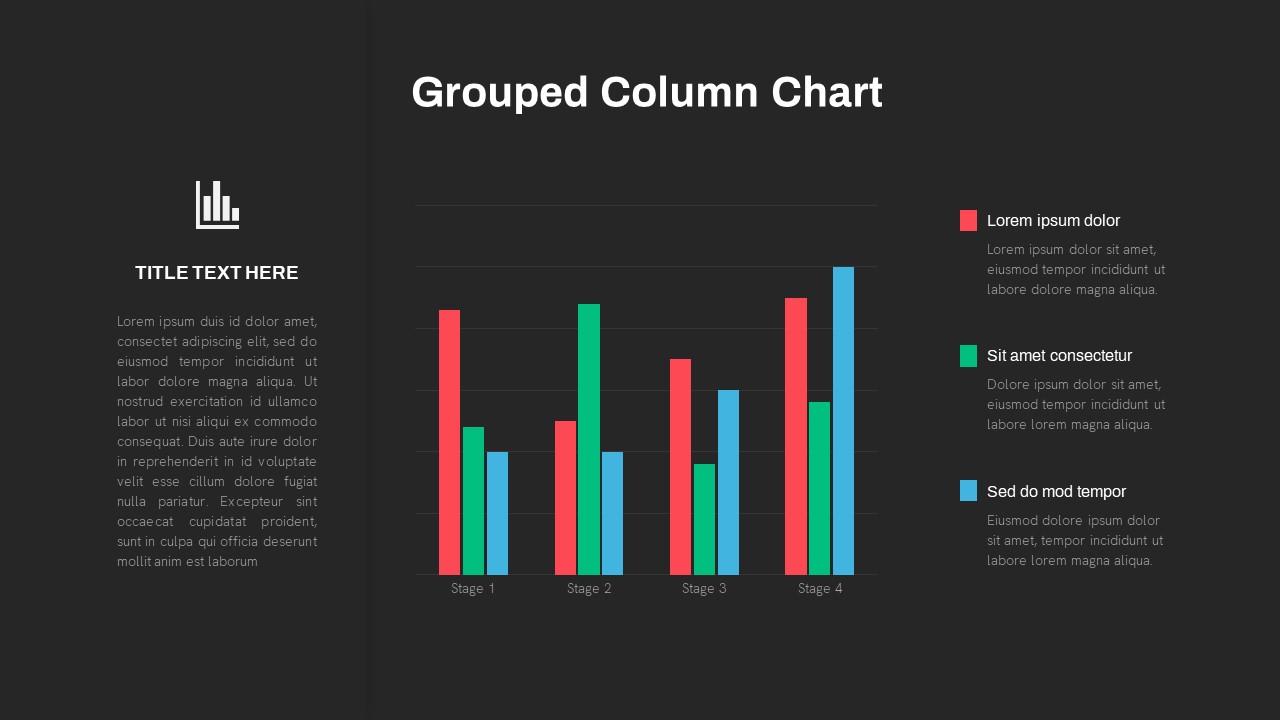
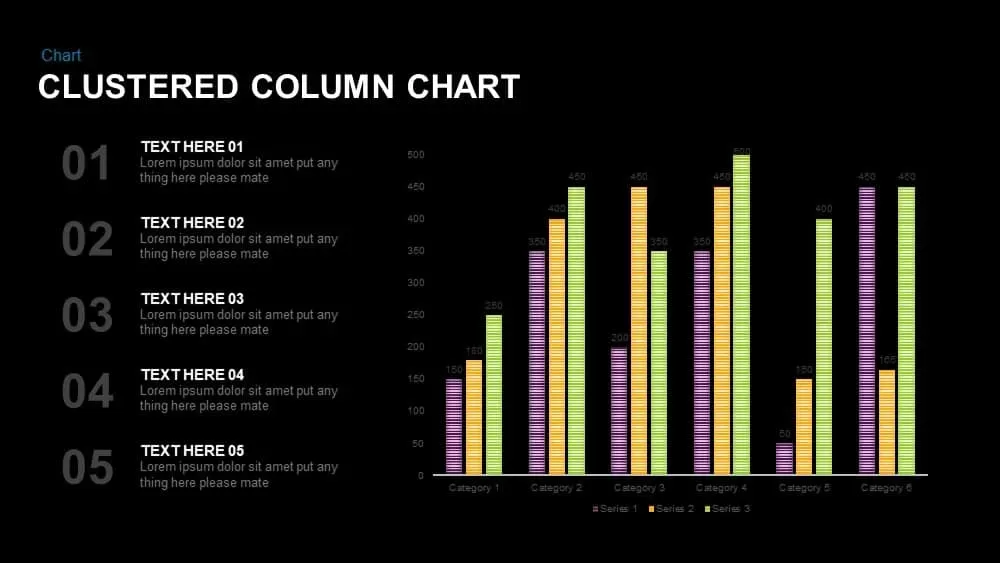
The Grouped Column Chart PowerPoint Template is a visually appealing cluster bar chart that effectively organizes multiple groups of data using vertical bar charts. Its vibrant design captures attention and enhances the overall impression for the audience. This captivating template facilitates easy comprehension of statistical values, promoting efficient information transmission.
Grouped column charts in PowerPoint have several uses:
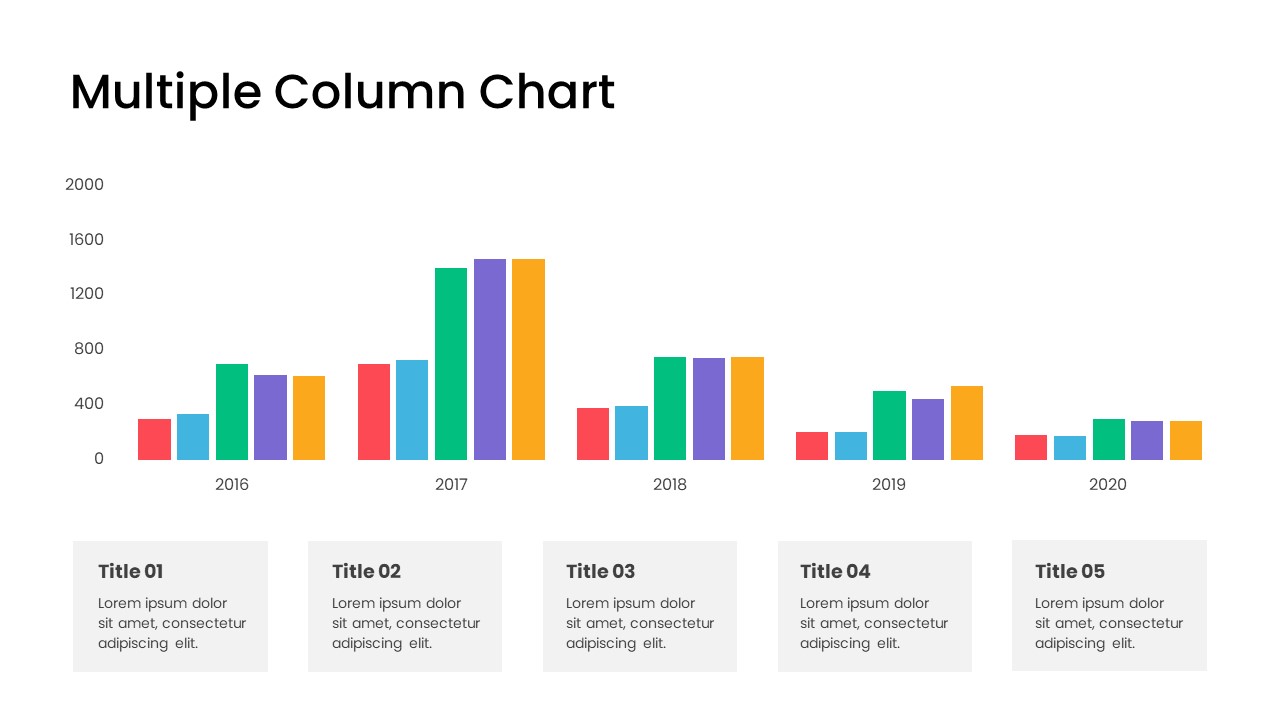
Comparing Multiple Categories: PowerPoint Grouped column charts are useful for visually comparing multiple categories or groups side by side. Each class is represented by a cluster of vertical bars, making comparing the values within and across groups easy.
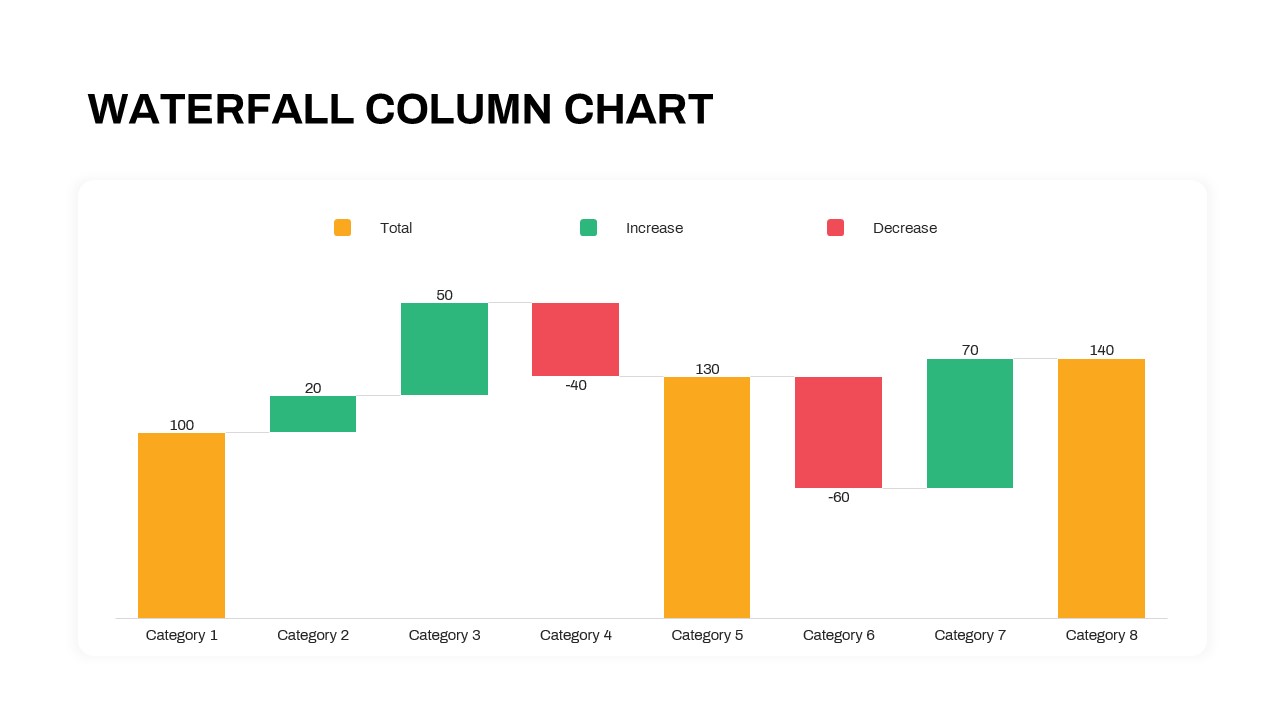
Analyzing Data Trends: Grouped column chart PowerPoint template help analyze data trends over time or across different variables. Organizing the data into clusters allows you to identify patterns, variations, and relationships between categories or groups.
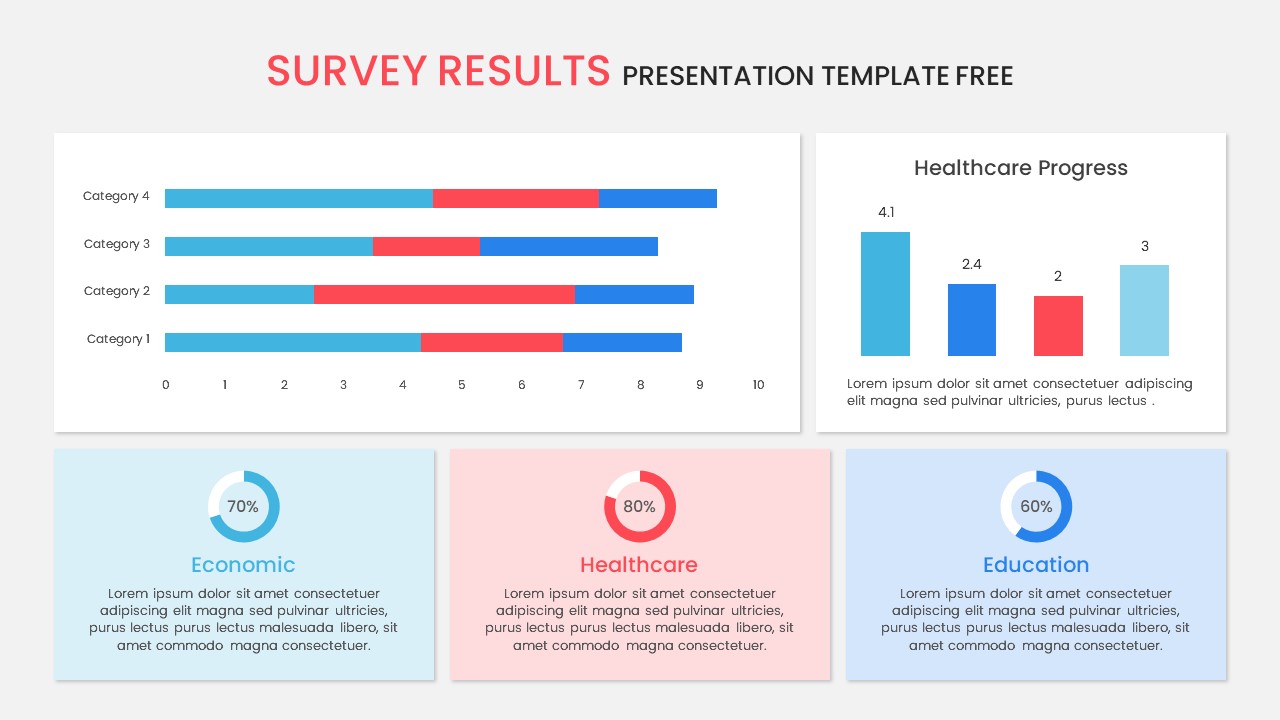
Presenting Survey Results: Grouped column ppt charts are commonly used to show survey results. Each bar in the graph represents a response or category, allowing the audience to understand the distribution and frequency of different reactions quickly.
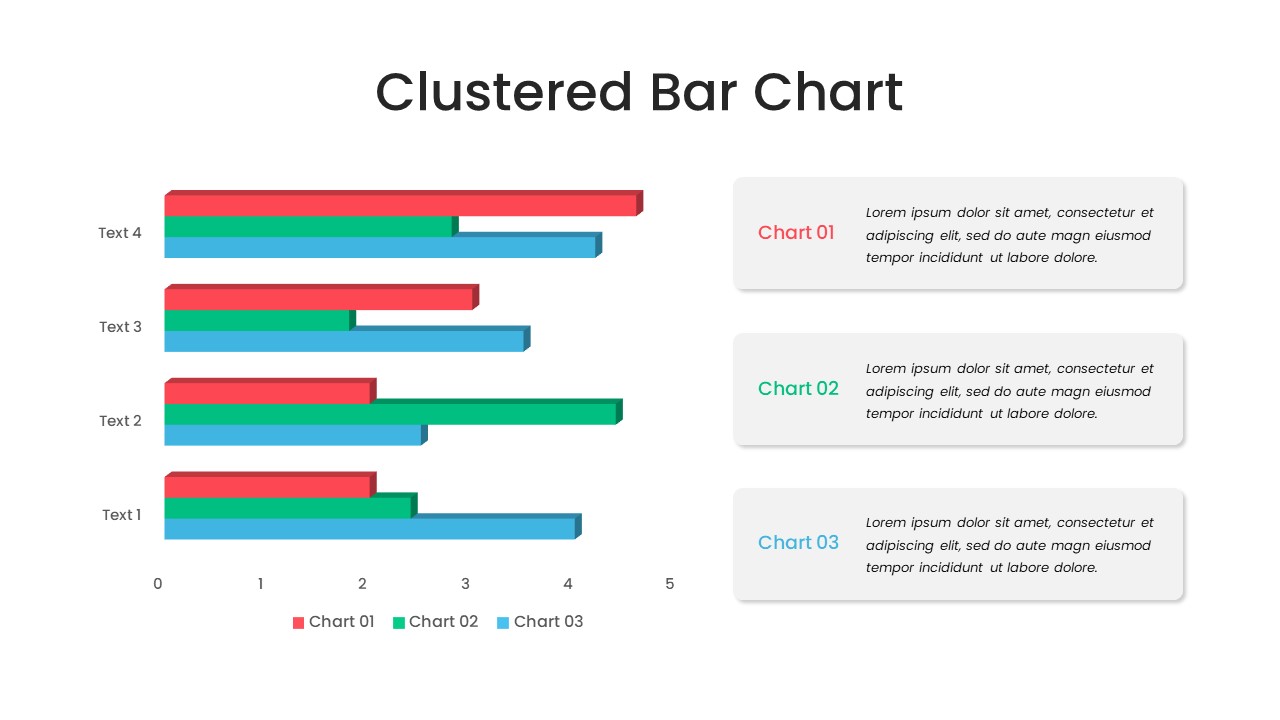
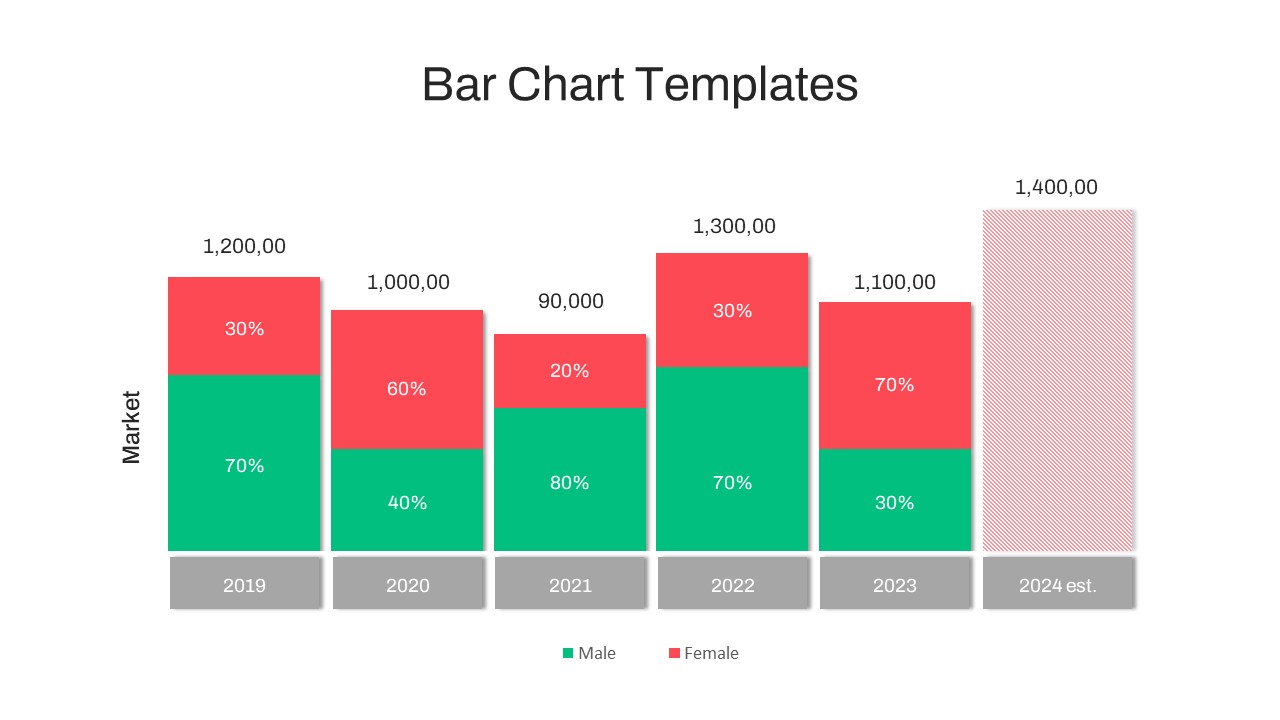
Visualizing Comparative Data: Clustered bar chart PowerPoint templates are effective in visually displaying comparative data, such as market share, sales performance, or demographic information. The chart helps viewers grasp the relative proportions and differences between various categories or groups.
Communicating Complex Data: Grouped column charts simplify complex data sets and make them more easily understandable. Organizing the information into distinct clusters makes it simpler for the audience to interpret and draw conclusions from the data.
The clustered bar chart PowerPoint template provides a clear and concise visual representation of data, facilitating effective communication and analysis. It is an invaluable tool for both businesses and research endeavours. Its utility extends to various business concepts, including reporting and analysis. Within the corporate sector, business research is commonplace, but without a well-defined research team, analysing data can prove challenging. That's where the clustered bar diagram PowerPoint template comes in, offering immense value to corporate research groups and small and medium enterprises. Explore more column and bar chart powerpoint templates.
Attached Files
| File |
|---|
| https://premiumdownloads.s3.amazonaws.com/SB03662-Grouped Column Chart PowerPoint Template.ZIP |
Login to download this file
Add to favorites
Add to collection
-

Item ID
SB03662 -

Related Templates
-

Research Proposal PowerPoint Template
PowerPoint Templates
Premium
-

Free Vertical PowerPoint Template
PowerPoint Business Templates
Free
-

Nature PowerPoint Presentation Template
PowerPoint Business Templates
Premium
-

Gym PowerPoint Template
PowerPoint Templates
Premium
-

Free Nursing Capstone PowerPoint Deck
PowerPoint Templates
Free
-

Sales Deck Free PowerPoint Template
PowerPoint Templates
Free
-

Cab Service PowerPoint Template
PowerPoint Templates
Premium
-

VET Clinic PowerPoint Template
PowerPoint Templates
Premium
-

Free Space Minimal Deck Template
PowerPoint Templates
Free
-

Clustered Column Chart PowerPoint Template
PowerPoint Charts
Premium
-

Travel Agency PowerPoint Template
PowerPoint Templates
Premium
-

Free Physical Education PowerPoint Template Deck
Free PowerPoint Templates
Free
-

IoT Presentation Template
PowerPoint Templates
Premium
-
Clustered Column Chart PowerPoint and Keynote Slide
PowerPoint Charts
Premium
-
Clustered Bar Chart PowerPoint Template
Column and Bar chart
Premium
-

Effective Communication PowerPoint Template
PowerPoint Templates
Premium
-
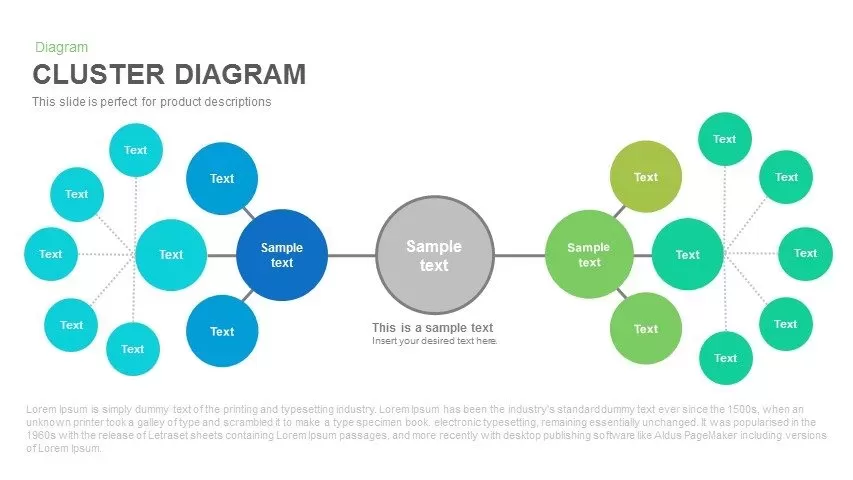
Cluster Diagram PowerPoint Template and Keynote Slide
Diagrams
Premium
-
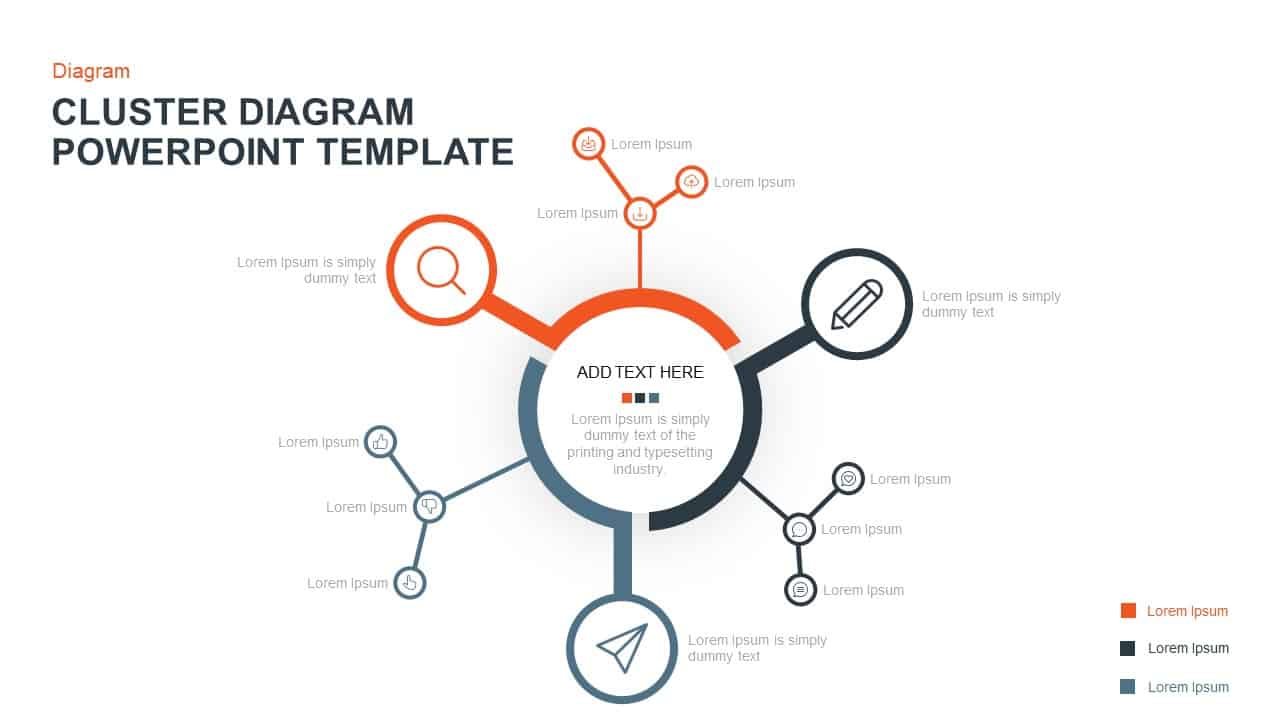
Cluster Diagram Template for PowerPoint and Keynote Presentation
Diagrams
Premium
-

PowerPoint Quiz With Timer
PowerPoint Templates
Premium
-
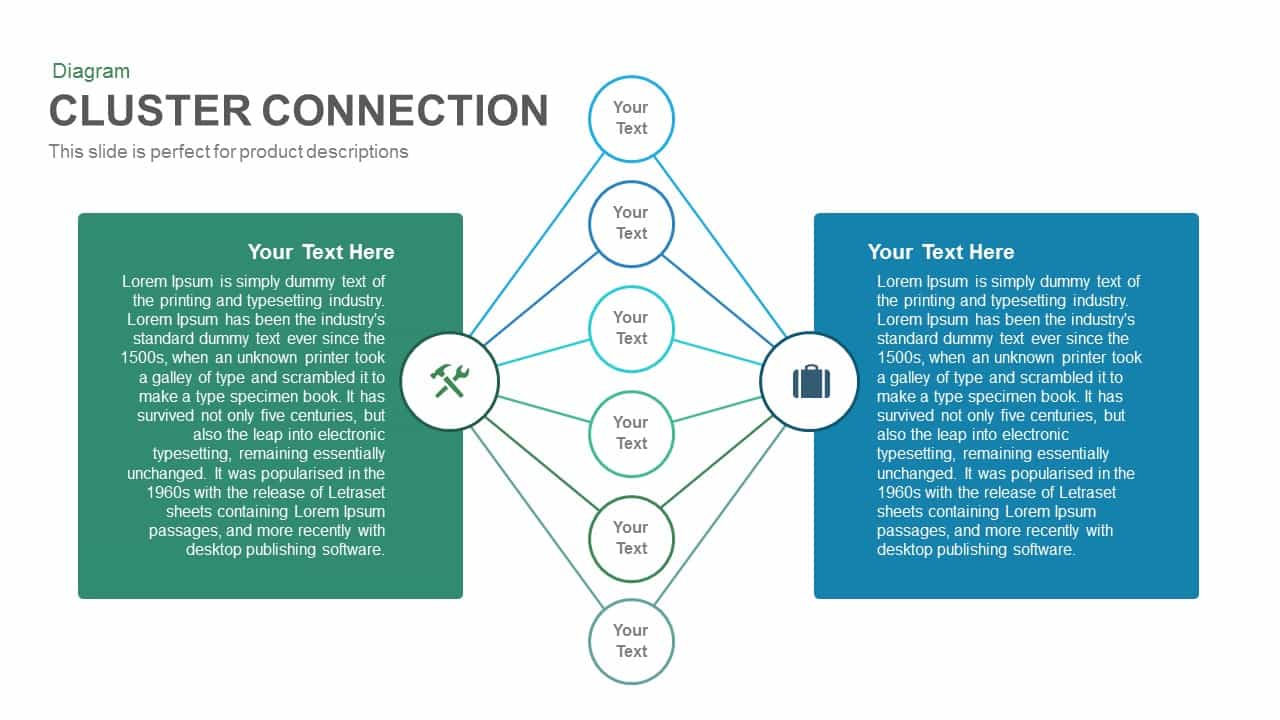
Cluster Connection PowerPoint Template and Keynote
Diagrams
Premium
-

Macroeconomics PowerPoint Template
PowerPoint Templates
Premium
-

Graph Paper PowerPoint Template Deck
PowerPoint Templates
Premium
-

Free Economics PowerPoint Template
Free PowerPoint Templates
Free
-

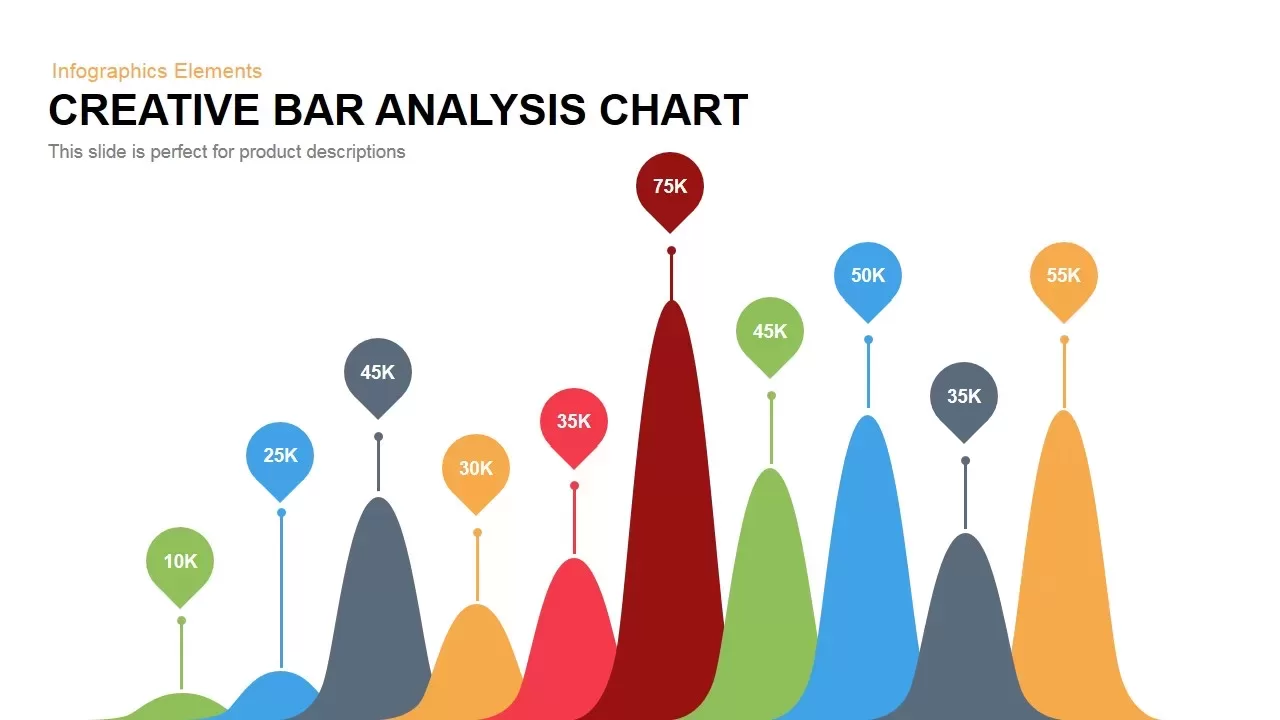
Creative Bar Chart Data Analysis PowerPoint Template and Keynote
Infographic
Premium
-

Free Aviation PowerPoint Template
Free PowerPoint Templates
Free
-

Animated Clustered Bar Chart PowerPoint Template
PowerPoint Charts
Premium
-

Pencil Bar Chart PowerPoint Template and Keynote Slide
Column and Bar chart
Premium
-

Free Charity PowerPoint Template Deck
PowerPoint Templates
Free
-
Cluster Diagram Template for PowerPoint and Keynote
Diagrams
Premium
-

Free Army PowerPoint Template
PowerPoint Templates
Free
-
Cluster Diagram PowerPoint Template & Keynote
Diagrams
Premium
-

Customer Experience Loyalty PowerPoint Deck Template
PowerPoint Templates
Premium
-

Free Cartoon PowerPoint Template
Free PowerPoint Templates
Free
-

Free Real Estate Listing PowerPoint Template
Free PowerPoint Templates
Free
-
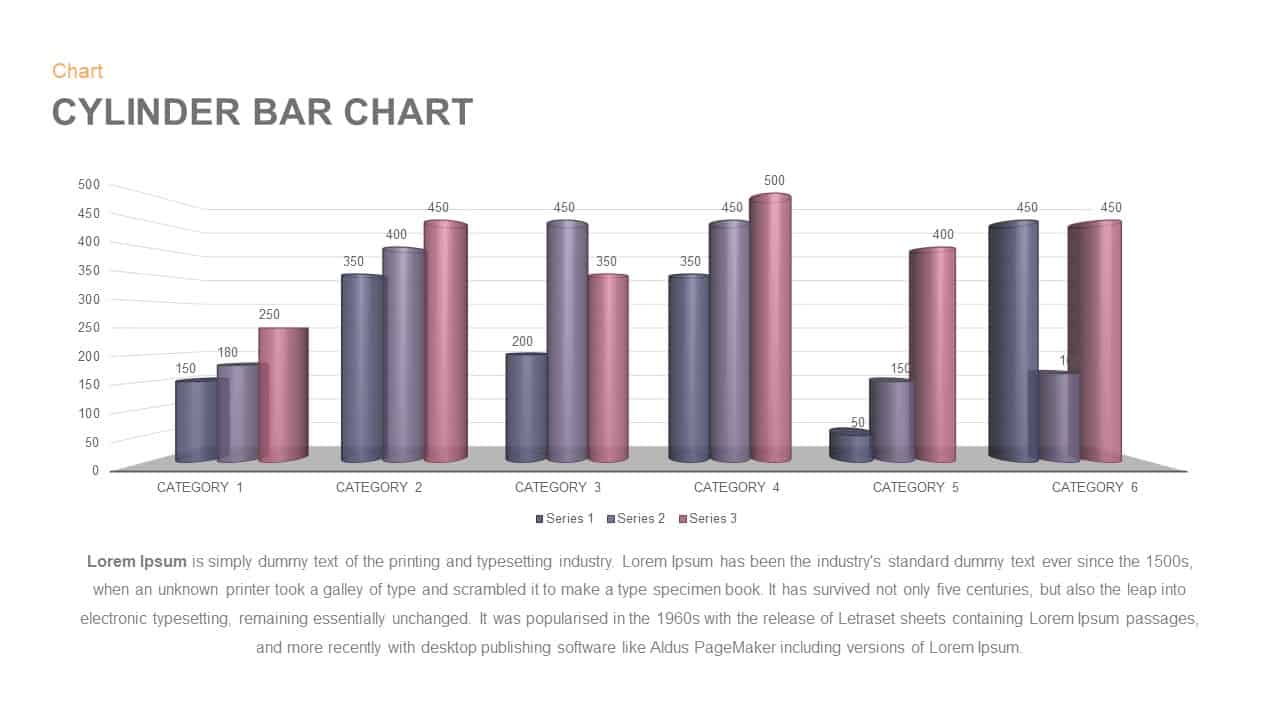
Cylinder Bar Chart PowerPoint Template and Keynote Slide
Column and Bar chart
Premium
-

Annual Report PowerPoint Template and Keynote
PowerPoint Templates
Premium
-

Free University Presentation PowerPoint Template
PowerPoint Templates
Free
-

Free Book Review PowerPoint Template
Free PowerPoint Templates
Free
-
Cluster Diagram PowerPoint Template and Keynote
Business Models
Premium
-

Animated Agriculture PowerPoint Deck Template
PowerPoint Templates
Premium
-

Radial Bar Chart PowerPoint Templates and Keynote Slides
PowerPoint Charts
Premium
-
Cluster Diagram Connection Template for PowerPoint and Keynote
Diagrams
Premium
-
Simple Bar Chart PowerPoint Template
Column and Bar chart
Premium
-

Free Event Planning PowerPoint Template
Free PowerPoint Templates
Free
-

Global Warming Infographic PowerPoint Template Deck
PowerPoint Templates
Premium
-

Data Science PowerPoint Template
PowerPoint Templates
Premium
-
Weekly Data Charts PowerPoint Presentation Template and Keynote Slide
Infographic
Premium
-
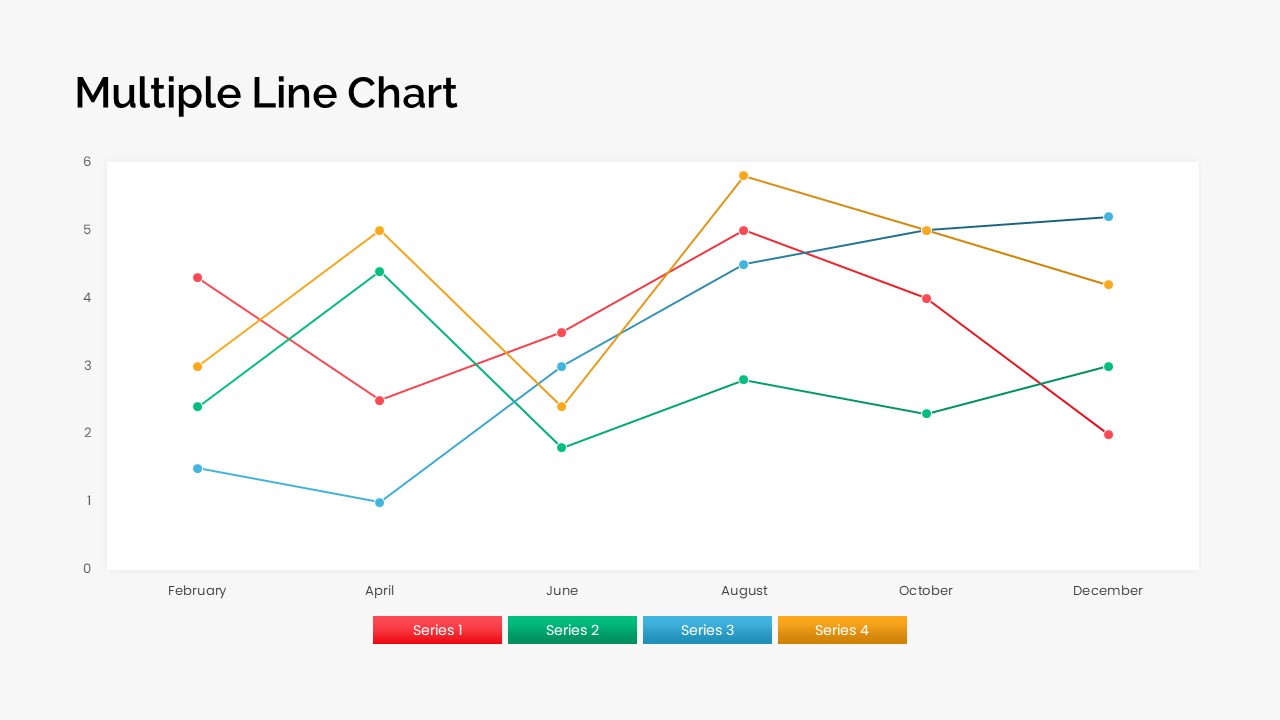
Multiple Line Chart PowerPoint Template
PowerPoint Charts
Premium
-
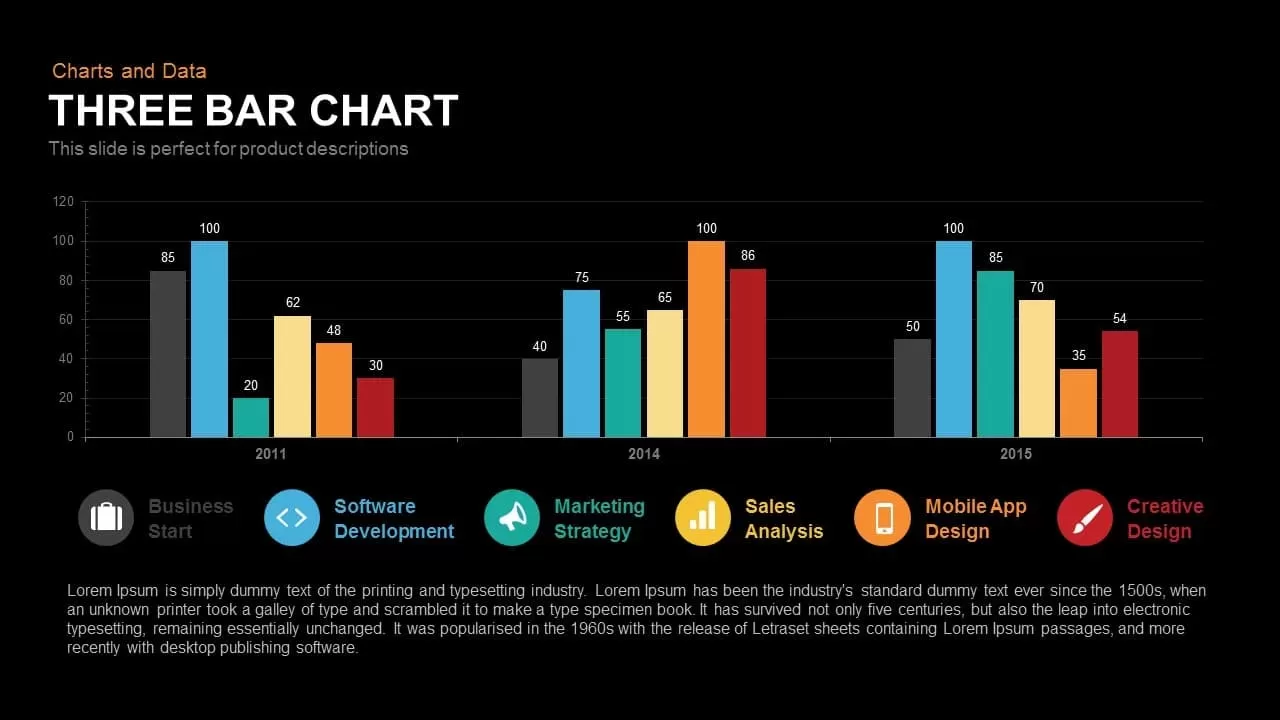
3 Bar Chart PowerPoint Template and Keynote Slide
Column and Bar chart
Premium
-
Free Charts & Graphs Deck PowerPoint Template
PowerPoint Templates
Free
-

EFQM Model PowerPoint Template
PowerPoint Templates
Premium
-

Free Dunder Mifflin Paper Company Pitch Deck
Free PowerPoint Templates
Free
-

Real Estate PowerPoint Theme
PowerPoint Themes
Premium
-
Creative Bar Chart Analysis PowerPoint Template and Keynote
Column and Bar chart
Premium
-
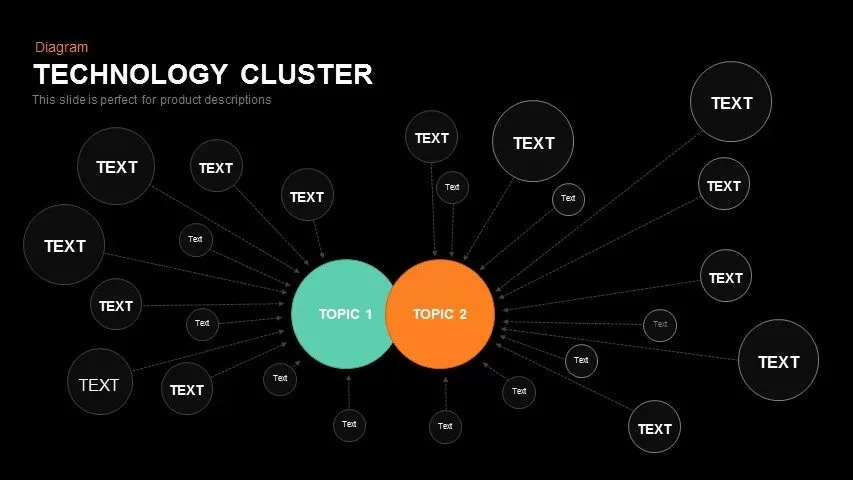
Technology Cluster PowerPoint and Keynote Template
Diagrams
Premium
-

Mekko Chart Template
PowerPoint Templates
Premium
-
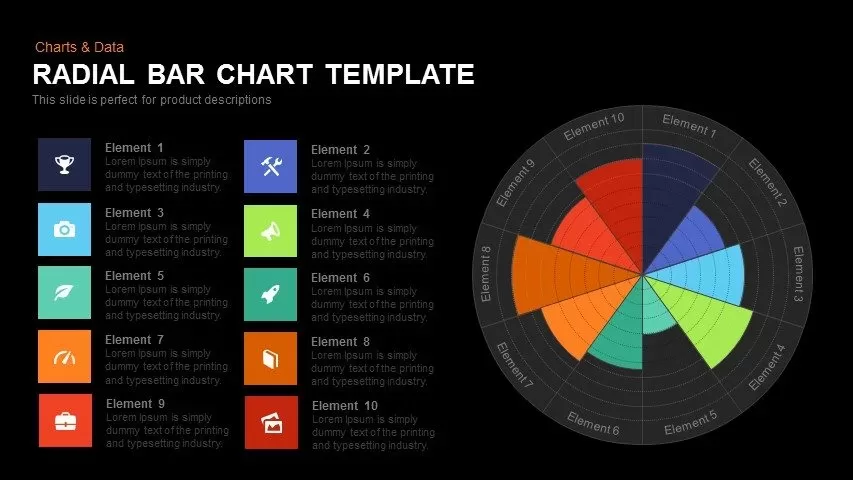
Radial Bar Chart Template for PowerPoint and Keynote
Circular Diagrams
Premium
-

Biotechnology PowerPoint Presentation Template
PowerPoint Templates
Premium
-

Combination Chart PowerPoint Template
PowerPoint Charts
Premium
-
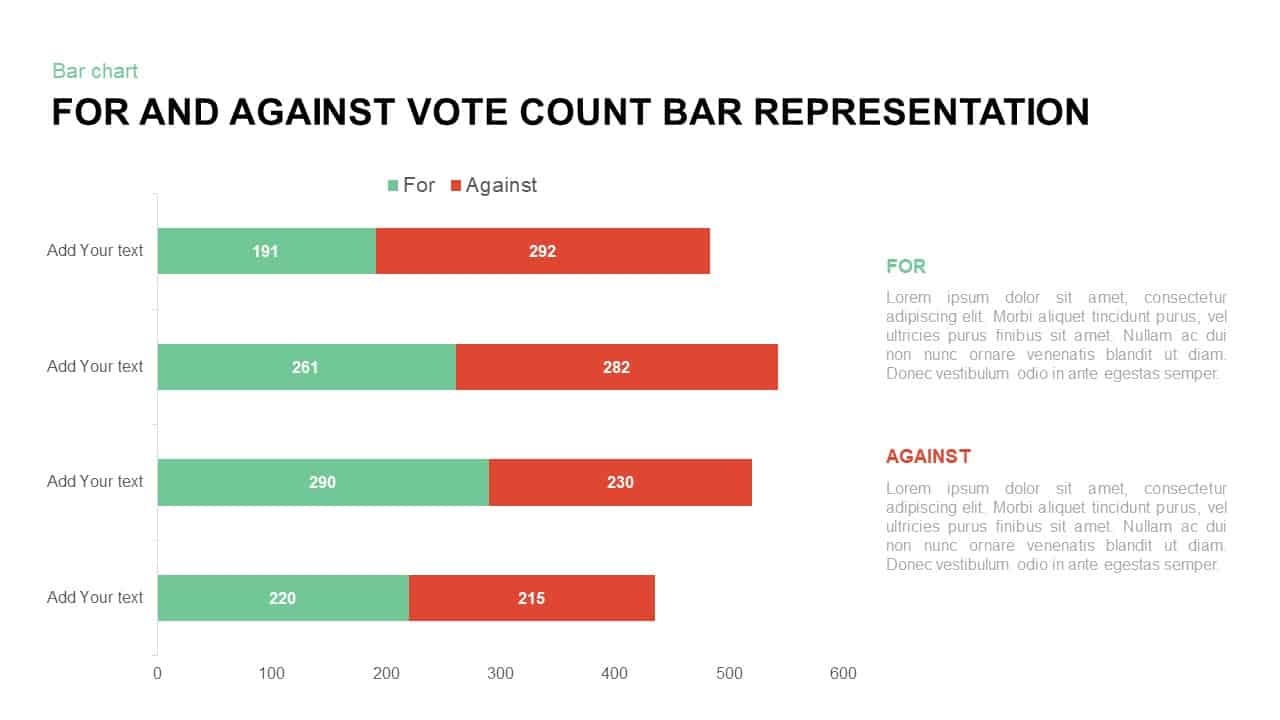
For and Against Vote Count Bar Chart for PowerPoint Presentation
Column and Bar chart
Premium
-

Free AI Artificial Intelligence PowerPoint Template
PowerPoint Templates
Free
-

Area Chart PowerPoint Template
PowerPoint Charts
Premium
-

Stakeholder Register PowerPoint Template
PowerPoint Templates
Premium
-
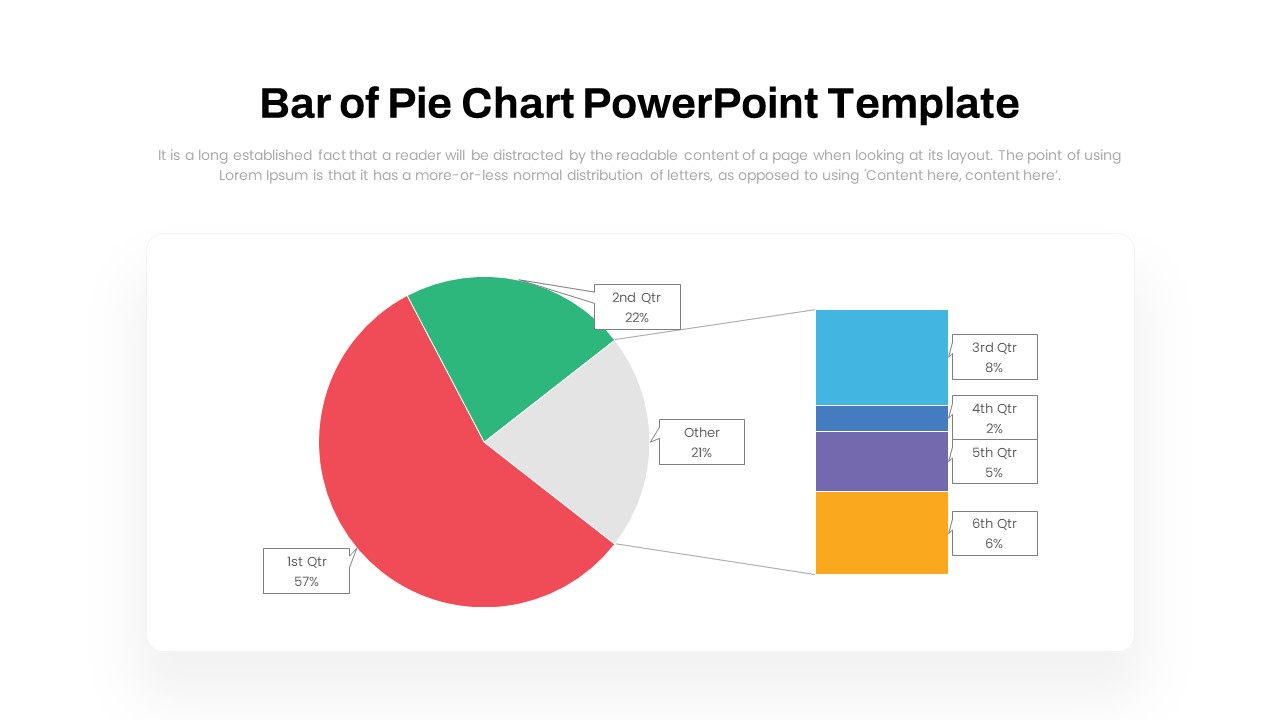
Bar of Pie Chart PowerPoint Template
PowerPoint Templates
Premium
-
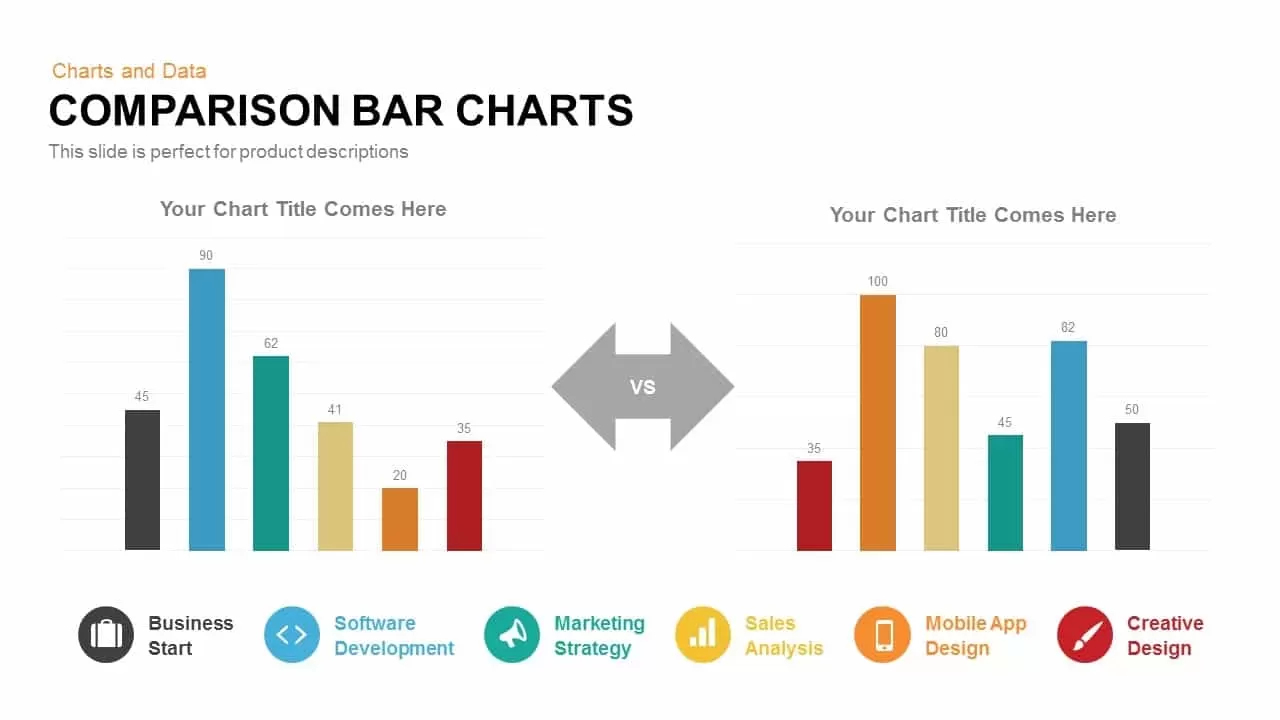
Comparison Bar Charts PowerPoint Template and Keynote Slide
Column and Bar chart
Premium
-
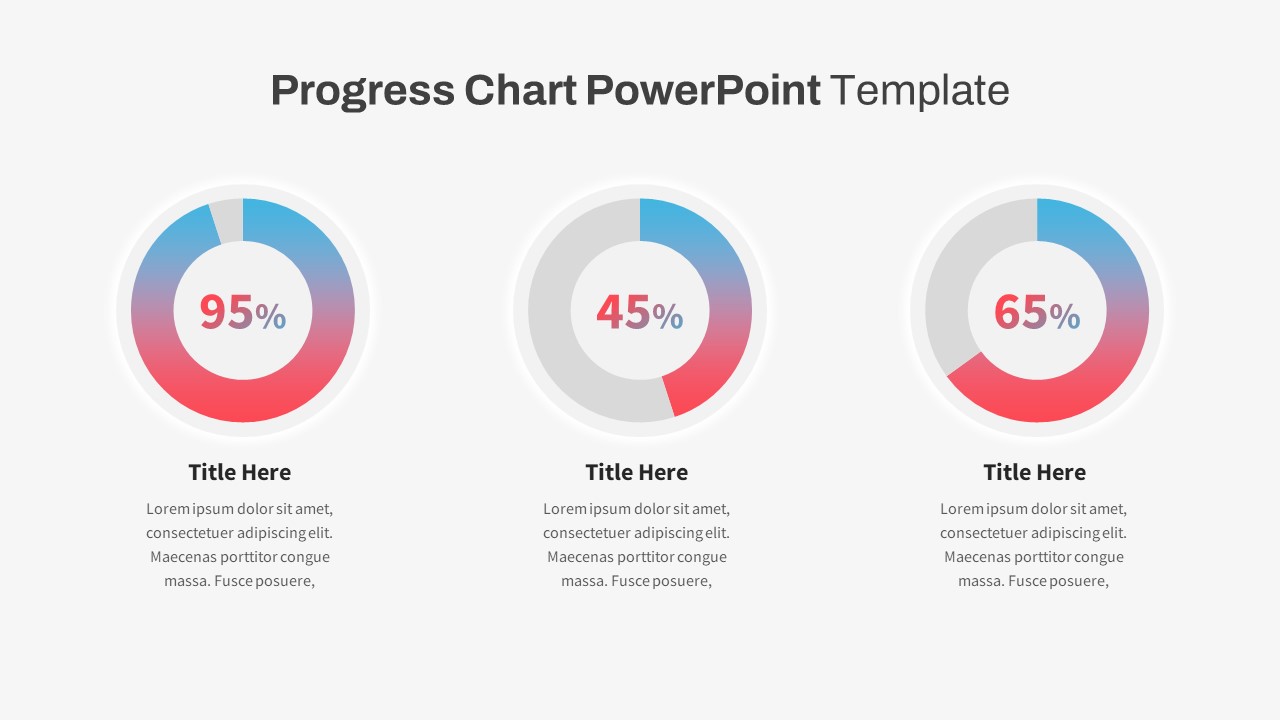
Progress Chart PowerPoint Template
PowerPoint Templates
Premium
-
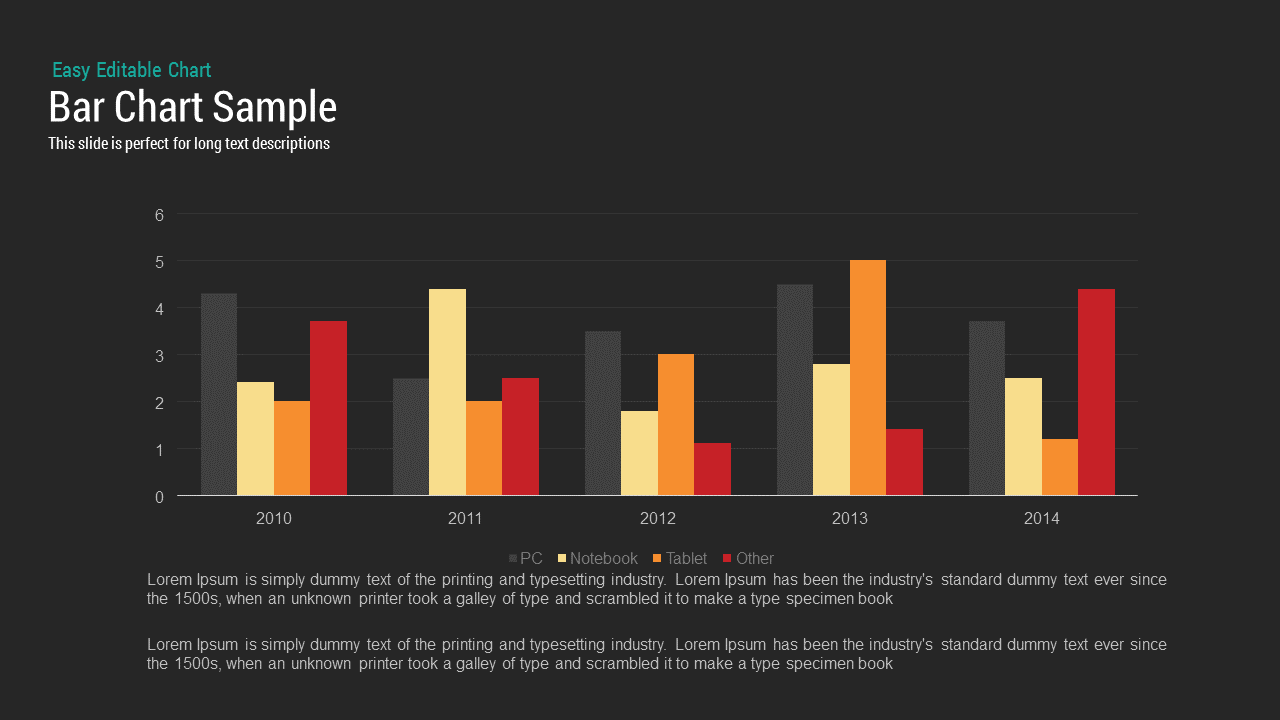
Sample Bar Chart Template for PowerPoint and Keynote Presentation
Column and Bar chart
Premium
-

Free Charts and Graphs PowerPoint Template
PowerPoint Templates
Free
-
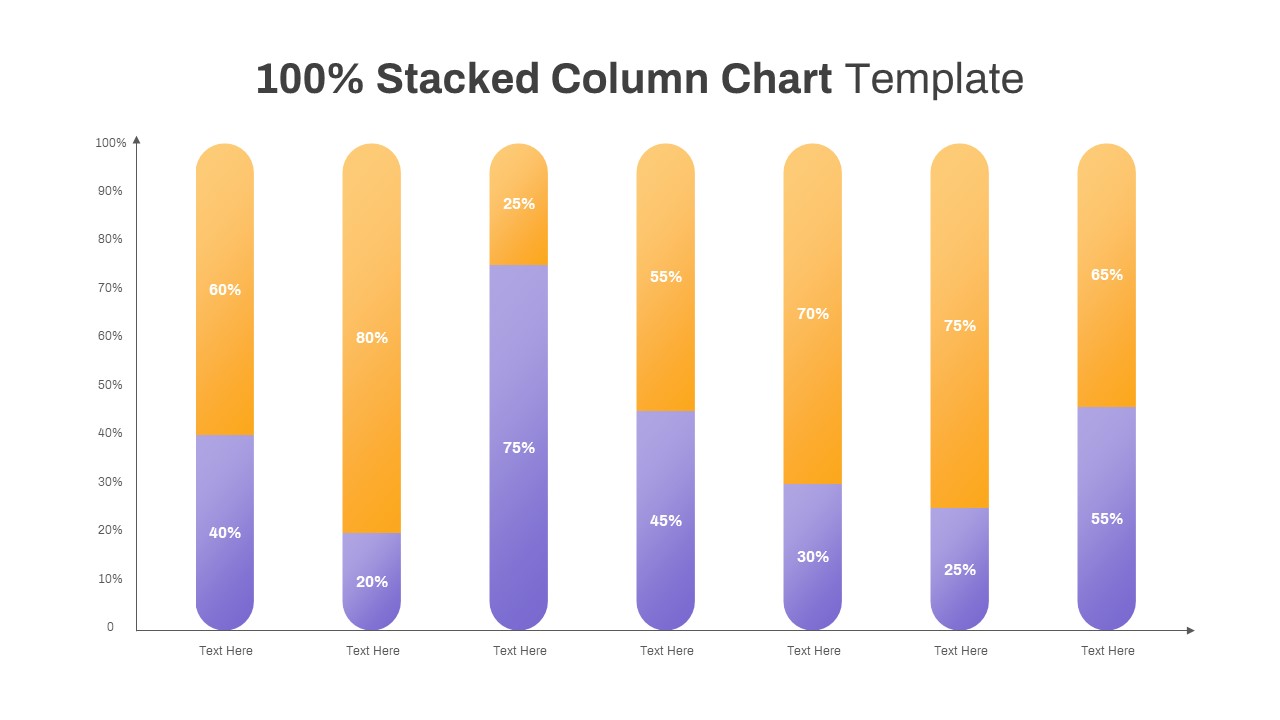
100% Stacked Column Chart PowerPoint Template
Column and Bar chart
Premium
-
Research Roadmap PowerPoint Template
PowerPoint Templates
Premium
-
Data Driven Line Chart Template for PowerPoint & Keynote
Curves and Lines
Premium
-
Free Stacked Column Chart Template
Column and Bar chart
Free
-
Comparison Donut Chart PowerPoint Template and Keynote
Keynote Templates
Premium
-
Waterfall Column Chart PowerPoint Template
Column and Bar chart
Premium
-

Business Process Reengineering Template
PowerPoint Templates
Premium
-
Multiple Column Chart PowerPoint Template
Column and Bar chart
Premium
-
Timeline Bar Chart PowerPoint
Column and Bar chart
Premium
-
Survey Results PowerPoint Template Free
Free PowerPoint Templates
Free
-
Data Bar Chart Template for PowerPoint and Keynote
Column and Bar chart
Premium
-
3D Cylinder Bar Chart PowerPoint Template and Keynote Slide
Column and Bar chart
Premium
-

Animated Upcoming Event Poster PowerPoint Template
PowerPoint Templates
Premium
-
Vertical Dot Chart PowerPoint Template
PowerPoint Charts
Premium
-
Product Comparison Bar Chart Template for PowerPoint and Keynote
PowerPoint Charts
Premium
-
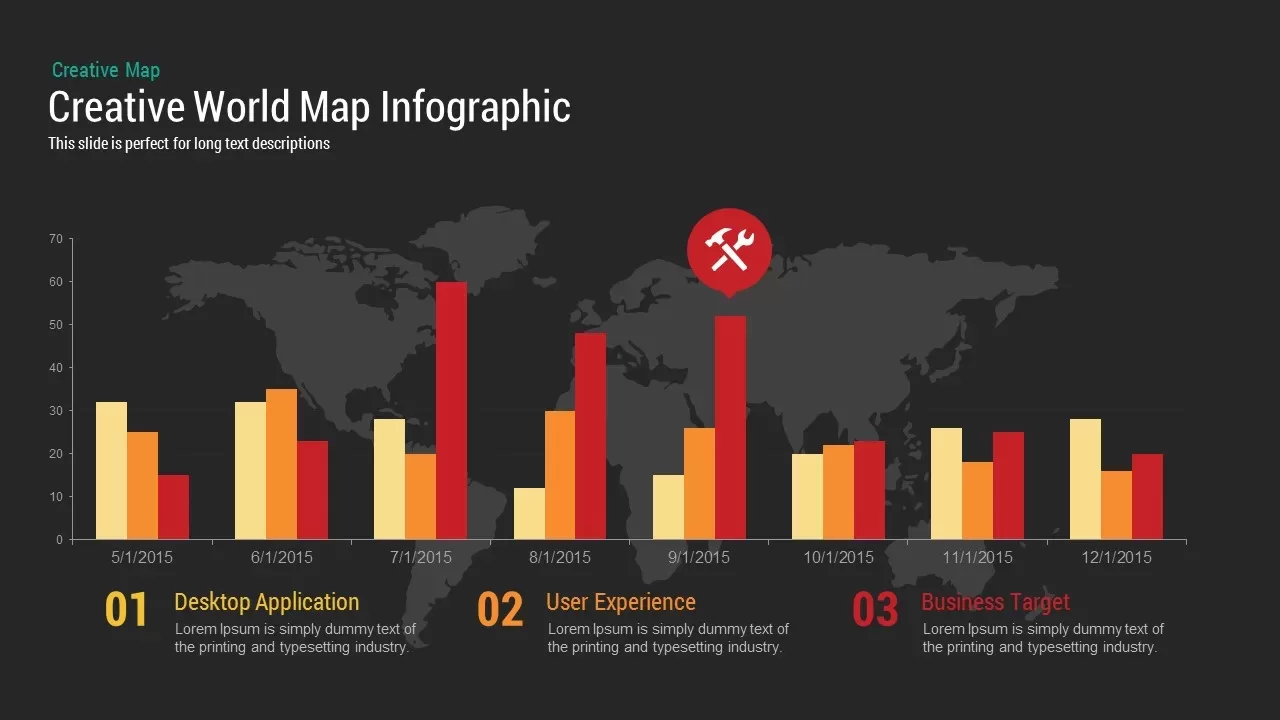
World Map Infographic PowerPoint Template and Keynote Slide
PowerPoint Charts
Premium
-
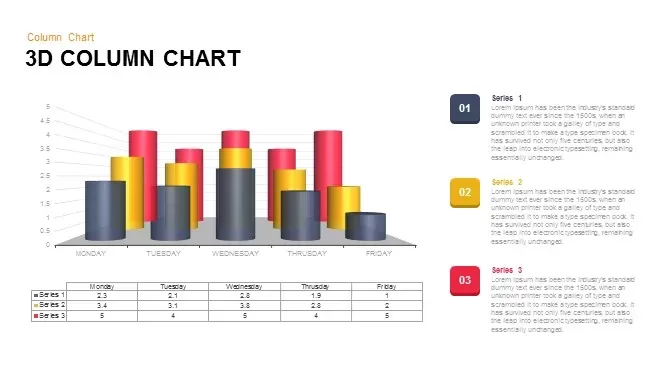
3D Column Chart for PowerPoint and Keynote Presentation
PowerPoint Charts
Premium
-
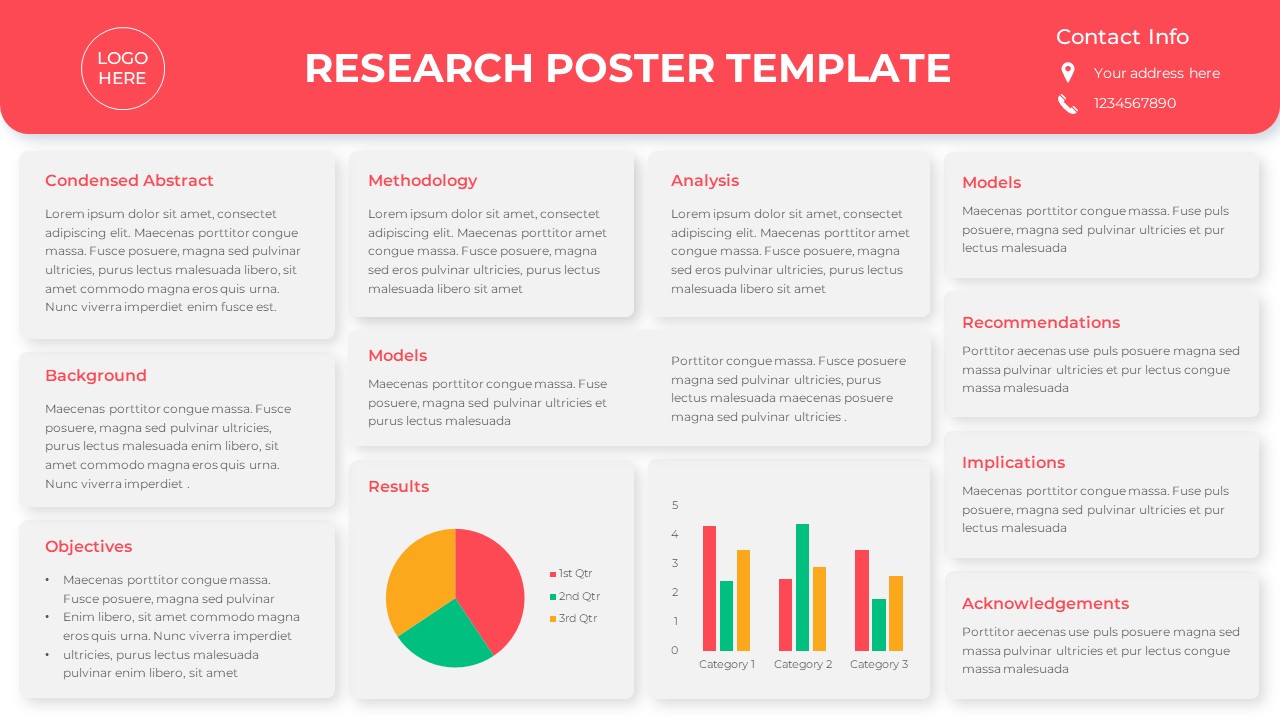
Free PowerPoint Research Poster Template
PowerPoint Templates
Free
-
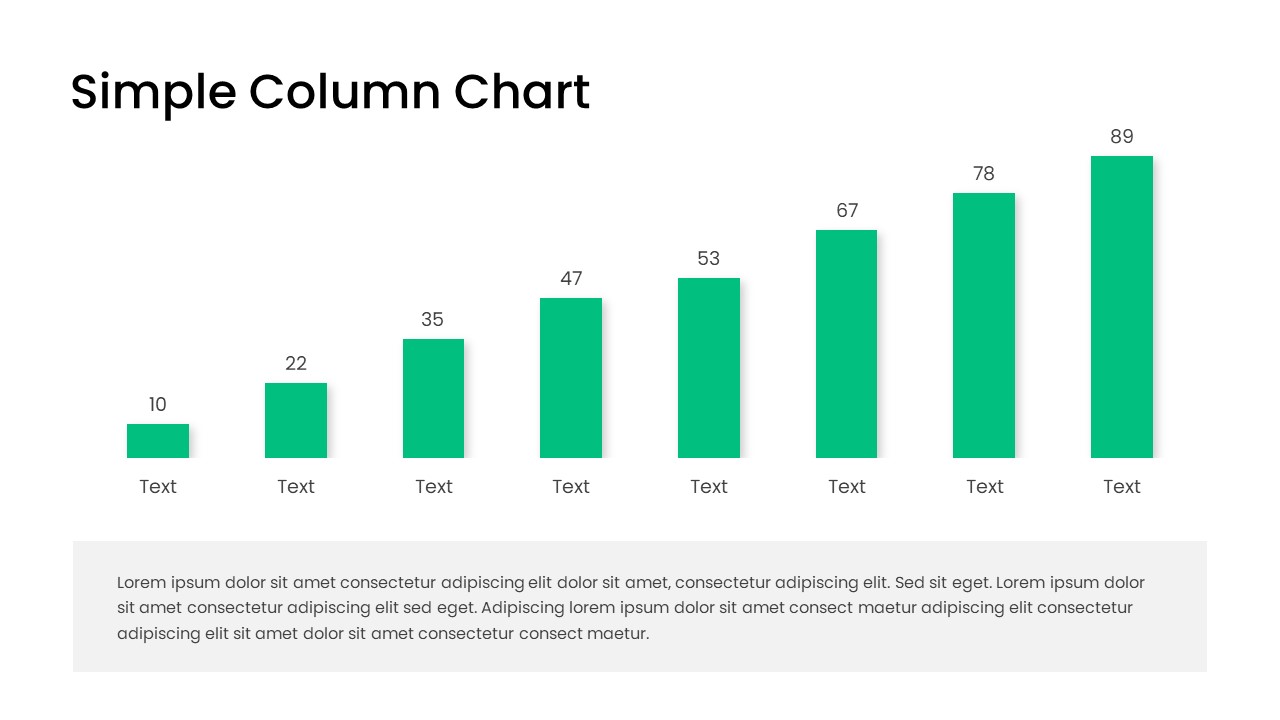
Free Simple Column Chart PowerPoint Template
Column and Bar chart
Free
-

Finance Consulting PowerPoint Template
PowerPoint Templates
Premium
-
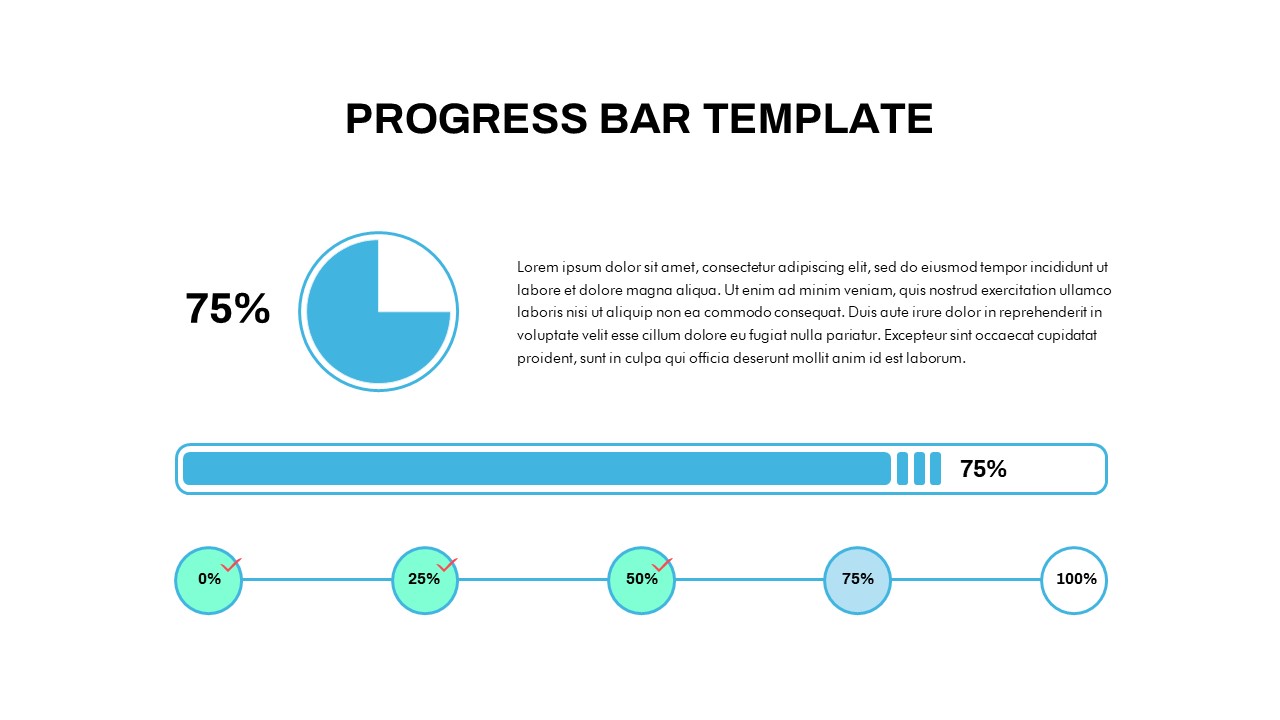
Progress Bar Chart PowerPoint Template
PowerPoint Templates
Premium
-
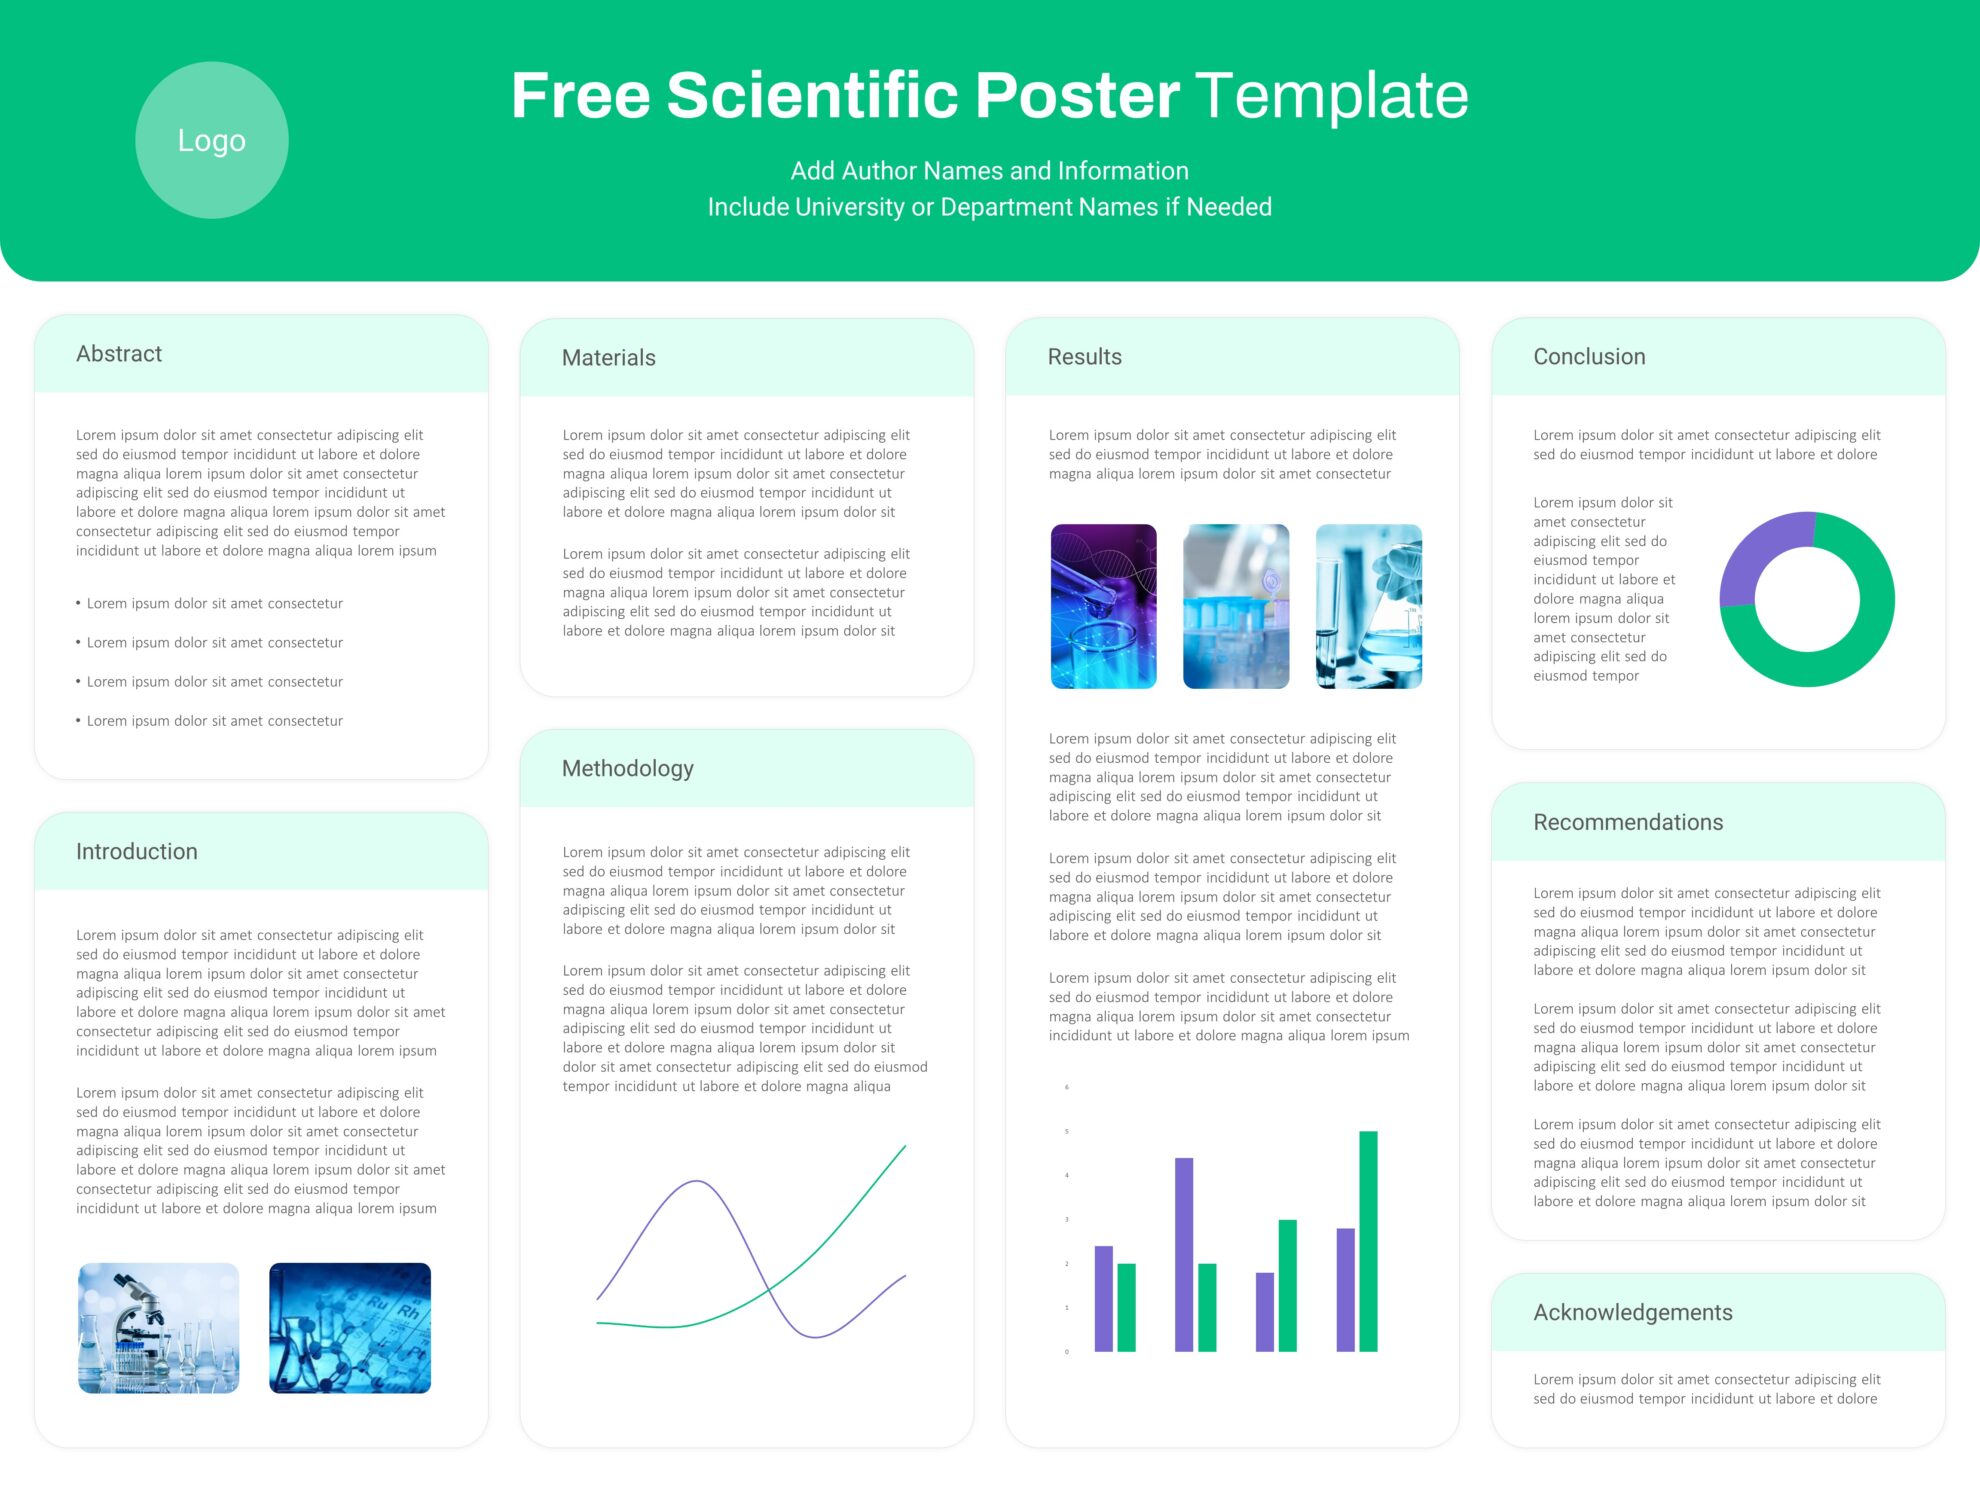
Free Scientific Poster PowerPoint Template
Free slides
Free
-

Open Door Policy PowerPoint Template
PowerPoint Templates
Premium
-
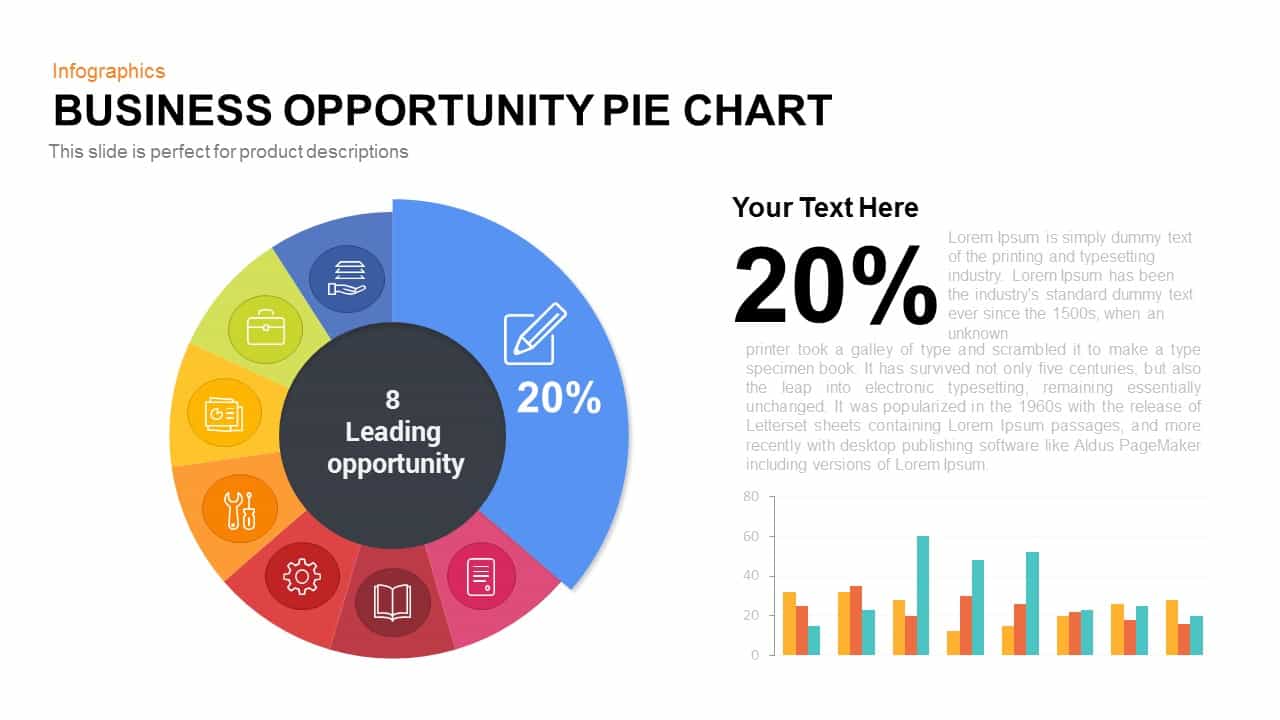
Business Opportunity PowerPoint Pie-Chart Template
Business Models
Premium
-

Research PowerPoint Template and Metaphor Keynote Template
Keynote Templates
Premium
-

Proportional Area Chart PowerPoint Template
PowerPoint Templates
Premium
-
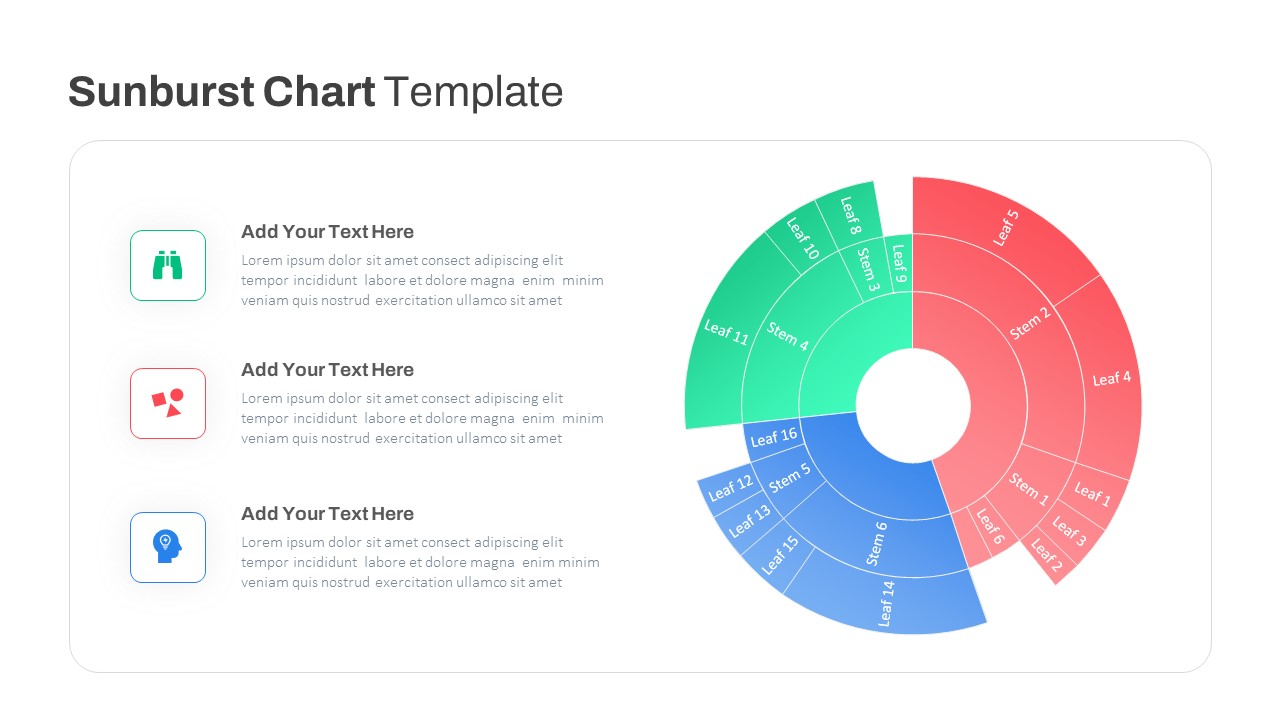
Sun Burst Chart PowerPoint Template
Circular Diagrams
Premium
-

Research Presentation PowerPoint Template Free
PowerPoint Templates
Free
-
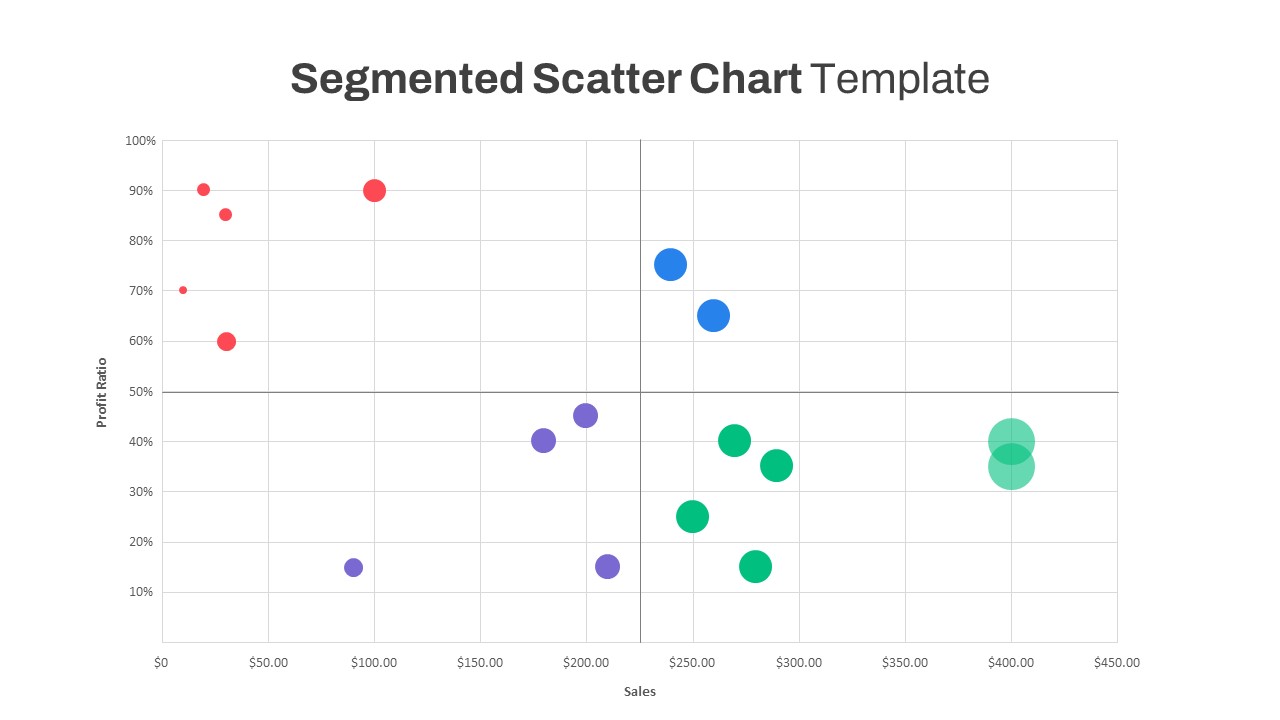
Segmented Scatter Chart PowerPoint Template
PowerPoint Charts
Premium
-
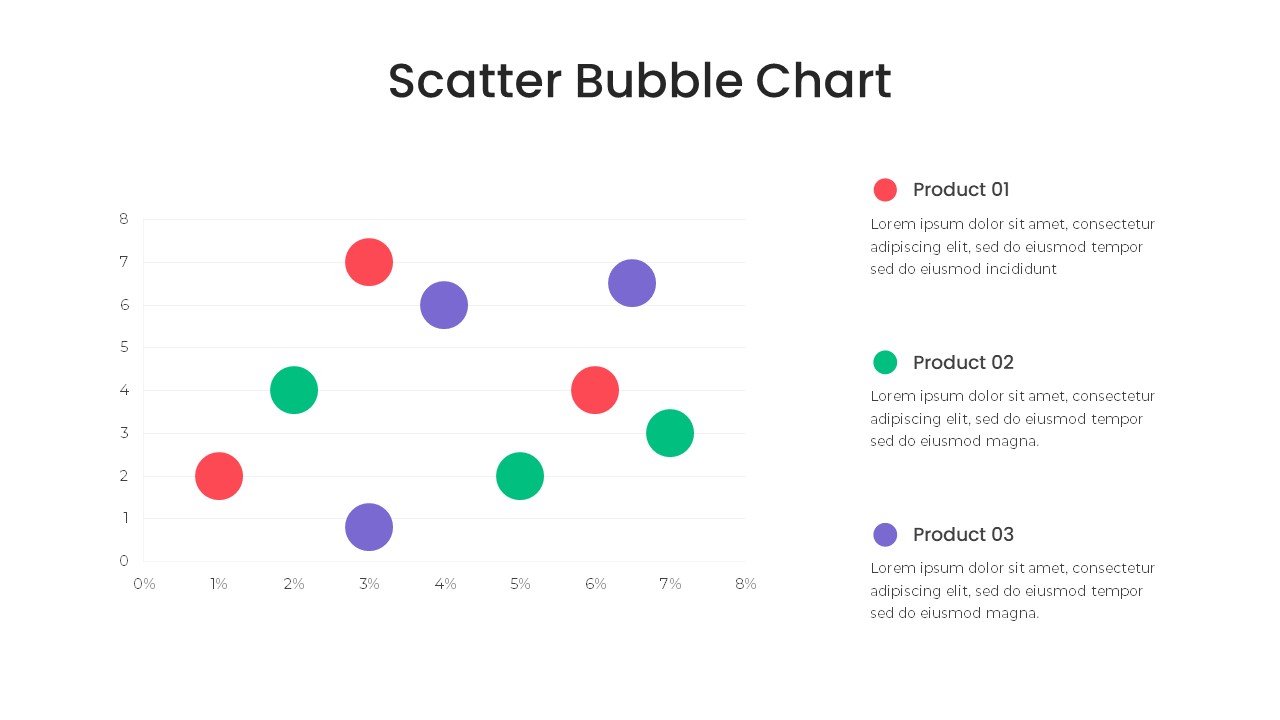
Bubble Chart PowerPoint Template
PowerPoint Templates
Premium
-
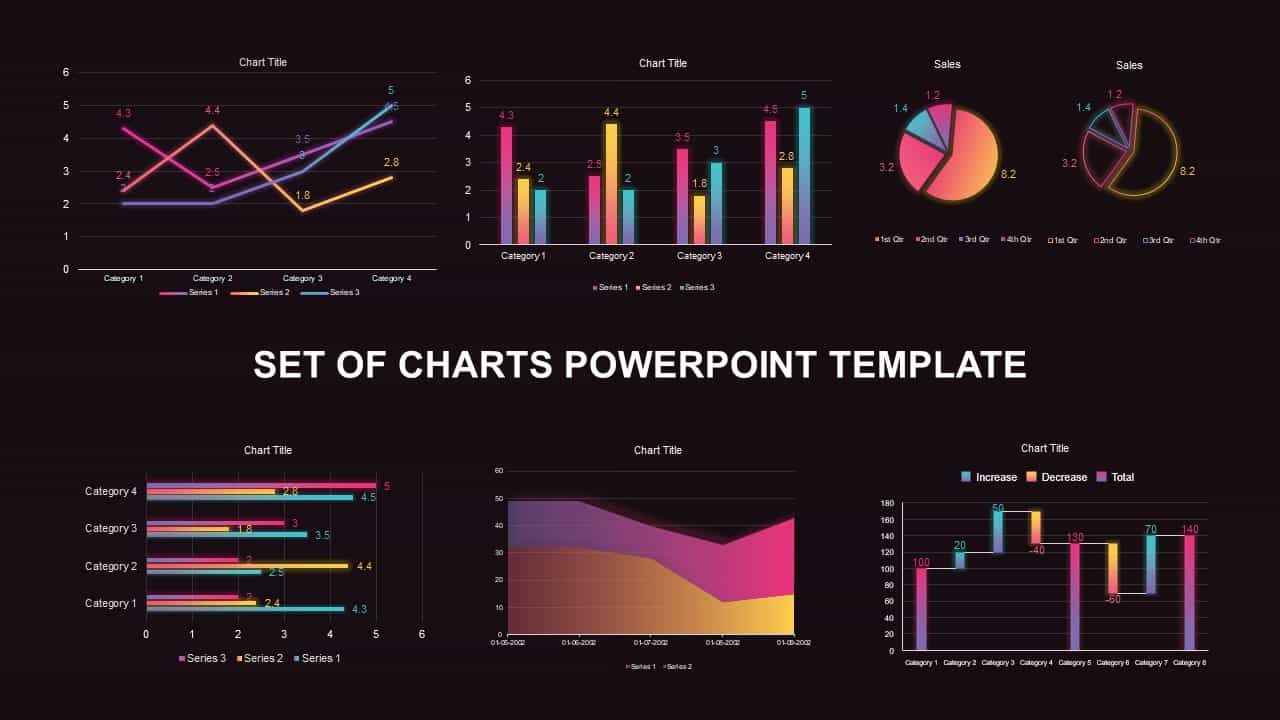
Set of Chart PowerPoint Template and Keynote Diagram
PowerPoint Charts
Premium
-
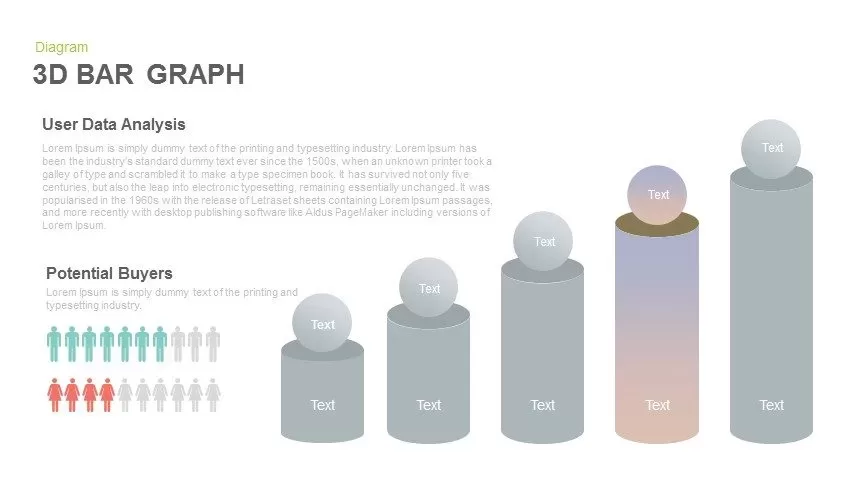
3d Bar Graph PowerPoint Template and Keynote Slide
Diagrams
Premium