


Free Statistics PowerPoint Template
- Version
- Download 194
- File Size 0.00 KB
- File Count 1
- Create Date May 11, 2024
- Last Updated May 17, 2024
Free Statistics PowerPoint Template
Use free statistics PowerPoint template for data visualization
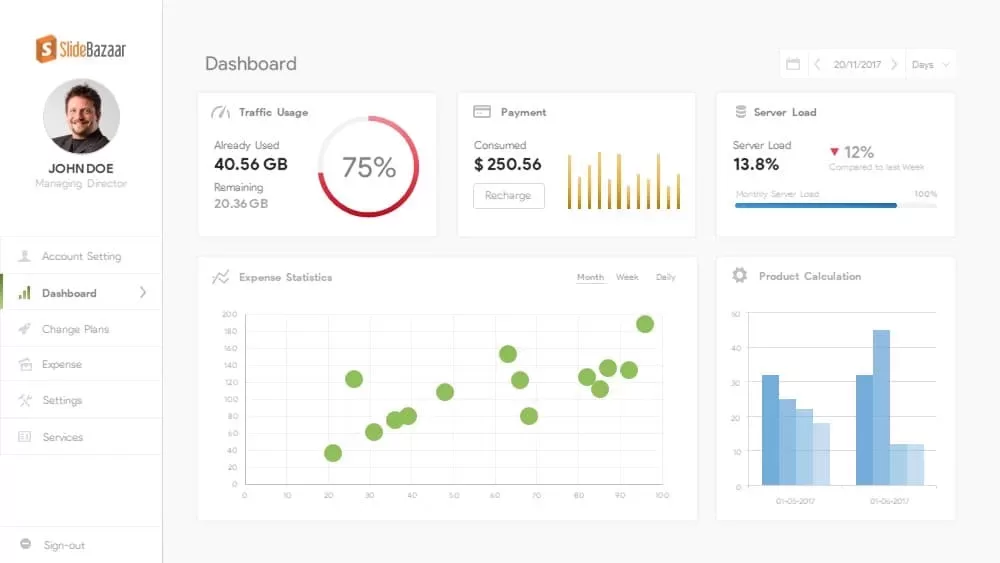
The free statistics PowerPoint presentation is a single-page dashboard that briefs your data in a variety of chart shows. The data-driven chart is a tool to present those statistics with the help of data & charts. This template can be used to impart your data to your viewers easily. So, business, research, academic, and financial presentations would be easy when you want to present quantitative information to your viewers. Free PowerPoint statistical diagram is an editable template to transform your data into a digital presentation device. So, use this opportunity to download free data presentation charts and graphs.
How to design a dashboard presentation in PowerPoint?
To design a dynamic dashboard presentation in PowerPoint, begin by selecting a clean and cohesive layout, ensuring visual clarity. Use vibrant colors, consistent fonts, and concise titles to enhance readability. Incorporate charts, graphs, and visuals to convey data effectively. Organize content logically, employing sections or slides for different metrics. Prioritize key information and use clear labels for easy comprehension. Utilize SmartArt and icons for a visually appealing hierarchy. Implement interactive elements such as hyperlinks or navigation buttons for seamless transitions. Regularly update data for relevancy. Ultimately, maintain simplicity and focus on user-friendly features, enabling a compelling and informative dashboard presentation for your audience.
Providing a valuable resource for monitoring and tracking performance, free PowerPoint charts and graphs serve as essential tools for gaining insights into business processes. These systematic instruments empower leaders and managers, enabling them to make well-informed decisions and drive improvements within systems. Rooted in factual performance data, statistical reports visually highlight key performance indicators. Digital marketers, for instance, can utilize the template to present website traffic, anchor positions, crawling ratios, broken links, and other vital metrics for SEO analysis. Likewise, it proves versatile for showcasing business survey reports, political opinions, and various academic research outcomes, underscoring its broad applicability across diverse domains.
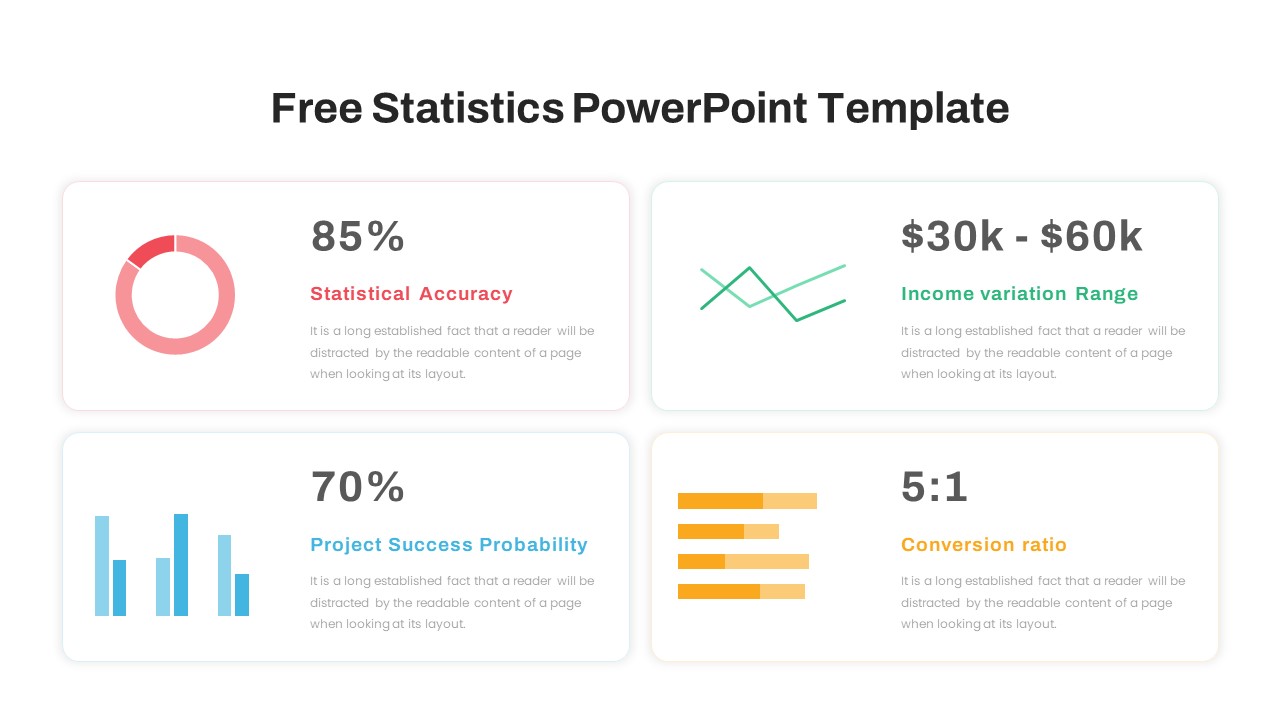
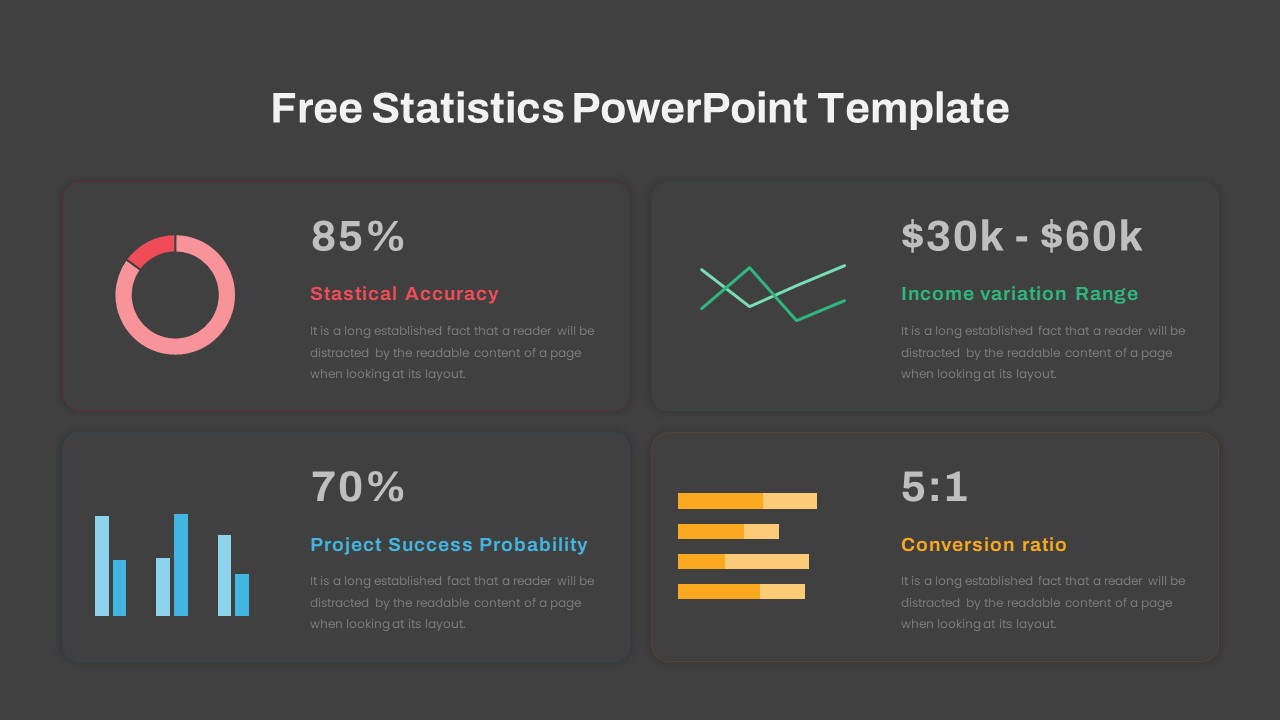
Free PowerPoint statistics slide is a section dashboard where you can insert your data using a doughnut chart, multiple line graph, vertical bar chart, and parallel bar chart. The presenters can show percentages, ratios, and comparisons with the free PowerPoint template for statistics presentation.
Attached Files
| File | Action |
|---|---|
| https://slidebazaarfreedownloads.s3.amazonaws.com/SB04013-Free Statistics PowerPoint Template.zip | Download |
Login to download this file
Add to favorites
Add to collection
-

Item ID
SB04013 -

Related Templates
-

Research Proposal PowerPoint Template
PowerPoint Templates
Premium
-

Free Nursing Capstone PowerPoint Deck
PowerPoint Templates
Free
-

Nature PowerPoint Presentation Template
PowerPoint Business Templates
Premium
-

Free Vertical PowerPoint Template
PowerPoint Business Templates
Free
-

Sales Deck Free PowerPoint Template
PowerPoint Templates
Free
-

Cab Service PowerPoint Template
PowerPoint Templates
Premium
-

Free Space Minimal Deck Template
PowerPoint Templates
Free
-

VET Clinic PowerPoint Template
PowerPoint Templates
Premium
-

Gym PowerPoint Template
PowerPoint Templates
Premium
-

Free Physical Education PowerPoint Template Deck
Free PowerPoint Templates
Free
-

Travel Agency PowerPoint Template
PowerPoint Templates
Premium
-

IoT Presentation Template
PowerPoint Templates
Premium
-

Effective Communication PowerPoint Template
PowerPoint Templates
Premium
-

PowerPoint Quiz With Timer
PowerPoint Templates
Premium
-

Graph Paper PowerPoint Template Deck
PowerPoint Templates
Premium
-
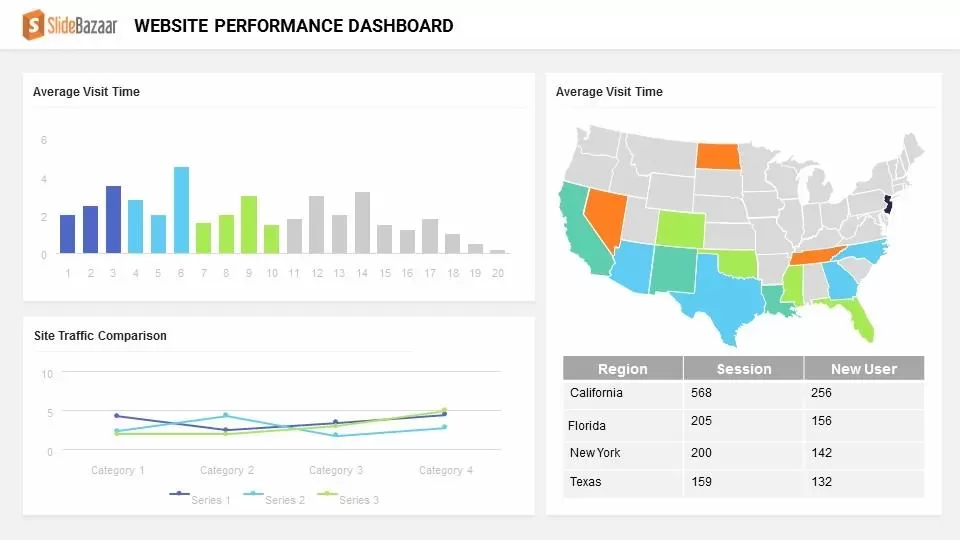
Website Performance Dashboard PowerPoint Template and Keynote
Infographic
Premium
-

Free Economics PowerPoint Template
Free PowerPoint Templates
Free
-

Annual Report PowerPoint Template and Keynote
PowerPoint Templates
Premium
-

Free University Presentation PowerPoint Template
PowerPoint Templates
Free
-
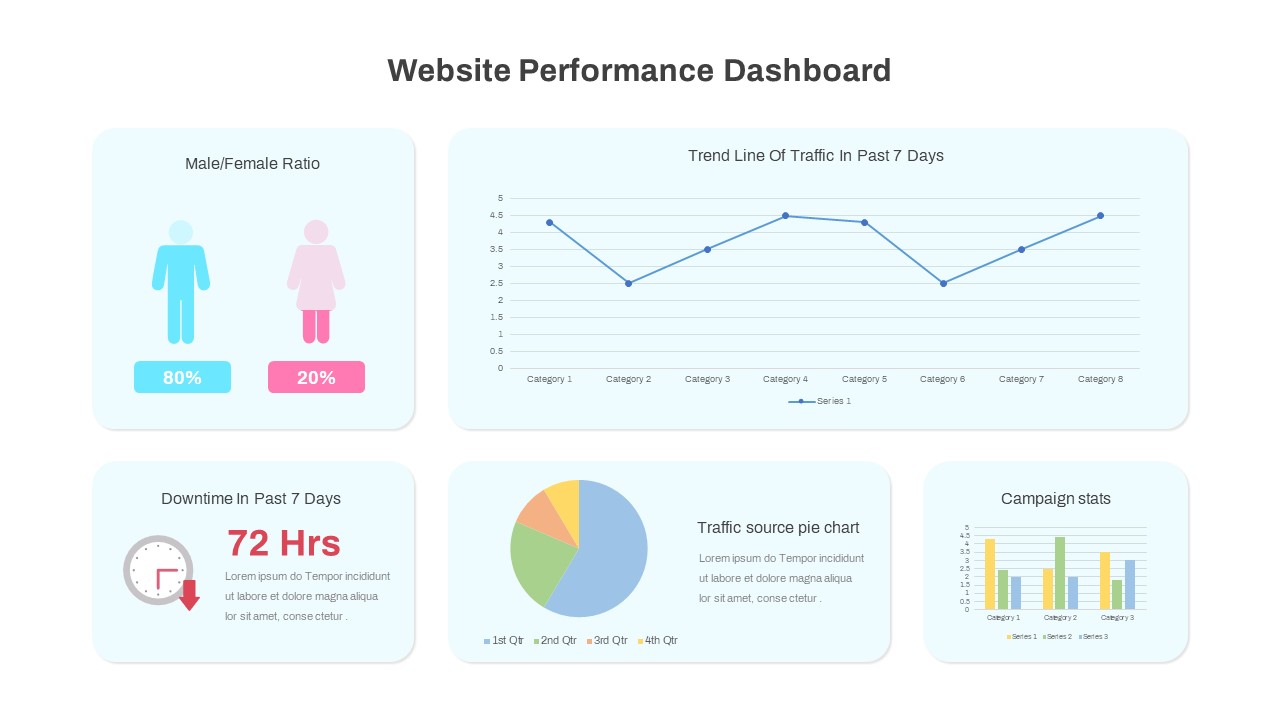
Website Performance Dashboard
PowerPoint Templates
Premium
-

Free Aviation PowerPoint Template
Free PowerPoint Templates
Free
-

Free Army PowerPoint Template
PowerPoint Templates
Free
-

Macroeconomics PowerPoint Template
PowerPoint Templates
Premium
-

Free Charity PowerPoint Template Deck
PowerPoint Templates
Free
-
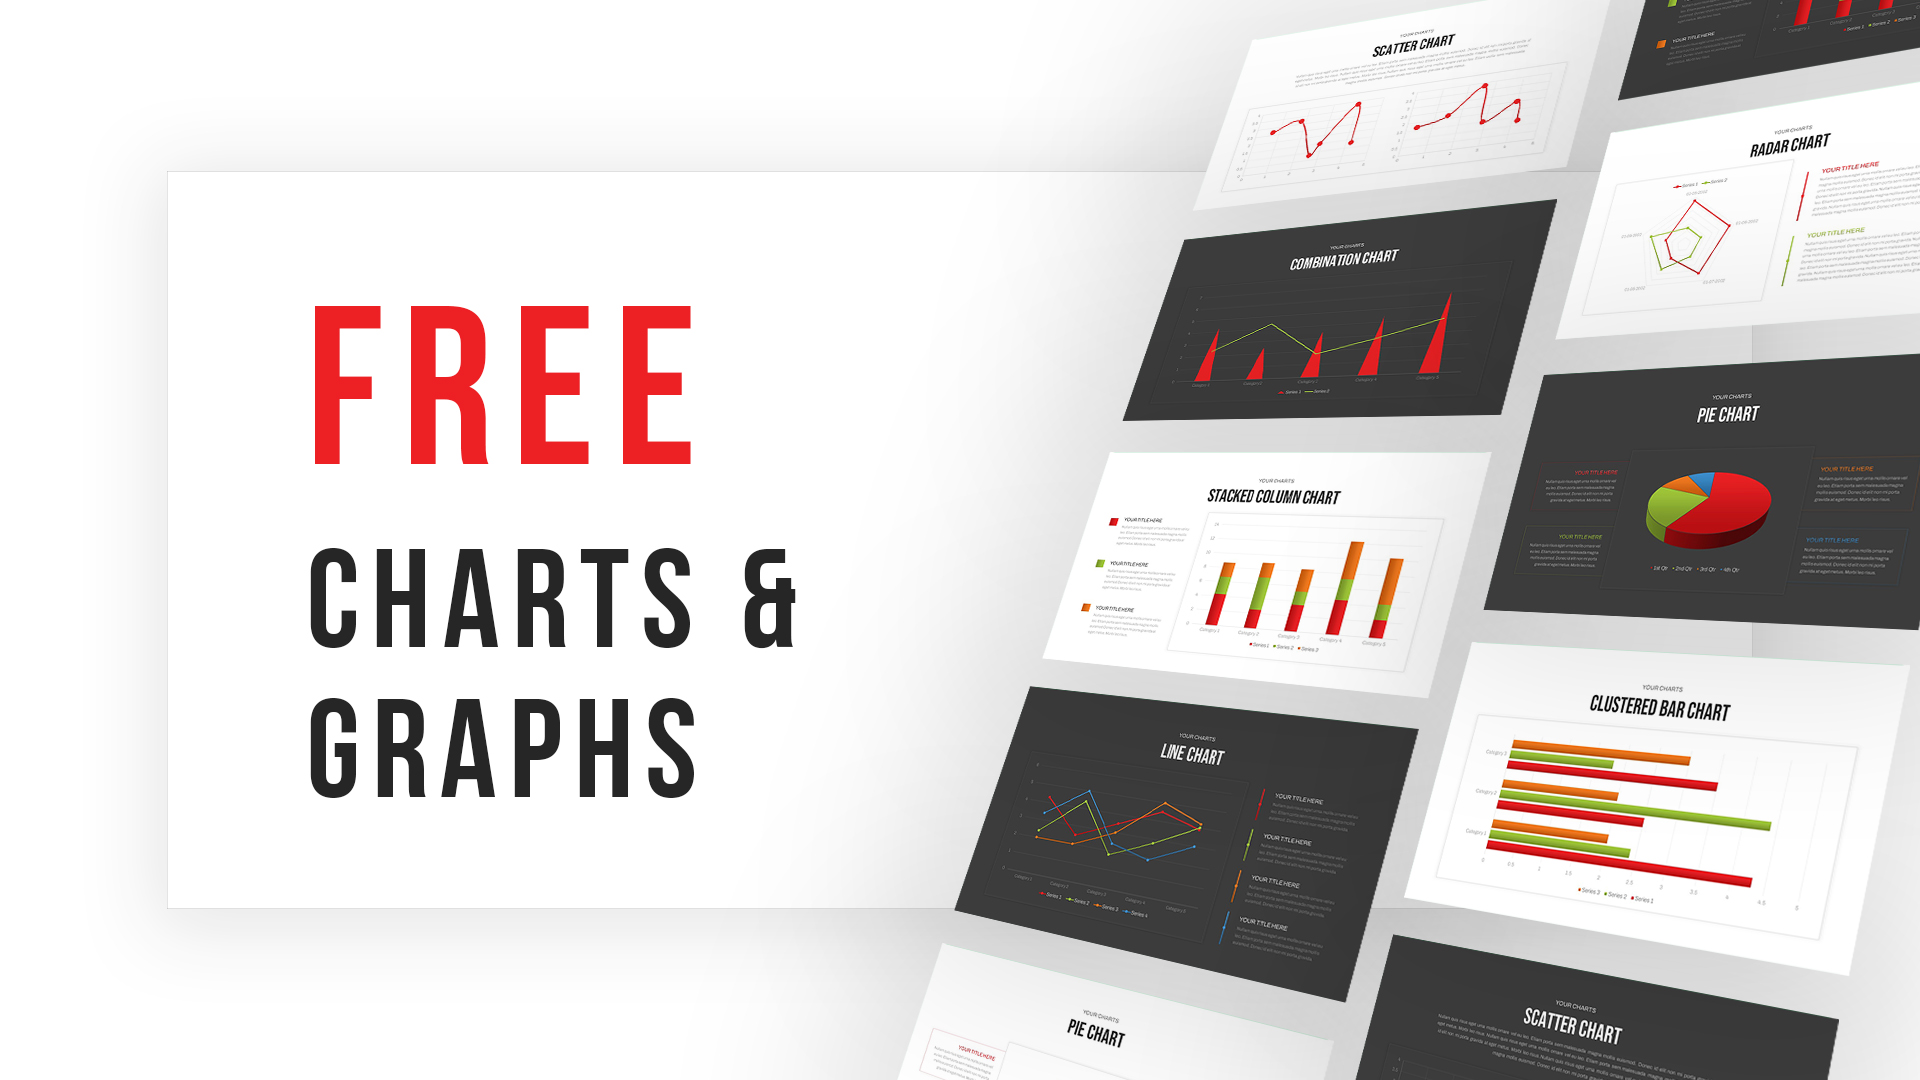
Free Charts & Graphs Deck PowerPoint Template
PowerPoint Templates
Free
-

Customer Experience Loyalty PowerPoint Deck Template
PowerPoint Templates
Premium
-
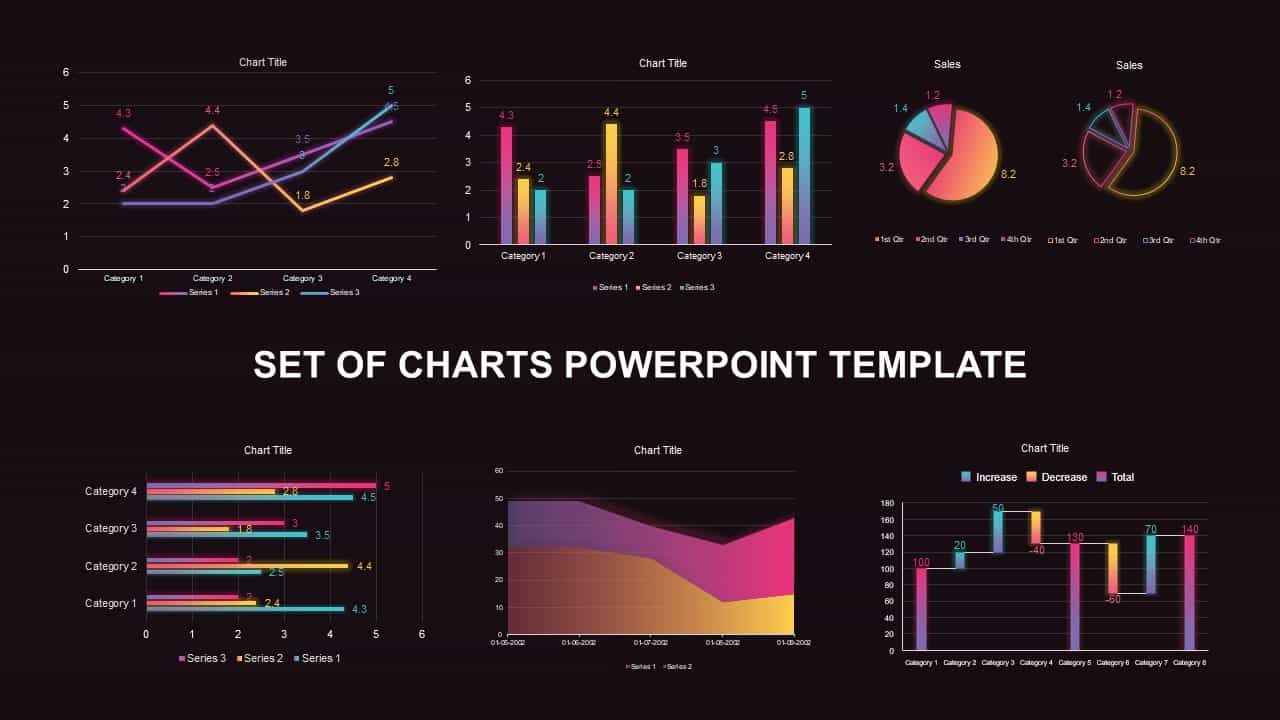
Set of Chart PowerPoint Template and Keynote Diagram
PowerPoint Charts
Premium
-
Free Project Dashboard PowerPoint Template & Keynote Slide
Free PowerPoint Templates
Free
-

Free Charts and Graphs PowerPoint Template
PowerPoint Templates
Free
-

Free Cartoon PowerPoint Template
Free PowerPoint Templates
Free
-

Dashboard Template for PowerPoint Presentation
PowerPoint Charts
Premium
-

Animated Agriculture PowerPoint Deck Template
PowerPoint Templates
Premium
-
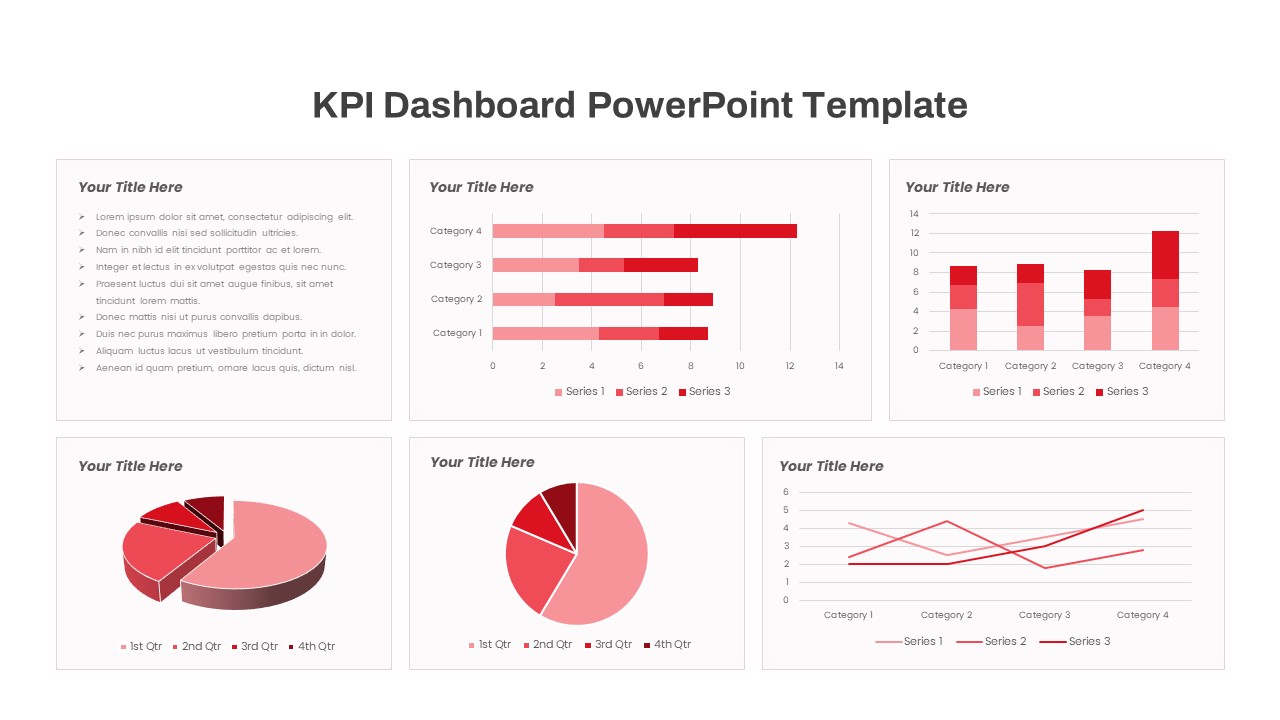
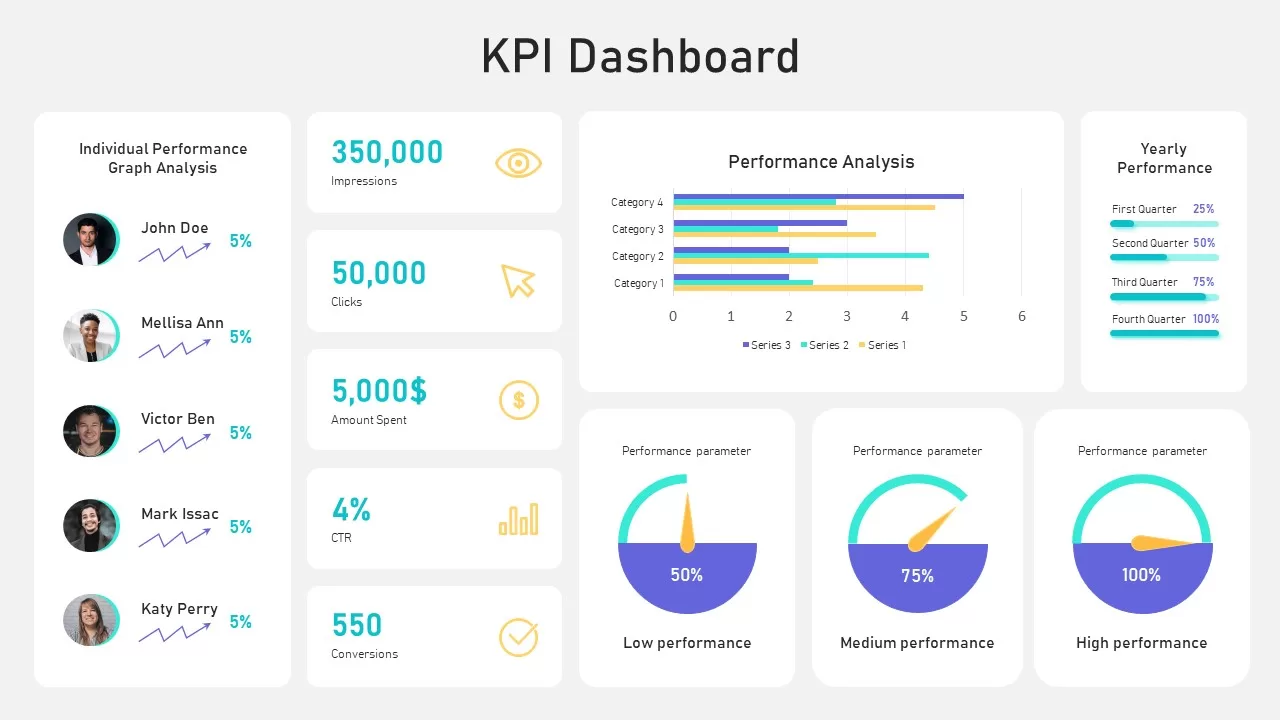
Free KPI Dashboard PowerPoint Template
PowerPoint Templates
Free
-

Free Real Estate Listing PowerPoint Template
Free PowerPoint Templates
Free
-

Data Science PowerPoint Template
PowerPoint Templates
Premium
-

Global Warming Infographic PowerPoint Template Deck
PowerPoint Templates
Premium
-

Free Book Review PowerPoint Template
Free PowerPoint Templates
Free
-

Free Event Planning PowerPoint Template
Free PowerPoint Templates
Free
-
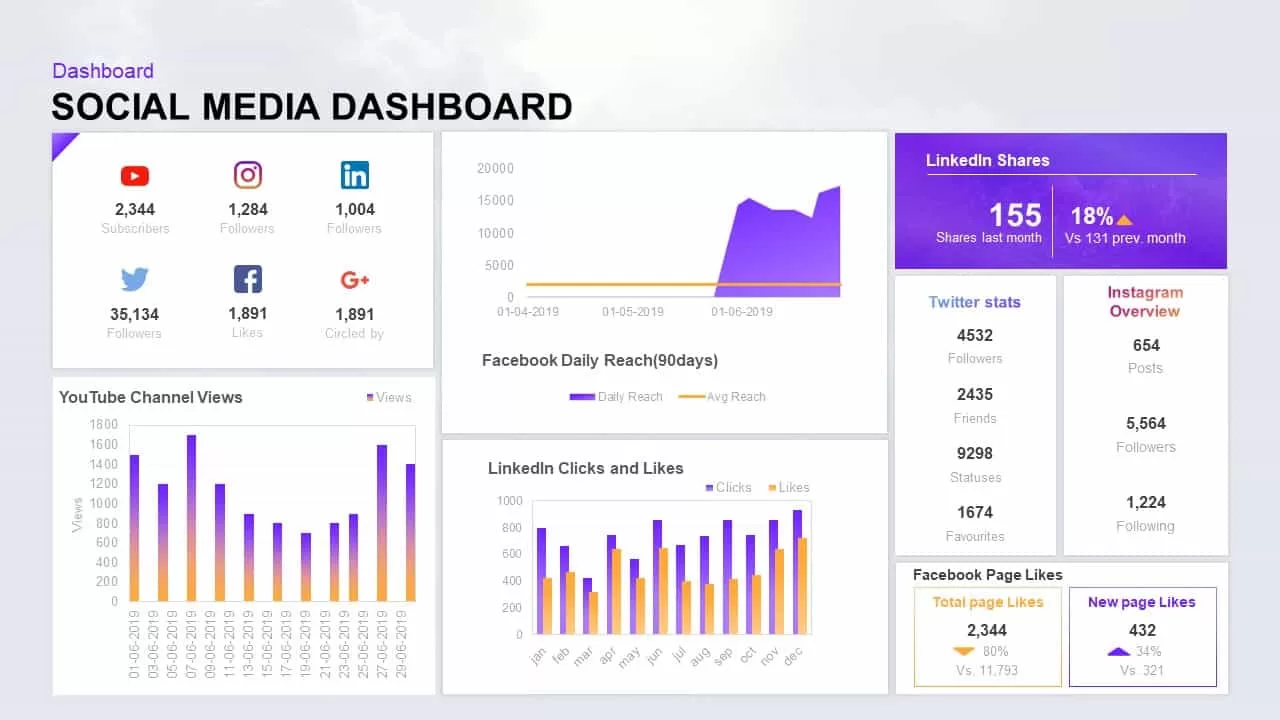
Social Media Dashboard Template for PowerPoint Presentation
Social Media
Premium
-

EFQM Model PowerPoint Template
PowerPoint Templates
Premium
-
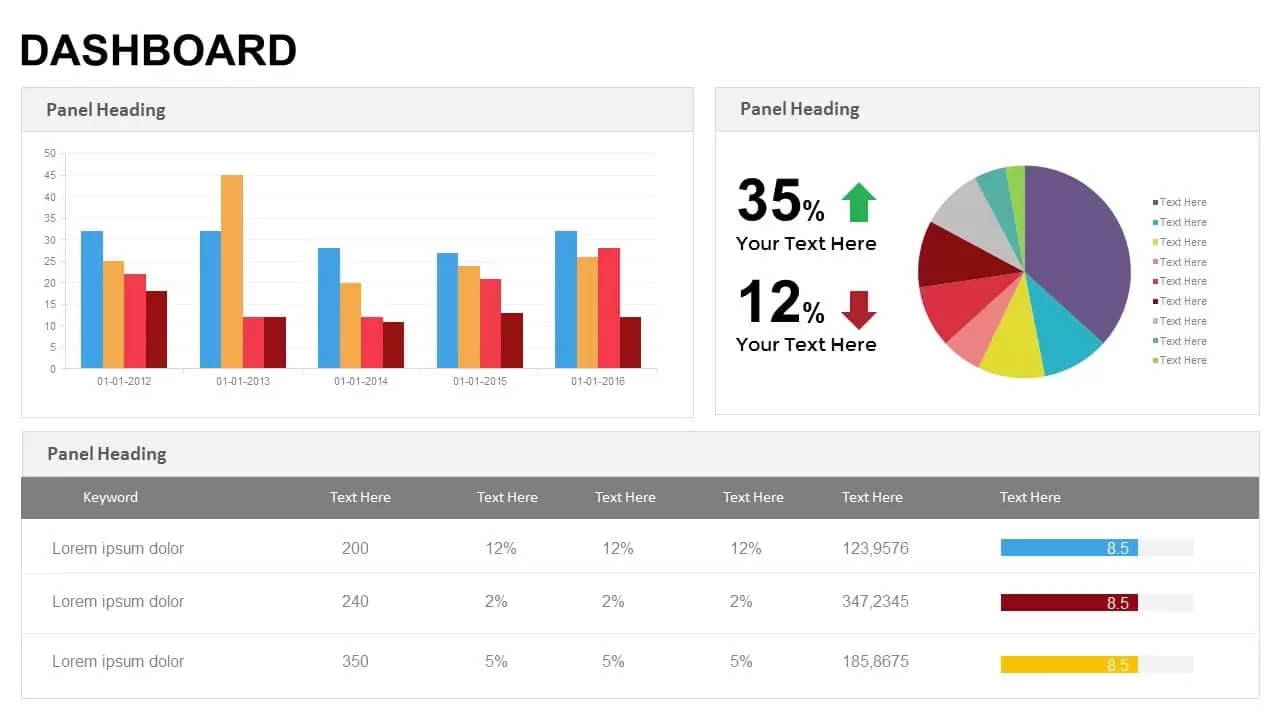
Dashboard Powerpoint Templates and Keynote template
Keynote Templates
Premium
-

Free Dunder Mifflin Paper Company Pitch Deck
Free PowerPoint Templates
Free
-

Real Estate PowerPoint Theme
PowerPoint Themes
Premium
-

Free Metro UI Dashboard Template
PowerPoint Templates
Free
-

Free AI Artificial Intelligence PowerPoint Template
PowerPoint Templates
Free
-

Digital Marketing PowerPoint Theme
PowerPoint Themes
Premium
-
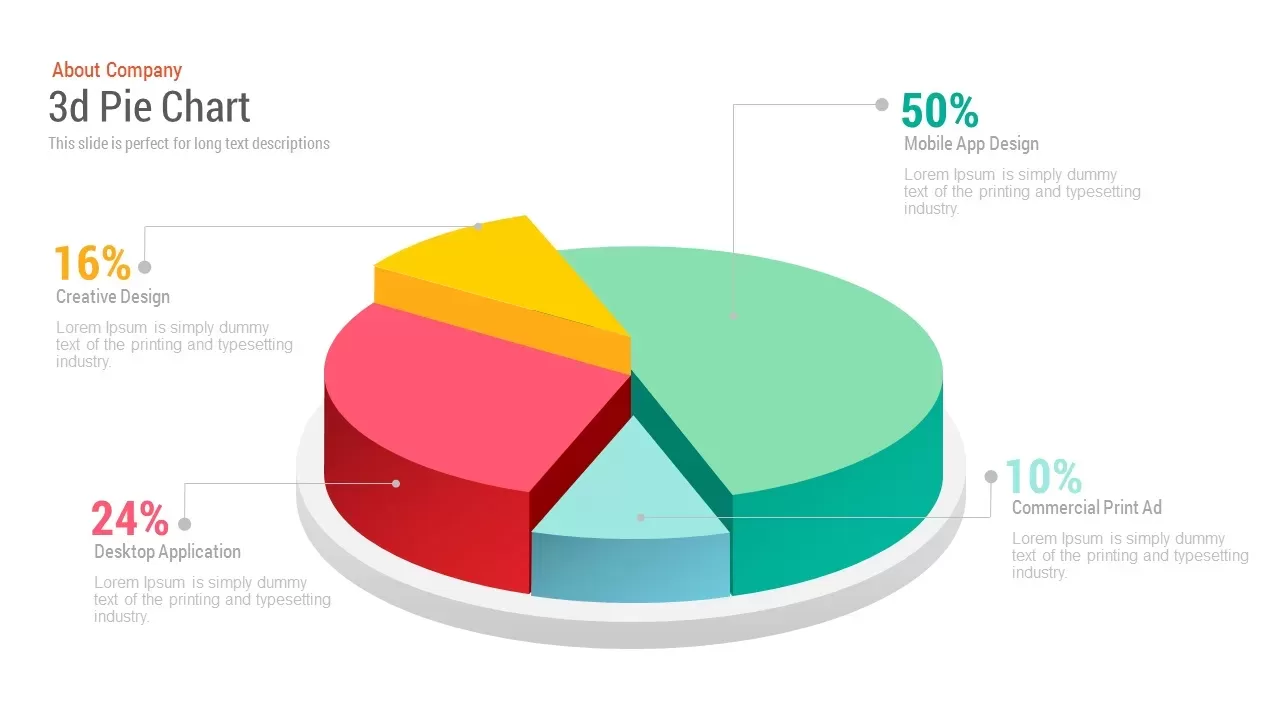
Free 3d Pie Chart PowerPoint Template & Keynote slide
Pie & Donut
Free
-
Sales Report Presentation PowerPoint Template
Business Models
Premium
-

Combination Chart PowerPoint Template
PowerPoint Charts
Premium
-

Stakeholder Register PowerPoint Template
PowerPoint Templates
Premium
-

Business Process Reengineering Template
PowerPoint Templates
Premium
-
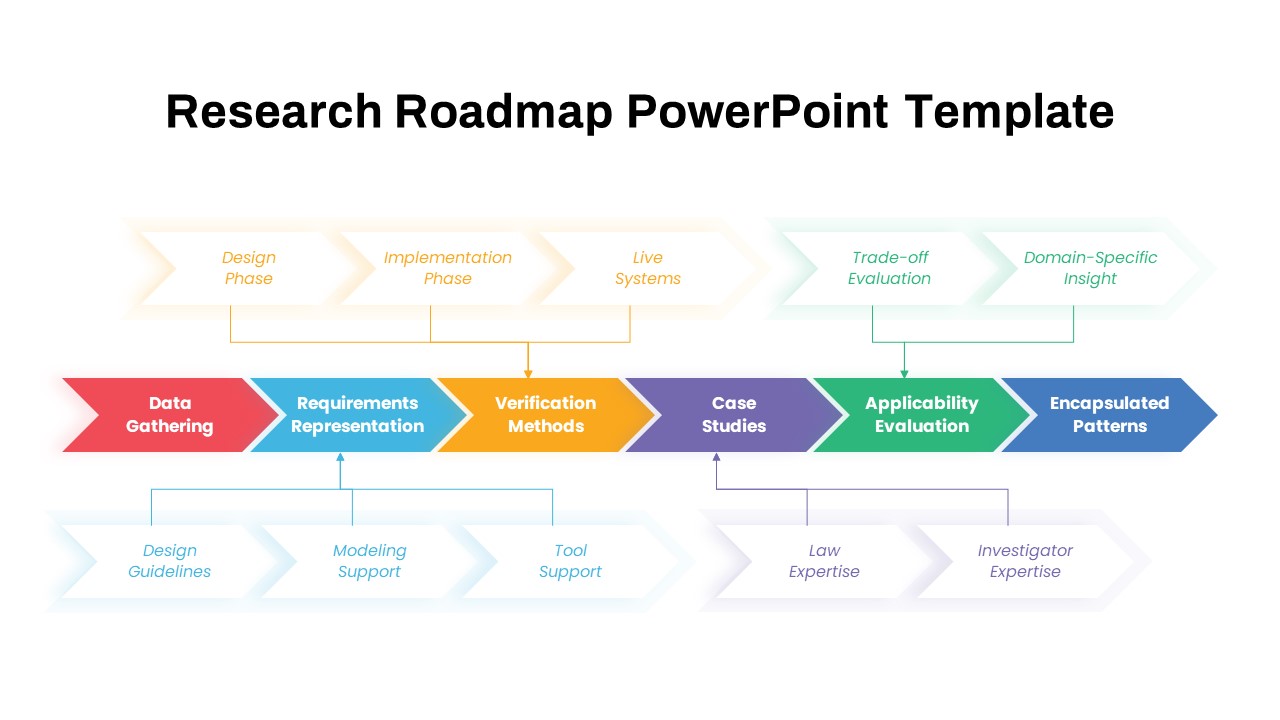
Research Roadmap PowerPoint Template
PowerPoint Templates
Premium
-

Radial Bar Chart PowerPoint Templates and Keynote Slides
PowerPoint Charts
Premium
-
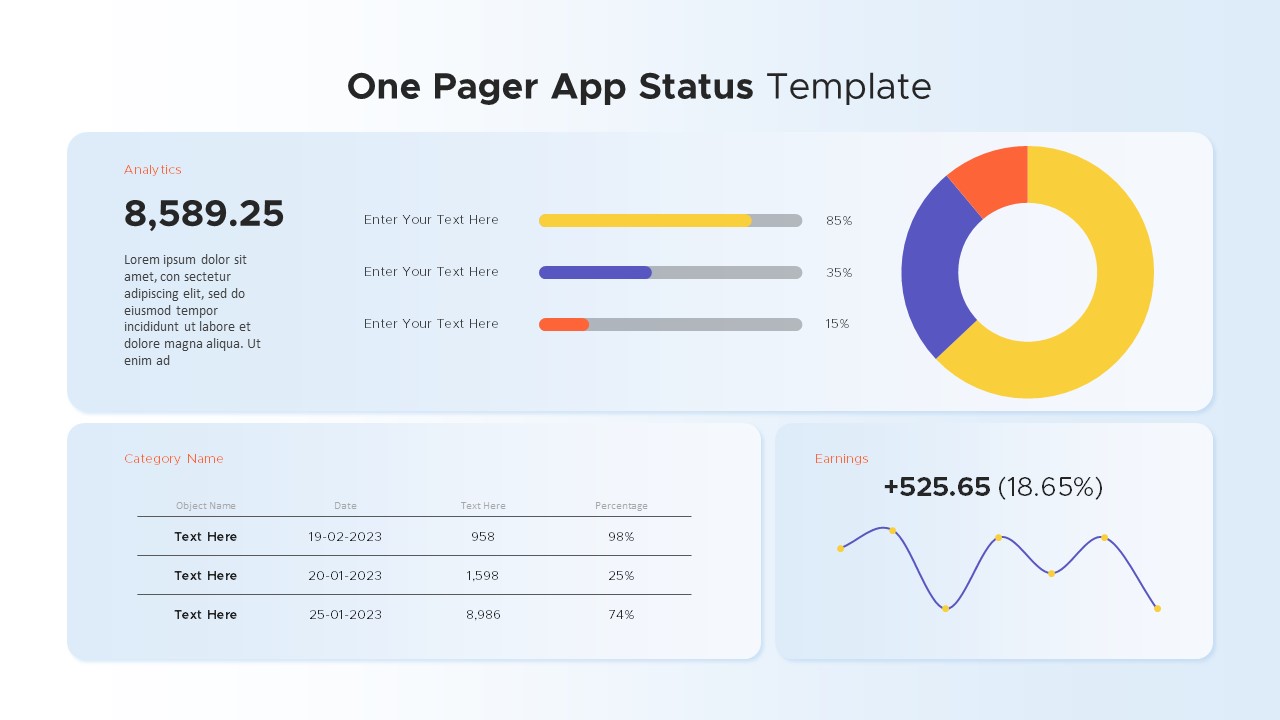
One Pager App Status PowerPoint Template
PowerPoint Charts
Premium
-

Research Presentation PowerPoint Template Free
PowerPoint Templates
Free
-

Digital Marketing Templates
Infographic
Premium
-
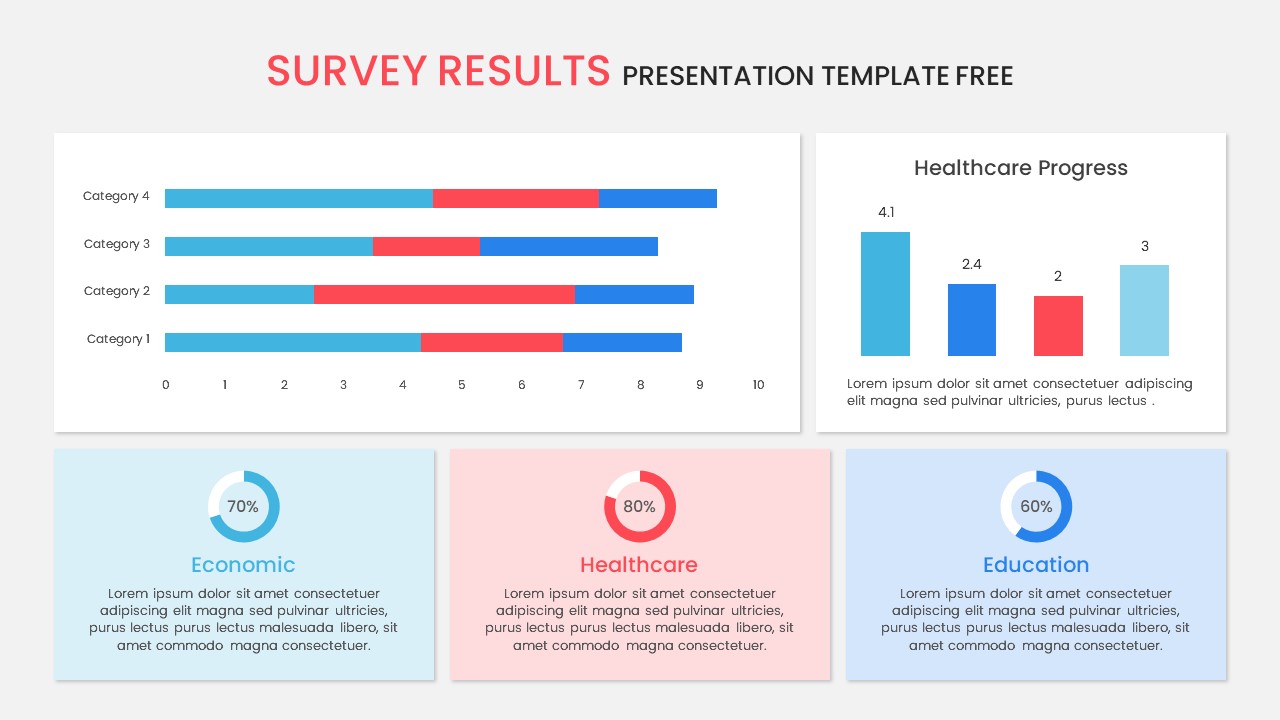
Survey Results PowerPoint Template Free
Free PowerPoint Templates
Free
-
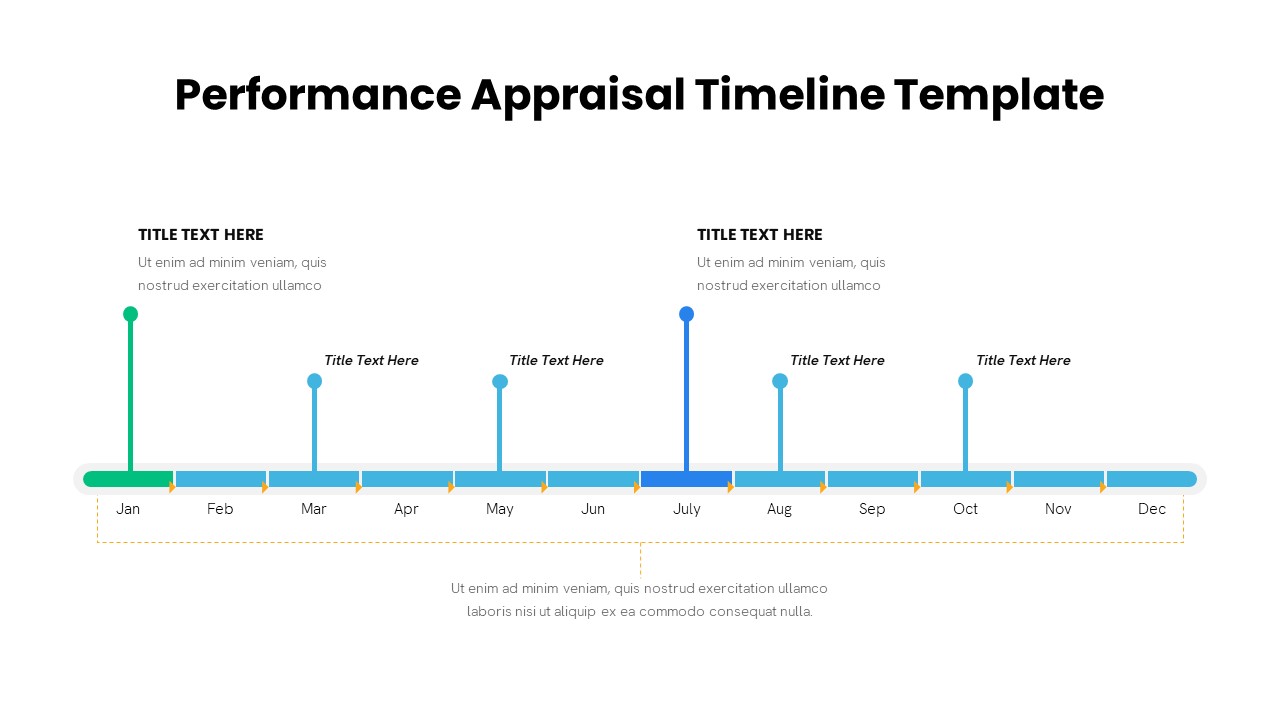
Performance Appraisal Timeline Template
Timeline PowerPoint Template
Premium
-
KPI Slide for PowerPoint
Infographic
Premium
-

Digital Marketing Presentation Template
PowerPoint Templates
Premium
-
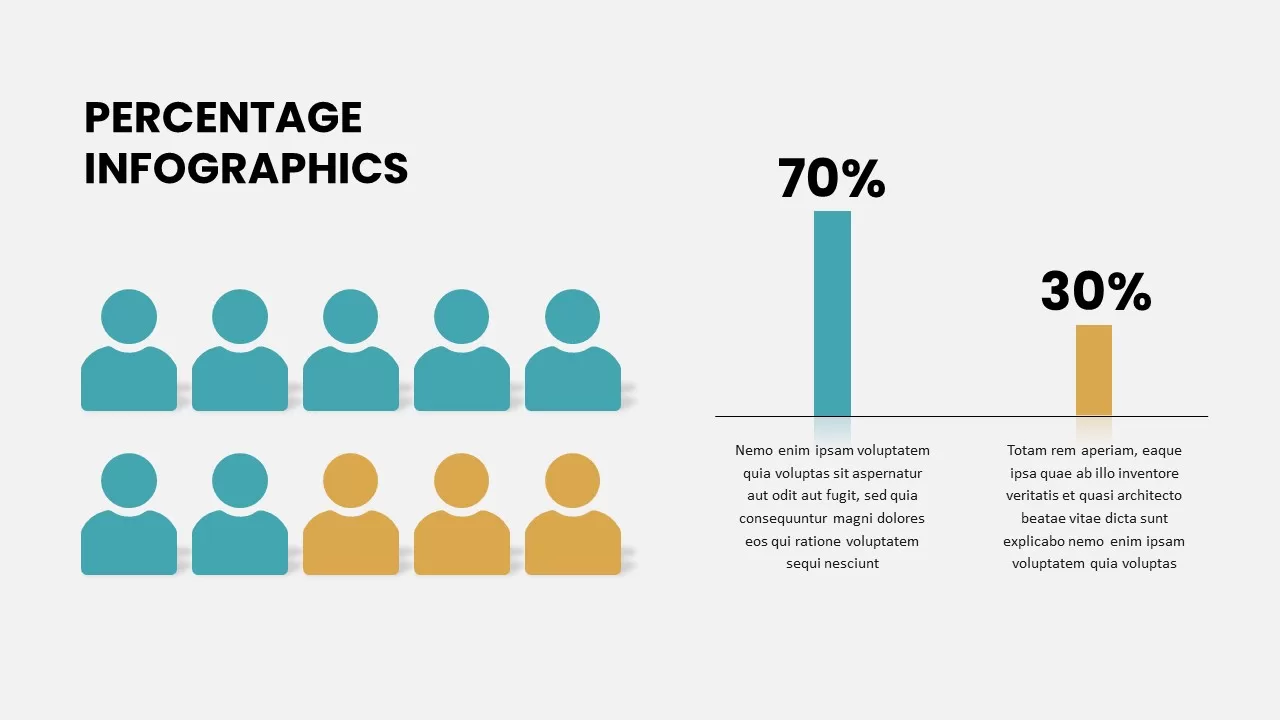
Percentage Infographic
Column and Bar chart
Premium
-

Digital Marketing PowerPoint Theme
PowerPoint Themes
Premium
-
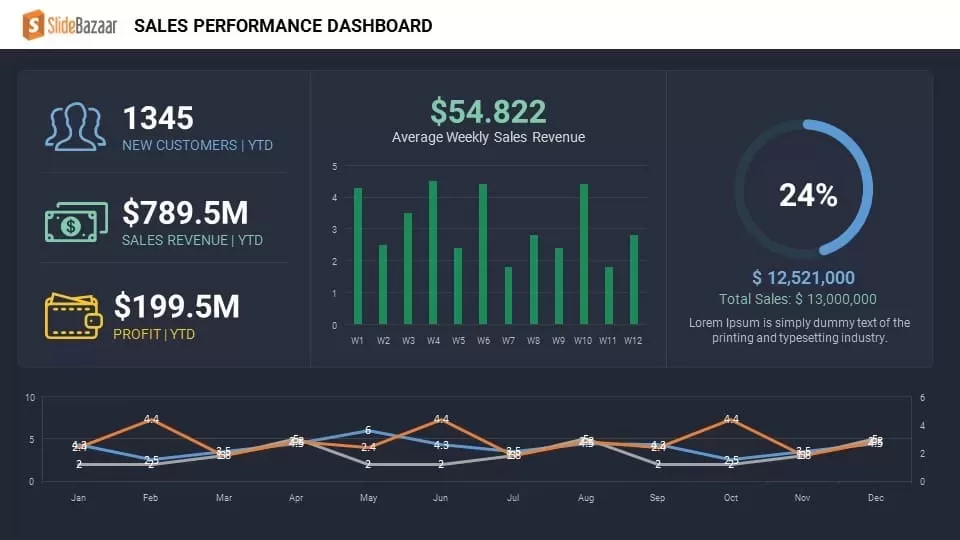
Sales Performance Dashboard Keynote and PowerPoint template
PowerPoint Charts
Premium
-

Biotechnology PowerPoint Presentation Template
PowerPoint Templates
Premium
-
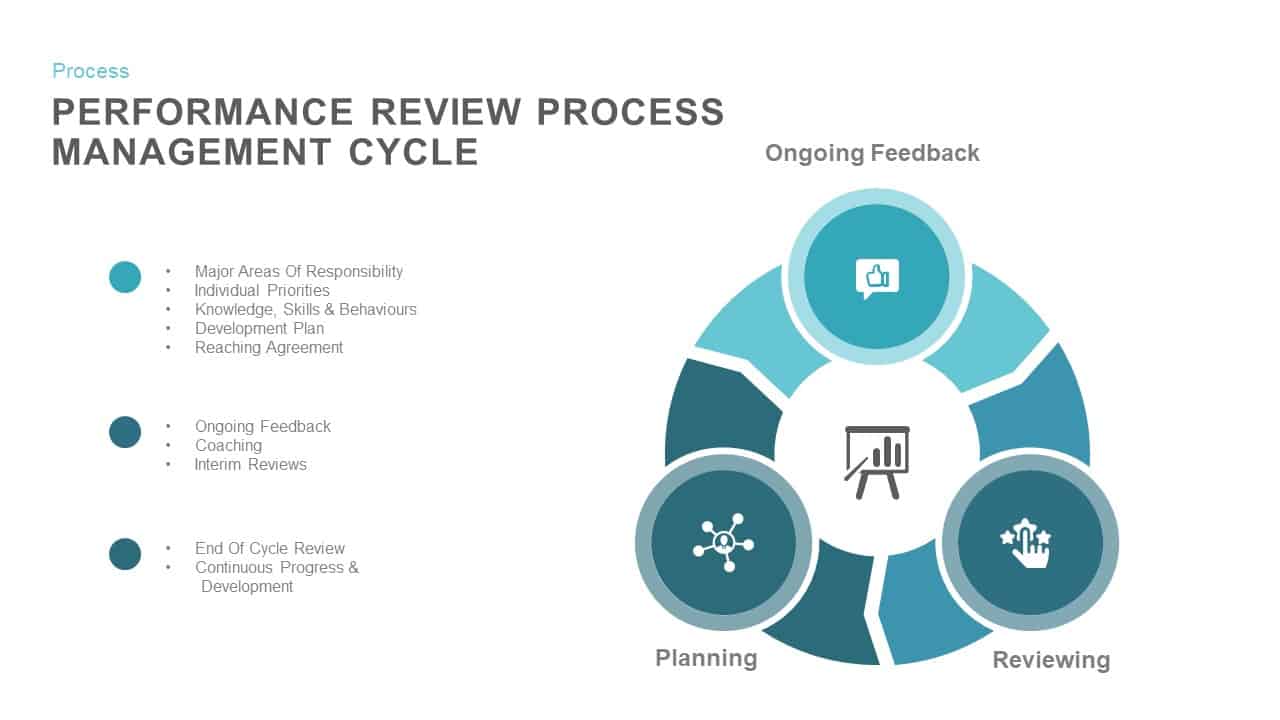
Performance Review Process Cycle PowerPoint and Keynote Slides
Diagrams
Premium
-

Research PowerPoint Template and Metaphor Keynote Template
Keynote Templates
Premium
-

Animated Upcoming Event Poster PowerPoint Template
PowerPoint Templates
Premium
-

Open Door Policy PowerPoint Template
PowerPoint Templates
Premium
-
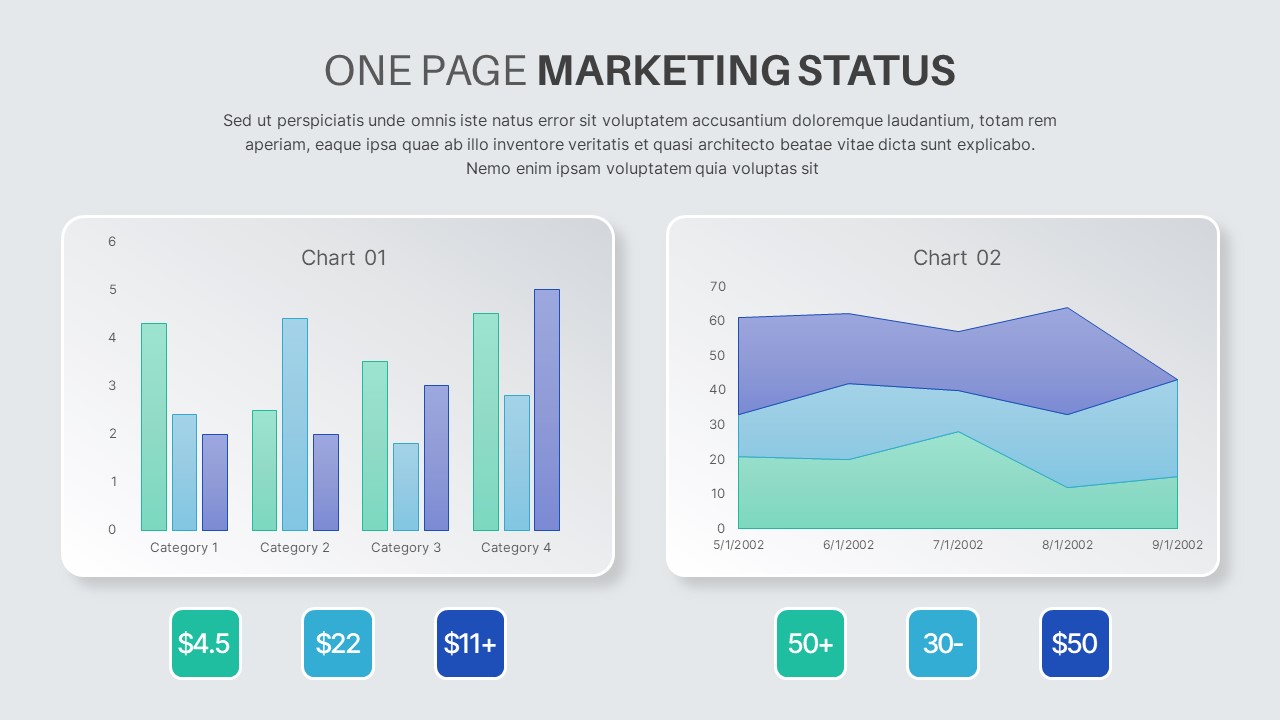
One Pager Marketing Status PowerPoint Template
PowerPoint Templates
Premium
-
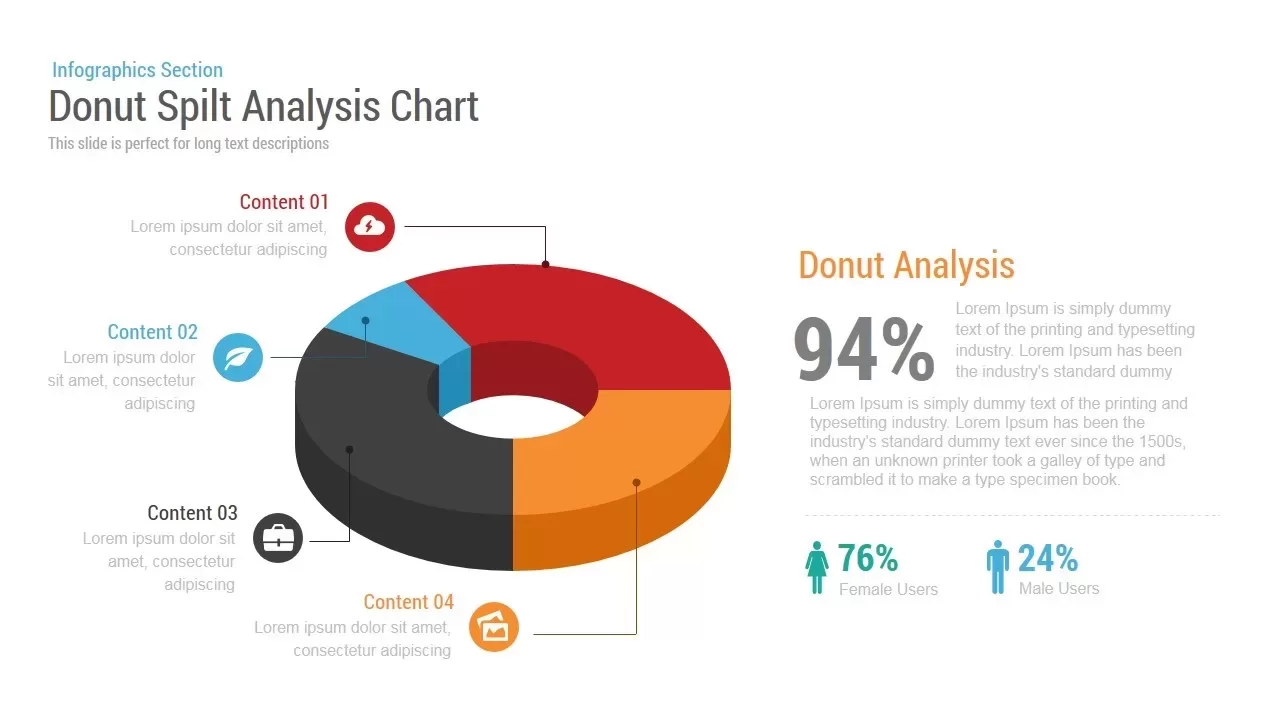
Donut Split Analysis Chart PowerPoint Template and Keynote Slide
Infographic
Premium
-

Pencil Bar Chart PowerPoint Template and Keynote Slide
Column and Bar chart
Premium
-
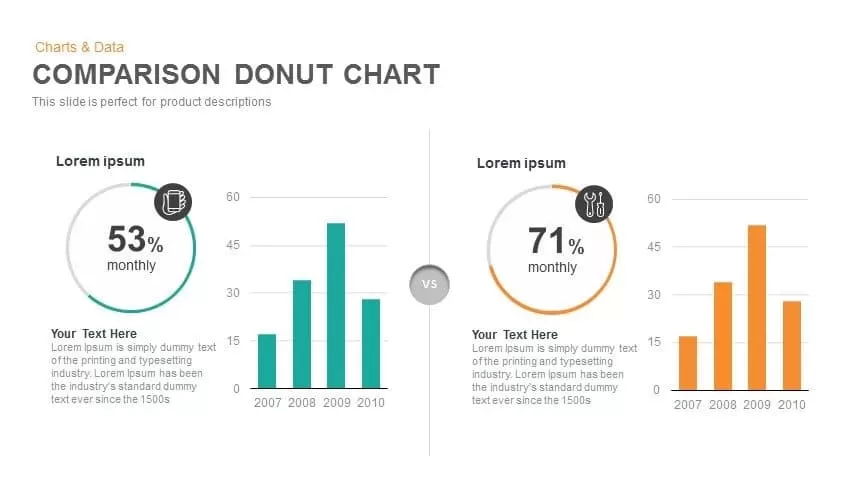
Comparison Donut Chart PowerPoint Template and Keynote
Keynote Templates
Premium
-
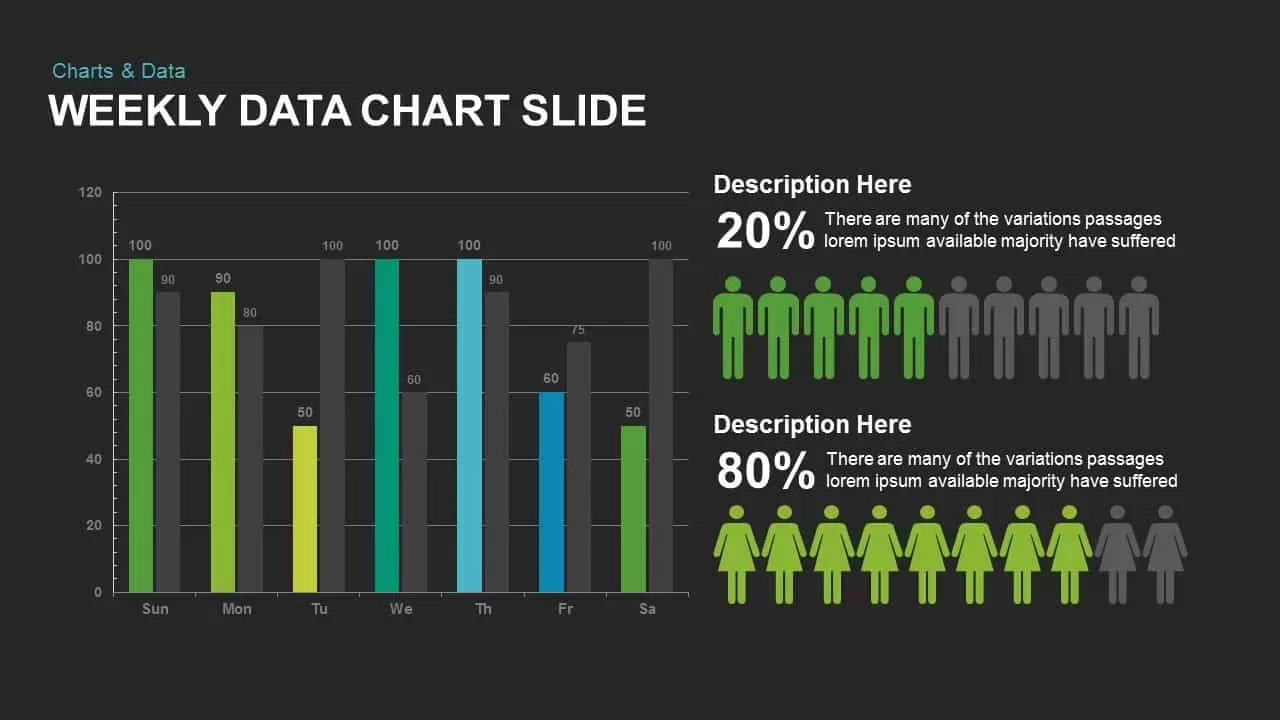
Weekly Data Charts PowerPoint Presentation Template and Keynote Slide
Infographic
Premium
-
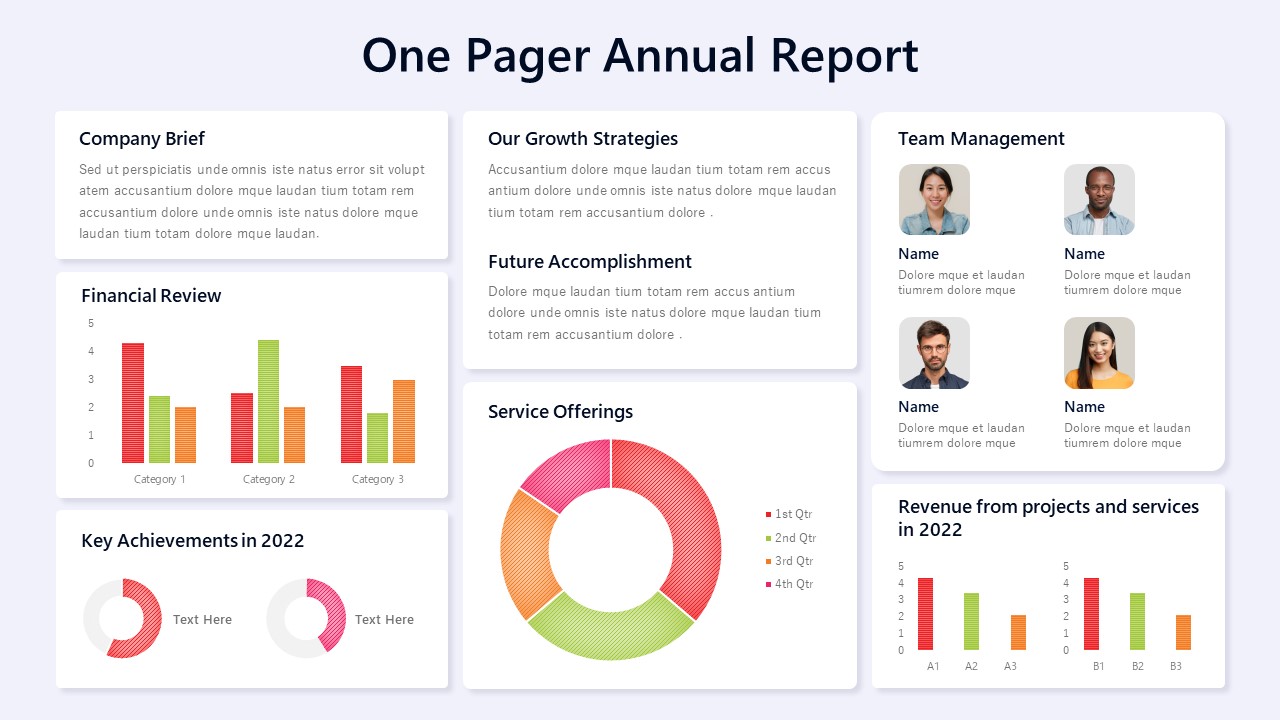
One Pager Annual Report Template
Column and Bar chart
Premium
-

Creative Bar Chart Data Analysis PowerPoint Template and Keynote
Infographic
Premium
-
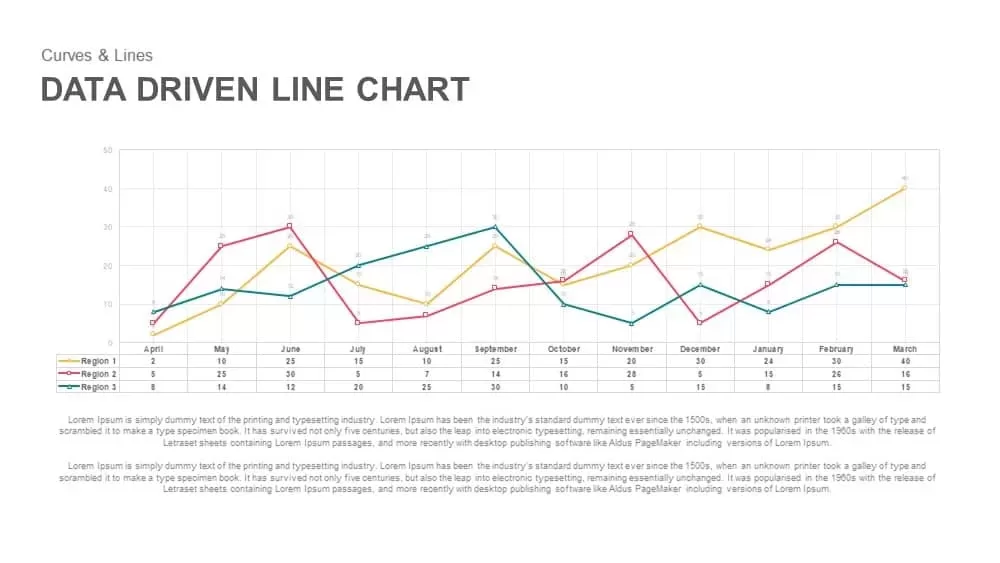
Data Driven Line Chart Template for PowerPoint & Keynote
Curves and Lines
Premium
-

Area Chart PowerPoint Template
PowerPoint Charts
Premium
-

Multipurpose Business PowerPoint Template
PowerPoint Business Templates
Premium
-

Corporate PowerPoint Presentation Template
PowerPoint Business Templates
Premium
-

Sales Dashboard Template for PowerPoint and Keynote
Infographic
Premium
-
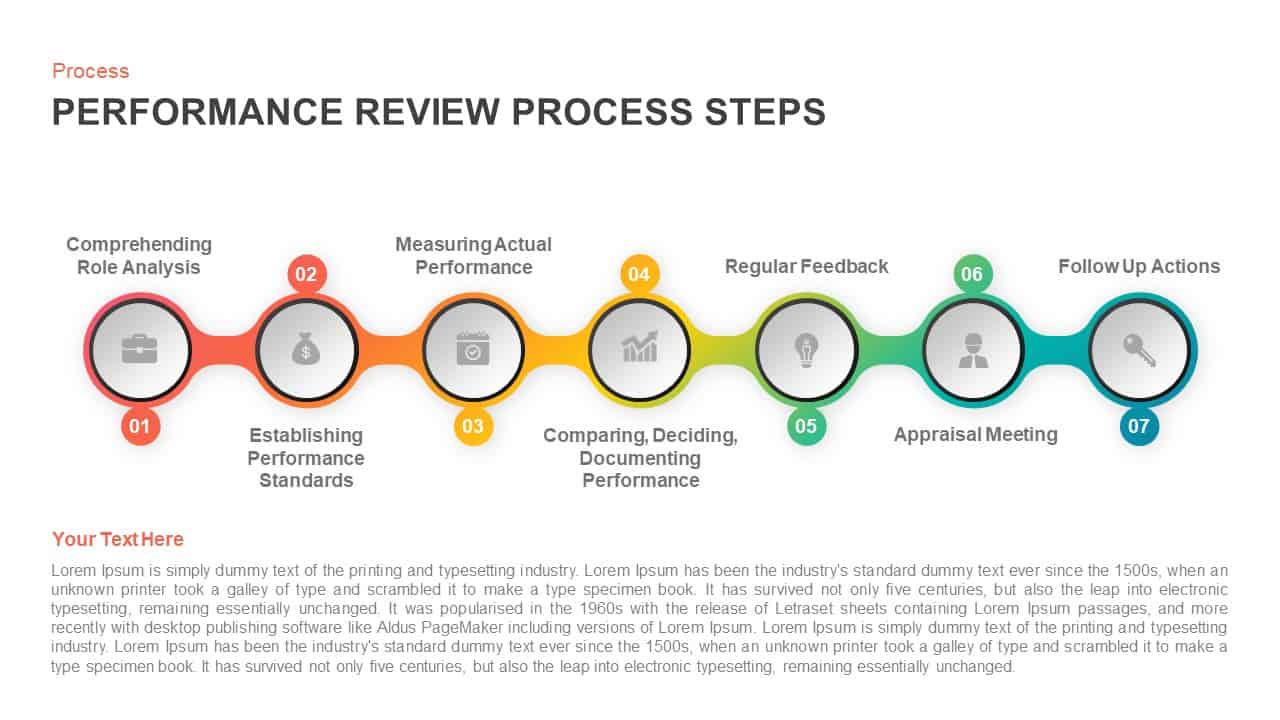
Performance Review Process Steps Timeline for PowerPoint Presentation
Keynote Templates
Premium
-
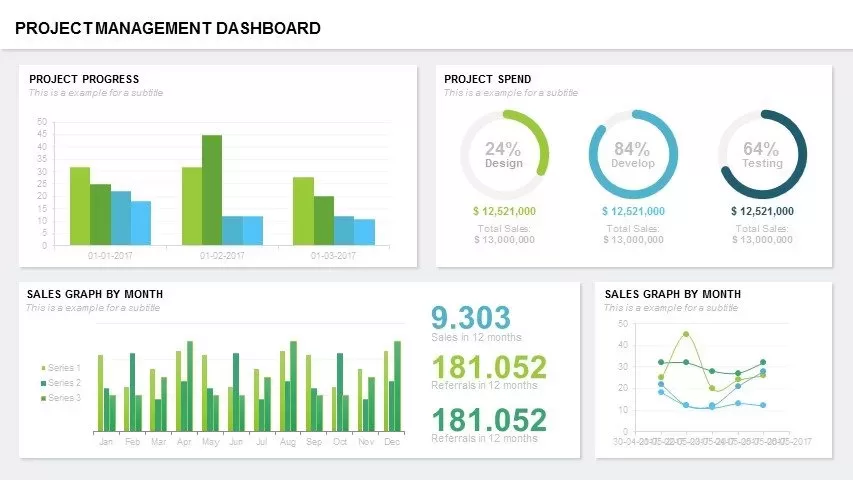
Project Management Dashboard PowerPoint Template and Keynote Template
PowerPoint Templates
Premium
-
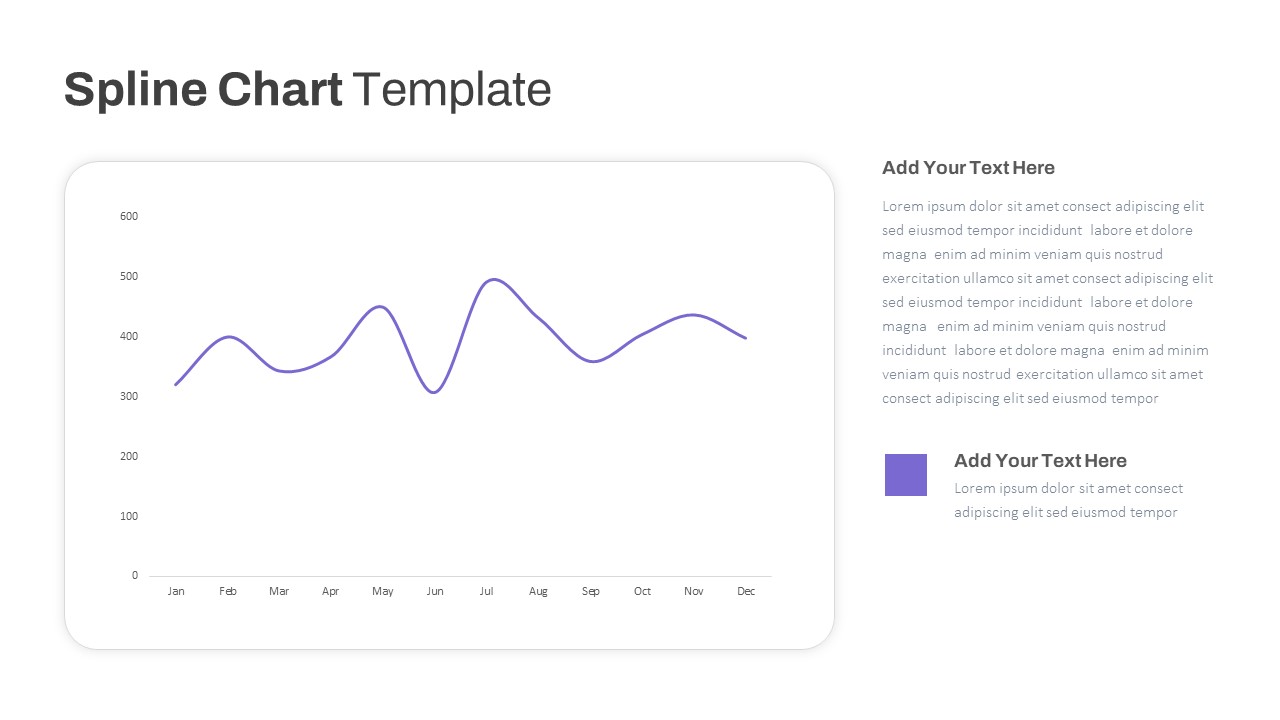
Spline Chart PowerPoint Template
PowerPoint Charts
Premium
-
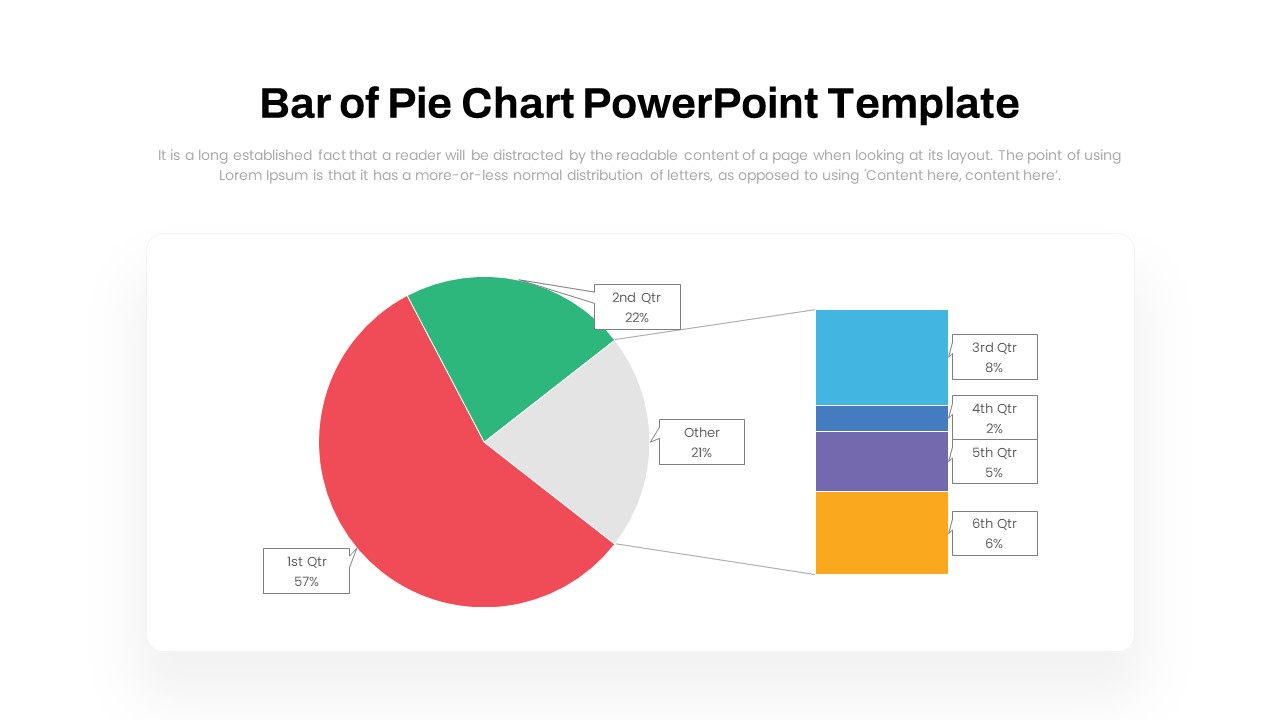
Bar of Pie Chart PowerPoint Template
PowerPoint Templates
Premium
-
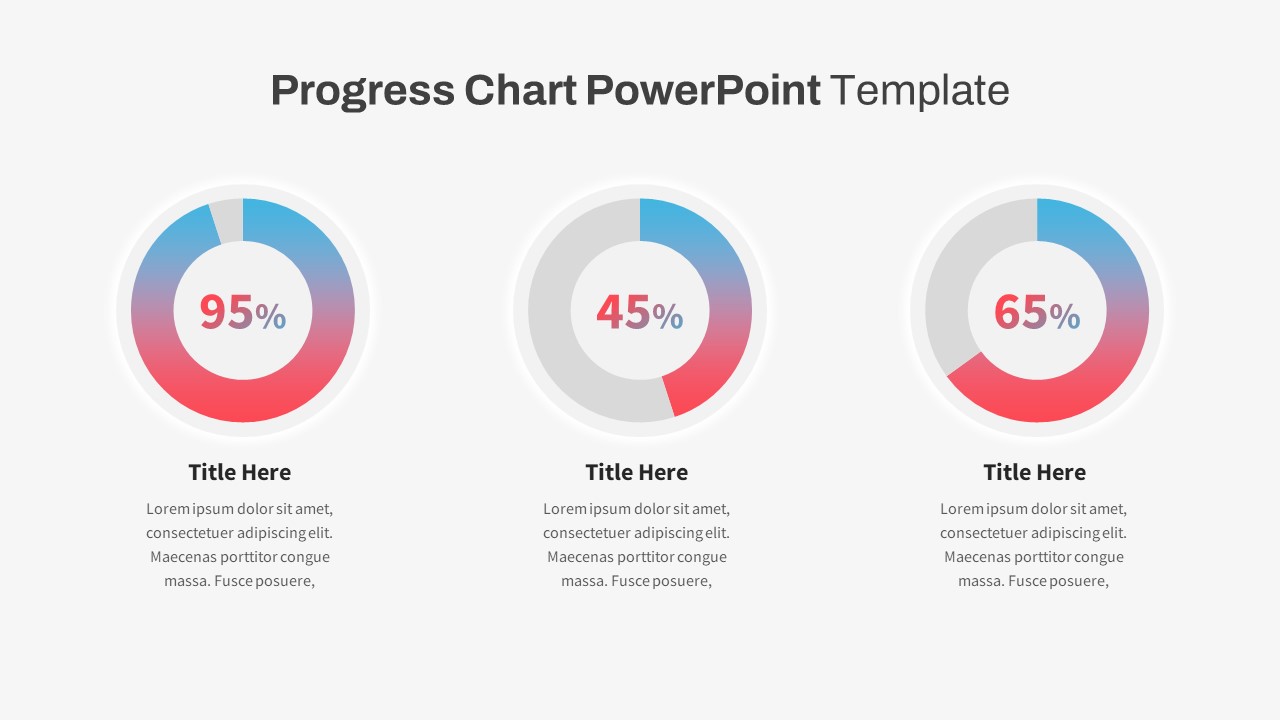
Progress Chart PowerPoint Template
PowerPoint Templates
Premium
-

Proportional Area Chart PowerPoint Template
PowerPoint Templates
Premium
-

Clustered Column Chart PowerPoint Template
PowerPoint Charts
Premium
-

Free Teacher’s Week Plan PowerPoint Template
PowerPoint Templates
Free
-
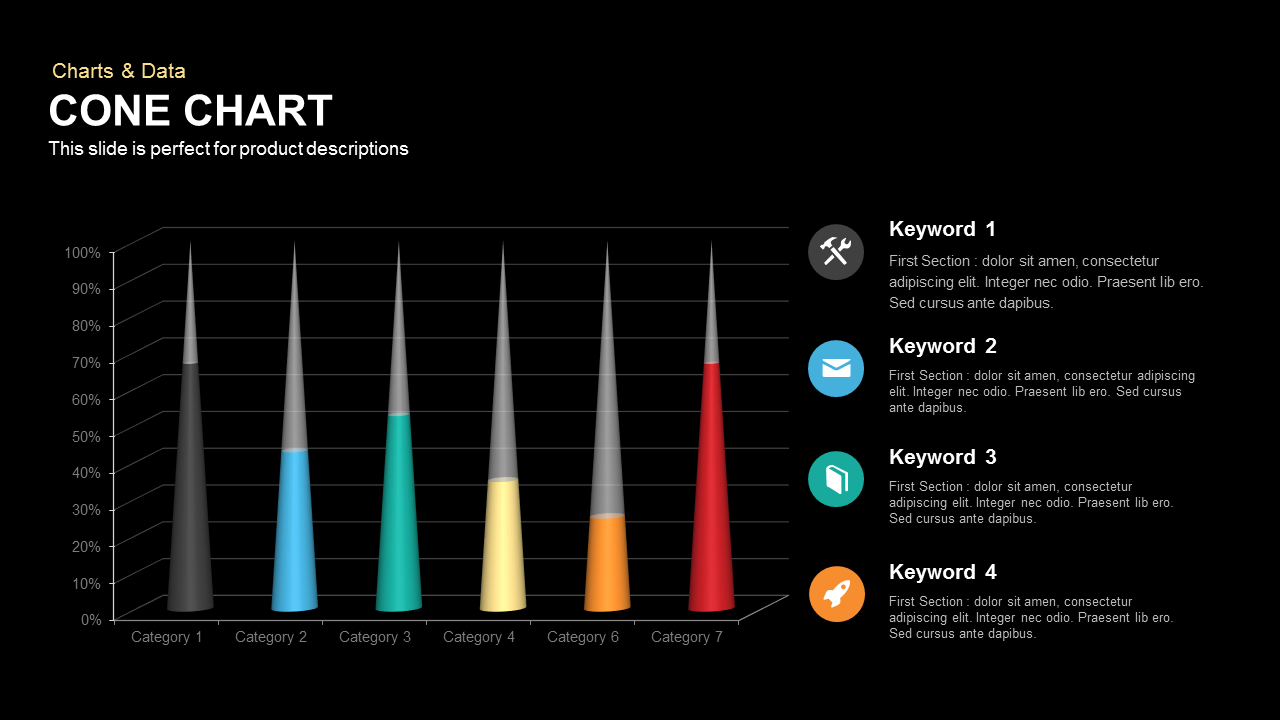
Cone Chart PowerPoint Template
Column and Bar chart
Premium
-
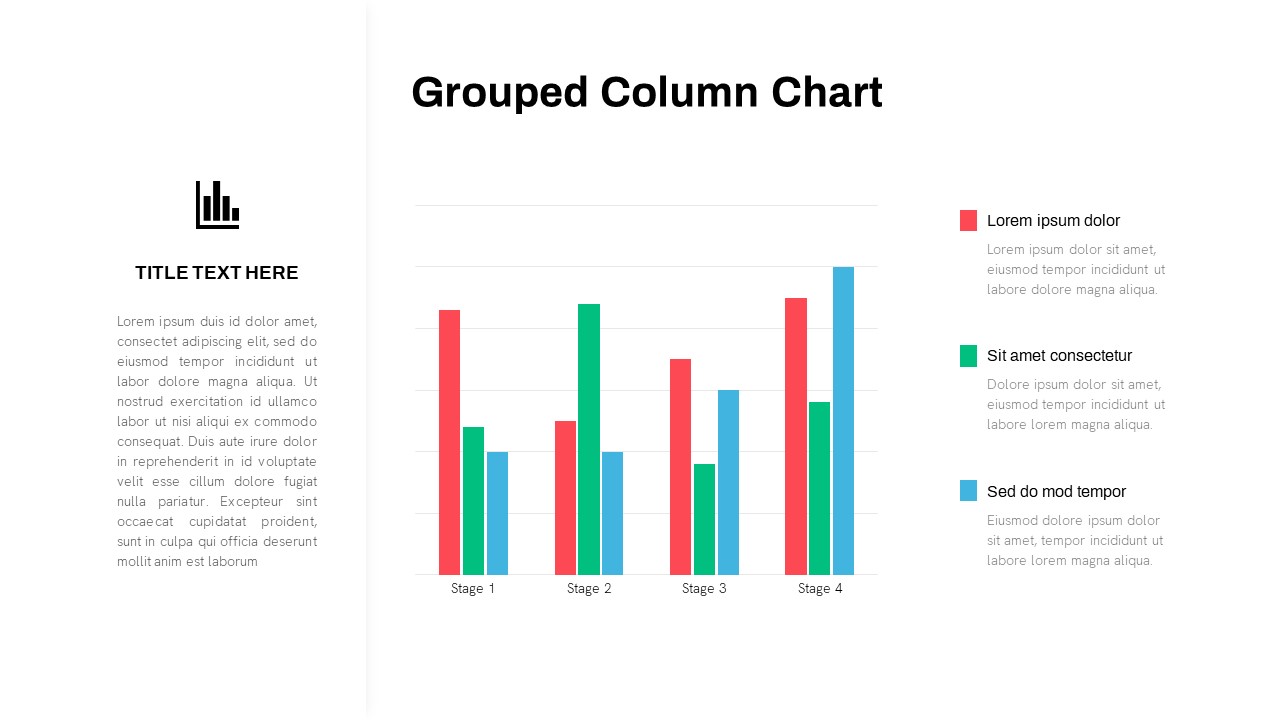
Grouped Column Chart PowerPoint Template
Column and Bar chart
Premium
-

Mekko Chart Template
PowerPoint Templates
Premium
-
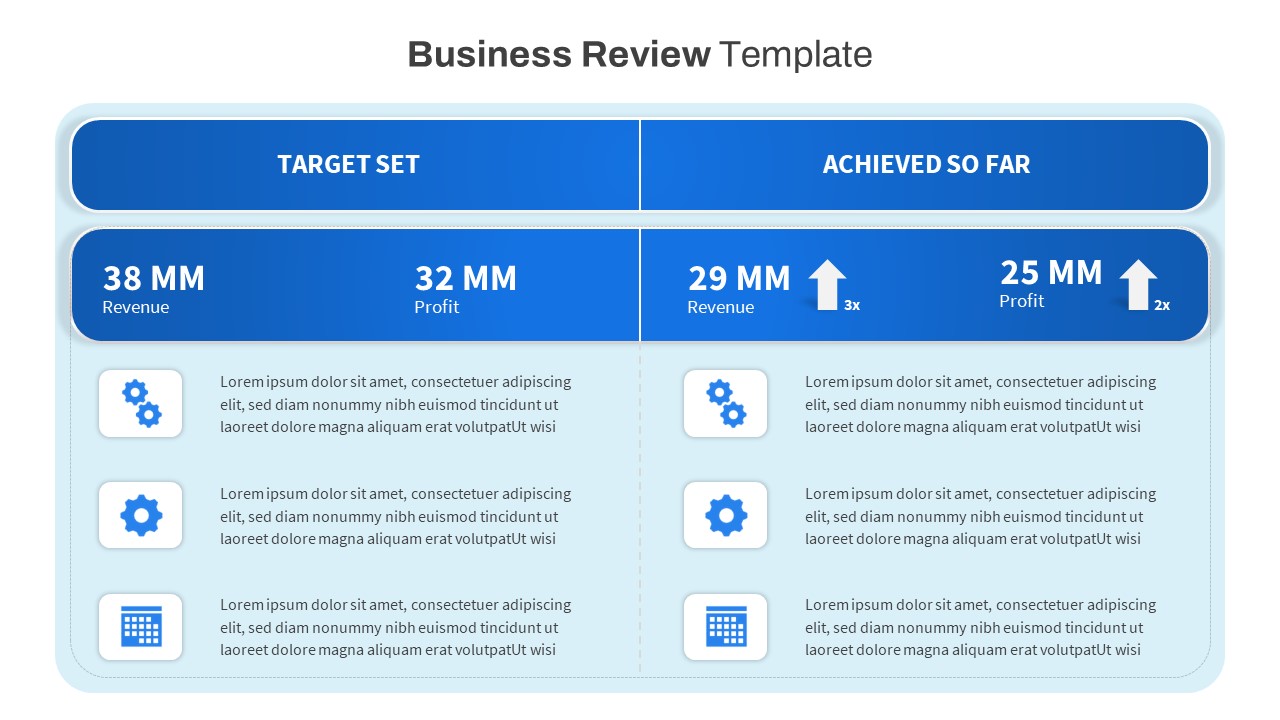
Free Business Review PowerPoint Template
Free PowerPoint Templates
Free
-

Case Study PowerPoint and Keynote Template
PowerPoint Templates
Premium
-
Sun Burst Chart PowerPoint Template
Circular Diagrams
Premium
-
Split Representation Donut Chart Template for PowerPoint and Keynote
Keynote Templates
Premium
-

Business Case PowerPoint Presentation Template
PowerPoint Business Templates
Premium
-
Free PowerPoint Book Template
Free slides
Free
-

Disaster Management Template
PowerPoint Templates
Premium
-

Power Analogy Metaphor PowerPoint Template
Metaphor, Simile & Analogy
Premium
-
Market Research PowerPoint Template Free
PowerPoint Templates
Free