


Free Stacked Column Chart Template Dark
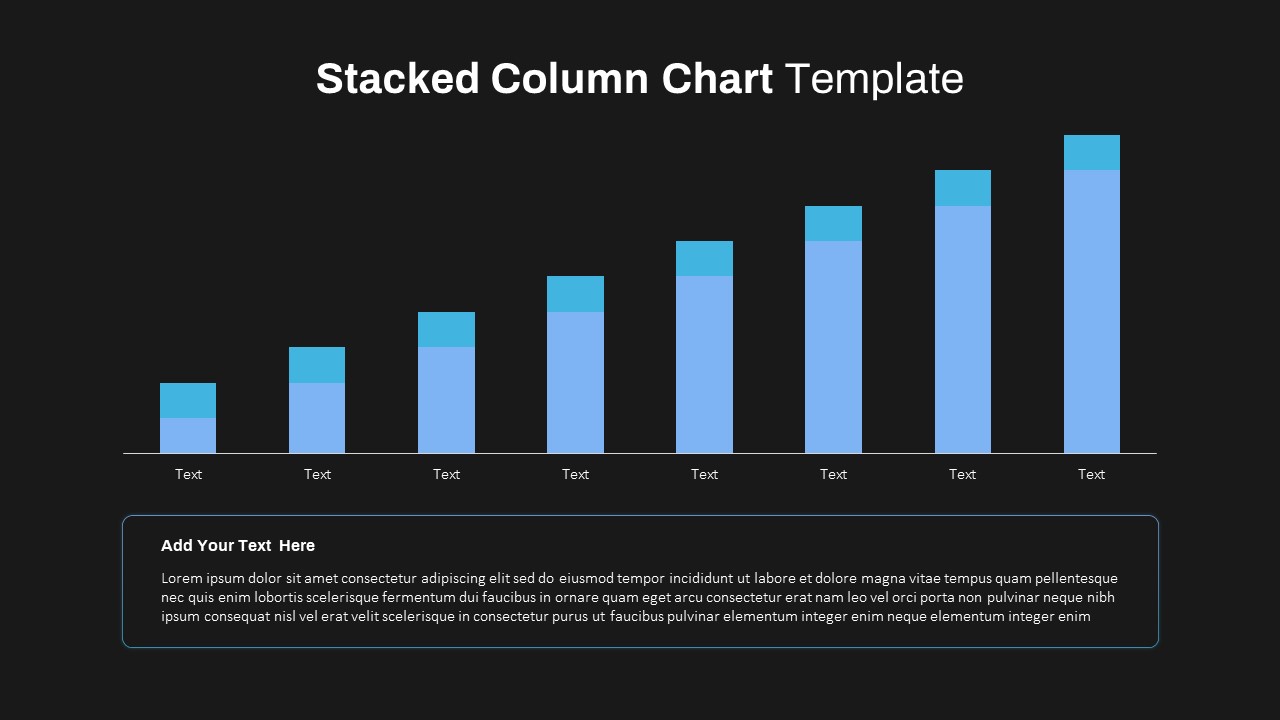
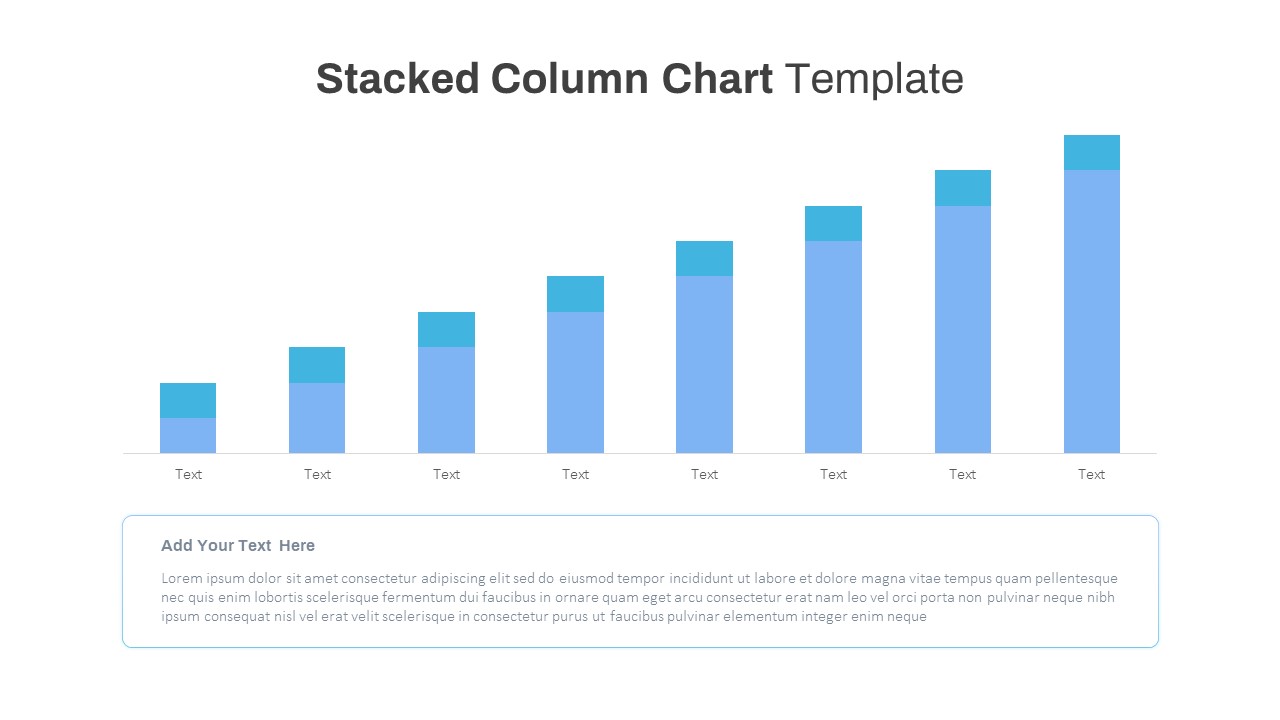
The Stacked Column Chart template is a powerful tool for presenting annual business reviews and reports with statistical data. This professional PowerPoint template offers a structured theme that enhances the illustration of business reports, research outcomes, and academic themes. In addition, its data-driven infographic provides a visually appealing and easy-to-understand representation of complex information. Whether you need to showcase sales figures, market trends, or any other data-driven insights, this column and bar chart template offers a comprehensive solution to communicate your message effectively. This is a PowerPoint bar chart in blue and green tones that separates two sets of data in comparison with the help of a stacked column chart template. The stacked column chart template for PowerPoint presentations is an ideal choice for showcasing sequential events or processes in a step-by-step manner. While primarily designed for statistical data, this versatile bar chart template also enables the display of process development in sequential order. It perfectly suits the representation of an eight-step process in business management systems, allowing you to present the stages in ascending order. With its intuitive design and clear visual representation, this template effectively conveys complex information and facilitates a comprehensive understanding of the process flow. However, it more suitable to show numerical data for quantitative research topics. The stacked column chart template for PowerPoint offers a visually appealing way to present data with its eight bars displayed in a two-tone color mix. This unique design allows the presenter to showcase two variables within a single bar, enhancing clarity and comprehension. This user-friendly template is equally suitable for educational or academic PowerPoint presentations. It provides flexibility with two background color options, enabling you to pick the one that best fits your content. Additionally, the template allows for easy customization in terms of size, color, and background, ensuring a personalized and engaging visual experience.