


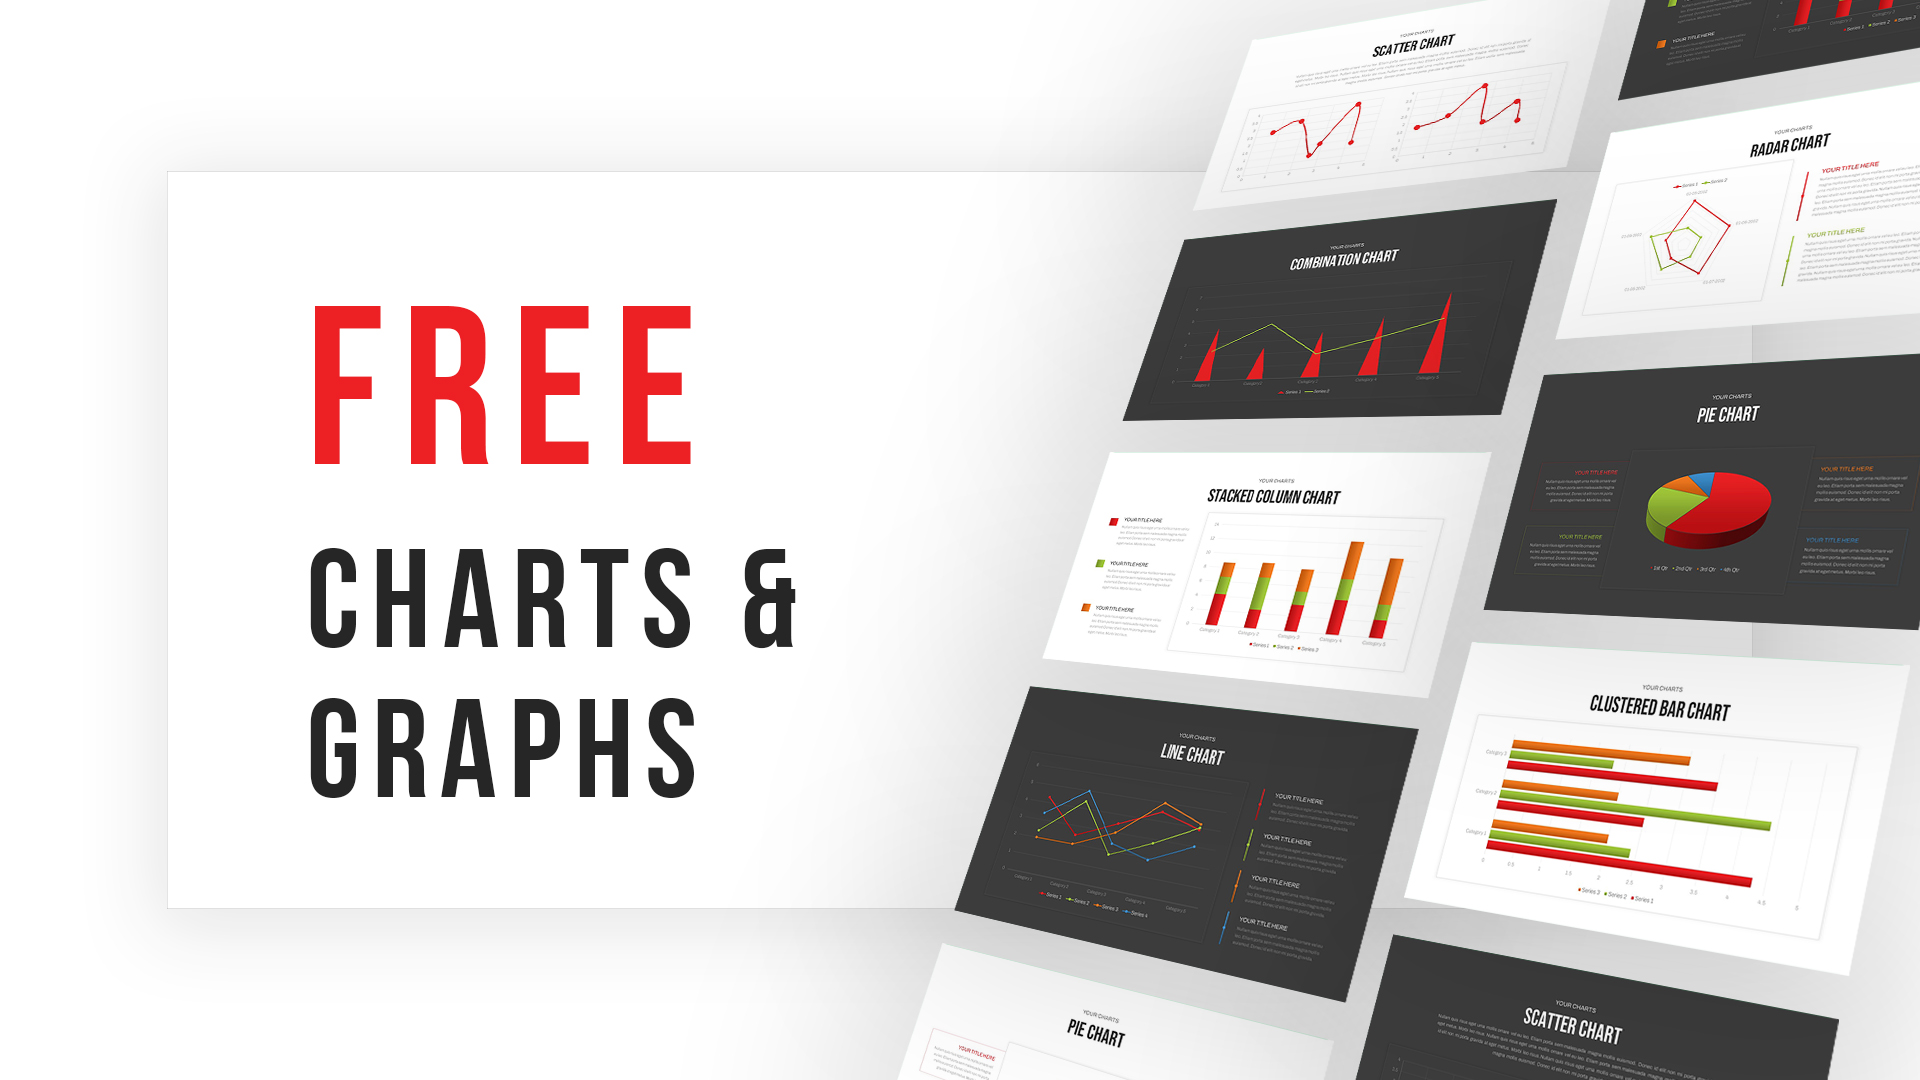
Free Charts and Graphs PowerPoint Template


- Version
- Download 663
- File Size 0.00 KB
- File Count 1
- Create Date December 24, 2023
- Last Updated December 14, 2023
Free Charts and Graphs PowerPoint Template
Create statistical presentation with our free charts and graphs PowerPoint
Access a wide variety of charts and graphs free for PowerPoint presentation. This free presentation deck model enables you to present financial projections, research outcomes, budget overviews, comparisons, and both qualitative and quantitative aspects of any data. Using a data-driven template will add a mathematical and factual touch to your business and academic slideshows. The free charts and graphs PowerPoint has a variety of visual diagrams that you may have learned in your school days. Elevate your presentation to new heights with these free statistical diagrams.
Free charts and graphs templates allow you to display financial trends, project timelines, or survey results. These editable charts have different purposes according to your data set. So, thoughtfully use each one that permeates data with compatibility.
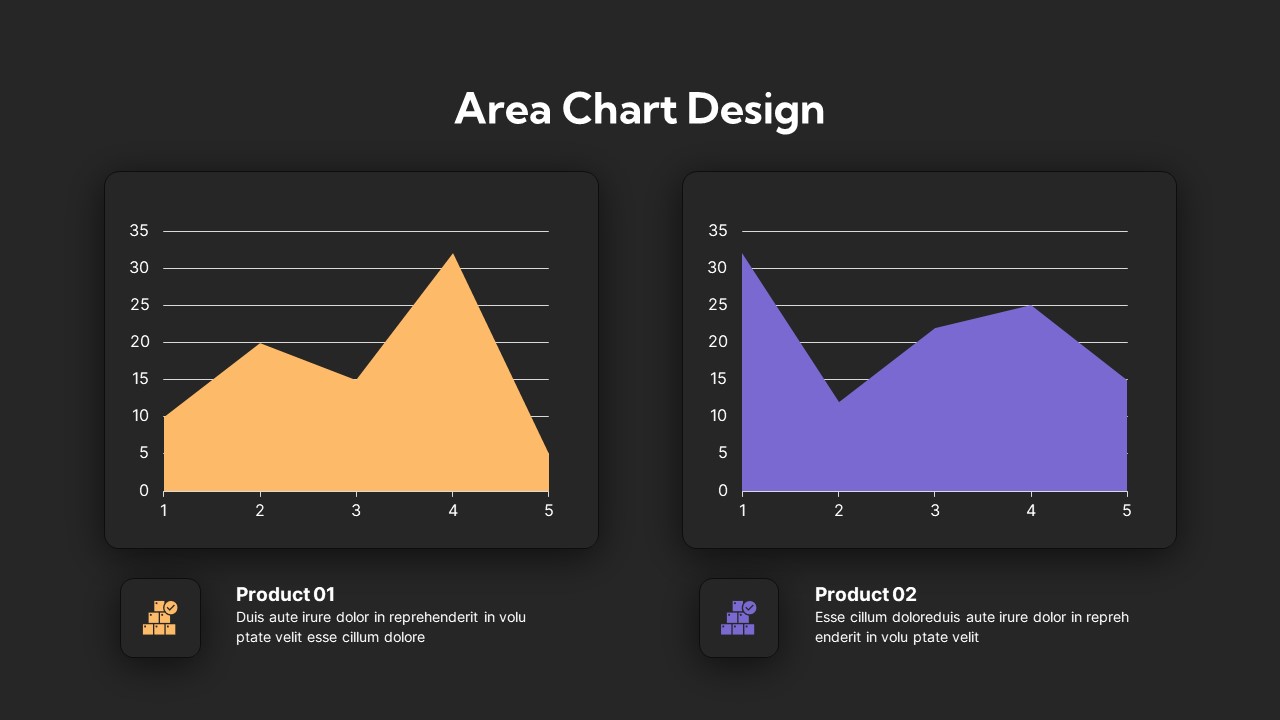
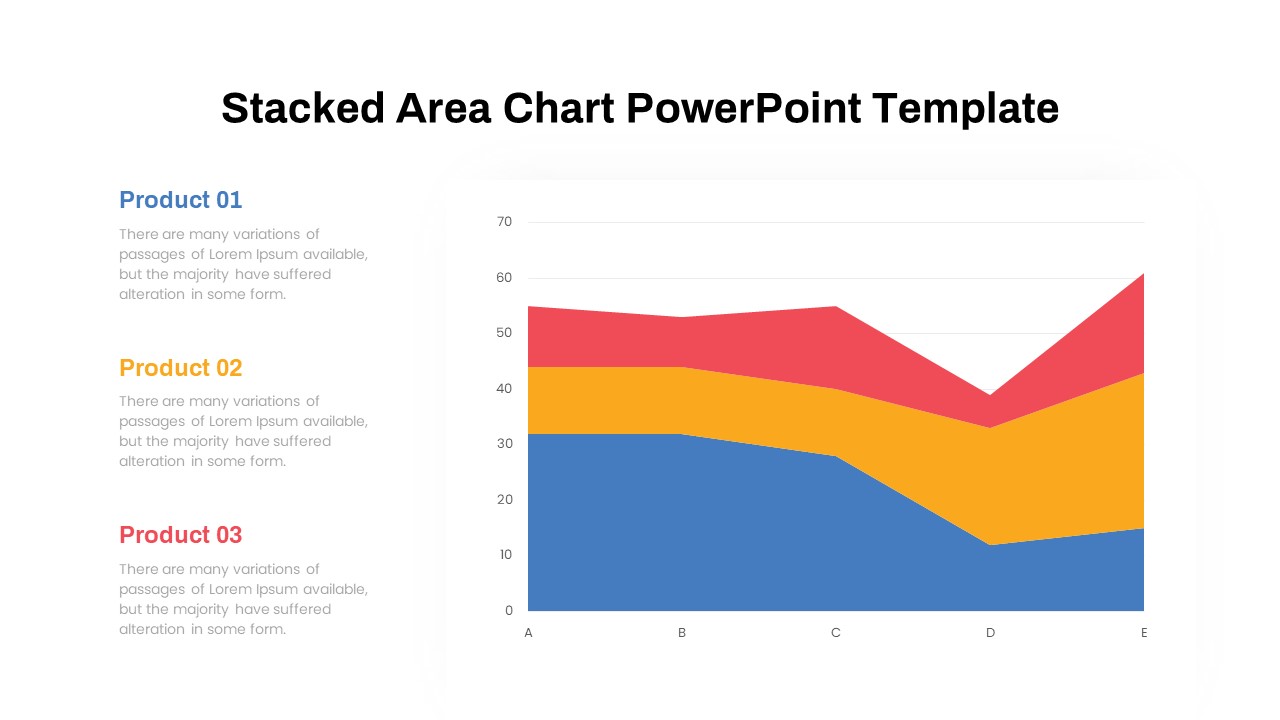
What is an area chart?
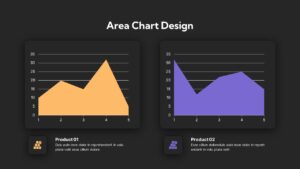
An area chart visually represents data trends by displaying the cumulative total of values over a continuous interval. It consists of a series of data points connected by lines, and the area between the lines and the axis is filled to emphasize the magnitude of change. In contrast to a line graph that focuses on individual data points and their connections, an area chart emphasizes the overall magnitude of values, making it particularly useful for illustrating cumulative trends and highlighting patterns in data distribution.
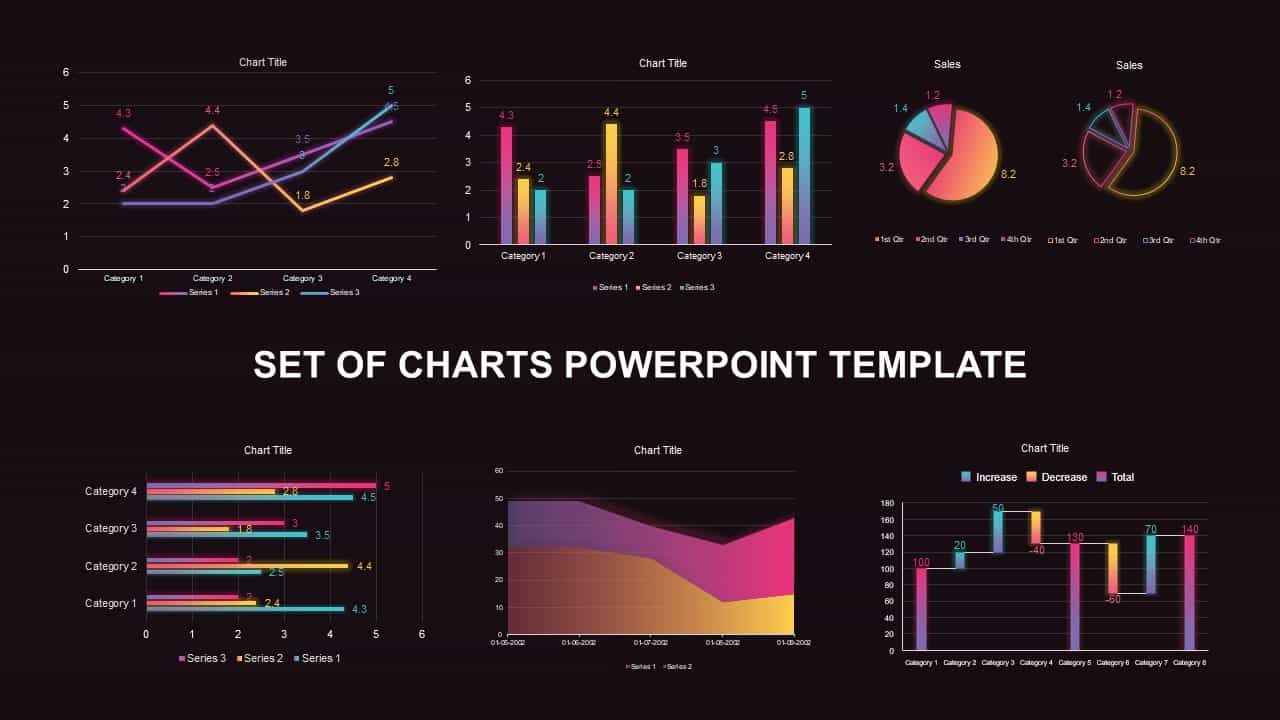
The free charts and graphs template for PowerPoint contains 7 different data-driven charts in black and white options. So, it has 15 slides including the title page. Below you can see the charts and graphs for an easy overview of the set:
- Cover slide
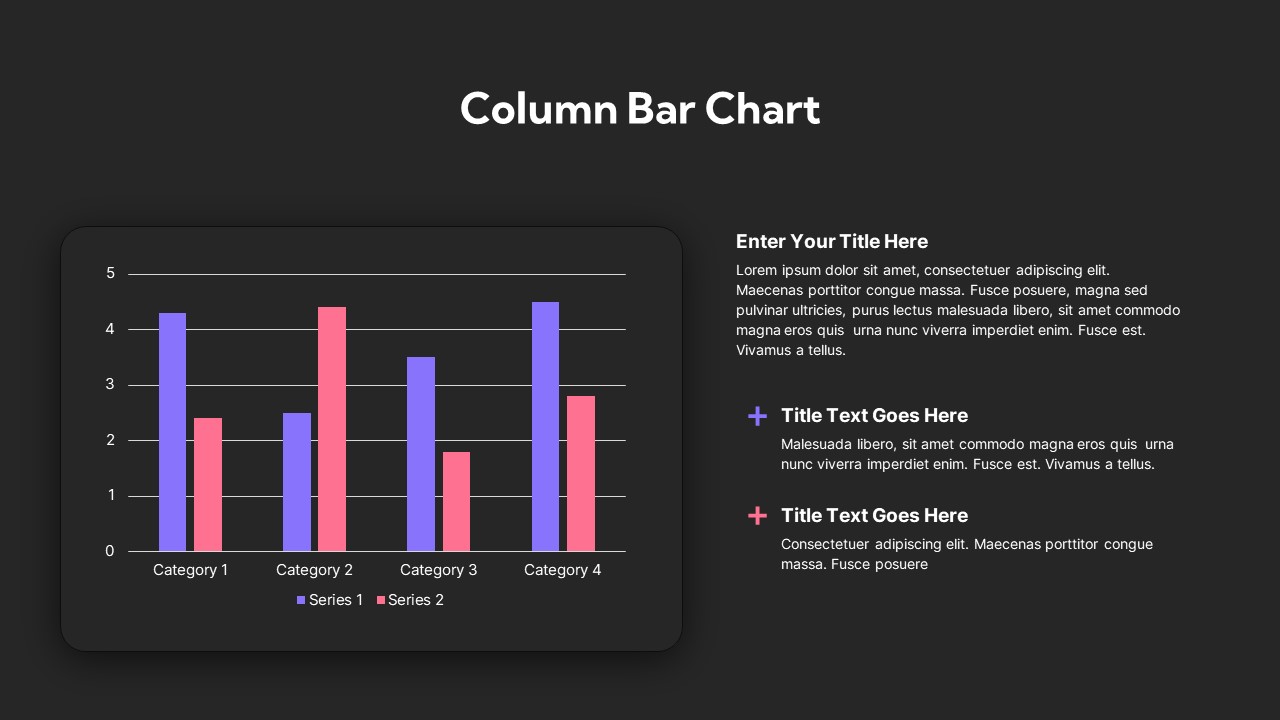
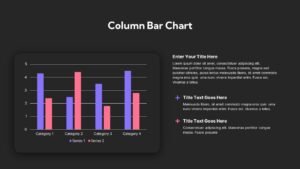
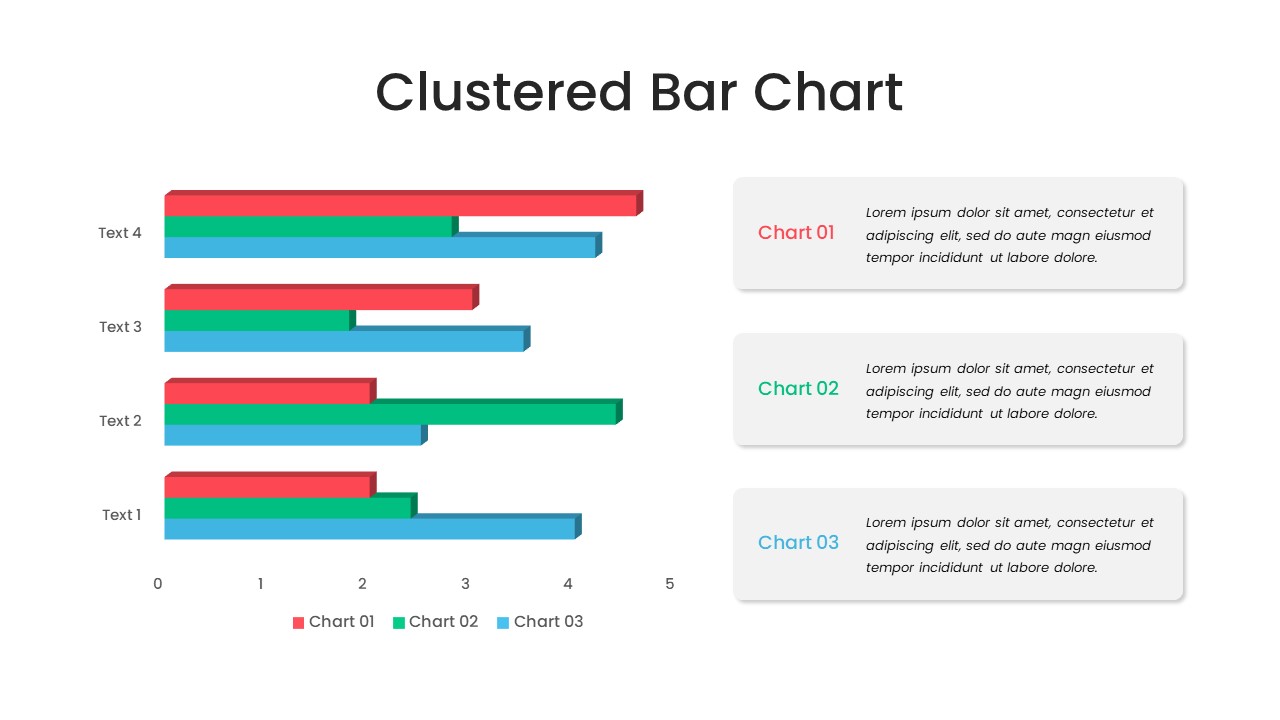
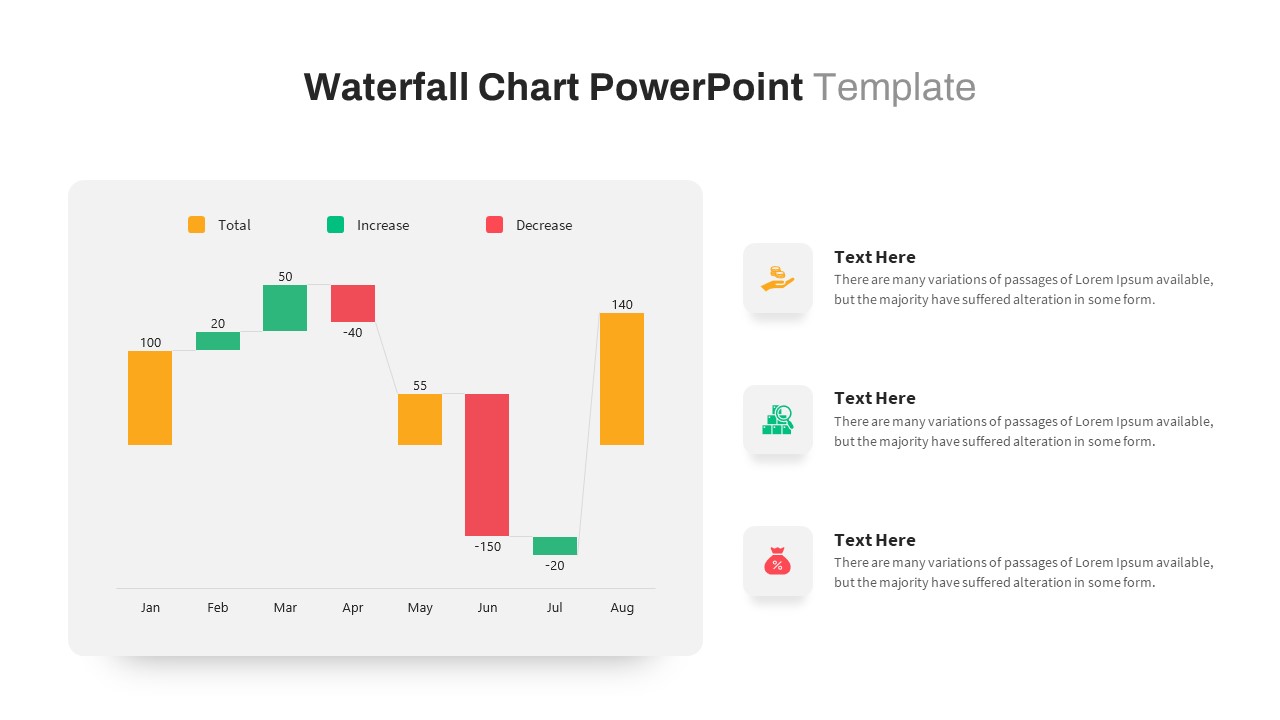
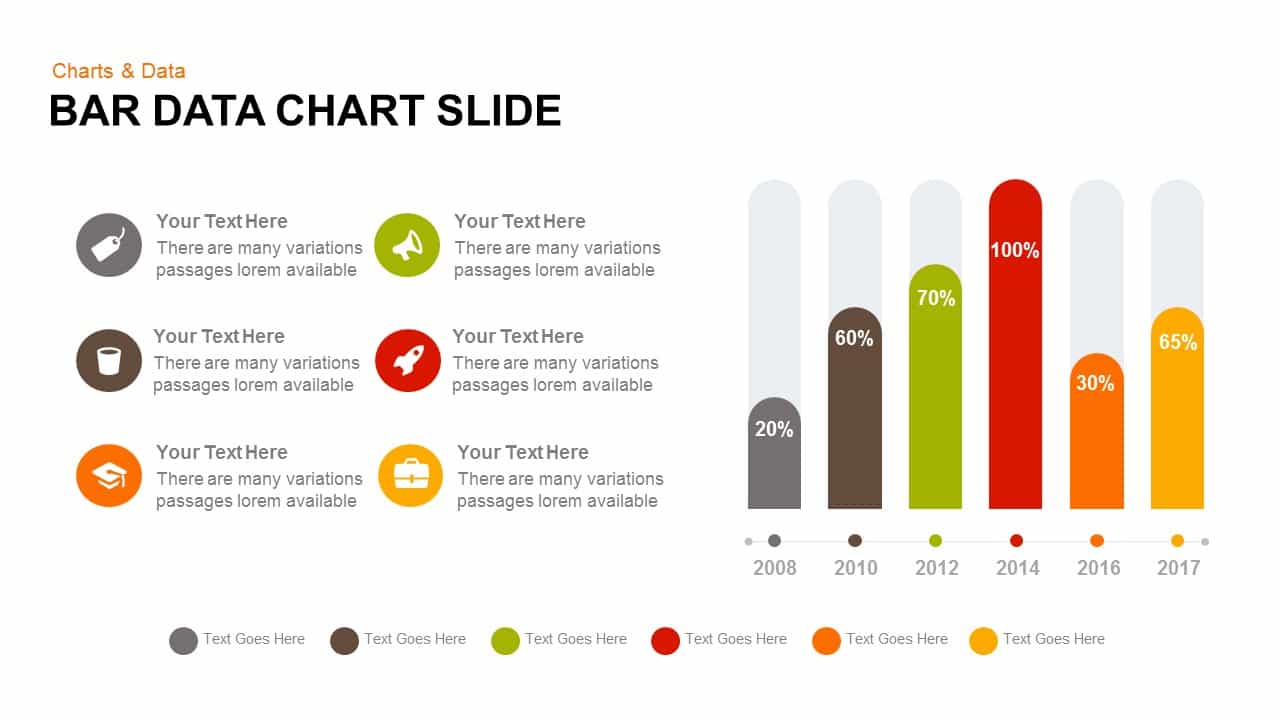
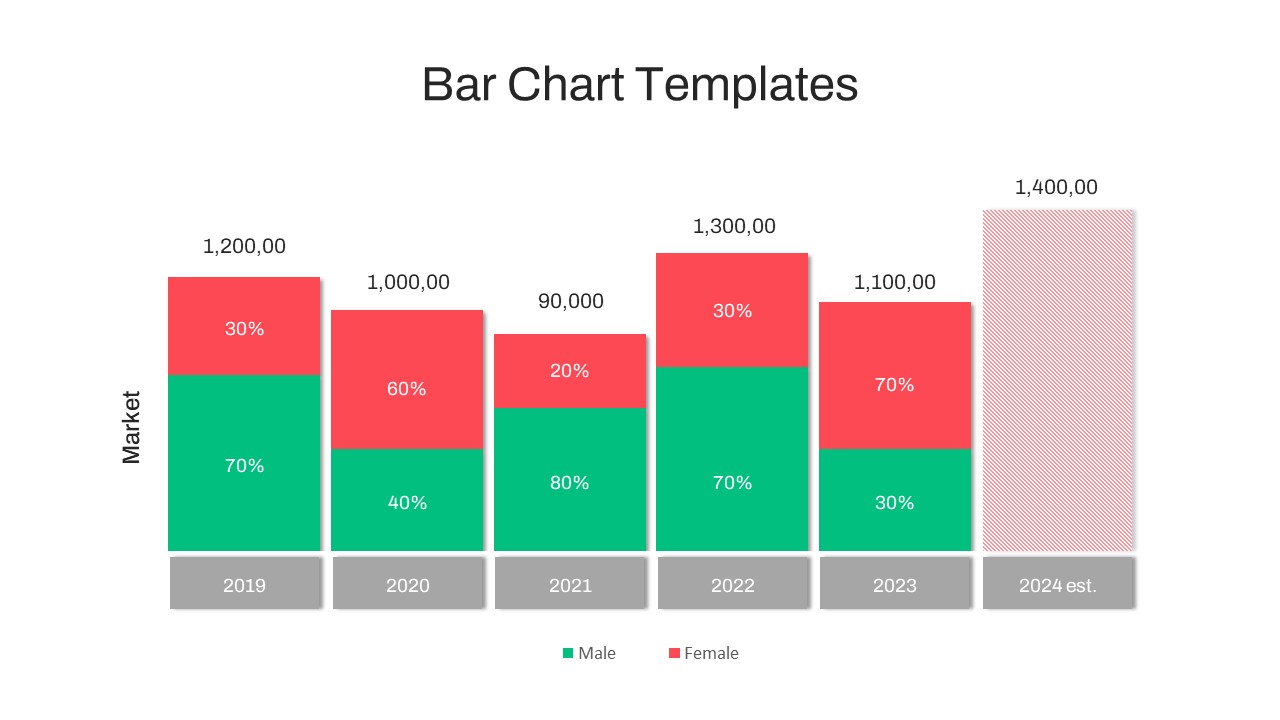
- Column bar chart – it displays data using vertical bars
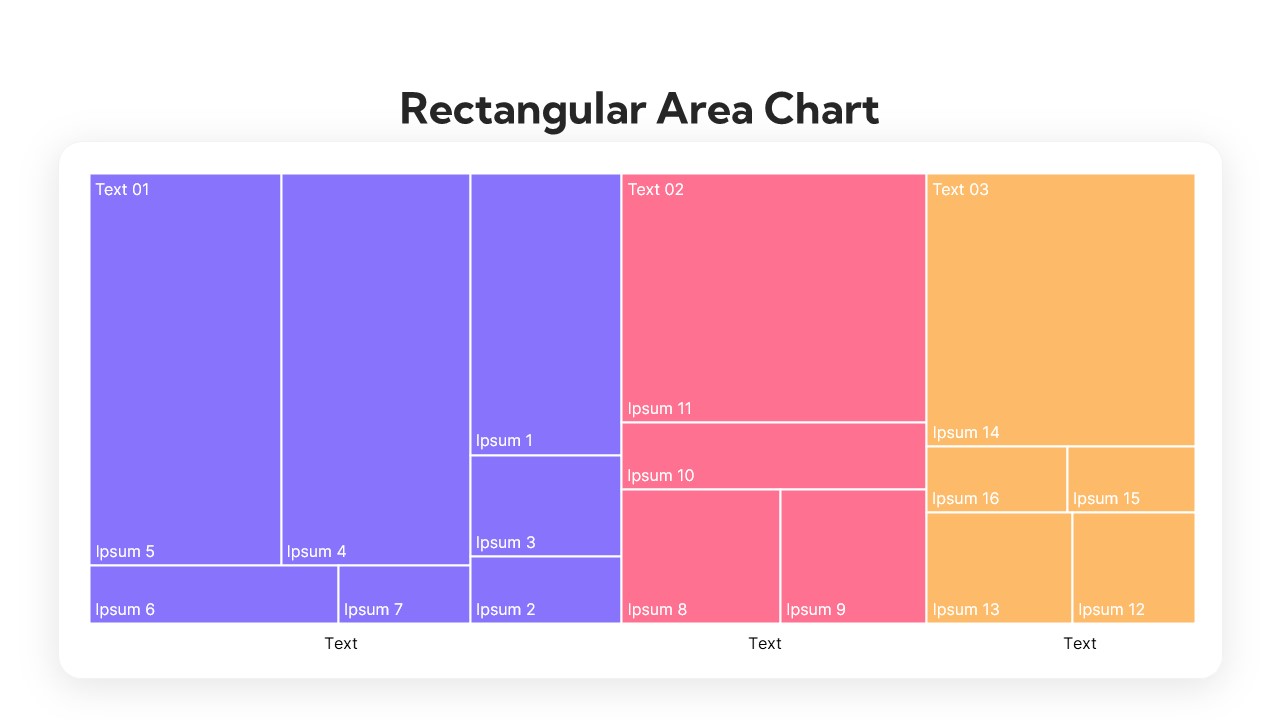
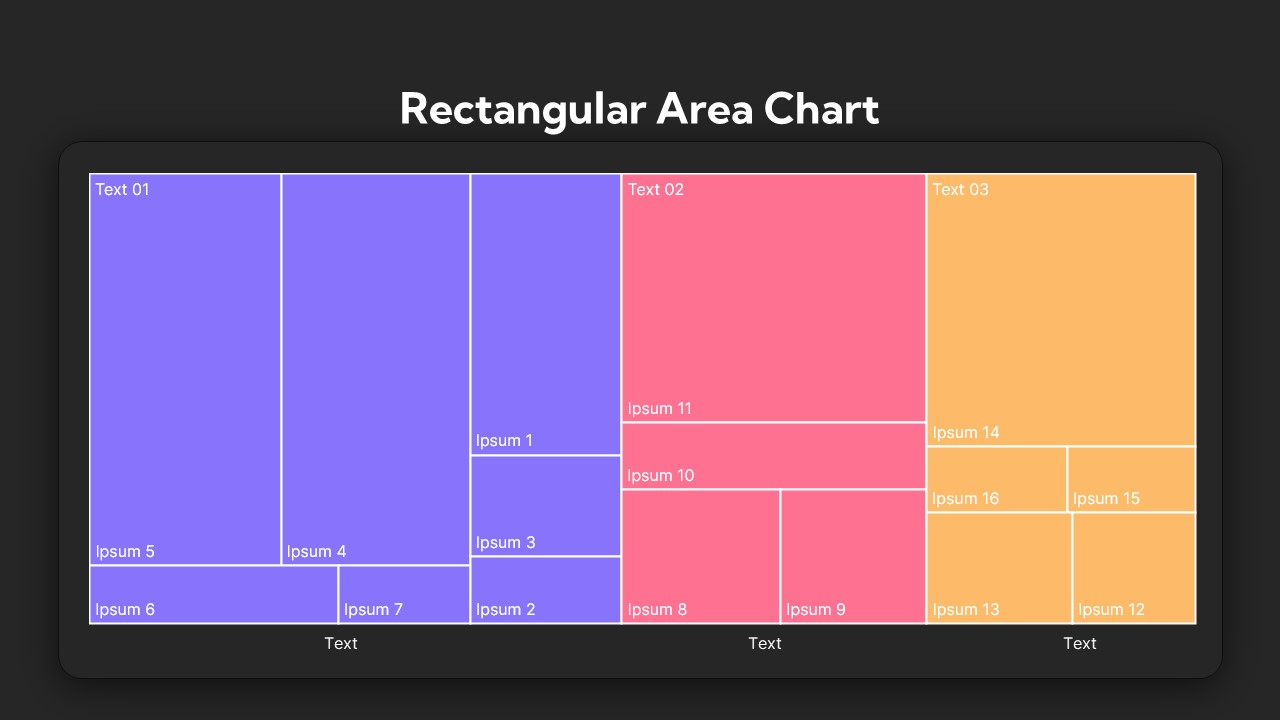
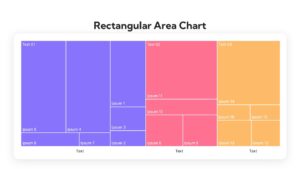
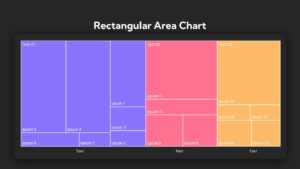
- Rectangular area chart – shows data in column designs
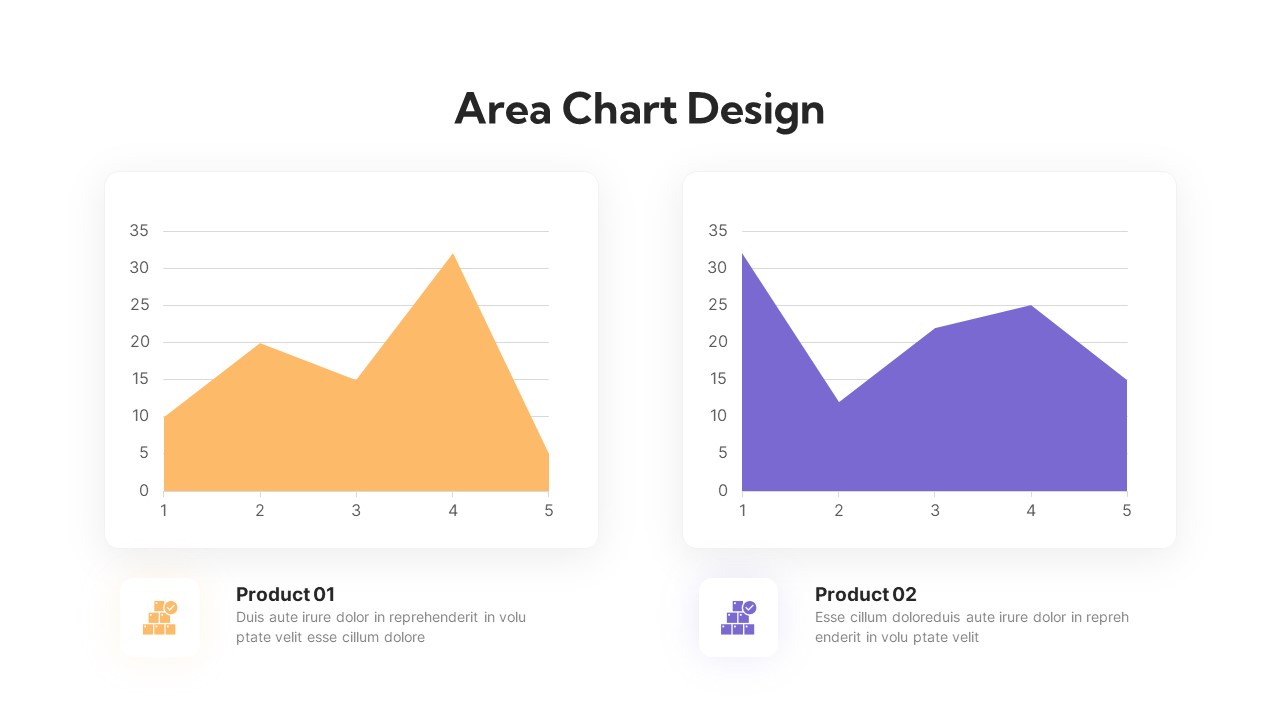
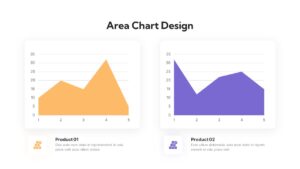
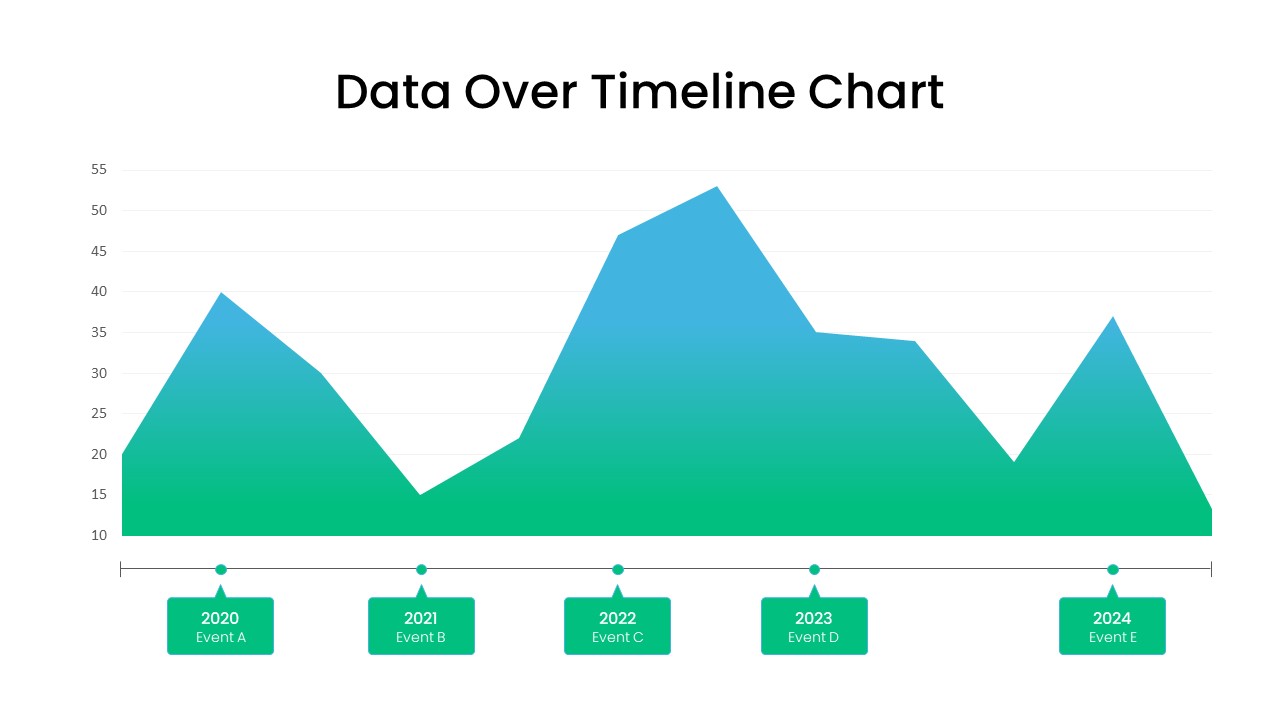
- Area chart design – it visually depicts quantitative data using filled areas between lines and highlights overall trends
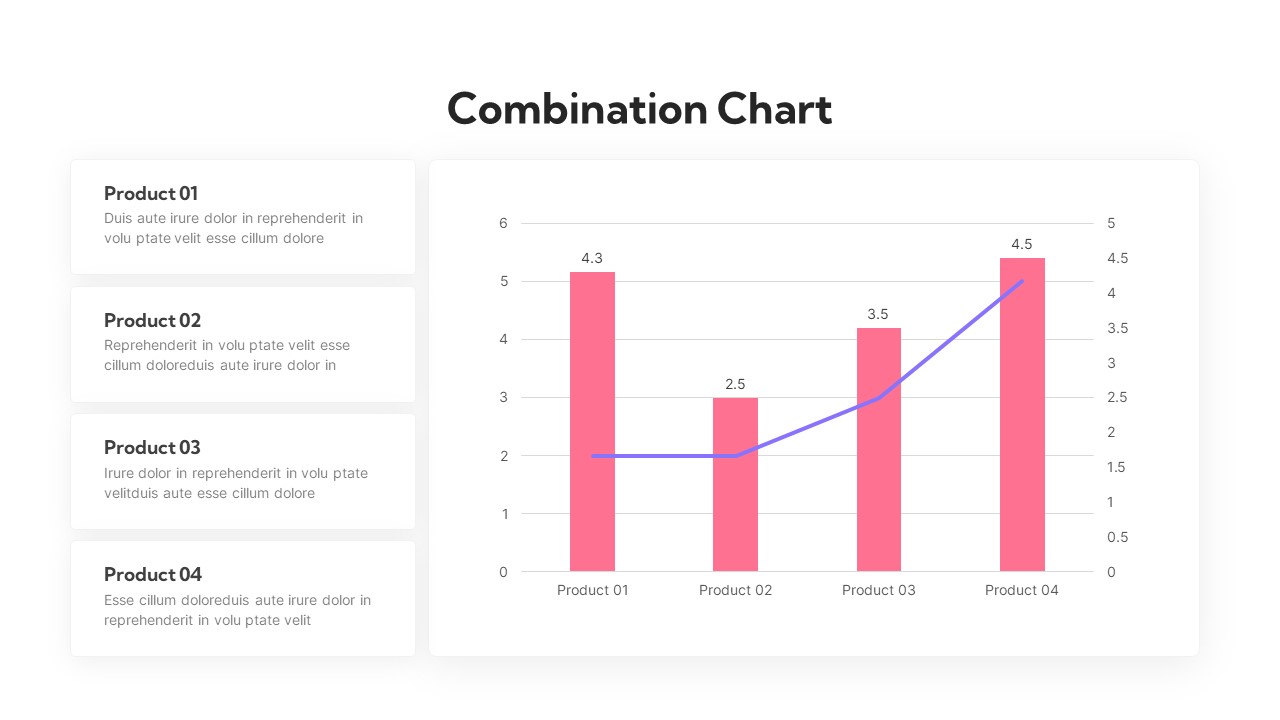
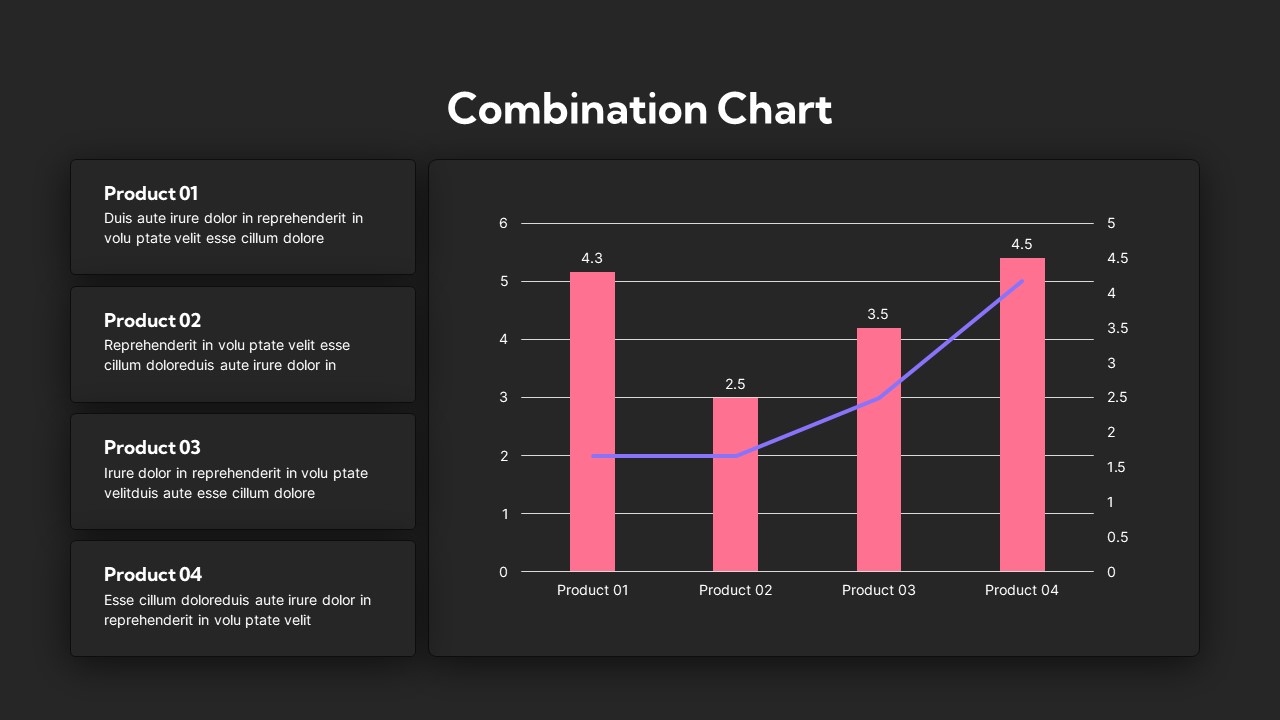
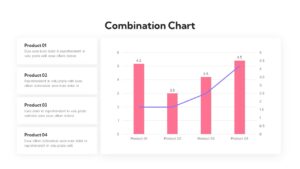
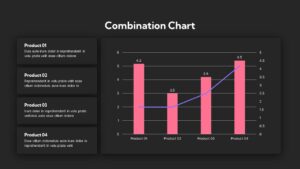
- Combination chart features a line graph and a bar chart
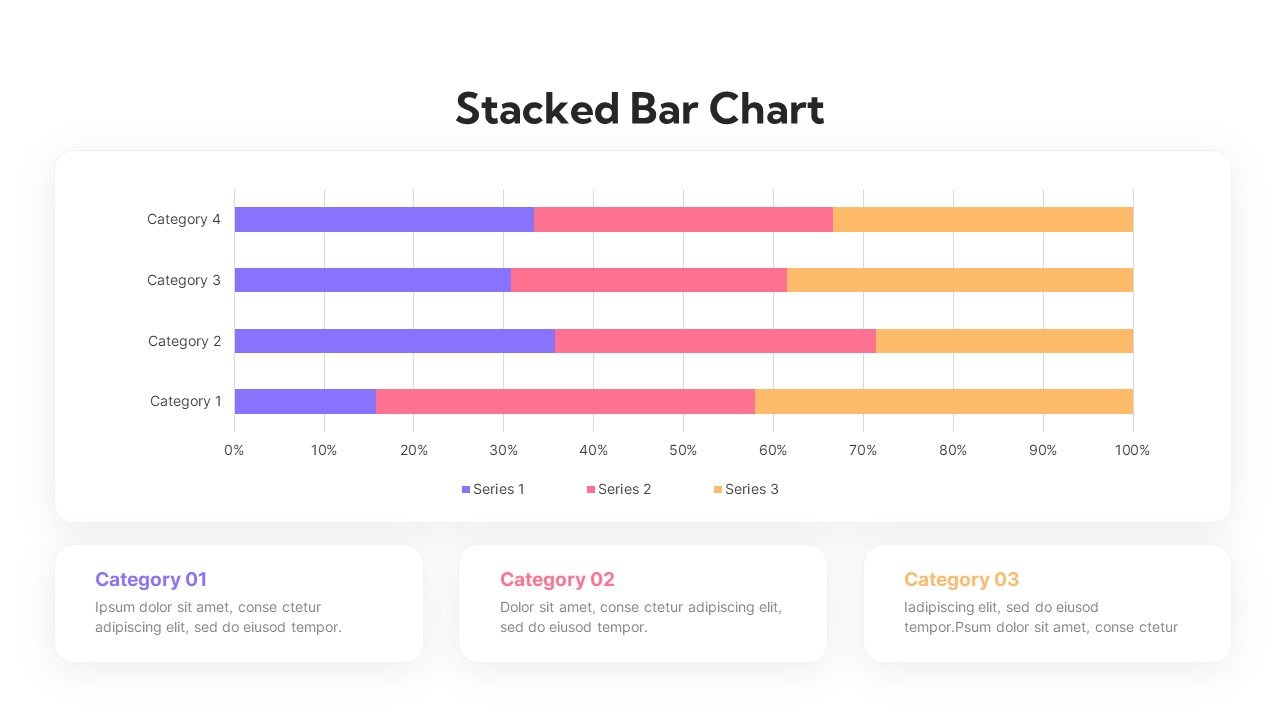
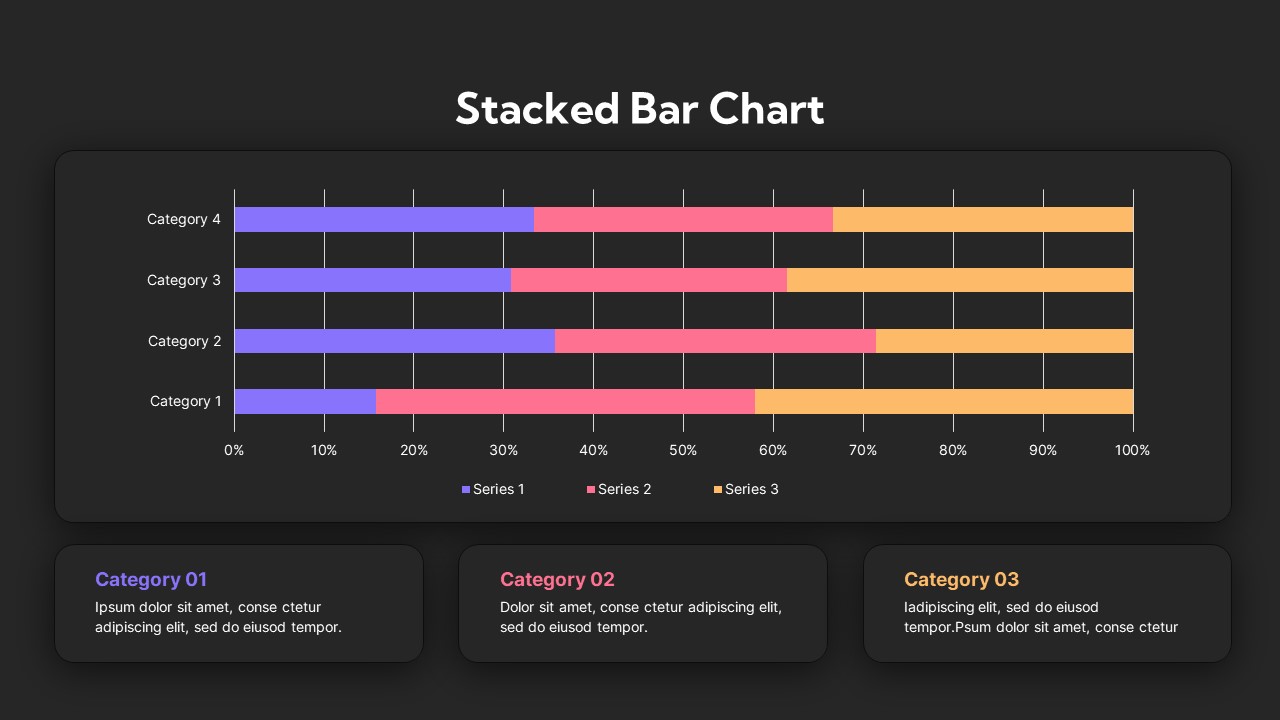
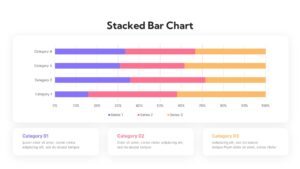
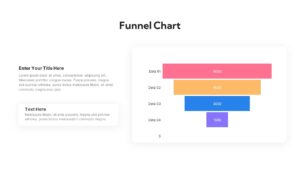
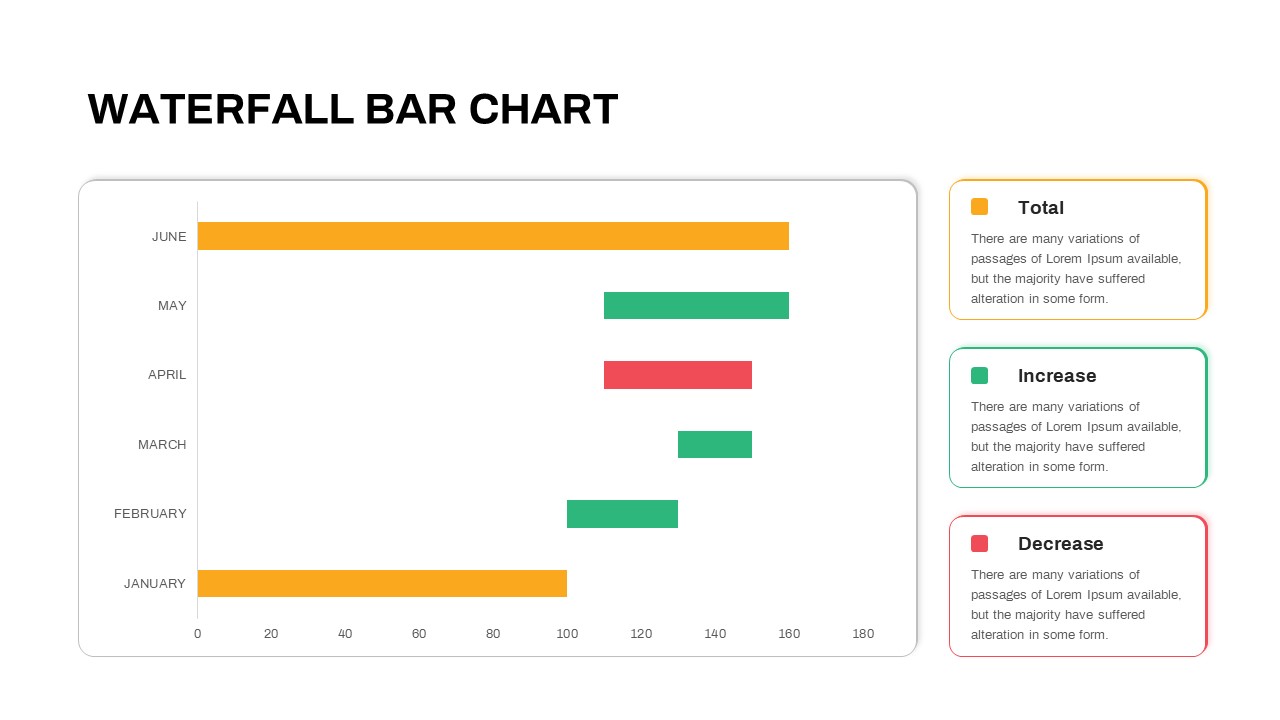
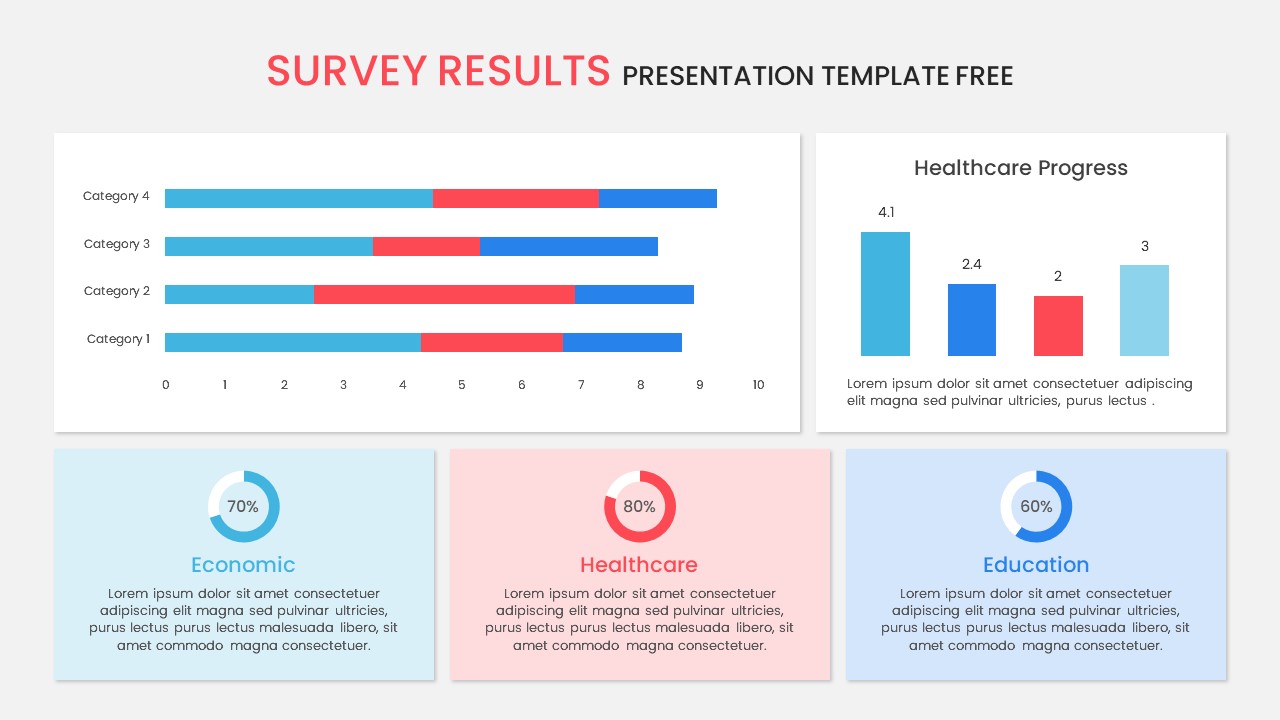
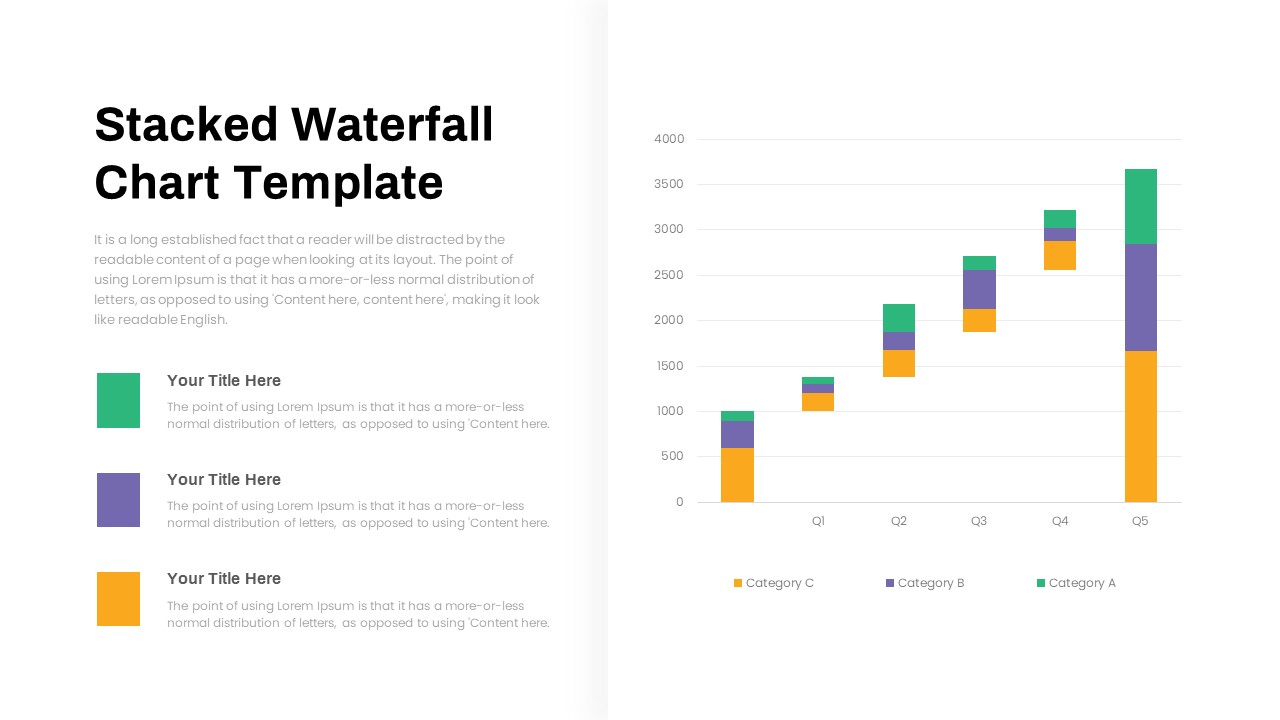
- Stacked bar chart – It displays data with horizontal bars representing categories, stacked to show the cumulative contribution of each sub-category.
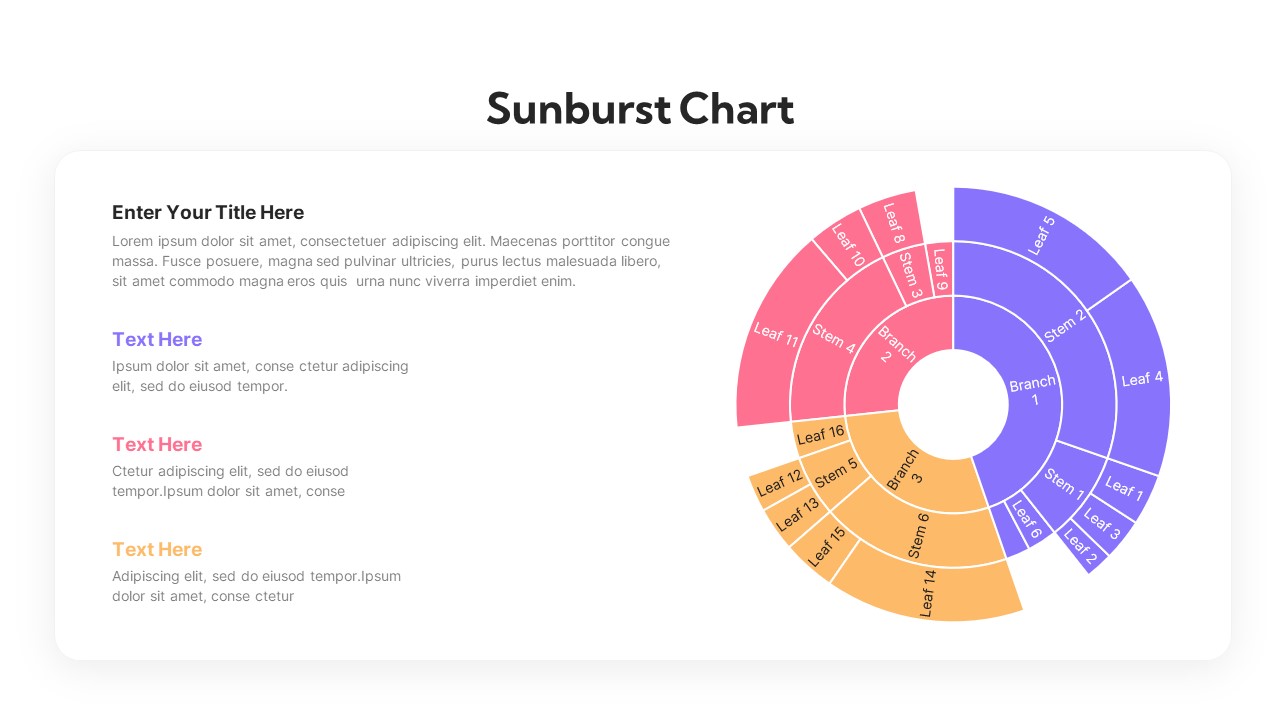
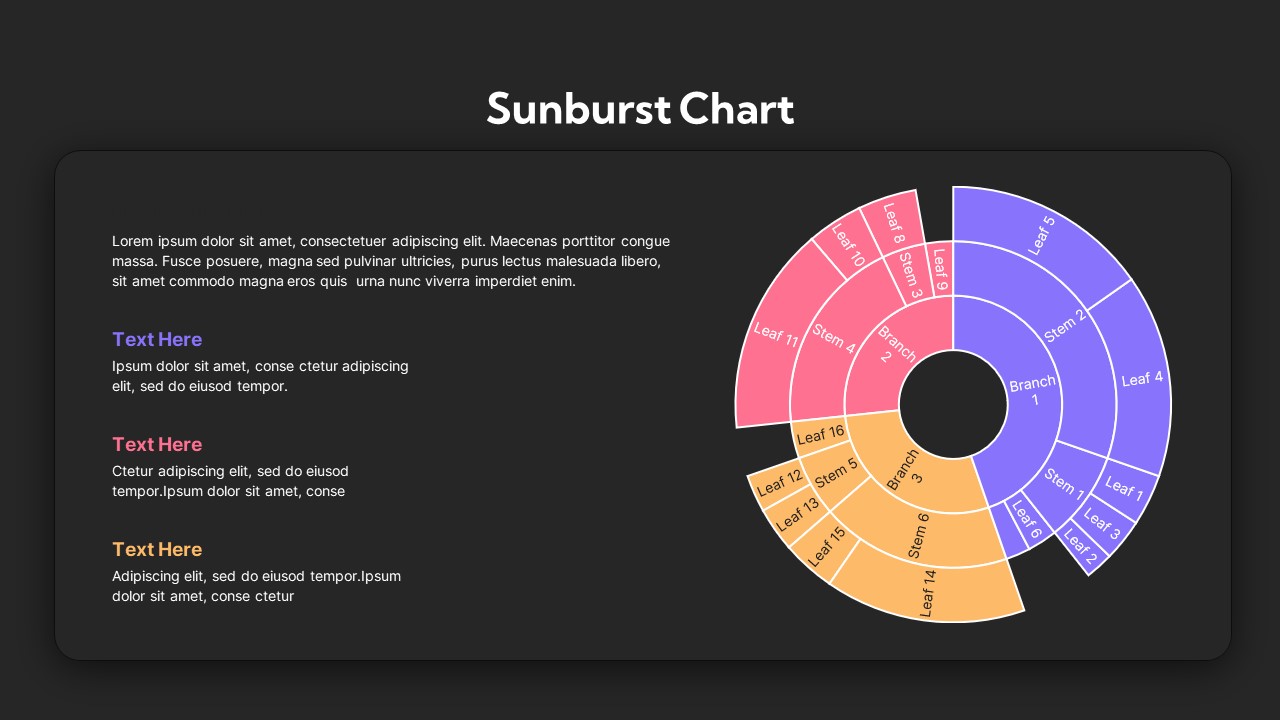
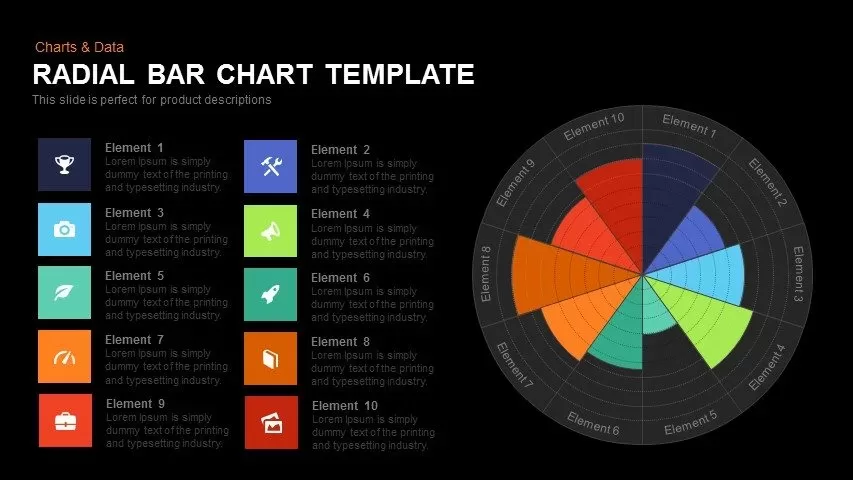
- Sunburst chart – It is a radial diagram that presents hierarchical data using nested rings, revealing relationships and proportions in a circular visualization.
The graphs and charts free PowerPoint template offers the best collection of statistical diagrams. The users can make statistical presentations with our free charts and graphs PowerPoint. Also, check out our premium and free graphs and charts.
Attached Files
| File | Action |
|---|---|
| https://slidebazaarfreedownloads.s3.amazonaws.com/SB03897-Free Charts and Graphs PowerPoint Template.ZIP | Download |
Login to download this file
Add to favorites
Add to collection
-

Item ID
SB03897 -

Related Templates
-

Sales Deck Free PowerPoint Template
PowerPoint Templates
Free
-

Nature PowerPoint Presentation Template
PowerPoint Business Templates
Premium
-

Free Vertical PowerPoint Template
PowerPoint Business Templates
Free
-

Cab Service PowerPoint Template
PowerPoint Templates
Premium
-

Free Nursing Capstone PowerPoint Deck
PowerPoint Templates
Free
-

Research Proposal PowerPoint Template
PowerPoint Templates
Premium
-

Free Space Minimal Deck Template
PowerPoint Templates
Free
-

Free Physical Education PowerPoint Template Deck
Free PowerPoint Templates
Free
-

Gym PowerPoint Template
PowerPoint Templates
Premium
-

VET Clinic PowerPoint Template
PowerPoint Templates
Premium
-

Travel Agency PowerPoint Template
PowerPoint Templates
Premium
-
Free Charts & Graphs Deck PowerPoint Template
PowerPoint Templates
Free
-

IoT Presentation Template
PowerPoint Templates
Premium
-

Effective Communication PowerPoint Template
PowerPoint Templates
Premium
-

PowerPoint Quiz With Timer
PowerPoint Templates
Premium
-

Graph Paper PowerPoint Template Deck
PowerPoint Templates
Premium
-

Free Aviation PowerPoint Template
Free PowerPoint Templates
Free
-

Area Chart PowerPoint Template
PowerPoint Charts
Premium
-

Macroeconomics PowerPoint Template
PowerPoint Templates
Premium
-

Free Economics PowerPoint Template
Free PowerPoint Templates
Free
-

Pencil Bar Chart PowerPoint Template and Keynote Slide
Column and Bar chart
Premium
-

Free Charity PowerPoint Template Deck
PowerPoint Templates
Free
-
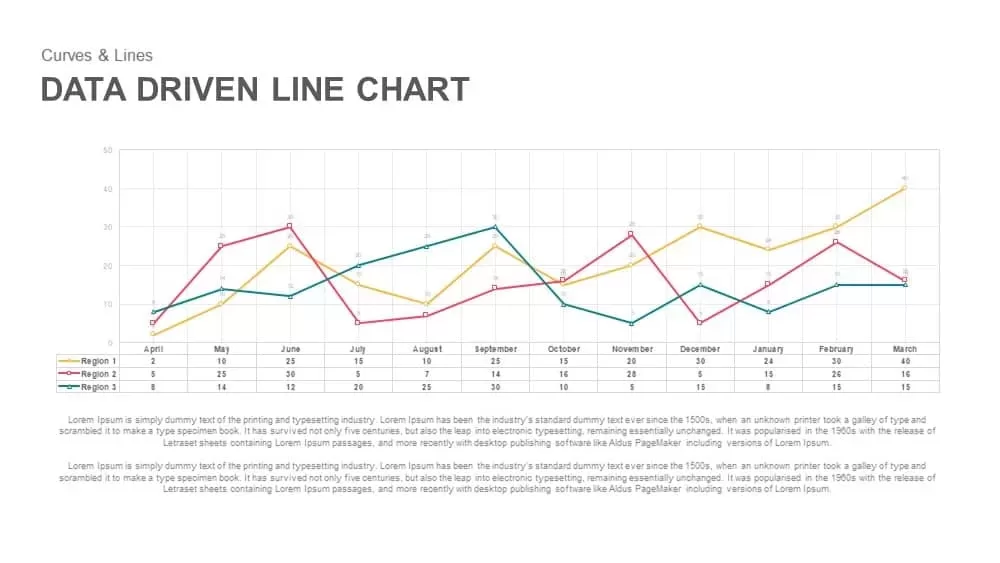
Data Driven Line Chart Template for PowerPoint & Keynote
Curves and Lines
Premium
-

Free Army PowerPoint Template
PowerPoint Templates
Free
-

Annual Report PowerPoint Template and Keynote
PowerPoint Templates
Premium
-

Radial Bar Chart PowerPoint Templates and Keynote Slides
PowerPoint Charts
Premium
-

Customer Experience Loyalty PowerPoint Deck Template
PowerPoint Templates
Premium
-
Waterfall Bar Chart PowerPoint Template
PowerPoint Charts
Premium
-

Free Cartoon PowerPoint Template
Free PowerPoint Templates
Free
-

Free Book Review PowerPoint Template
Free PowerPoint Templates
Free
-

Free Real Estate Listing PowerPoint Template
Free PowerPoint Templates
Free
-

Free University Presentation PowerPoint Template
PowerPoint Templates
Free
-

Creative Bar Chart Data Analysis PowerPoint Template and Keynote
Infographic
Premium
-

Animated Agriculture PowerPoint Deck Template
PowerPoint Templates
Premium
-
Clustered Bar Chart PowerPoint Template
Column and Bar chart
Premium
-

Free Event Planning PowerPoint Template
Free PowerPoint Templates
Free
-
Cylinder Bar Chart PowerPoint Template and Keynote Slide
Column and Bar chart
Premium
-
Simple Bar Chart PowerPoint Template
Column and Bar chart
Premium
-

Clustered Column Chart PowerPoint Template
PowerPoint Charts
Premium
-

Free Dunder Mifflin Paper Company Pitch Deck
Free PowerPoint Templates
Free
-

Animated Clustered Bar Chart PowerPoint Template
PowerPoint Charts
Premium
-
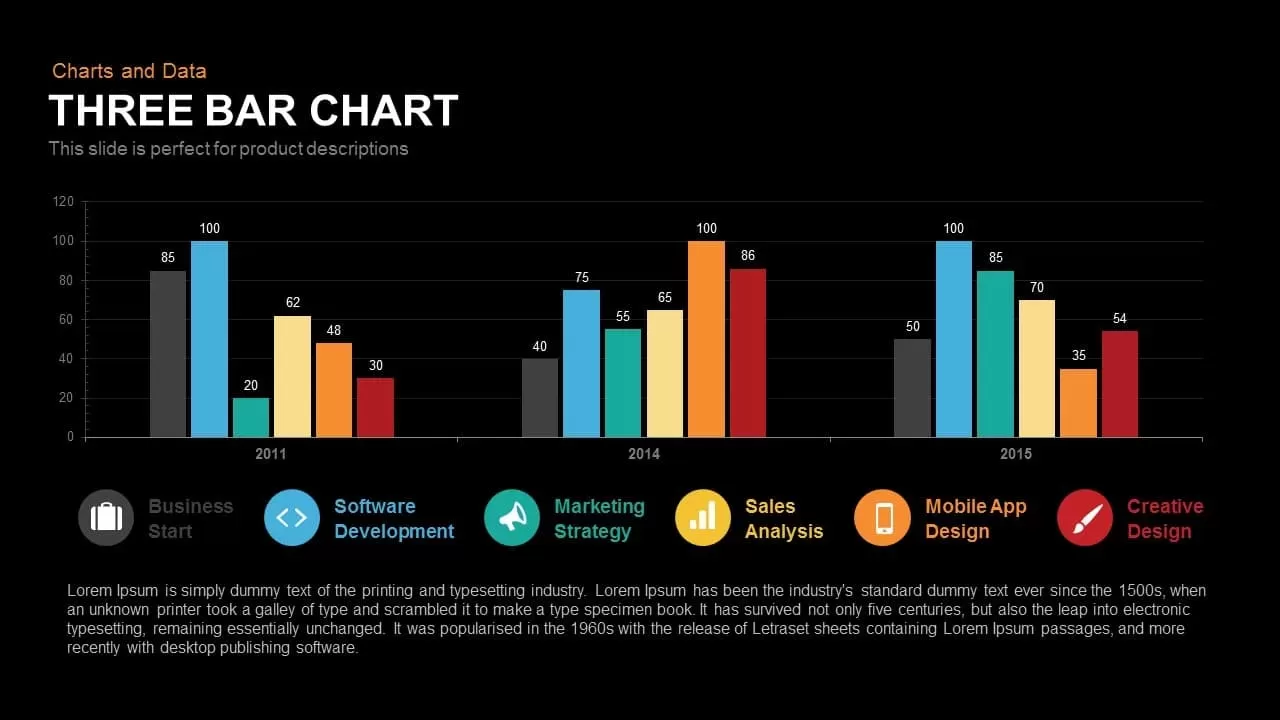
3 Bar Chart PowerPoint Template and Keynote Slide
Column and Bar chart
Premium
-

Global Warming Infographic PowerPoint Template Deck
PowerPoint Templates
Premium
-

Data Science PowerPoint Template
PowerPoint Templates
Premium
-
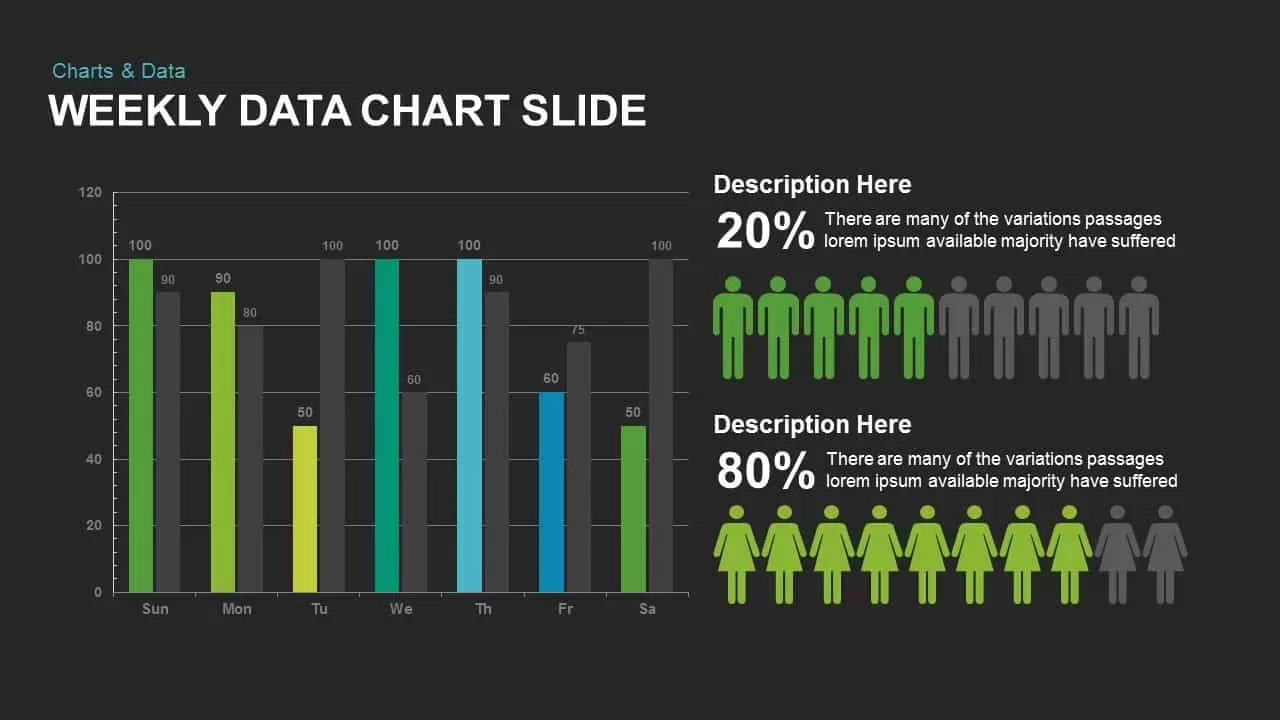
Weekly Data Charts PowerPoint Presentation Template and Keynote Slide
Infographic
Premium
-
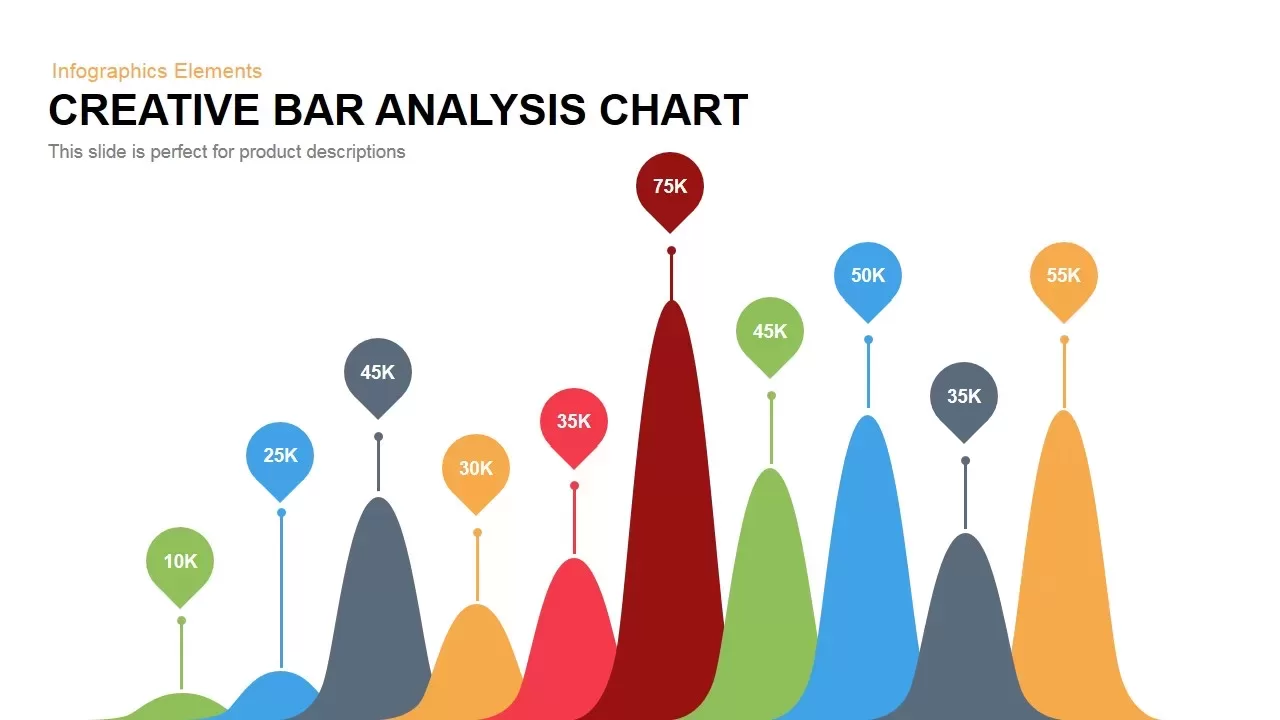
Creative Bar Chart Analysis PowerPoint Template and Keynote
Column and Bar chart
Premium
-
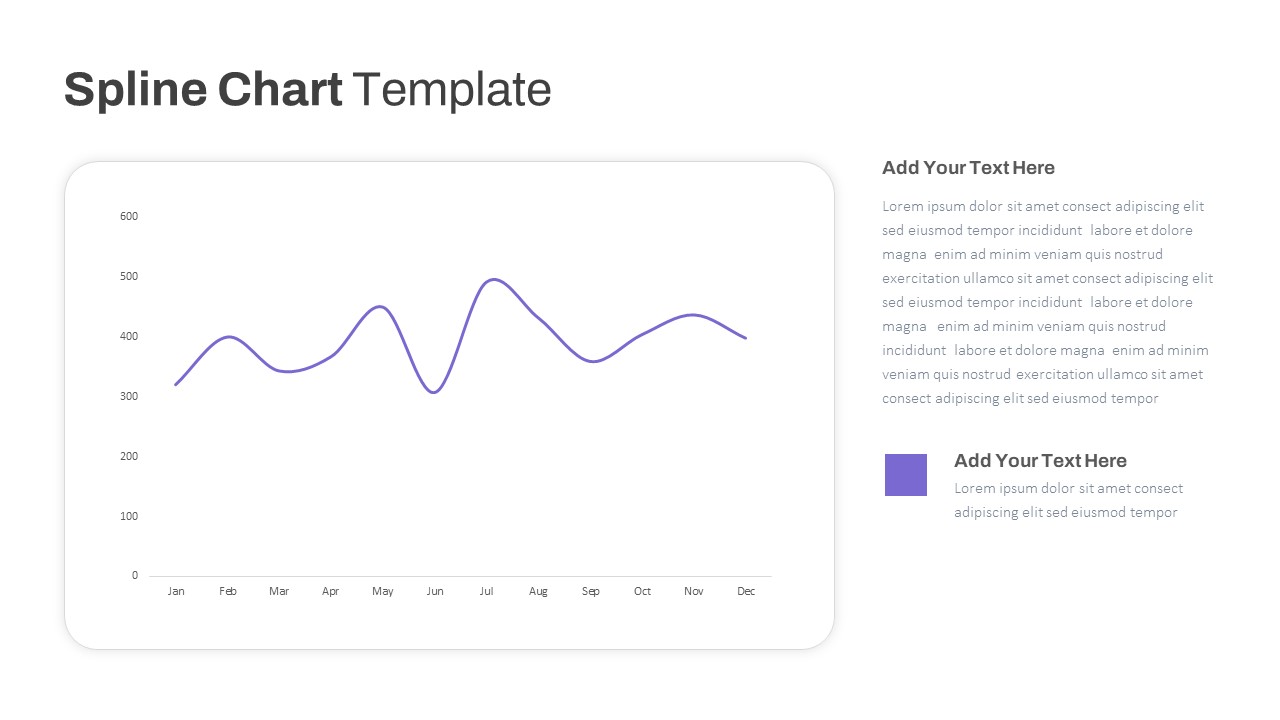
Spline Chart PowerPoint Template
PowerPoint Charts
Premium
-

Real Estate PowerPoint Theme
PowerPoint Themes
Premium
-

EFQM Model PowerPoint Template
PowerPoint Templates
Premium
-
Survey Results PowerPoint Template Free
Free PowerPoint Templates
Free
-
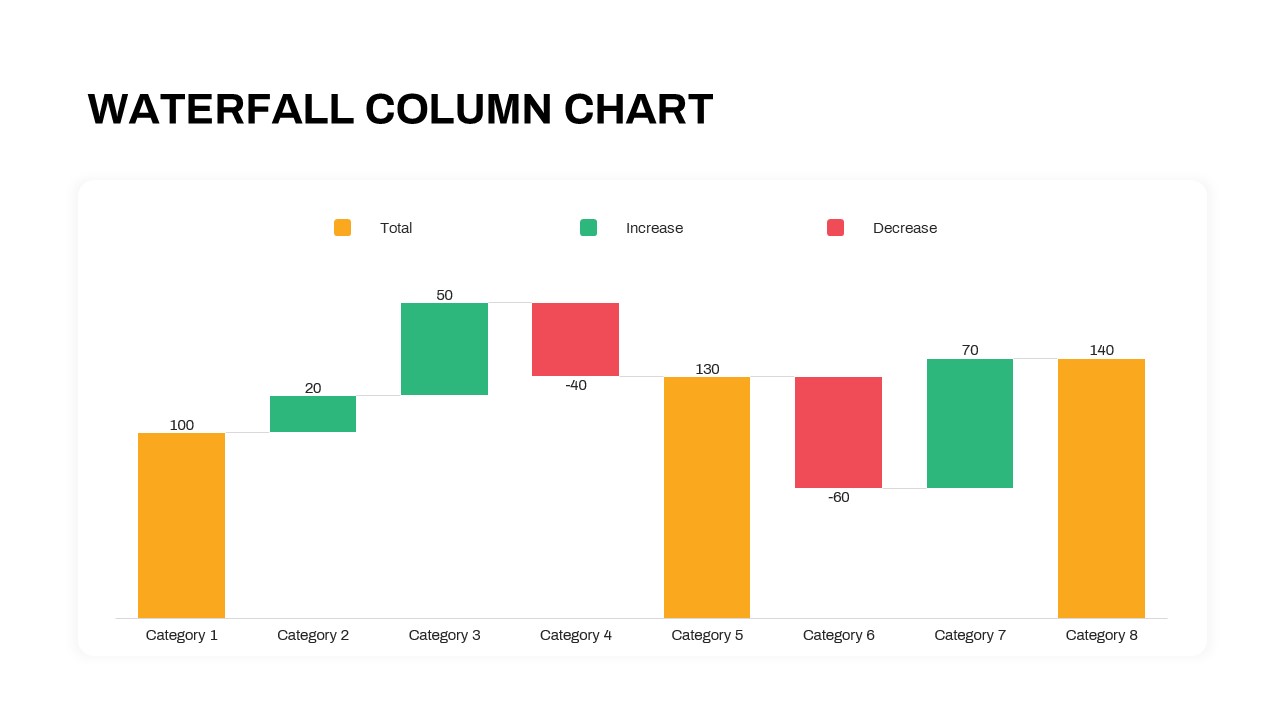
Waterfall Column Chart PowerPoint Template
Column and Bar chart
Premium
-
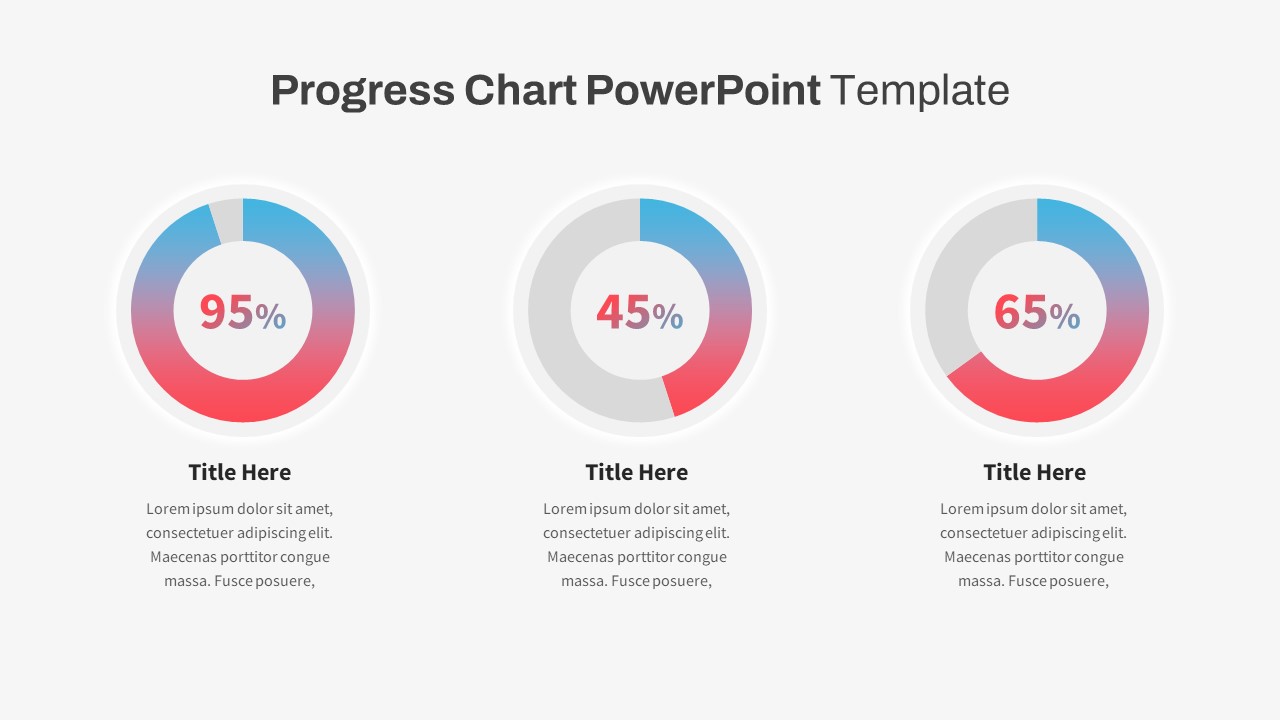
Progress Chart PowerPoint Template
PowerPoint Templates
Premium
-

Free AI Artificial Intelligence PowerPoint Template
PowerPoint Templates
Free
-
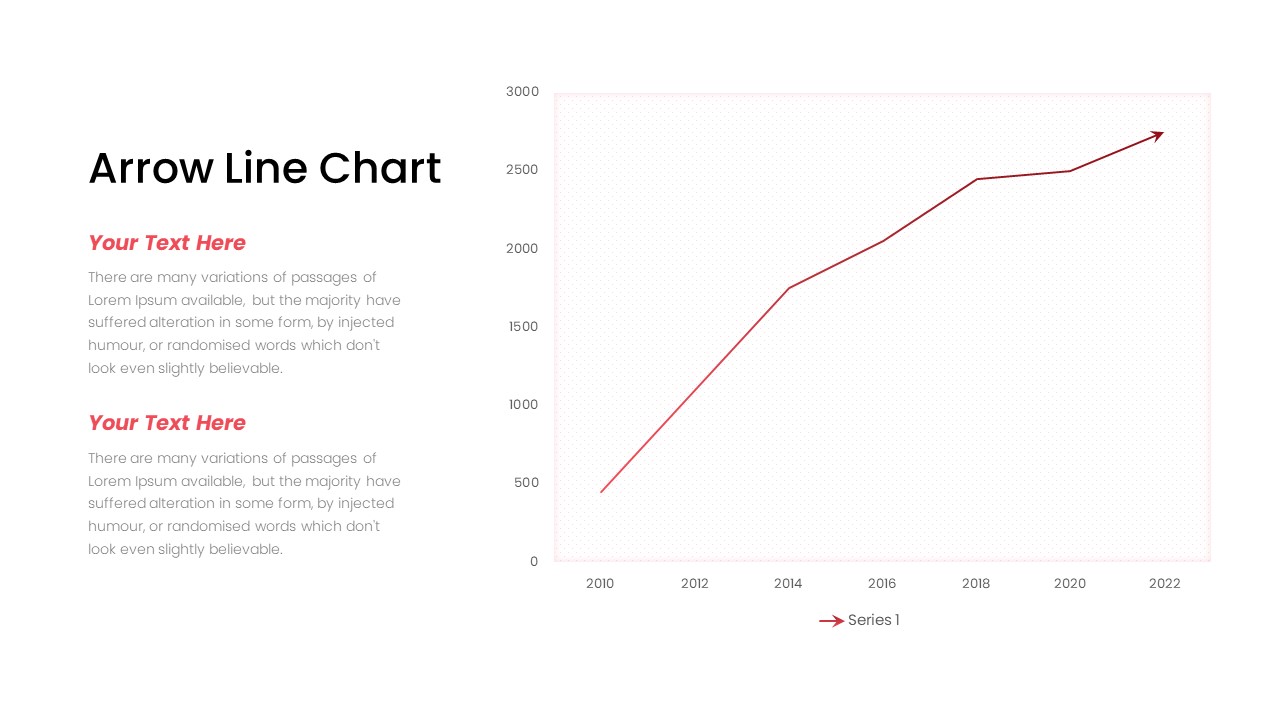
Arrow Line Chart PowerPoint Template
Arrow Diagrams
Premium
-
Waterfall Chart PowerPoint Template
PowerPoint Charts
Premium
-
Bar of Pie Chart PowerPoint Template
PowerPoint Templates
Premium
-
Set of Chart PowerPoint Template and Keynote Diagram
PowerPoint Charts
Premium
-

Mekko Chart Template
PowerPoint Templates
Premium
-
Stacked Area Chart PowerPoint Template
PowerPoint Charts
Premium
-
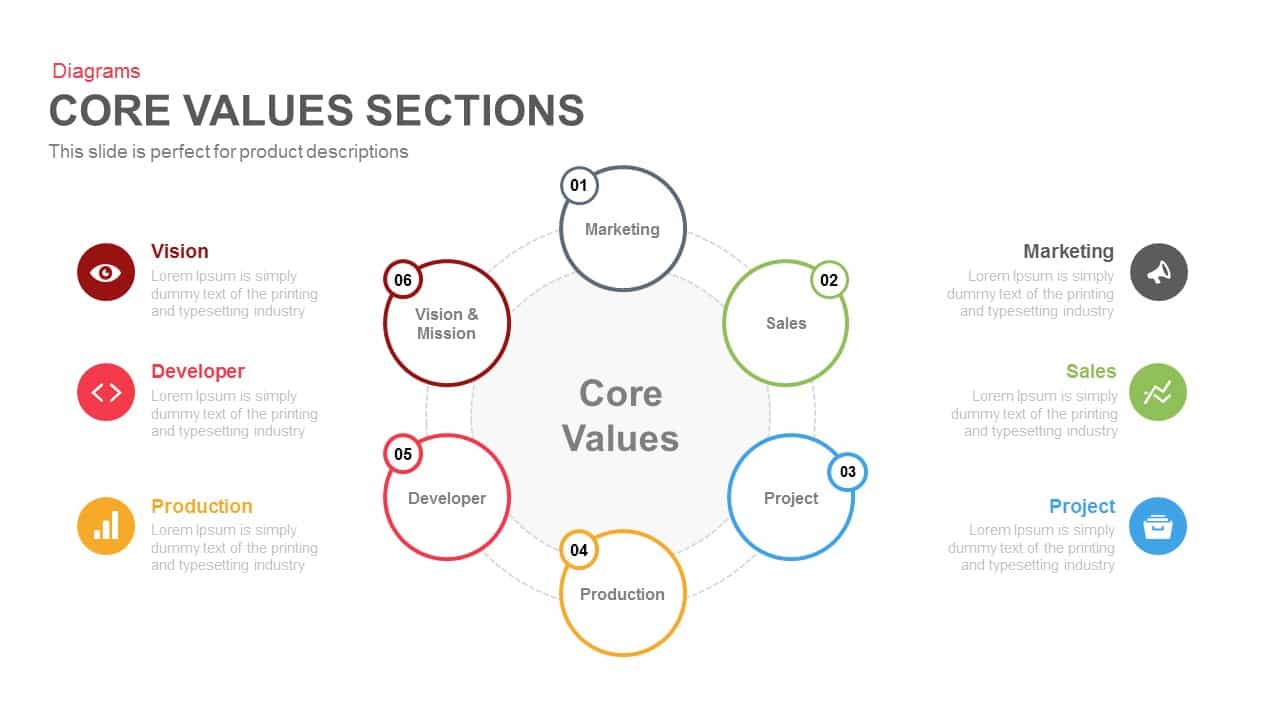
Core Values Sections PowerPoint Template and Keynote
Business Models
Premium
-

Combination Chart PowerPoint Template
PowerPoint Charts
Premium
-
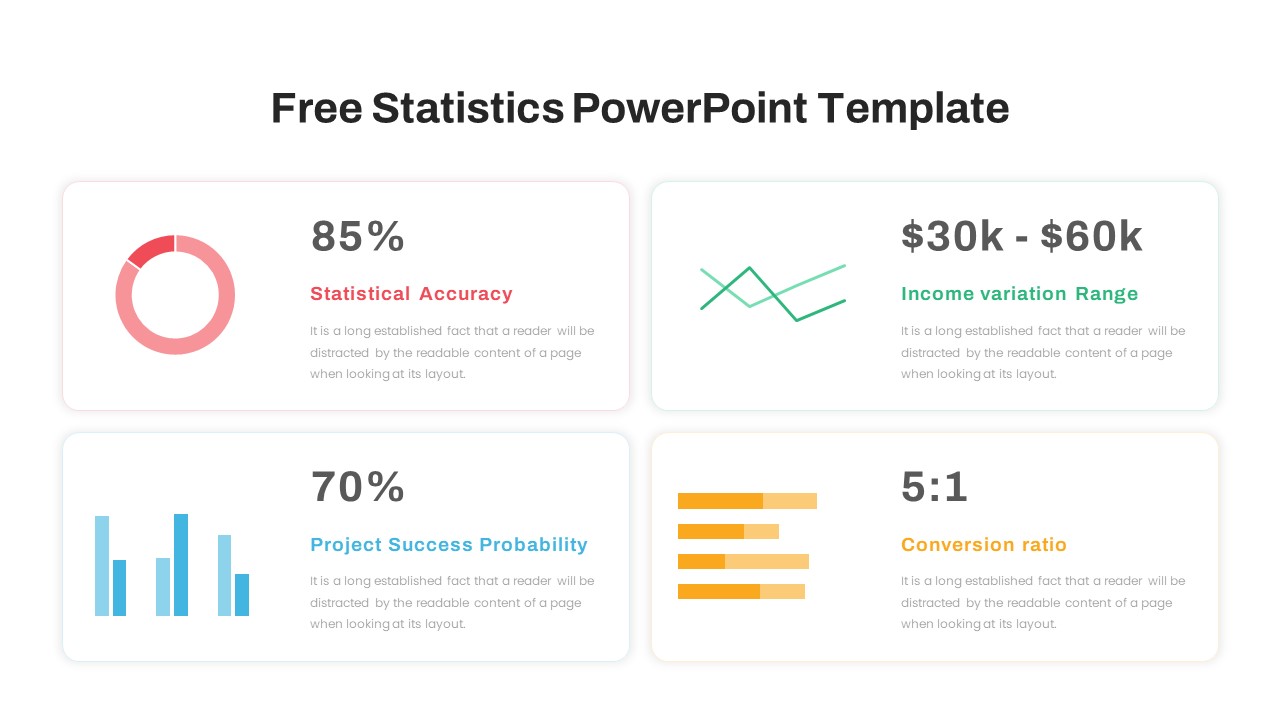
Free Statistics PowerPoint Template
Free PowerPoint Templates
Free
-
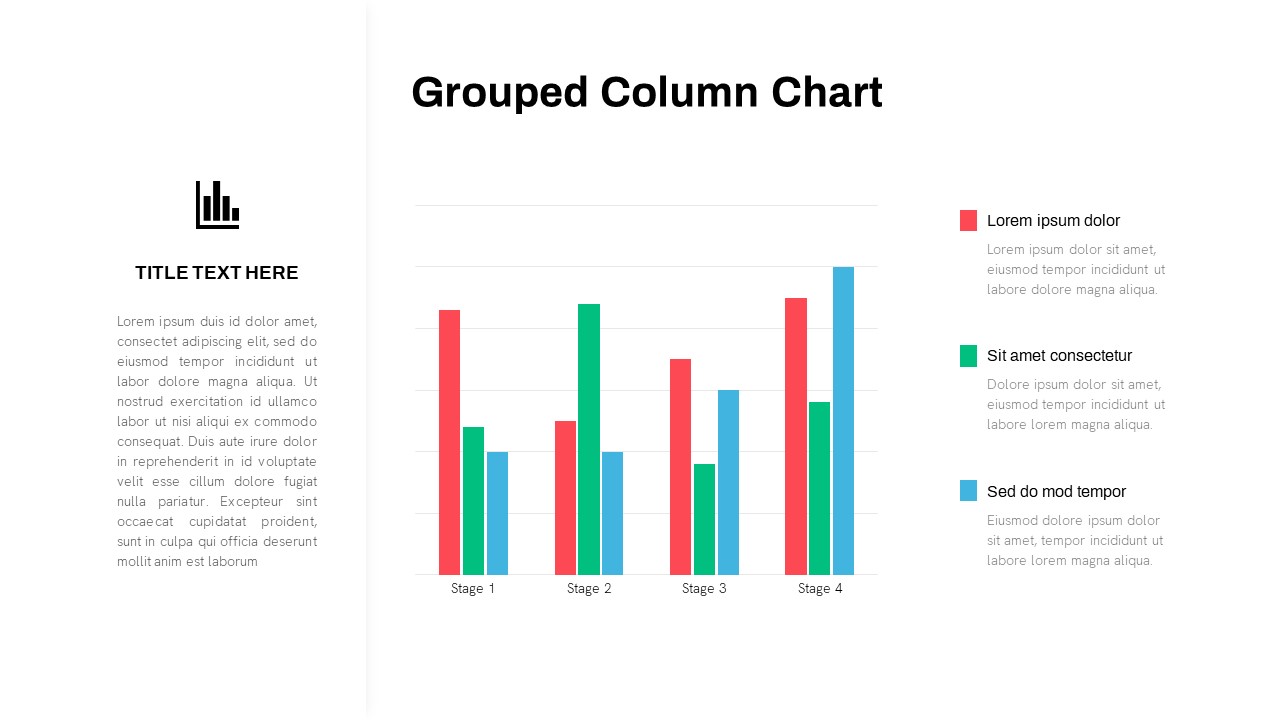
Grouped Column Chart PowerPoint Template
Column and Bar chart
Premium
-
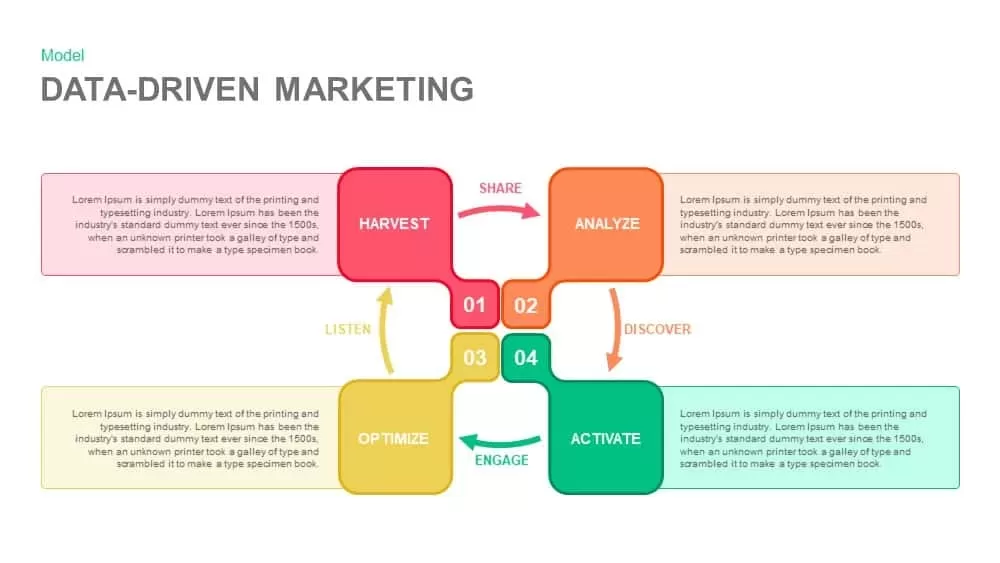
Data Driven Marketing Template for PowerPoint & Keynote
Business Models
Premium
-
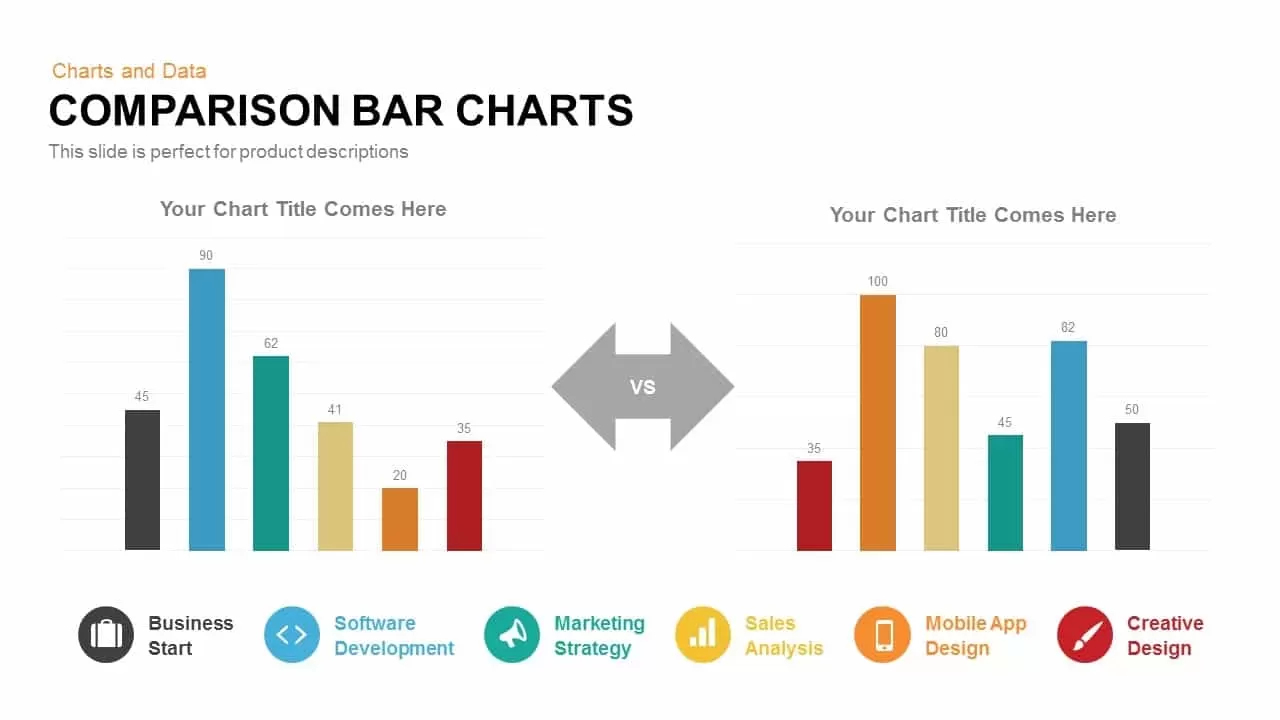
Comparison Bar Charts PowerPoint Template and Keynote Slide
Column and Bar chart
Premium
-
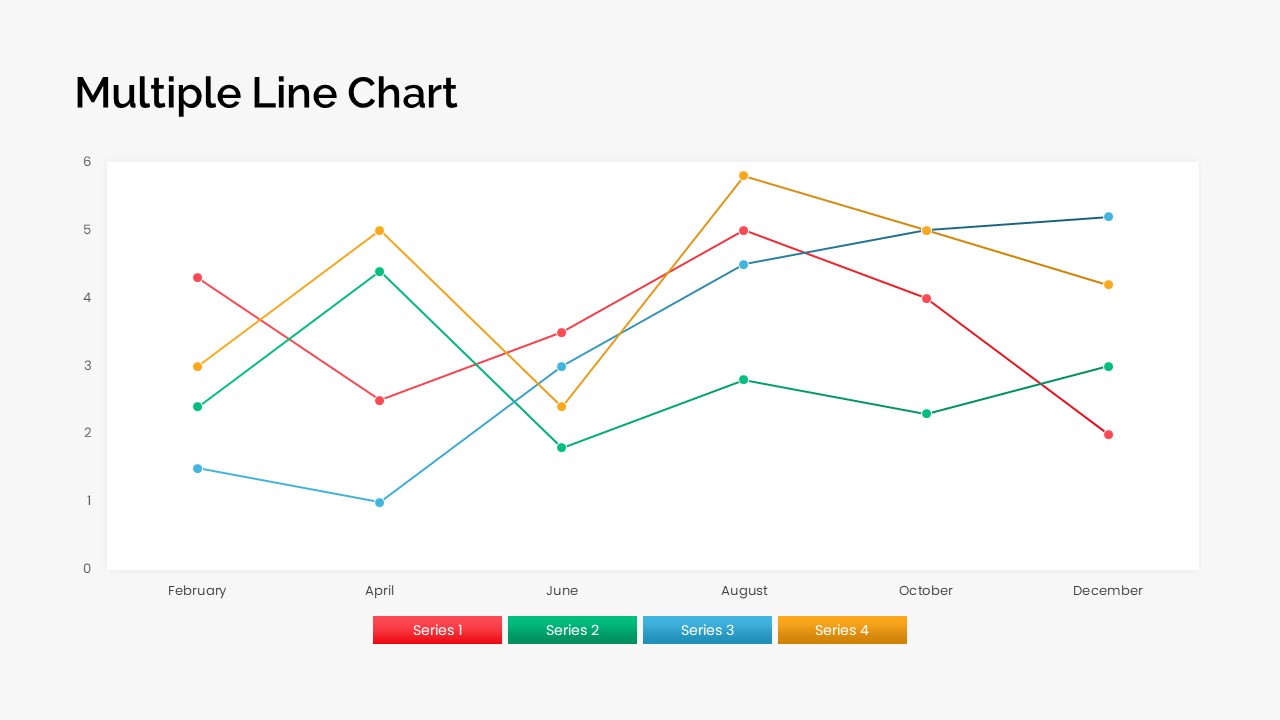
Multiple Line Chart PowerPoint Template
PowerPoint Charts
Premium
-
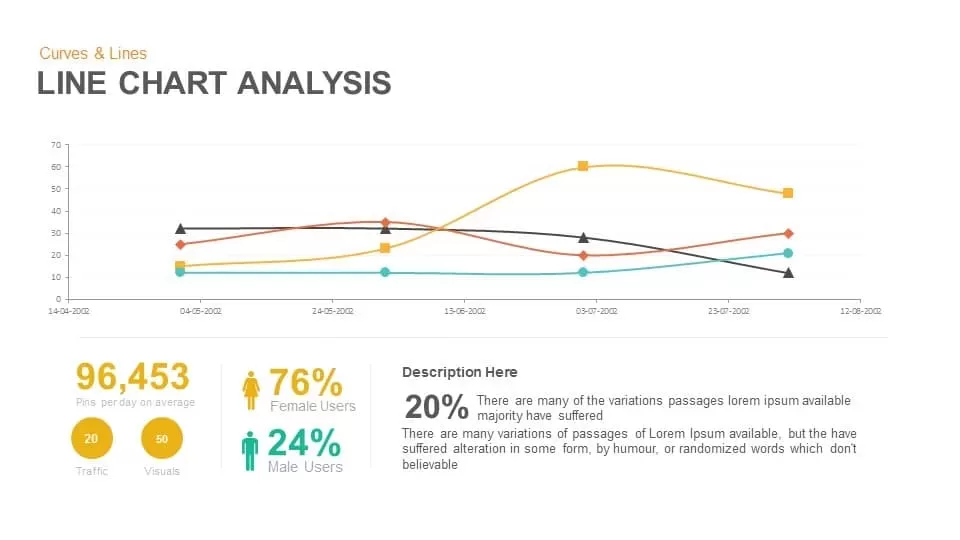
Line Chart Analysis PowerPoint Template and Keynote Slide
Curves and Lines
Premium
-

Proportional Area Chart PowerPoint Template
PowerPoint Templates
Premium
-
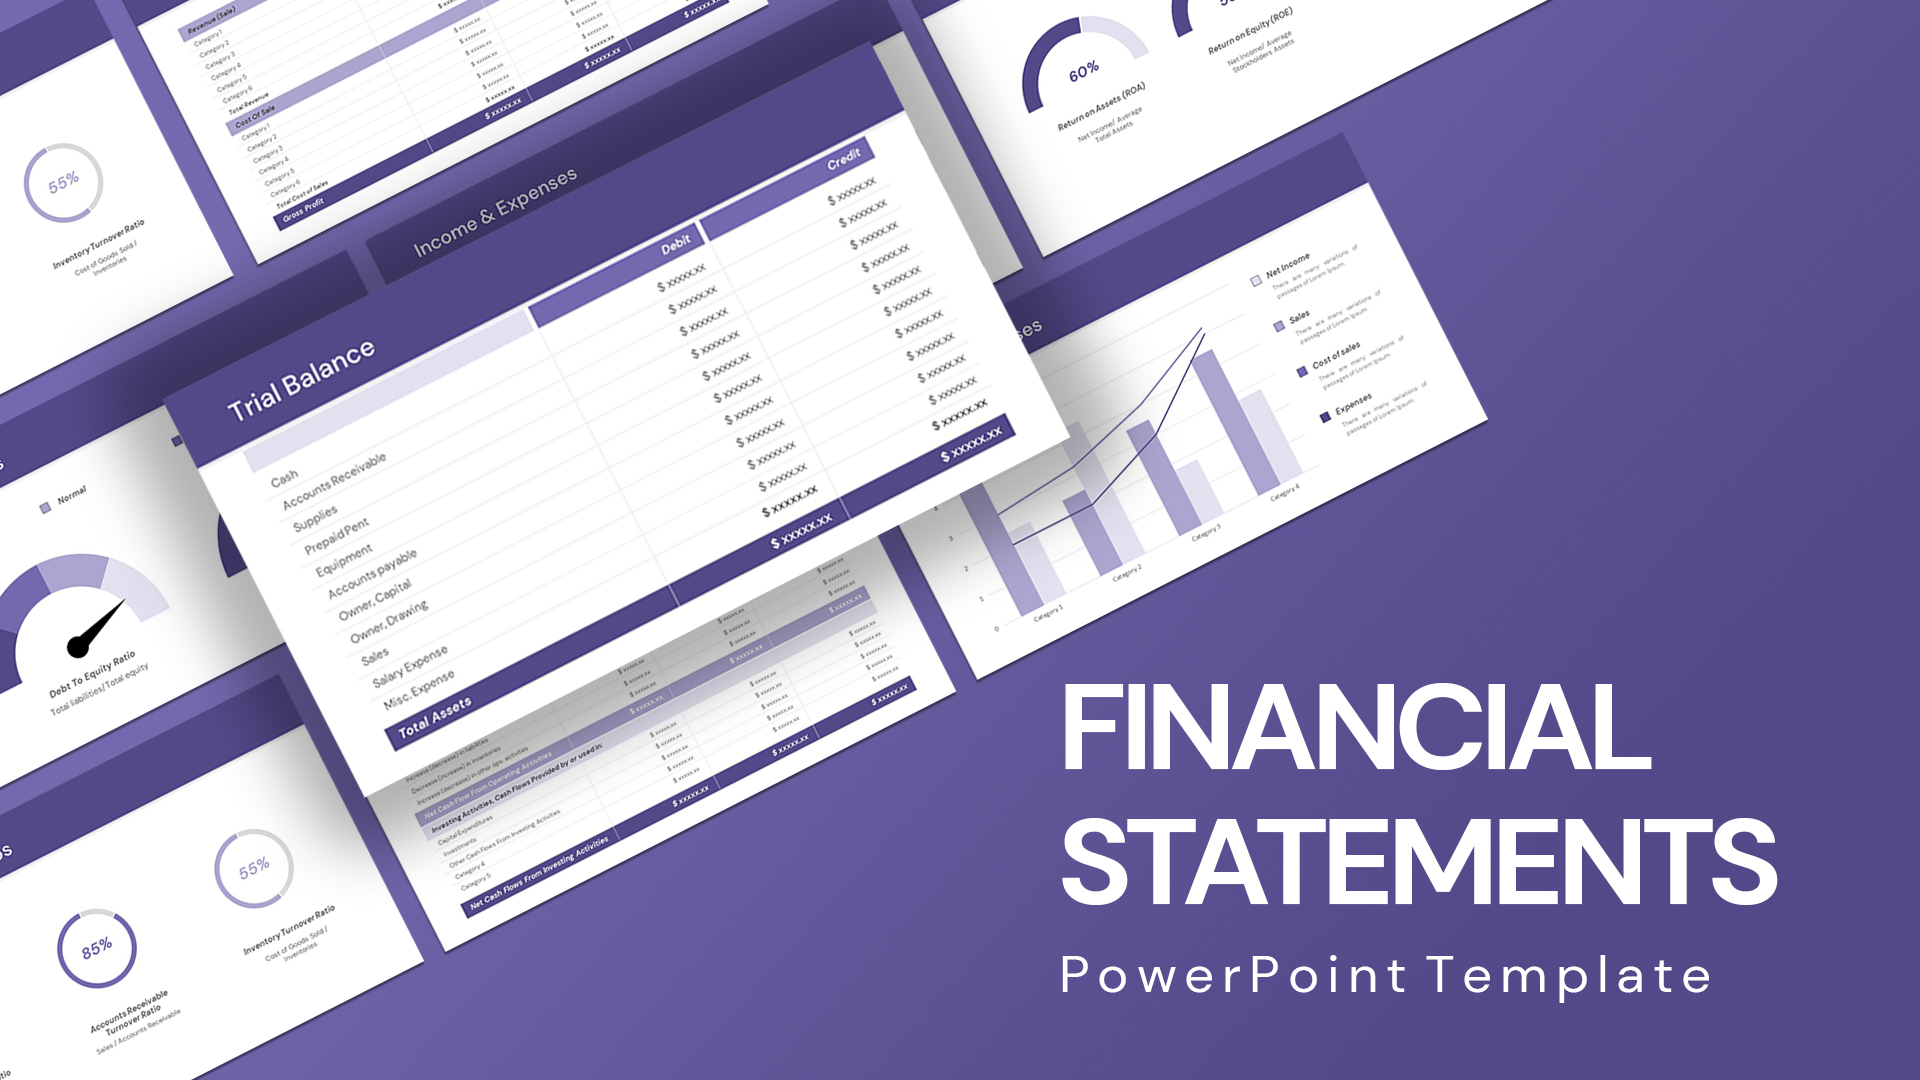
Financial Statement PowerPoint Template
PowerPoint Templates
Premium
-
Data Bar Chart Template for PowerPoint and Keynote
Column and Bar chart
Premium
-
Stacked Waterfall Chart PowerPoint Template
PowerPoint Templates
Premium
-
Radial Bar Chart Template for PowerPoint and Keynote
Circular Diagrams
Premium
-
Jump Line Chart PowerPoint Template
Column and Bar chart
Premium
-
Data Over Time Line Chart PowerPoint Template
PowerPoint Charts
Premium
-
Data Flow PowerPoint Presentation Template
PowerPoint Templates
Premium
-
Peak Line Chart PowerPoint Template
PowerPoint Charts
Premium
-

Dashboard Template for PowerPoint Presentation
PowerPoint Charts
Premium
-
Timeline Bar Chart PowerPoint
Column and Bar chart
Premium
-

Finance Consulting PowerPoint Template
PowerPoint Templates
Premium
-

Stakeholder Register PowerPoint Template
PowerPoint Templates
Premium
-
Key Financial Ratios PowerPoint Template
PowerPoint Templates
Premium
-
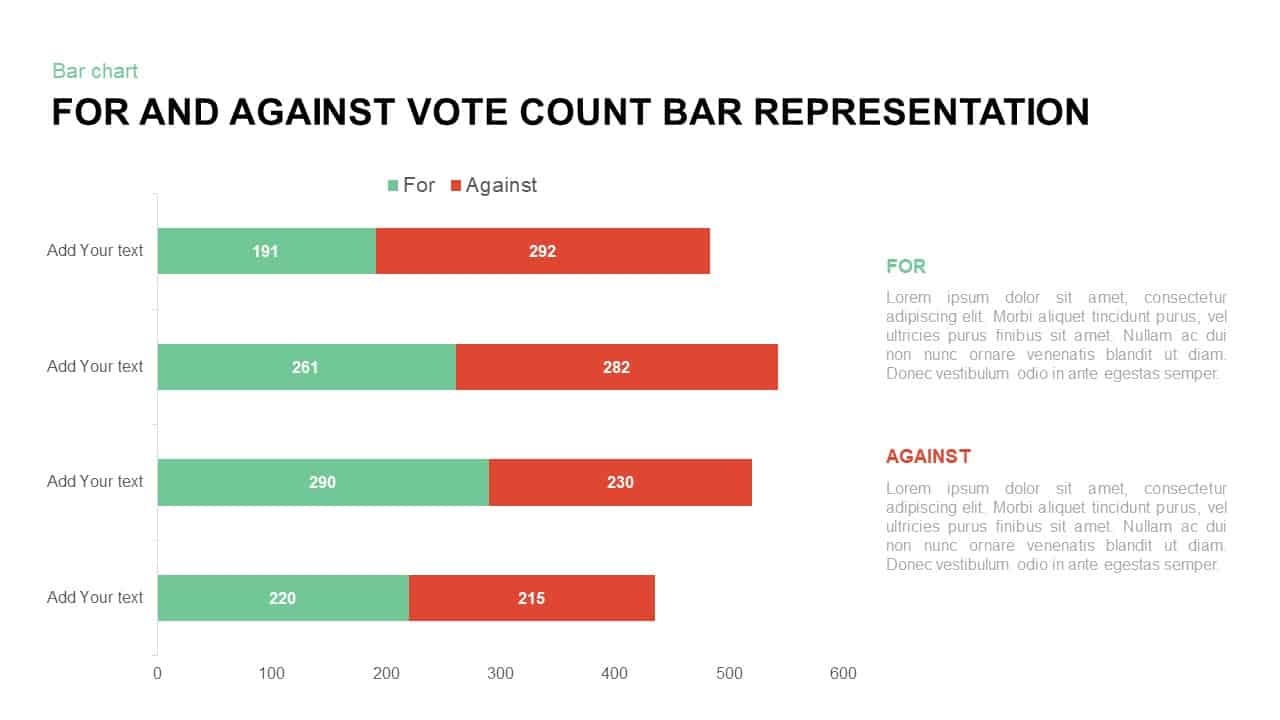
For and Against Vote Count Bar Chart for PowerPoint Presentation
Column and Bar chart
Premium
-

Biotechnology PowerPoint Presentation Template
PowerPoint Templates
Premium
-
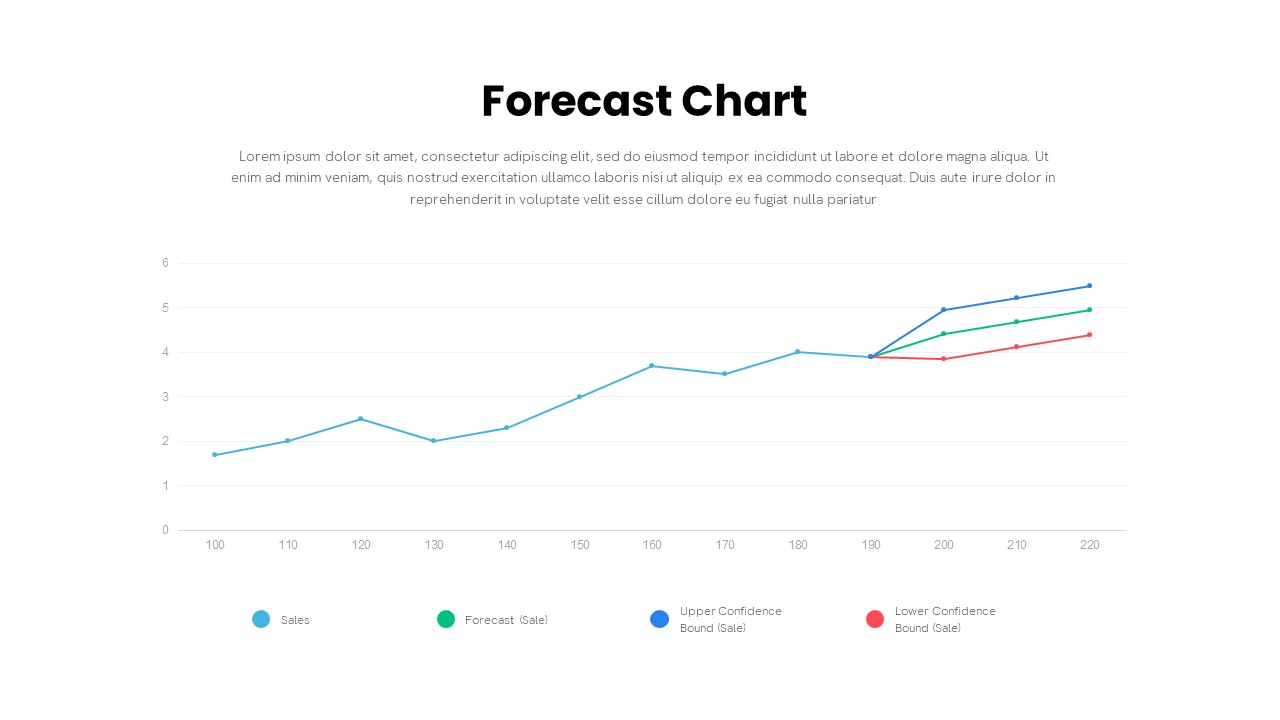
Forecast Chart PowerPoint Template
PowerPoint Charts
Premium
-

Business Process Reengineering Template
PowerPoint Templates
Premium
-
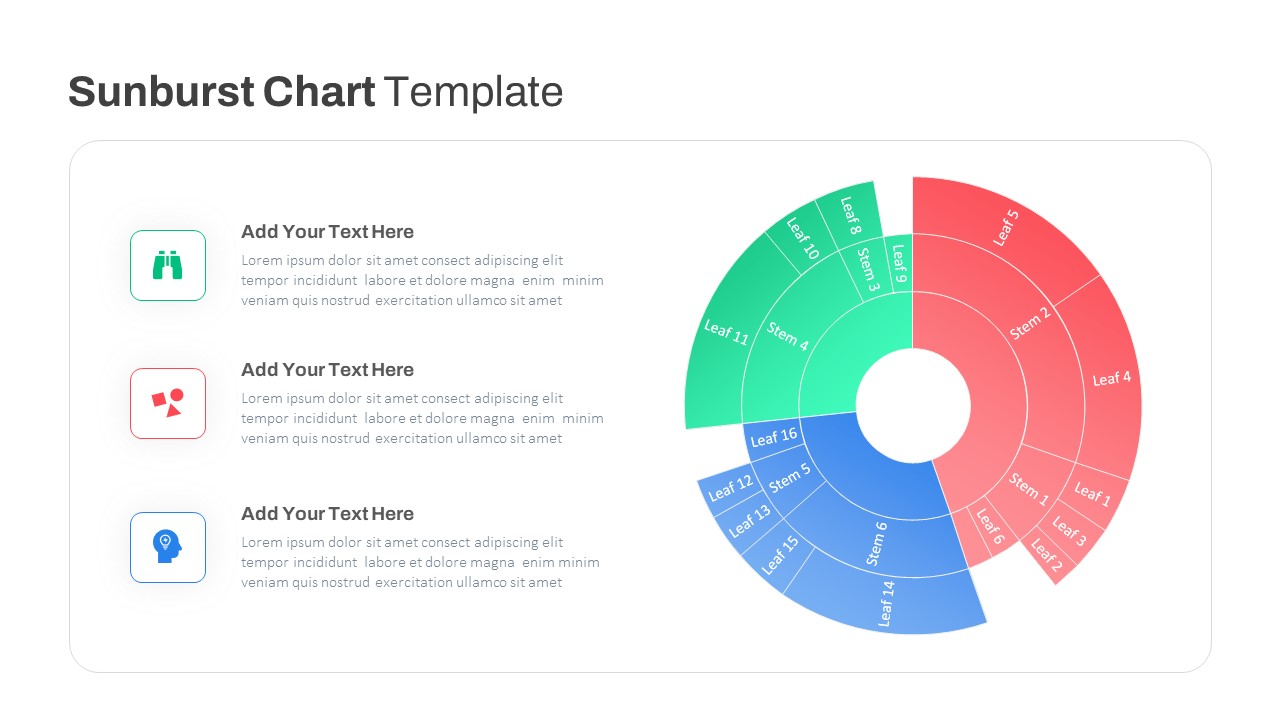
Sun Burst Chart PowerPoint Template
Circular Diagrams
Premium
-

Free Metro UI Dashboard Template
PowerPoint Templates
Free
-
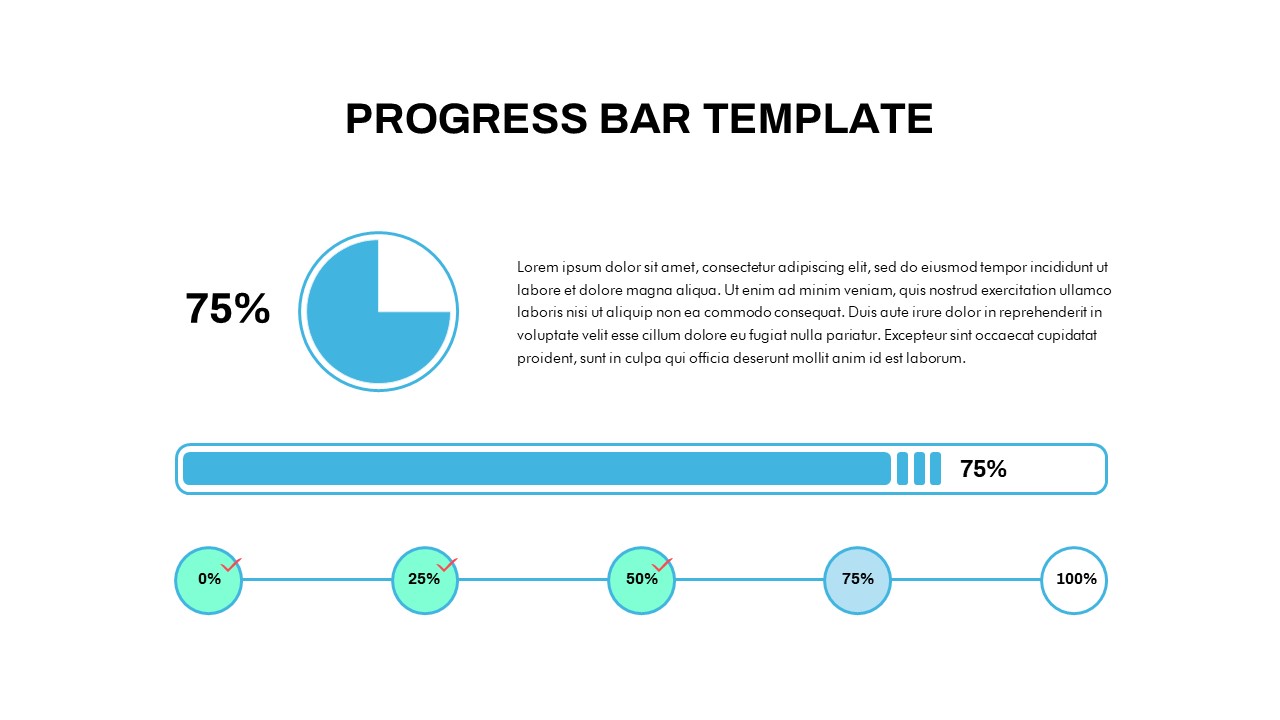
Progress Bar Chart PowerPoint Template
PowerPoint Templates
Premium
-
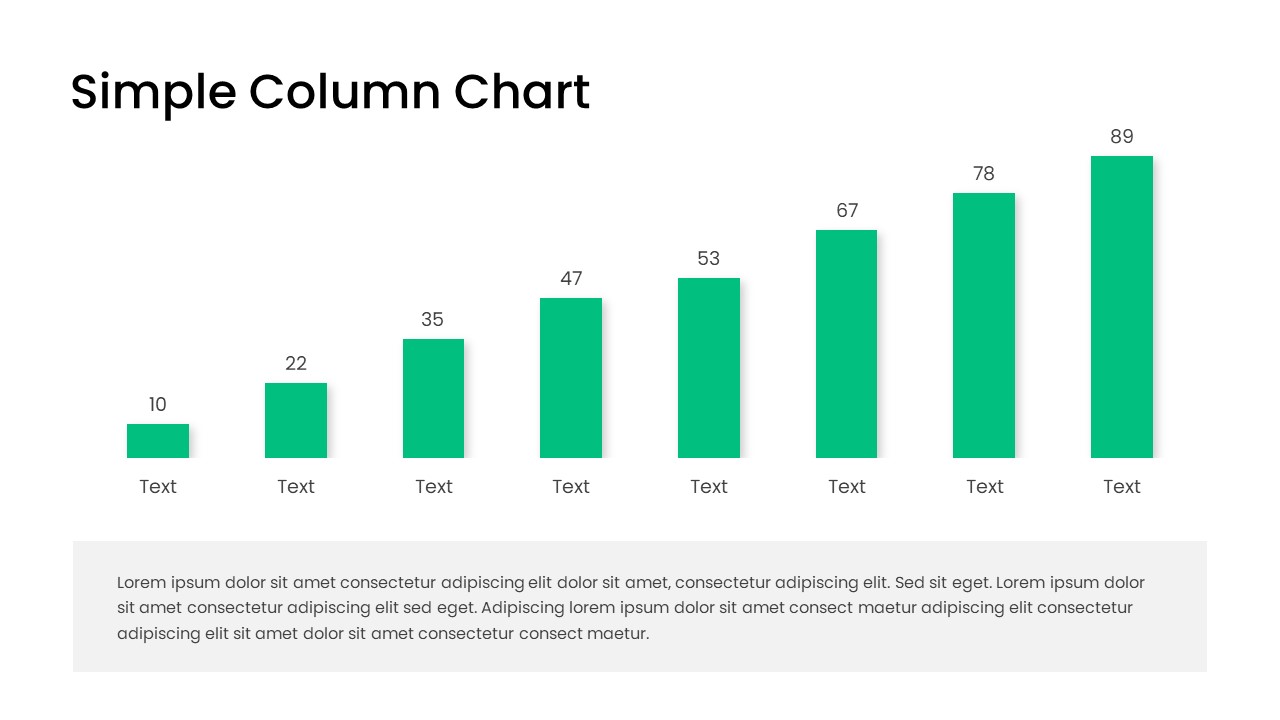
Free Simple Column Chart PowerPoint Template
Column and Bar chart
Free
-
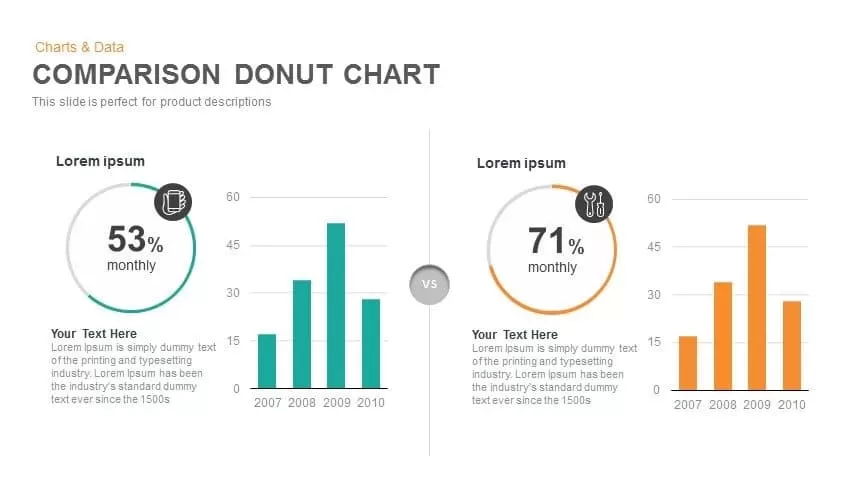
Comparison Donut Chart PowerPoint Template and Keynote
Keynote Templates
Premium
-
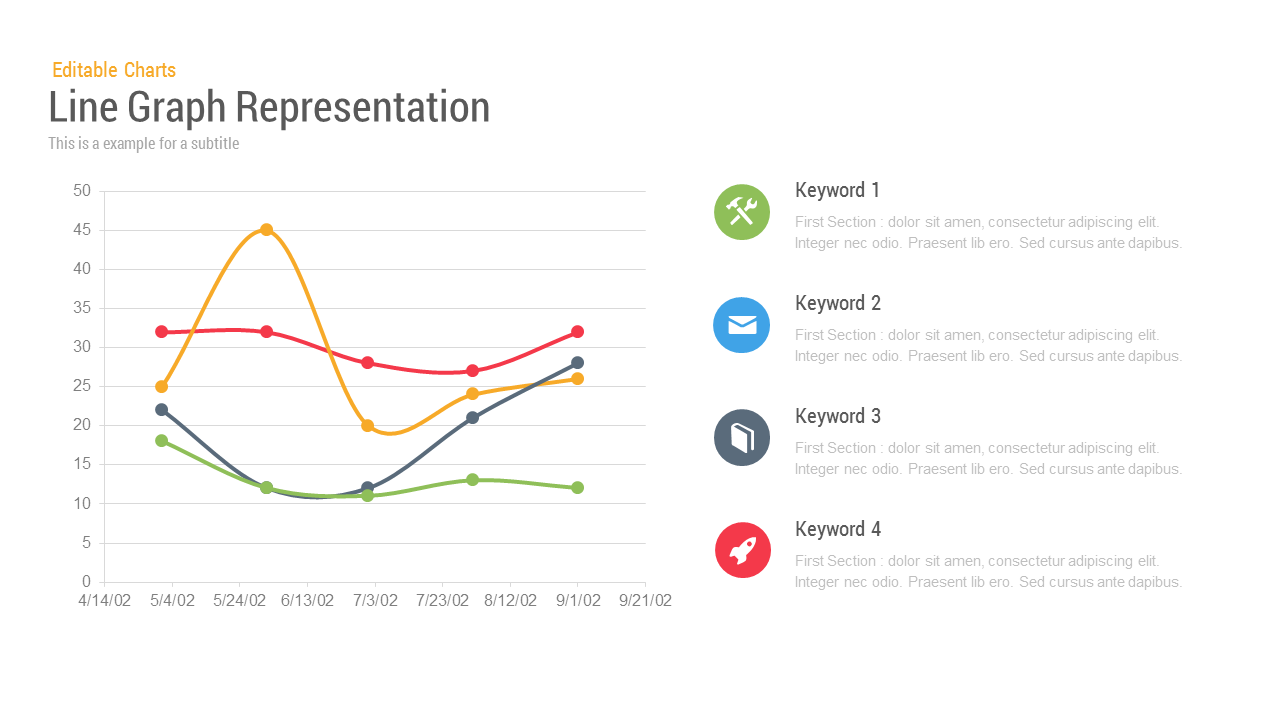
Line Chart Representation PowerPoint Templates and Keynote Slides
PowerPoint Charts
Premium
-

Animated Upcoming Event Poster PowerPoint Template
PowerPoint Templates
Premium
-
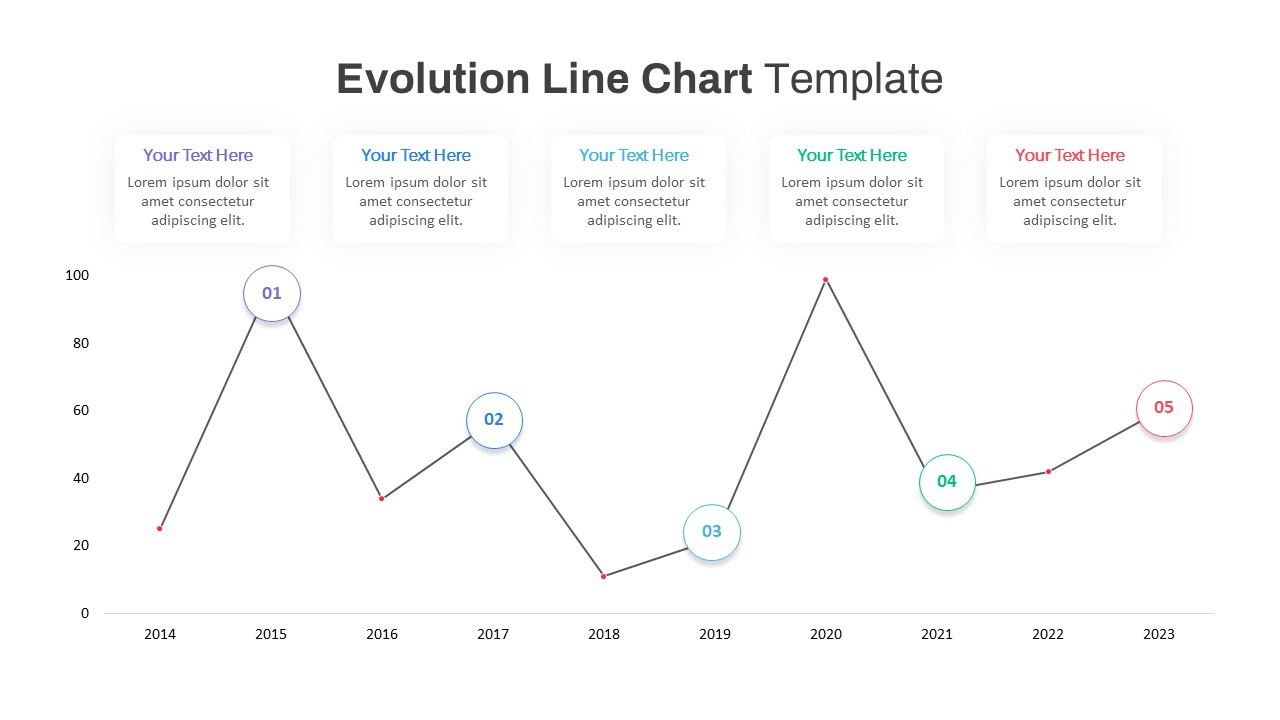
Evolution Line Chart PowerPoint Template
PowerPoint Templates
Premium
-
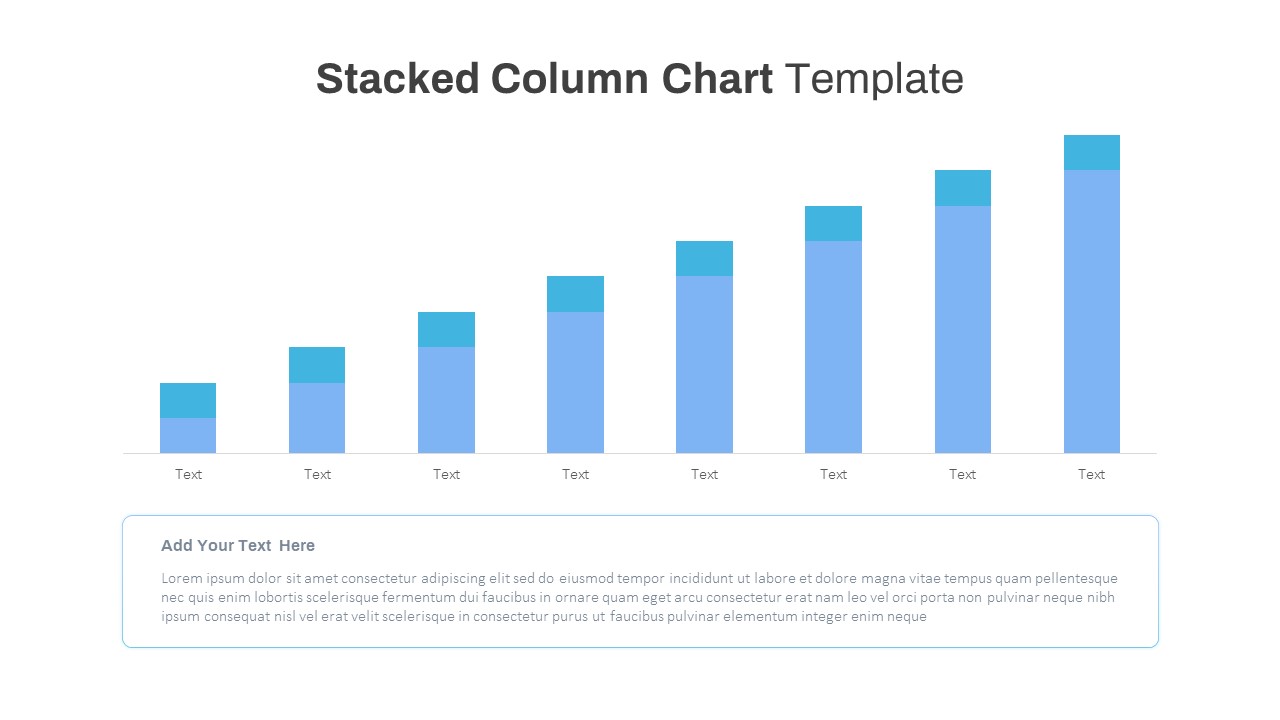
Free Stacked Column Chart Template
Column and Bar chart
Free
-
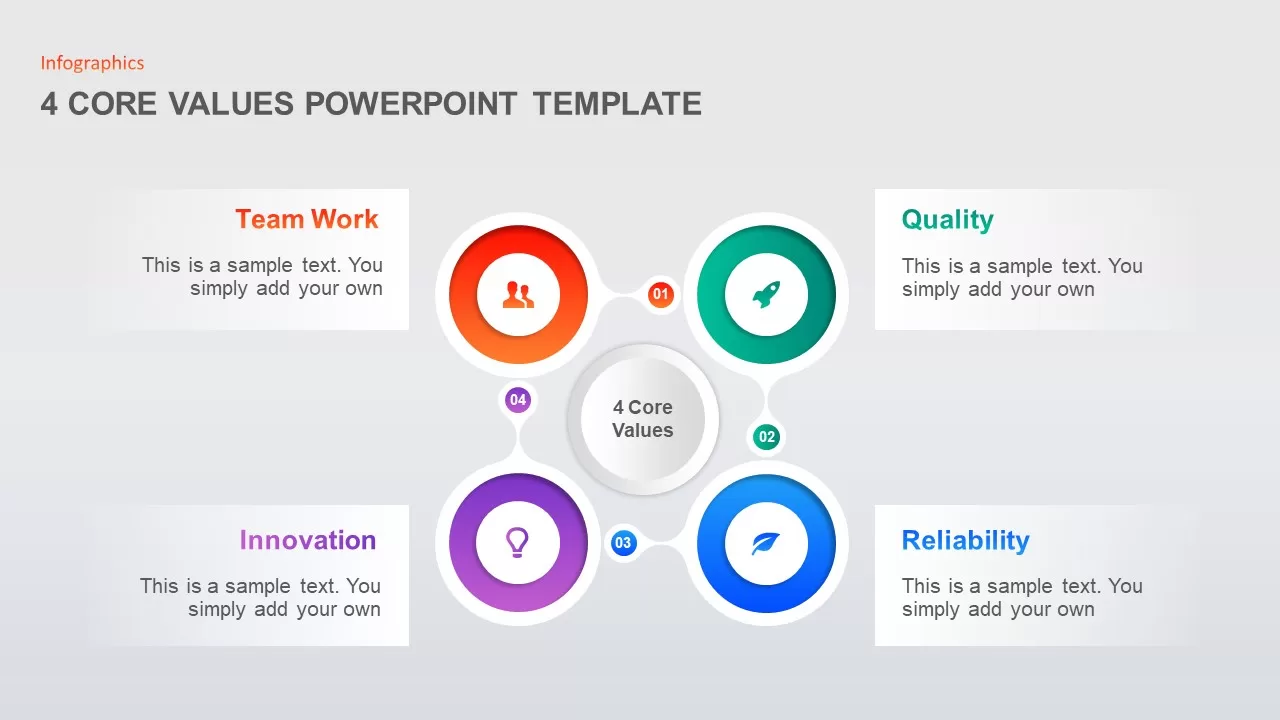
4 Step Core Values PowerPoint Template
Business Models
Premium
-
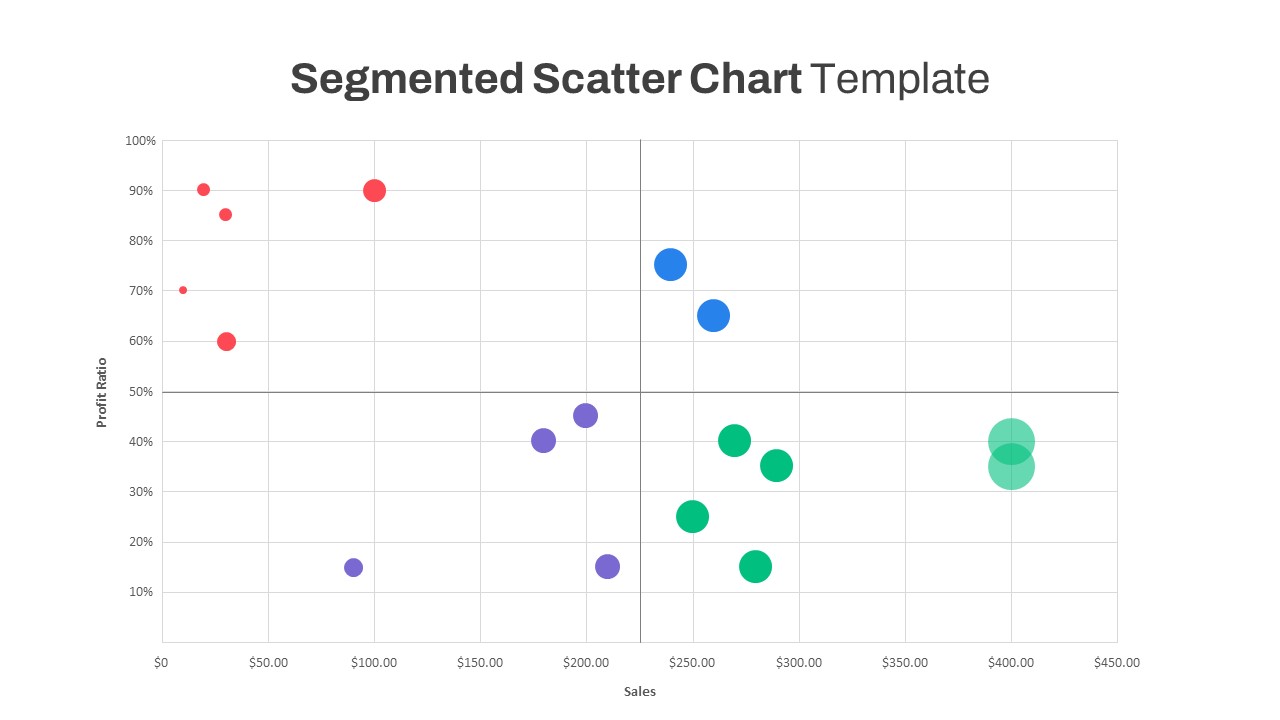
Segmented Scatter Chart PowerPoint Template
PowerPoint Charts
Premium
-
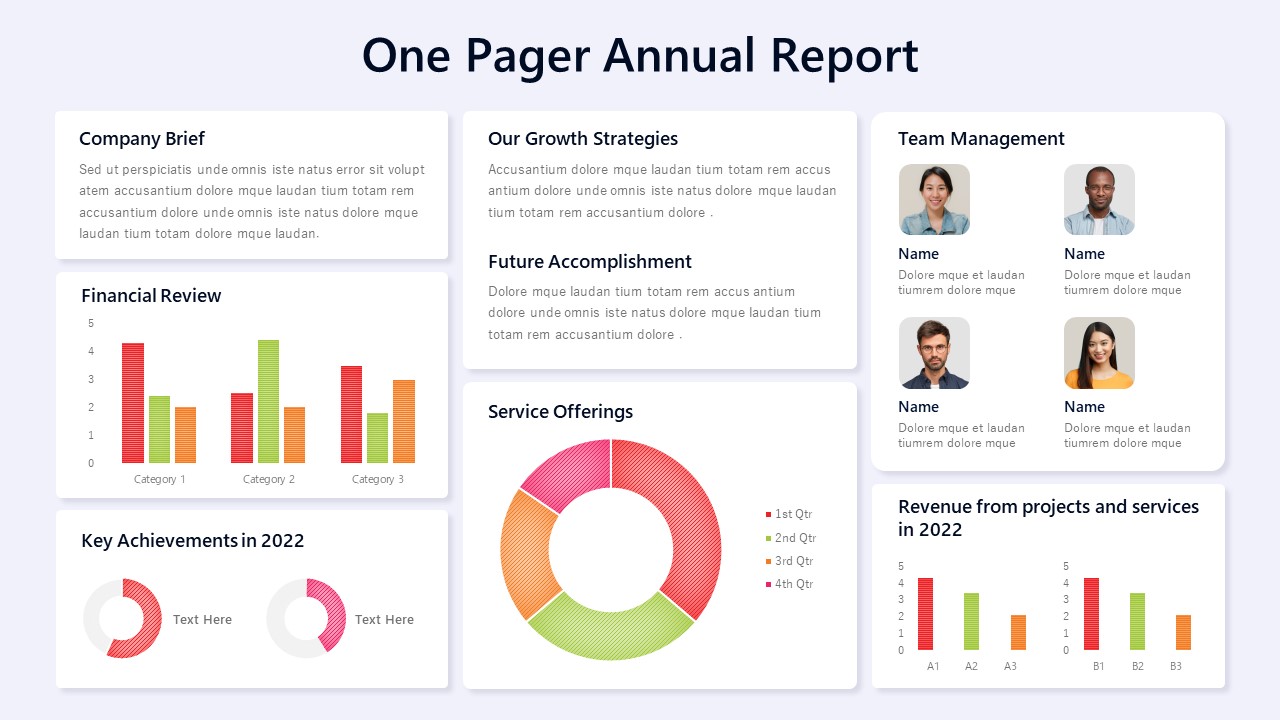
One Pager Annual Report Template
Column and Bar chart
Premium
-
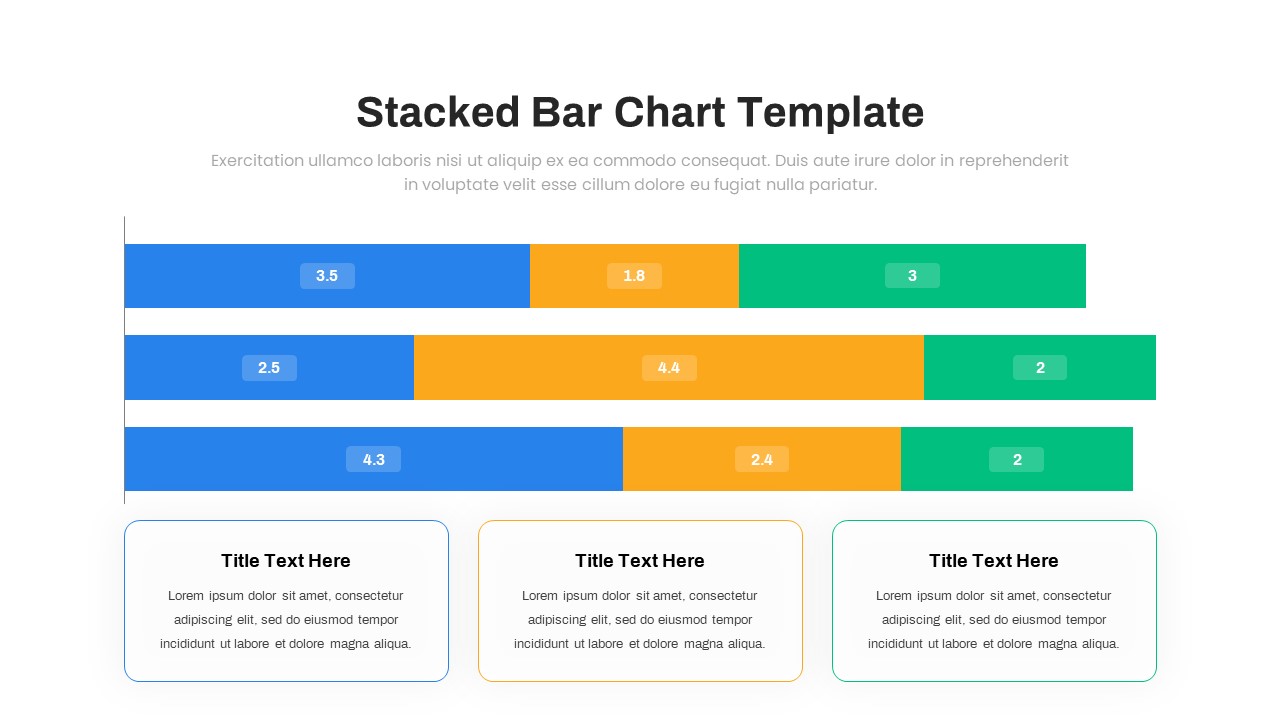
Animated Stacked Bar Chart PowerPoint Template
Column and Bar chart
Premium
-
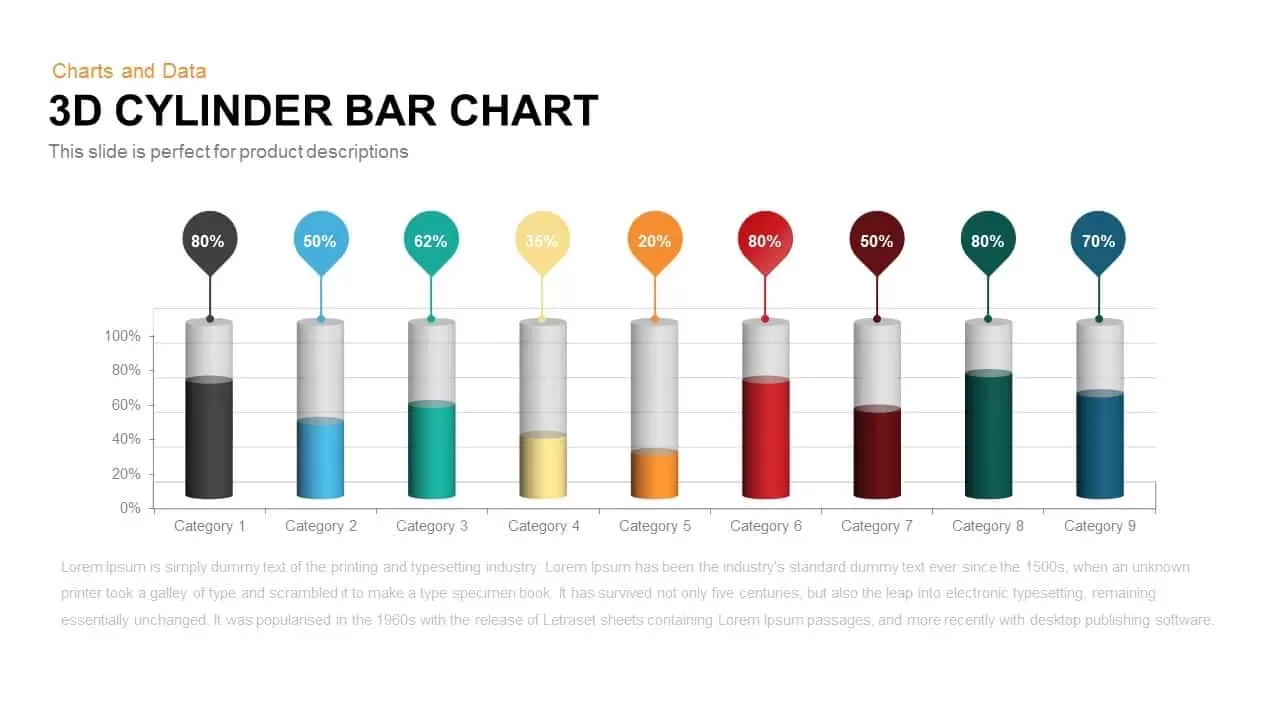
3D Cylinder Bar Chart PowerPoint Template and Keynote Slide
Column and Bar chart
Premium
-

Multipurpose Business PowerPoint Template
PowerPoint Business Templates
Premium