Home » PowerPoint Charts » Forecast Chart PowerPoint Template
Forecast Chart PowerPoint Template
- Version
- Download 23
- File Size 0.00 KB
- File Count 1
- Create Date July 18, 2023
- Last Updated July 17, 2023
Forecast Chart PowerPoint Template
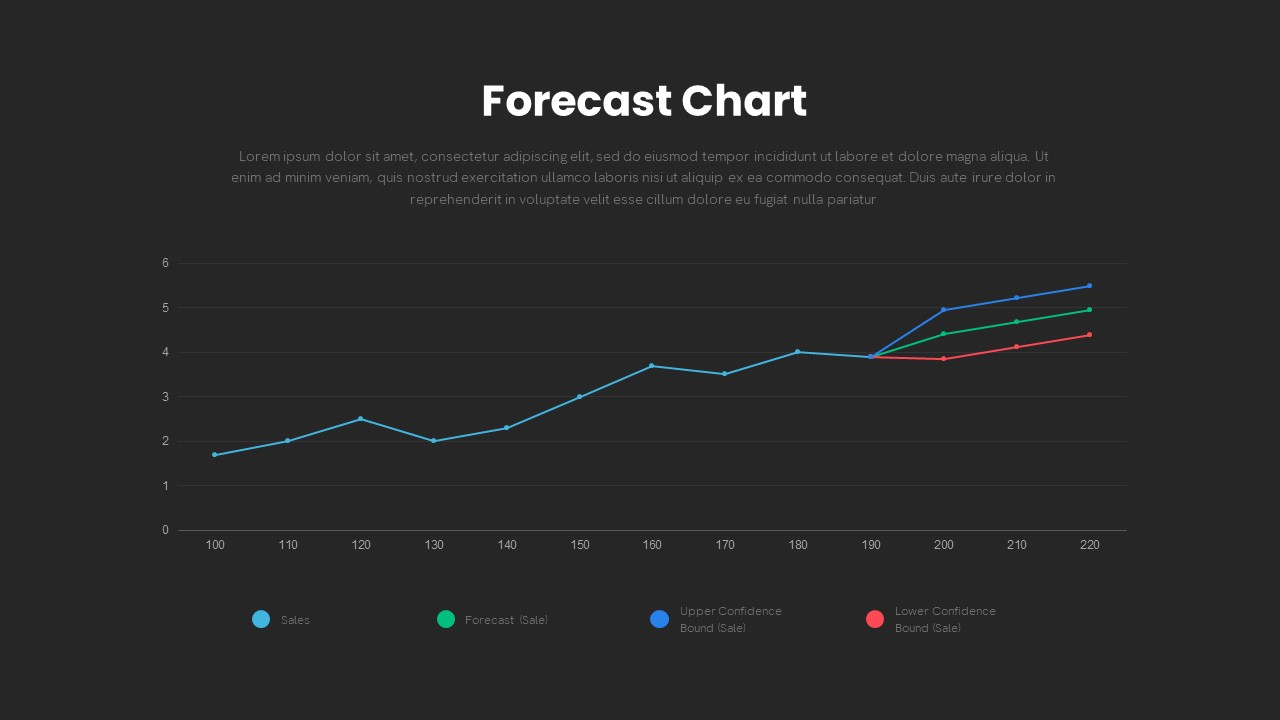
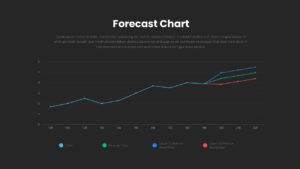
The Forecast Chart PowerPoint Template presents a data-driven chart for predictable results. This graphical representation displays predicted or projected data over a specified period. It is commonly used in various fields, including weather forecasting, financial analysis, market research, and demand planning. It's important to note that forecast charts are based on assumptions, historical data, and predictive models. Therefore, they represent estimated or anticipated values rather than actual observed data. The accuracy of forecast charts relies on the quality of data inputs, the appropriateness of the forecasting methods used, and the inherent uncertainties involved in predicting future events.
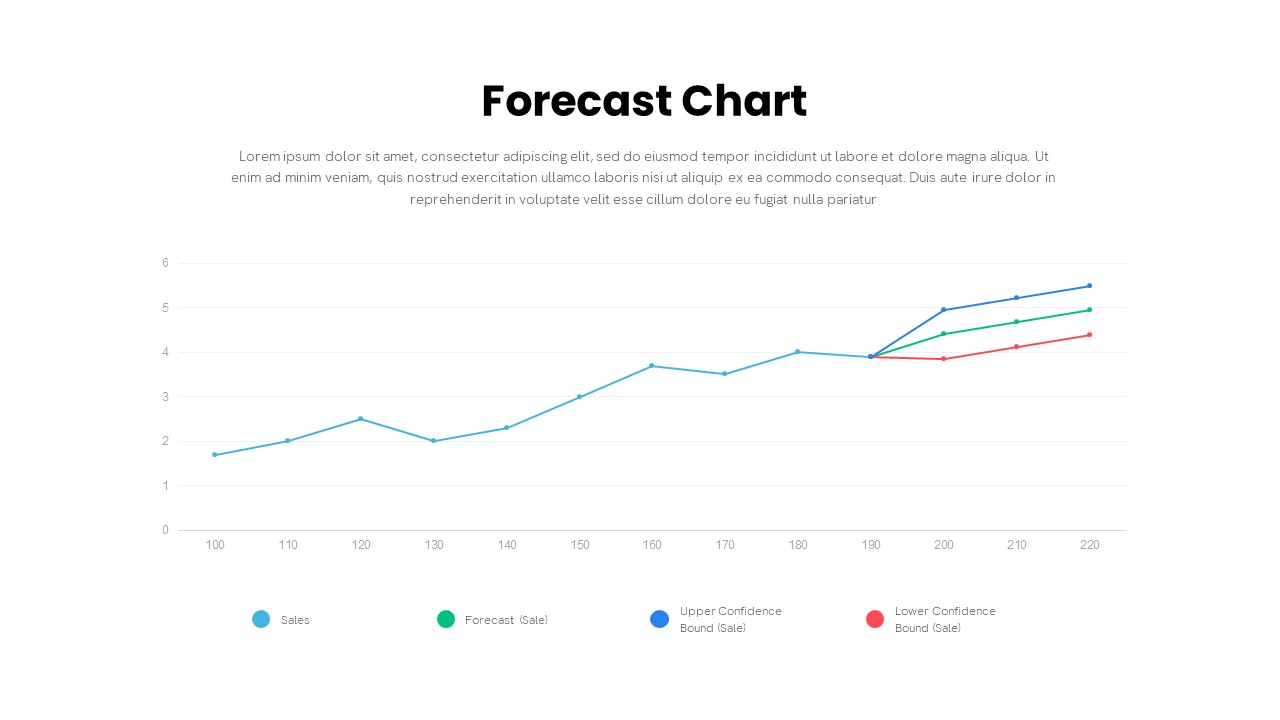
In this forecast chart template for PowerPoint, the line graph culminates in three separate branches. Each branch represents a different outcome or scenario with associated probabilities. The three lines at the end forecast the likelihood of three assumed results. The red color indicates a decrease in value, suggesting a potential decline in sales. The green color represents the maintenance of the status quo, indicating sales staying relatively stable. Lastly, the blue line shows an increase or growth trend, suggesting a potential rise in sales. These results are obtained through probability testing, which helps assess the likelihood of different outcomes based on the available data.
A forecast chart PowerPoint template can be used in various ways to present and visualize data trends, predictions, and projections. Here are some common uses of forecast chart templates in PowerPoint presentations:
- Sales Forecasting: Use PowerPoint forecast charts to present projected sales figures based on historical data, market trends, and growth patterns. This helps stakeholders understand future revenue expectations and make informed decisions.
- Financial Projections: Use forecast chart PPT to showcase financial projections, including revenue, expenses, profits, and cash flow. It helps investors, executives, and financial analysts assess the financial health and potential of a business.
- Market Analysis: Present PowerPoint forecast charts to illustrate market trends, market size, and anticipated growth in specific industries or regions. It helps businesses identify potential opportunities and plan their market strategies accordingly.
- Demand Forecasting: Use forecast charts to showcase anticipated demand for products or services. This enables supply chain managers and production teams to plan inventory levels, optimize resources, and meet customer demands efficiently.
Check out more data charts from our massive collection of slides.
Attached Files
| File |
|---|
| https://premiumdownloads.s3.amazonaws.com/SB03659-Forecast Chart PowerPoint Template.ZIP |
Login to download this file
Add to favorites
Add to collection
-
Item ID
SB03659 -
Rating
0.0
(0 reviews)
Tags
Related Templates
-
Sales Deck Free PowerPoint Template
PowerPoint Templates
Free
-

Cab Service PowerPoint Template
PowerPoint Templates
Premium
-

Nature PowerPoint Presentation Template
PowerPoint Business Templates
Premium
-

Free Vertical PowerPoint Template
PowerPoint Business Templates
Free
-

Research Proposal PowerPoint Template
PowerPoint Templates
Premium
-

Free Nursing Capstone PowerPoint Deck
PowerPoint Templates
Free
-
Free Space Minimal Deck Template
PowerPoint Templates
Free
-

Travel Agency PowerPoint Template
PowerPoint Templates
Premium
-

VET Clinic PowerPoint Template
PowerPoint Templates
Premium
-
Gym PowerPoint Template
PowerPoint Templates
Premium
-

Free Physical Education PowerPoint Template Deck
Free PowerPoint Templates
Free
-
IoT Presentation Template
PowerPoint Templates
Premium
-

Effective Communication PowerPoint Template
PowerPoint Templates
Premium
-

PowerPoint Quiz With Timer
PowerPoint Templates
Premium
-

Free Aviation PowerPoint Template
Free PowerPoint Templates
Free
-
Free Economics PowerPoint Template
Free PowerPoint Templates
Free
-
Macroeconomics PowerPoint Template
PowerPoint Templates
Premium
-
Graph Paper PowerPoint Template Deck
PowerPoint Templates
Premium
-
Customer Experience Loyalty PowerPoint Deck Template
PowerPoint Templates
Premium
-
Demand Generation Process PowerPoint Template
Business Models
Premium
-

Free Army PowerPoint Template
PowerPoint Templates
Free
-
Free Charity PowerPoint Template Deck
PowerPoint Templates
Free
-

Free Real Estate Listing PowerPoint Template
Free PowerPoint Templates
Free
-
Annual Report PowerPoint Template and Keynote
PowerPoint Templates
Premium
-

Animated Agriculture PowerPoint Deck Template
PowerPoint Templates
Premium
-
Demand Generation Process Template for PowerPoint Presentation
Diagrams
Premium
-

Free Cartoon PowerPoint Template
Free PowerPoint Templates
Free
-

Free Event Planning PowerPoint Template
Free PowerPoint Templates
Free
-
Demand Creation Process PowerPoint Template
Business Models
Premium
-
Free Book Review PowerPoint Template
Free PowerPoint Templates
Free
-

Free Stock Market PowerPoint Template
PowerPoint Templates
Free
-
Free University Presentation PowerPoint Template
PowerPoint Templates
Free
-
EFQM Model PowerPoint Template
PowerPoint Templates
Premium
-

Human Resource Planning Template
PowerPoint Templates
Premium
-
Global Warming Infographic PowerPoint Template Deck
PowerPoint Templates
Premium
-
Data Science PowerPoint Template
PowerPoint Templates
Premium
-

Real Estate PowerPoint Theme
PowerPoint Themes
Premium
-
Free Charts & Graphs Deck PowerPoint Template
PowerPoint Templates
Free
-

Free Dunder Mifflin Paper Company Pitch Deck
Free PowerPoint Templates
Free
-

Spline Chart PowerPoint Template
PowerPoint Charts
Premium
-

Go To Market PowerPoint Template
PowerPoint Templates
Premium
-

Data Over Time Line Chart PowerPoint Template
PowerPoint Charts
Premium
-

Free AI Artificial Intelligence PowerPoint Template
PowerPoint Templates
Free
-
Evolution Line Chart PowerPoint Template
PowerPoint Templates
Premium
-
Free Charts and Graphs PowerPoint Template
PowerPoint Templates
Free
-
Demand Creation Strategy Template for PowerPoint and Keynote
Business Models
Premium
-
Sales Process PowerPoint Template
PowerPoint Templates
Premium
-

Finance Consulting PowerPoint Template
PowerPoint Templates
Premium
-
Stakeholder Register PowerPoint Template
PowerPoint Templates
Premium
-
Proportional Area Chart PowerPoint Template
PowerPoint Templates
Premium
-
Business Process Reengineering Template
PowerPoint Templates
Premium
-
Cost Volume Profit Analysis PowerPoint Template
PowerPoint Templates
Premium
-
Mekko Chart Template
PowerPoint Templates
Premium
-
Combination Chart PowerPoint Template
PowerPoint Charts
Premium
-
Quarterly Sales Chart PowerPoint Template and Keynote Slide
Column and Bar chart
Premium
-
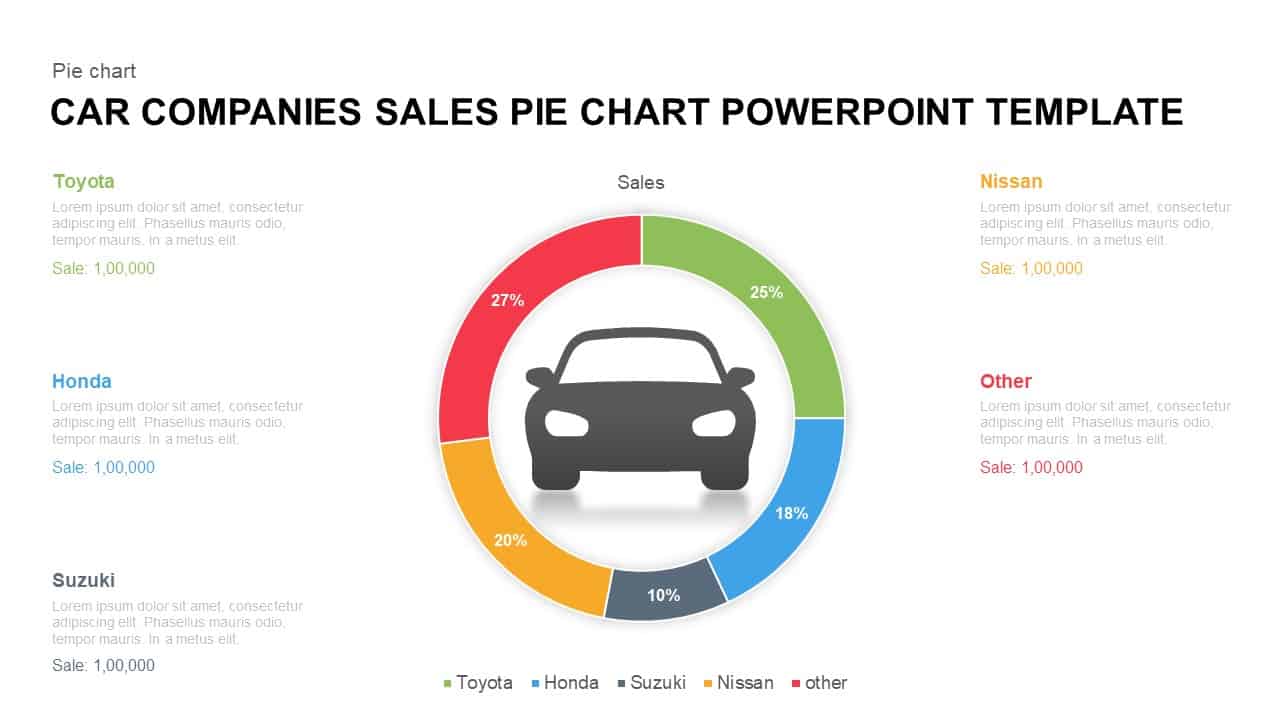
Car Companies Sales Pie Chart Template for PowerPoint & Keynote
Column and Bar chart
Premium
-
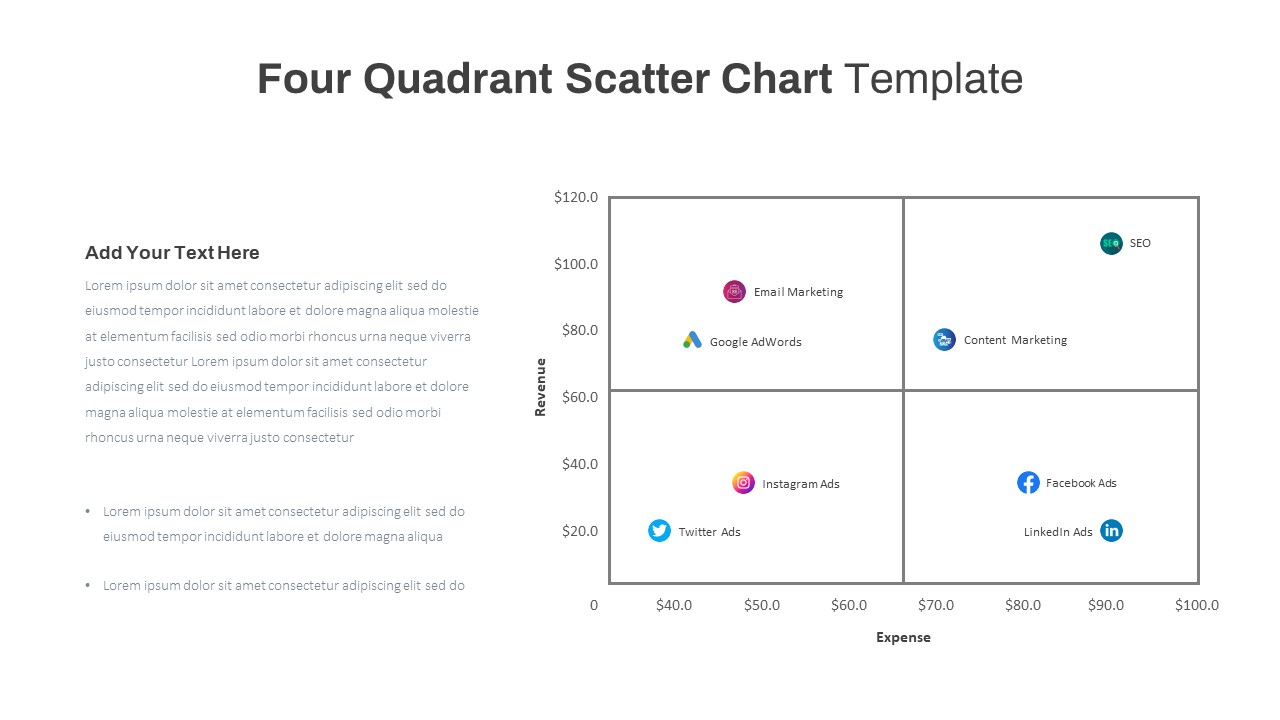
Four Quadrant Scatter Chart PowerPoint Template
PowerPoint Charts
Premium
-

Animated Upcoming Event Poster PowerPoint Template
PowerPoint Templates
Premium
-

Segmented Scatter Chart PowerPoint Template
PowerPoint Charts
Premium
-
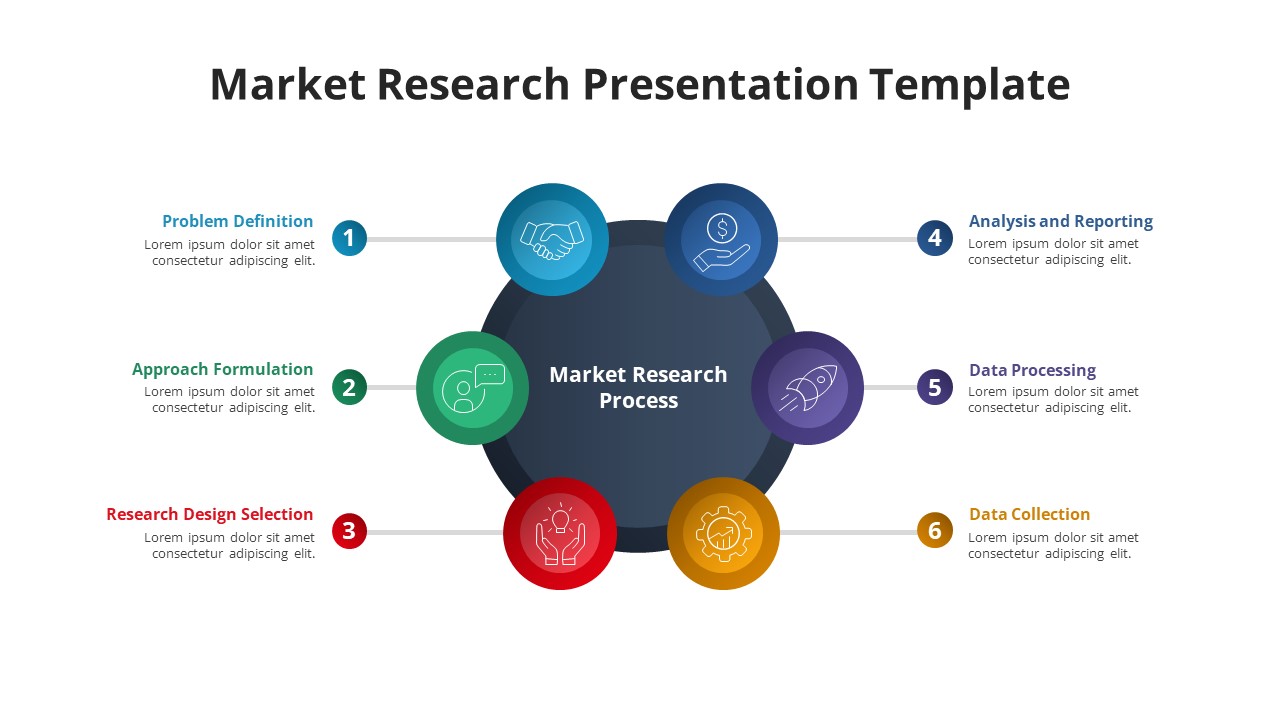
Market Research PowerPoint Template Free
PowerPoint Templates
Free
-
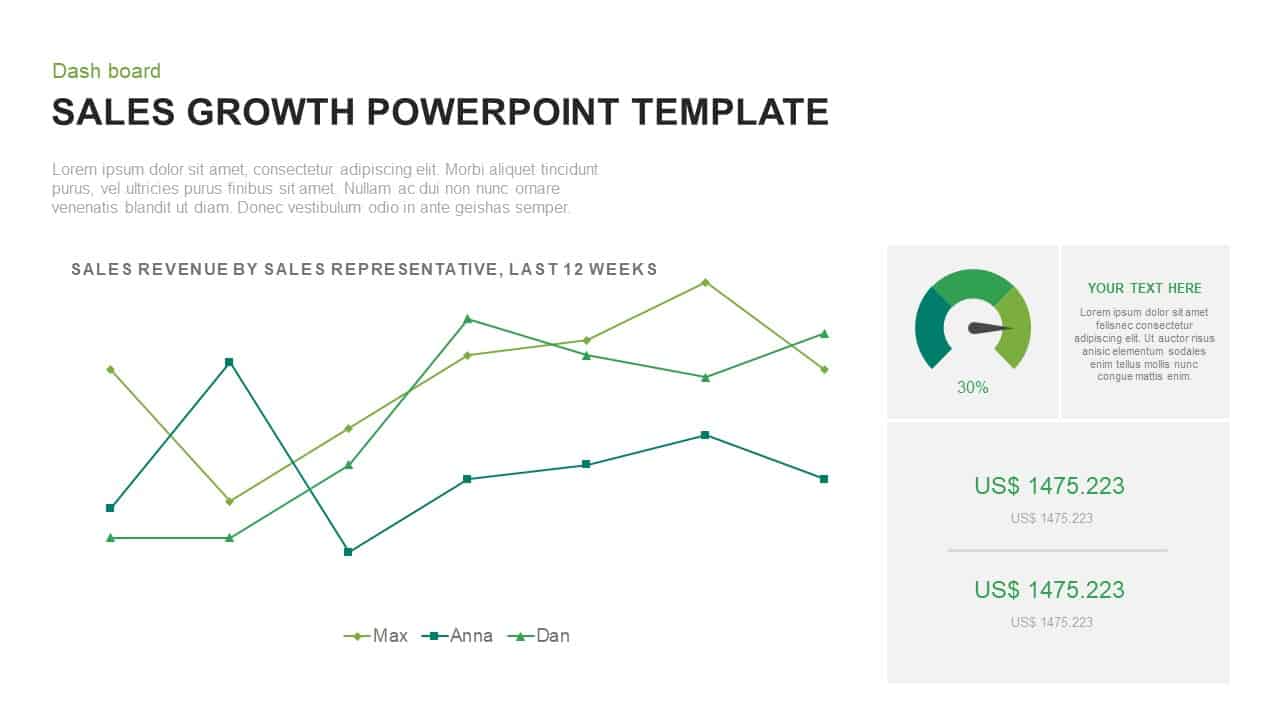
Sales Growth PowerPoint Presentation Template
Curves and Lines
Premium
-

Sun Burst Chart PowerPoint Template
Circular Diagrams
Premium
-

Area Chart PowerPoint Template
PowerPoint Charts
Premium
-
Set of Chart PowerPoint Template and Keynote Diagram
PowerPoint Charts
Premium
-

Data Driven Line Chart Template for PowerPoint & Keynote
Curves and Lines
Premium
-
Sales Cycle Steps PowerPoint Template and Keynote Template
Circular Diagrams
Premium
-

Biotechnology PowerPoint Presentation Template
PowerPoint Templates
Premium
-

Open Door Policy PowerPoint Template
PowerPoint Templates
Premium
-
Arrow Line Chart PowerPoint Template
Arrow Diagrams
Premium
-
4 Step Sales Funnel Template PowerPoint
Funnel Diagrams
Premium
-

Jump Line Chart PowerPoint Template
Column and Bar chart
Premium
-
Weekly Data Charts PowerPoint Presentation Template and Keynote Slide
Infographic
Premium
-

Sales Meeting Presentation Template
PowerPoint Business Templates
Premium
-
Sales Roadmap PowerPoint Template
PowerPoint Business Templates
Premium
-
Sales Plan and Strategy Presentation Template
PowerPoint Templates
Premium
-
Financial Statement PowerPoint Template
PowerPoint Templates
Premium
-
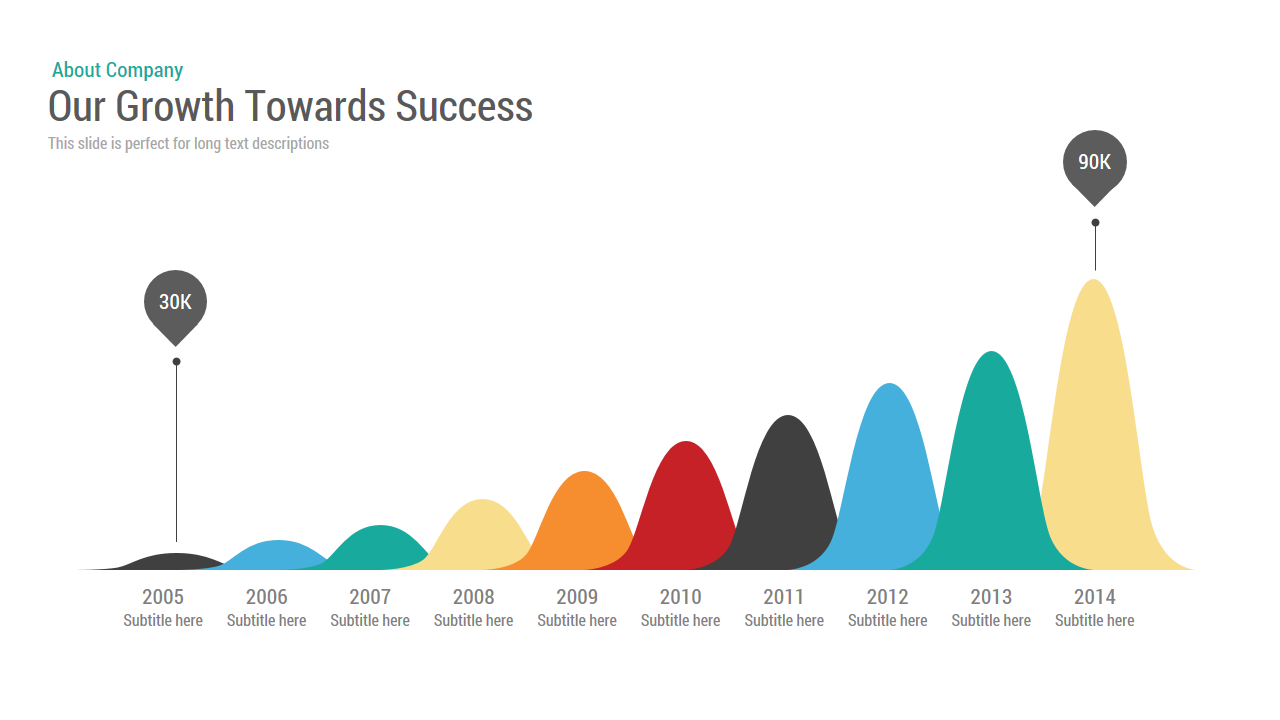
Business Growth Chart Template for PowerPoint and Keynote
Business Models
Premium
-

Power Analogy Metaphor PowerPoint Template
Metaphor, Simile & Analogy
Premium
-

Cyber Monday PowerPoint Template
PowerPoint Business Templates
Premium
-
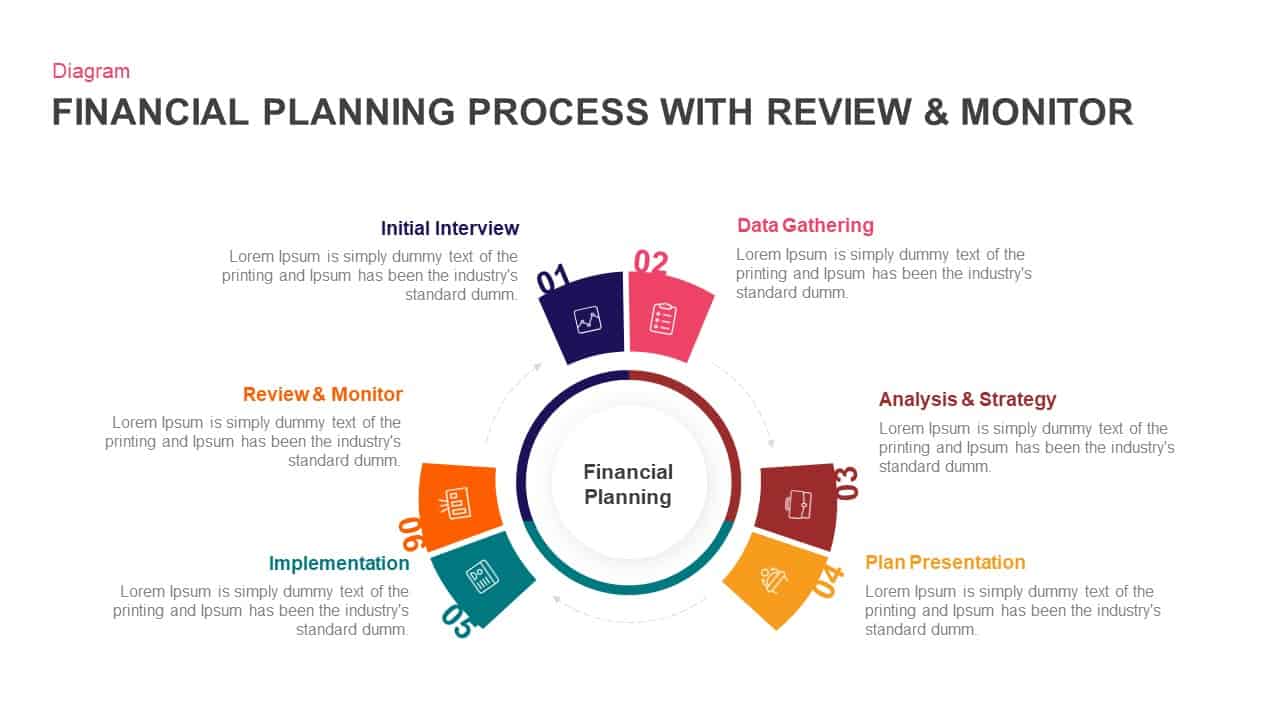
Financial Planning Process With Review and Monitor Template for PowerPoint & Keynote
Business Models
Premium
-
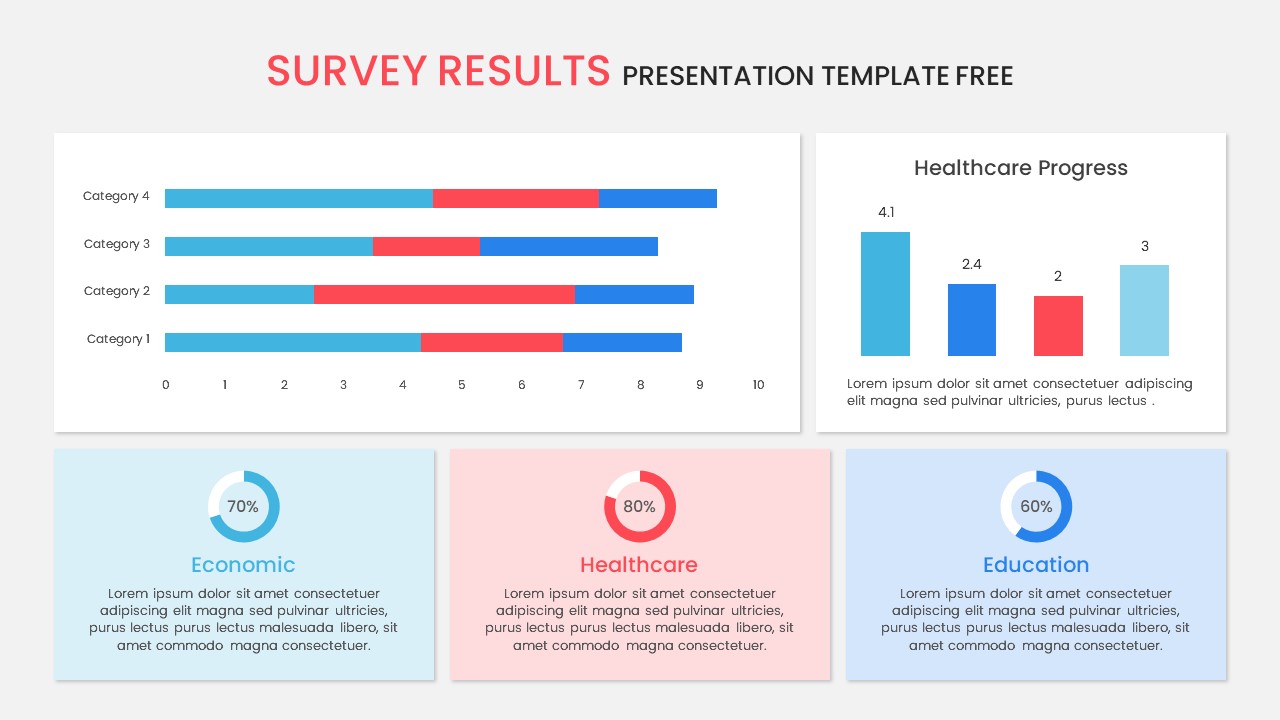
Survey Results PowerPoint Template Free
Free PowerPoint Templates
Free
-
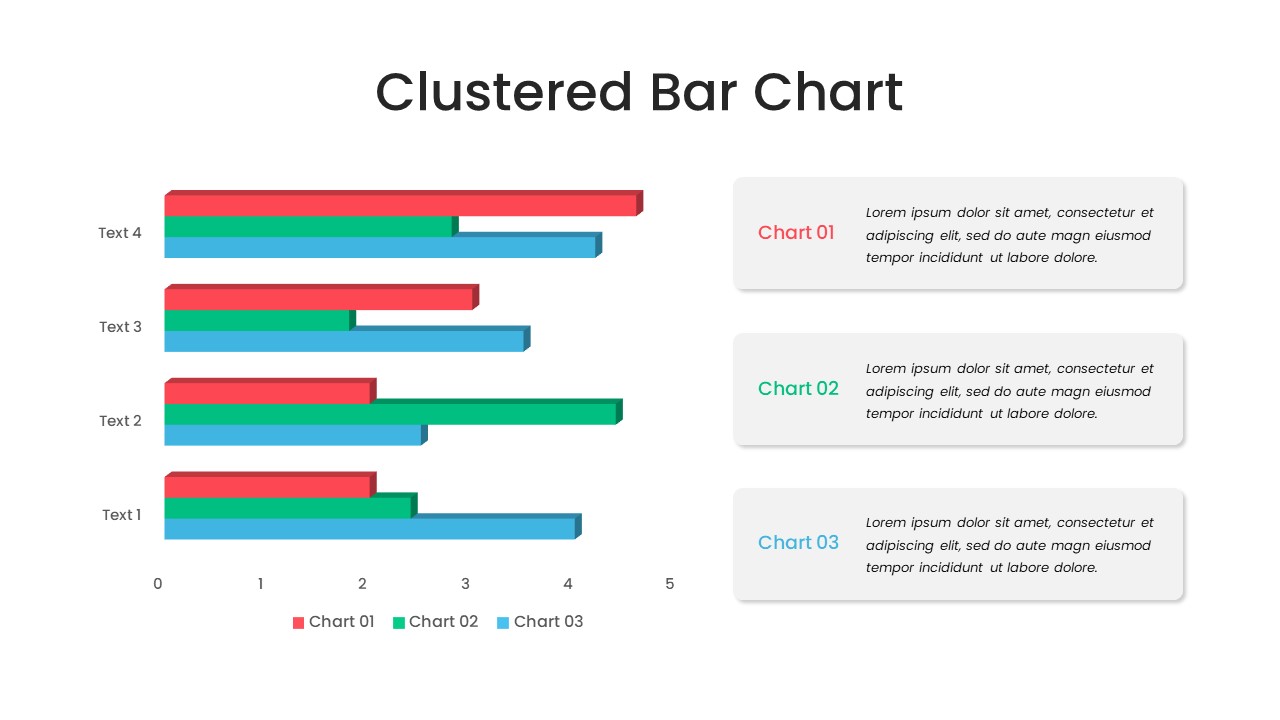
Clustered Bar Chart PowerPoint Template
Column and Bar chart
Premium
-
Financial Report Metaphor PowerPoint Presentation Template
Metaphor, Simile & Analogy
Premium
-
Financial Growth Template for PowerPoint & Keynote
Business Models
Premium
-
Stacked Area Chart PowerPoint Template
PowerPoint Charts
Premium
-
Line Chart PowerPoint Template
PowerPoint Charts
Premium
-
Comparison Donut Chart PowerPoint Template and Keynote
Keynote Templates
Premium
-

Multipurpose Business PowerPoint Template
PowerPoint Business Templates
Premium
-
Company Performance Business Growth PowerPoint Template
Business Models
Premium
-

Waffle Chart PowerPoint Template
PowerPoint Templates
Premium
-
Key Financial Ratios PowerPoint Template
PowerPoint Templates
Premium
-
Sales Promotion Timeline Template for PowerPoint and Keynote Presentation
Timeline PowerPoint Template
Premium
-
Growth Strategy PowerPoint Template
PowerPoint Templates
Premium
-
Bubble Chart PowerPoint Template
PowerPoint Templates
Premium
-

Creative Bar Chart Data Analysis PowerPoint Template and Keynote
Infographic
Premium
-

Cylinder Bar Chart PowerPoint Template and Keynote Slide
Column and Bar chart
Premium
-

Clustered Column Chart PowerPoint Template
PowerPoint Charts
Premium
-
Big Data Infographic Deck For PowerPoint
PowerPoint Business Templates
Premium
-
Free Go To Market Strategy PowerPoint Template
Circular Diagrams
Free
-
3D Printing Deck PowerPoint Template
PowerPoint Templates
Premium


