


Fishbone Infographic PowerPoint Template


- Version 1.0.0
- Download 23
- File Size 0.00 KB
- File Count 1
- Create Date October 16, 2021
- Last Updated July 9, 2022
Fishbone Infographic PowerPoint Template
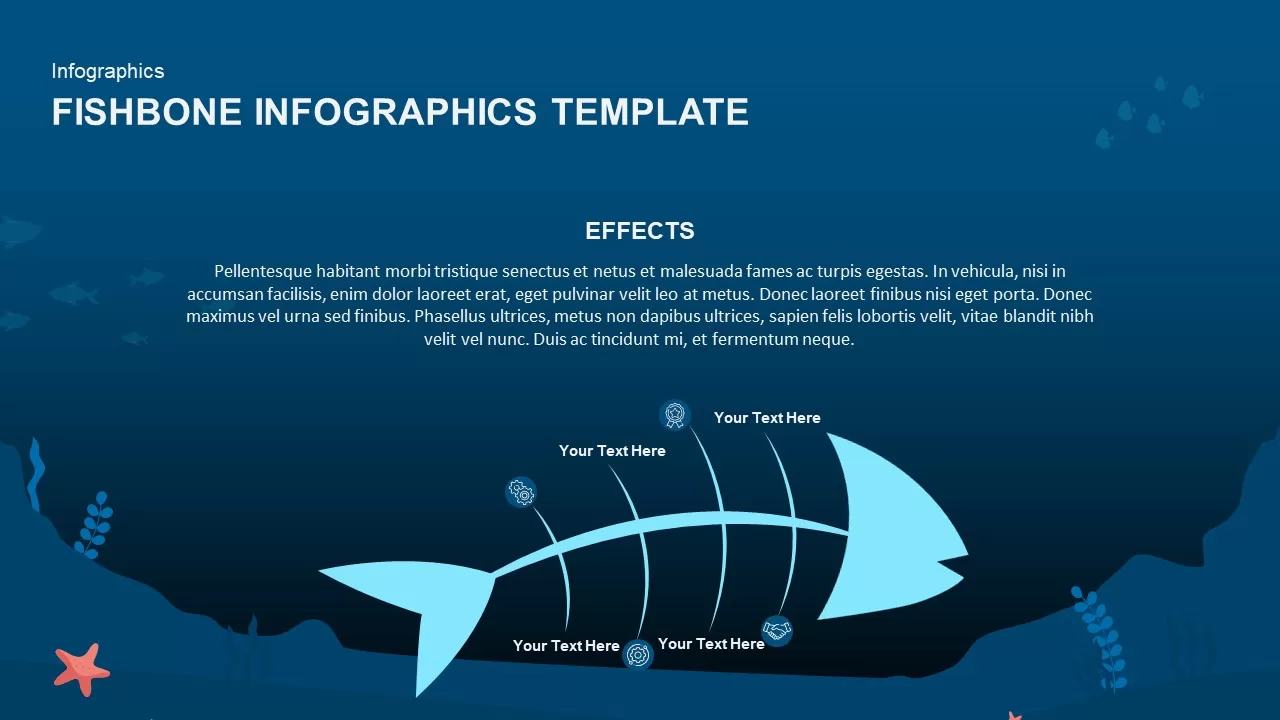
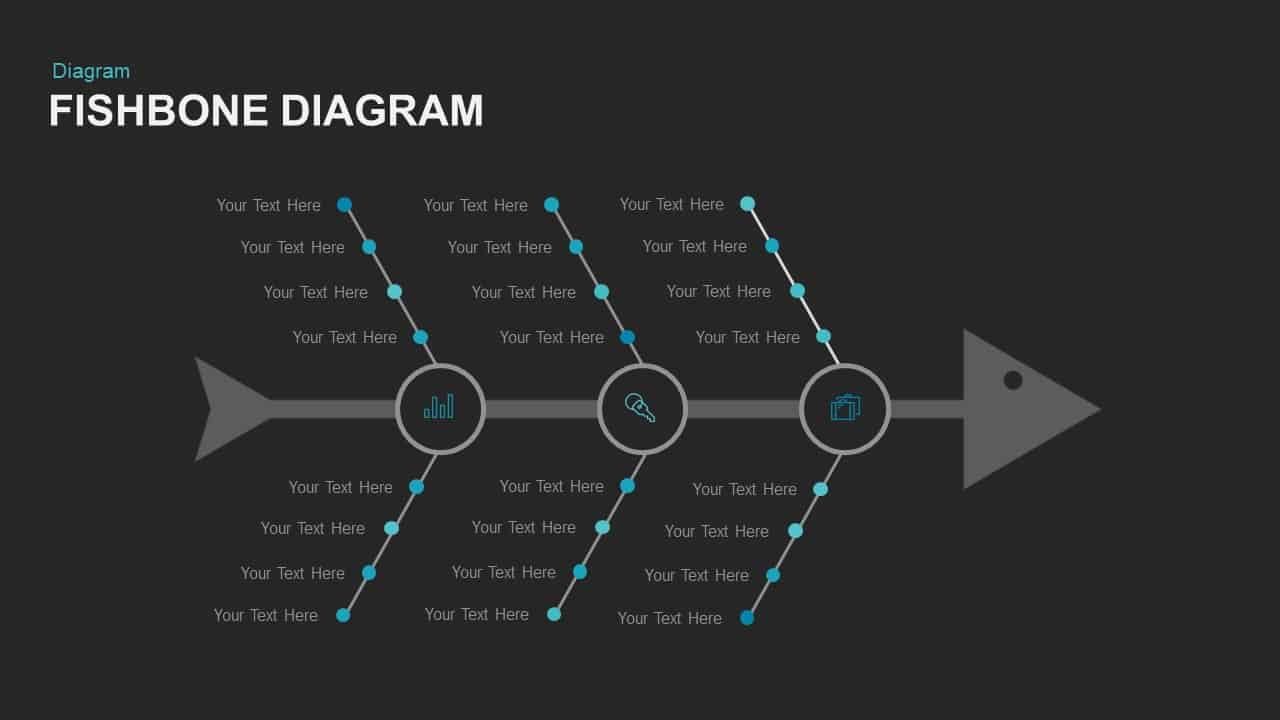
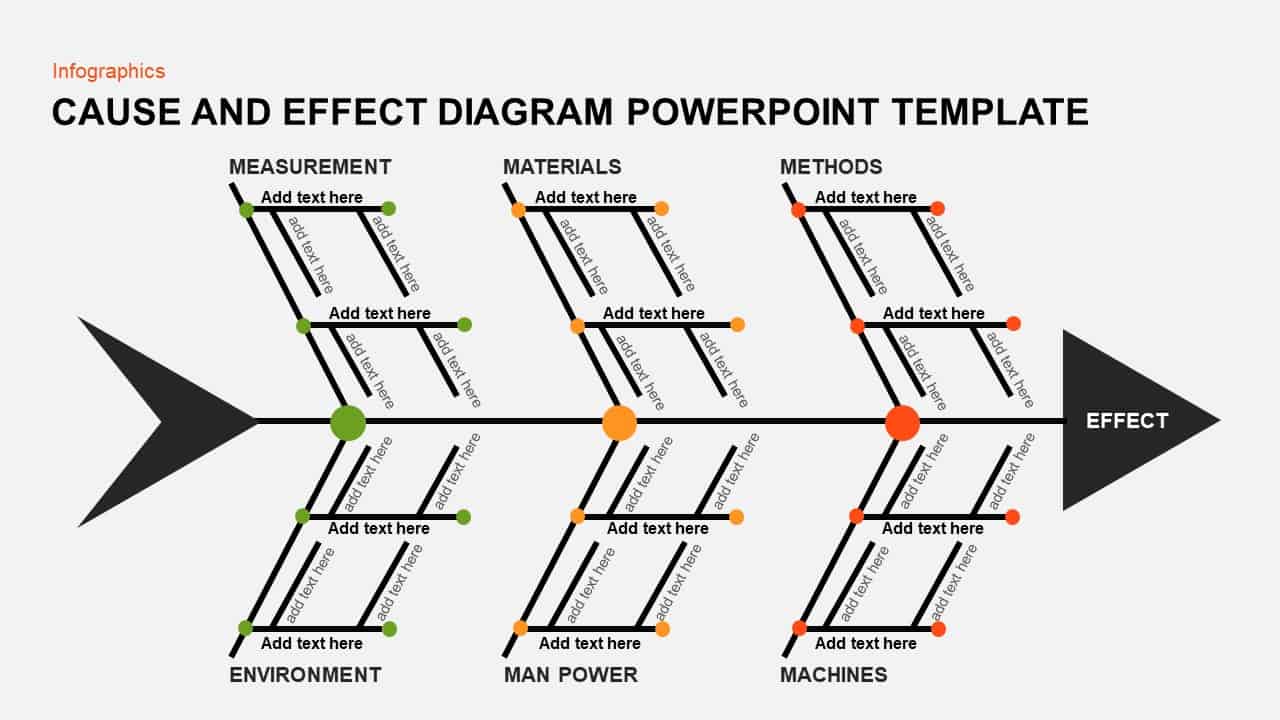
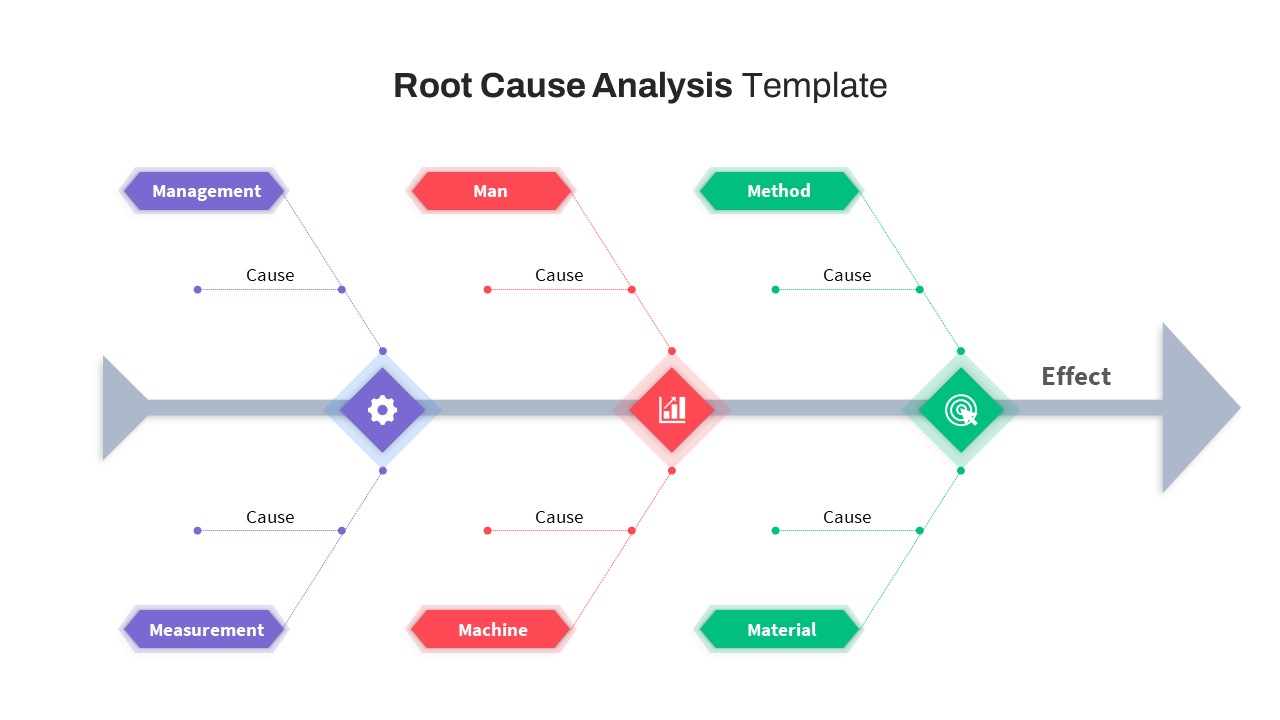
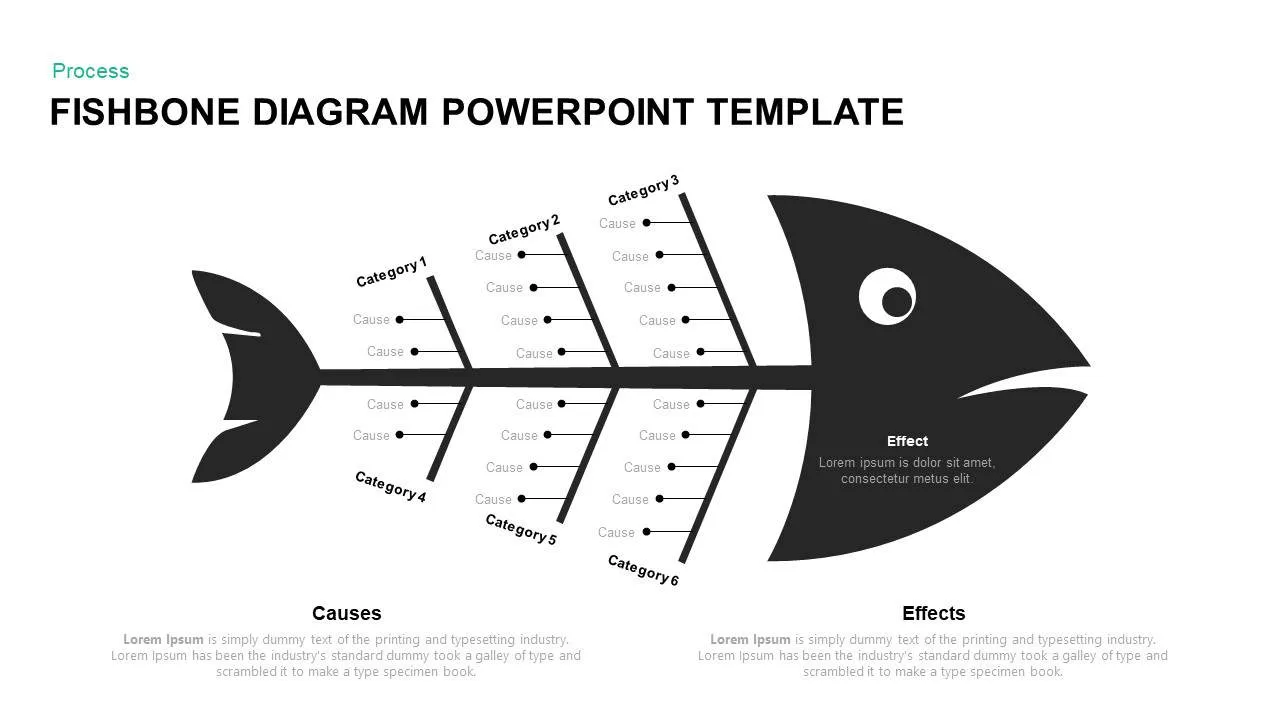
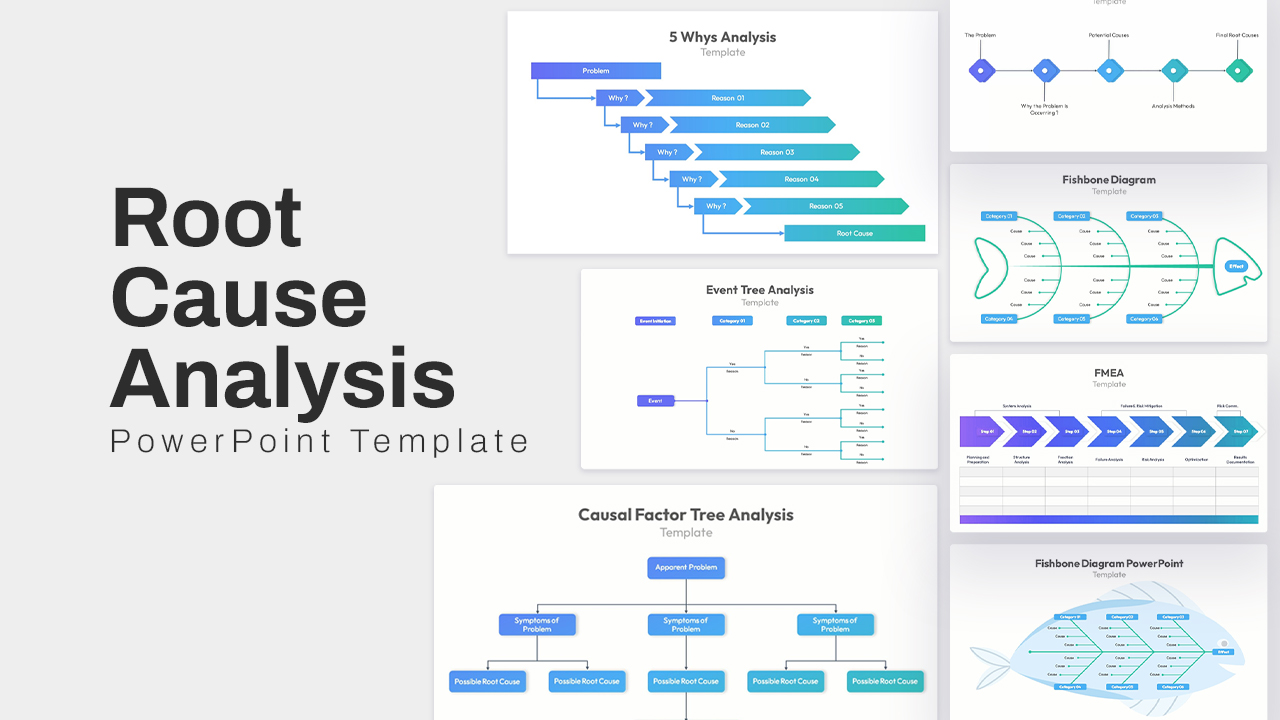
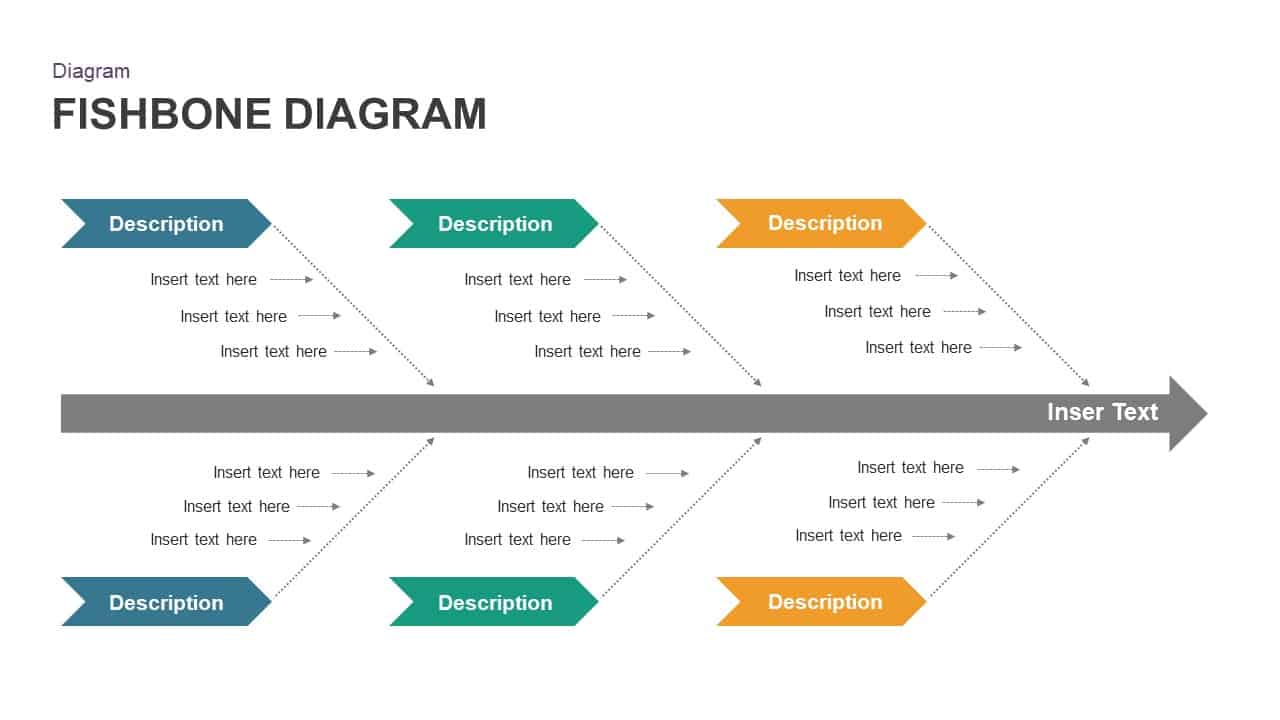
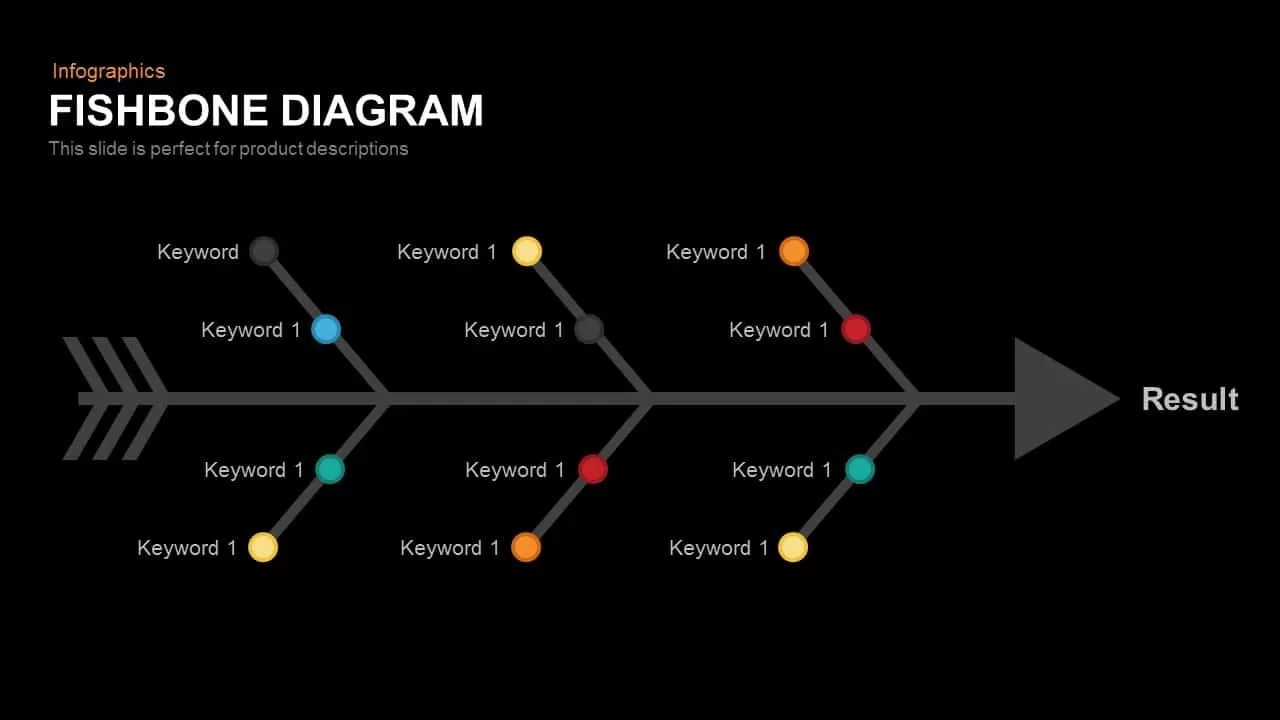
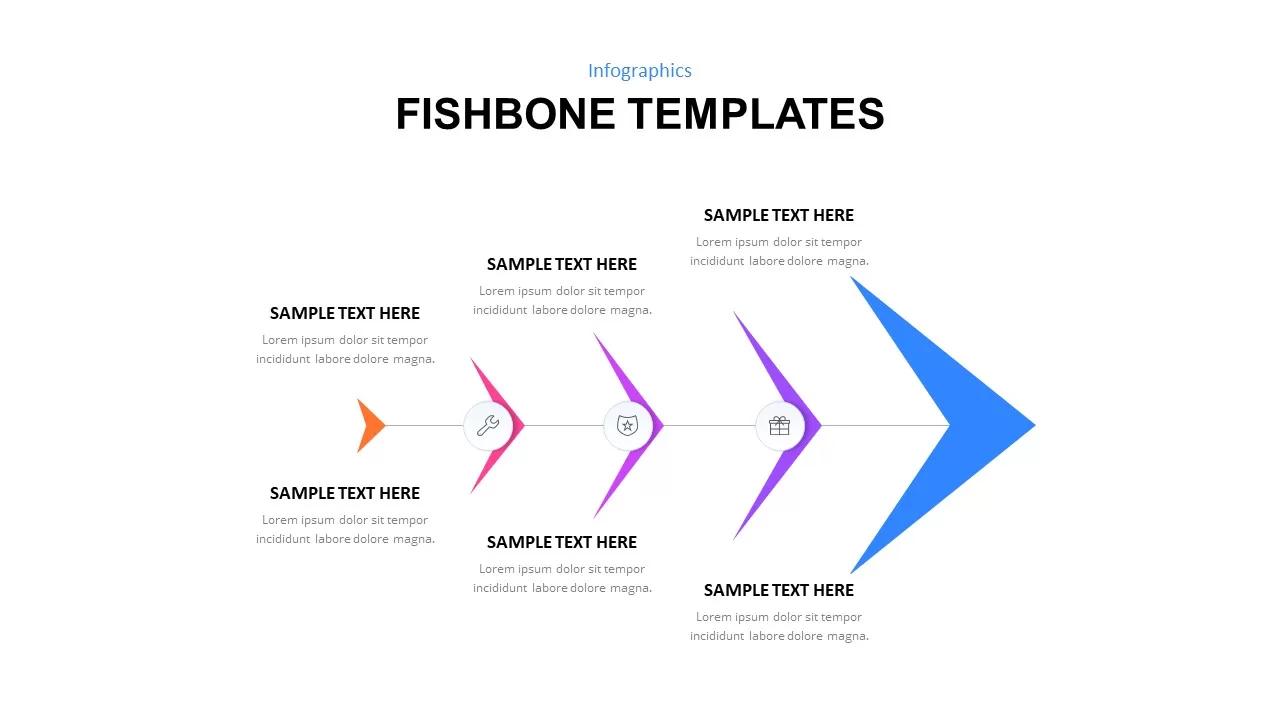
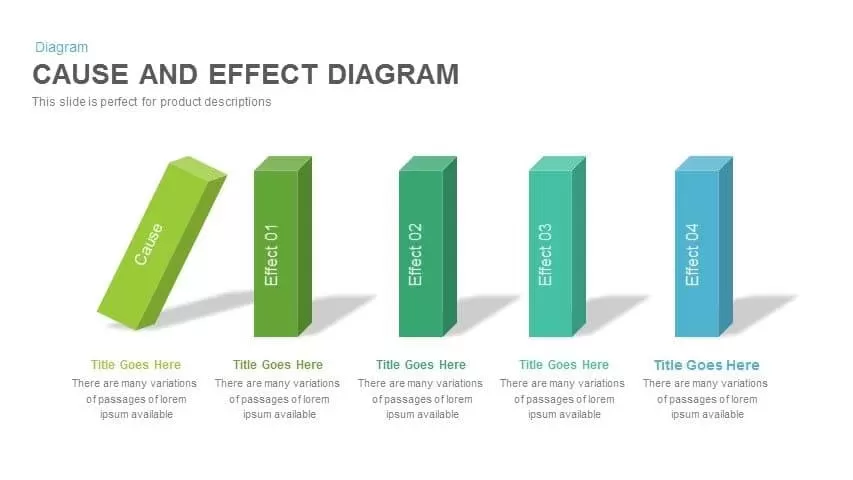
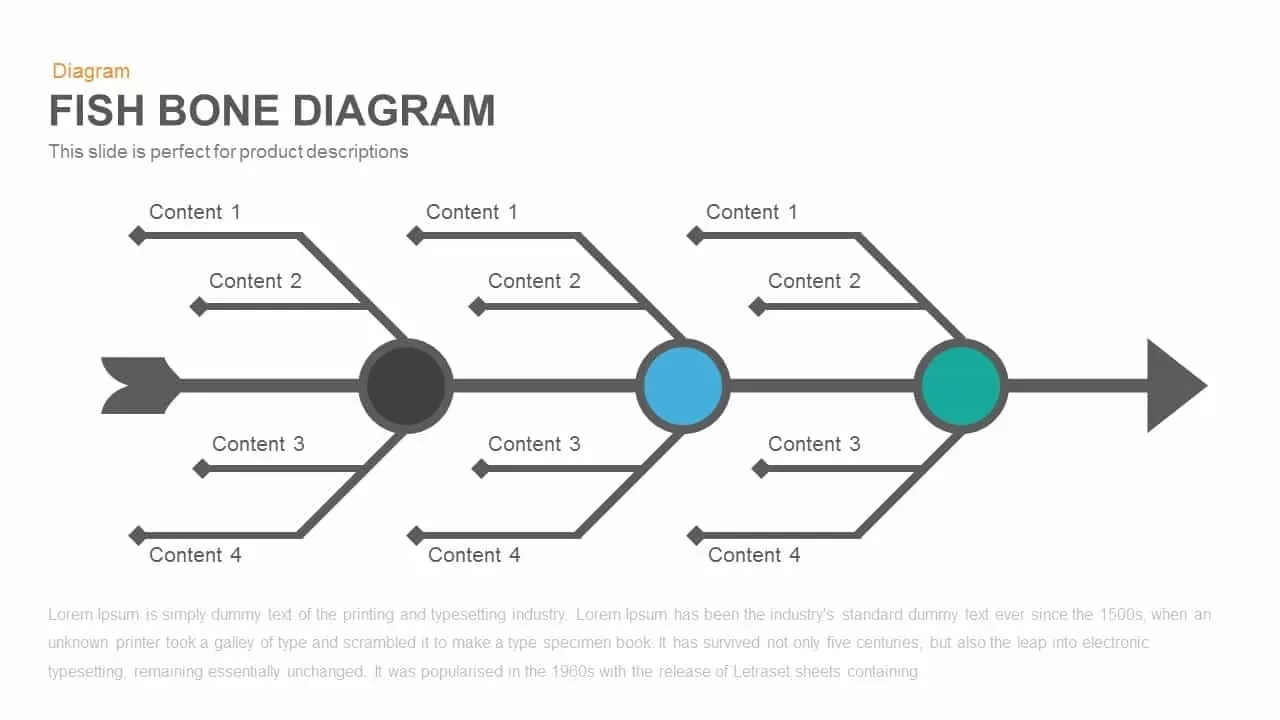
Fishbone infographics template help presenting analyzed results of your subject’s cause and effect relationship. Root cause analysis PowerPoint will assist you in displaying your research findings by the fishbone diagram. The figure is fit for academic research institutes and business research establishments to find out the logical connections of a phenomenon. Fishbone diagram or Ishikawa diagram is useful for ROOT CAUSE analysis of an event or an occurrence, which will explain the causal relationship between two or more variables. Many of the problems remain unexplained because of our failures to found the root cause. In psychology, most of the mental problems are not been defined. So, medicines are not available or not effective for most mental illnesses. If we need medicines in these matters we should analyze the root cause of the problem.
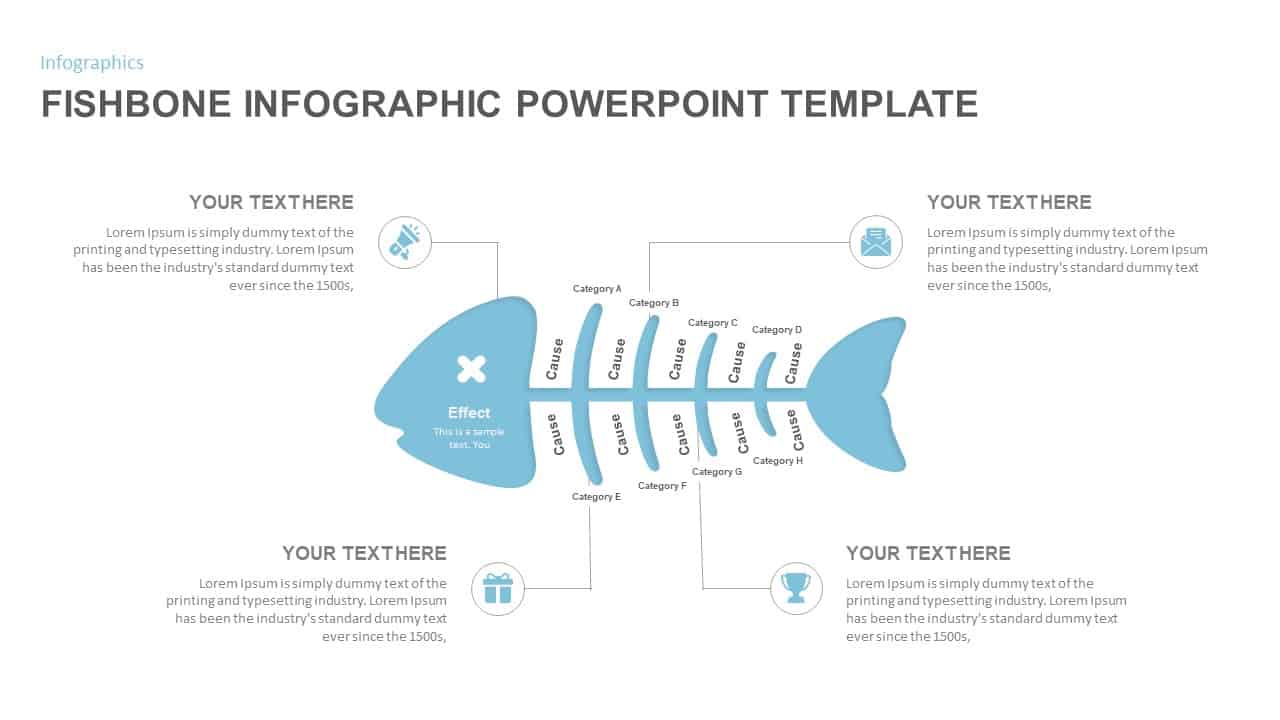
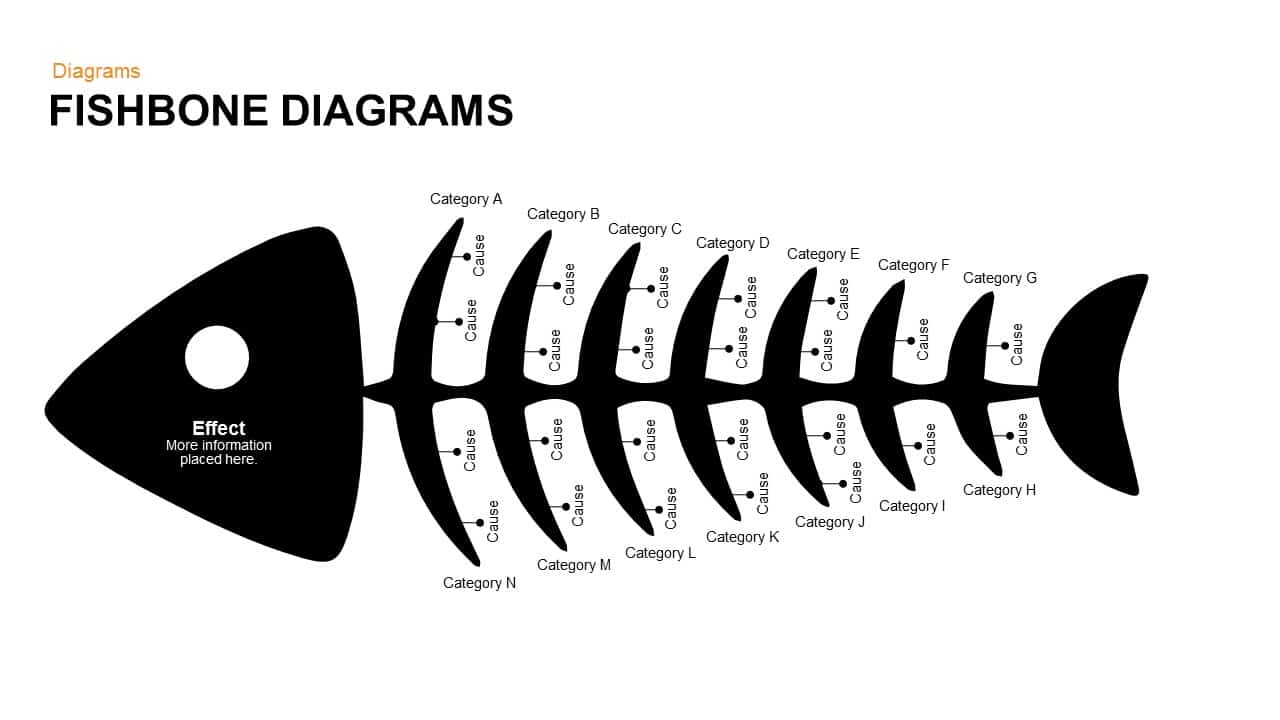
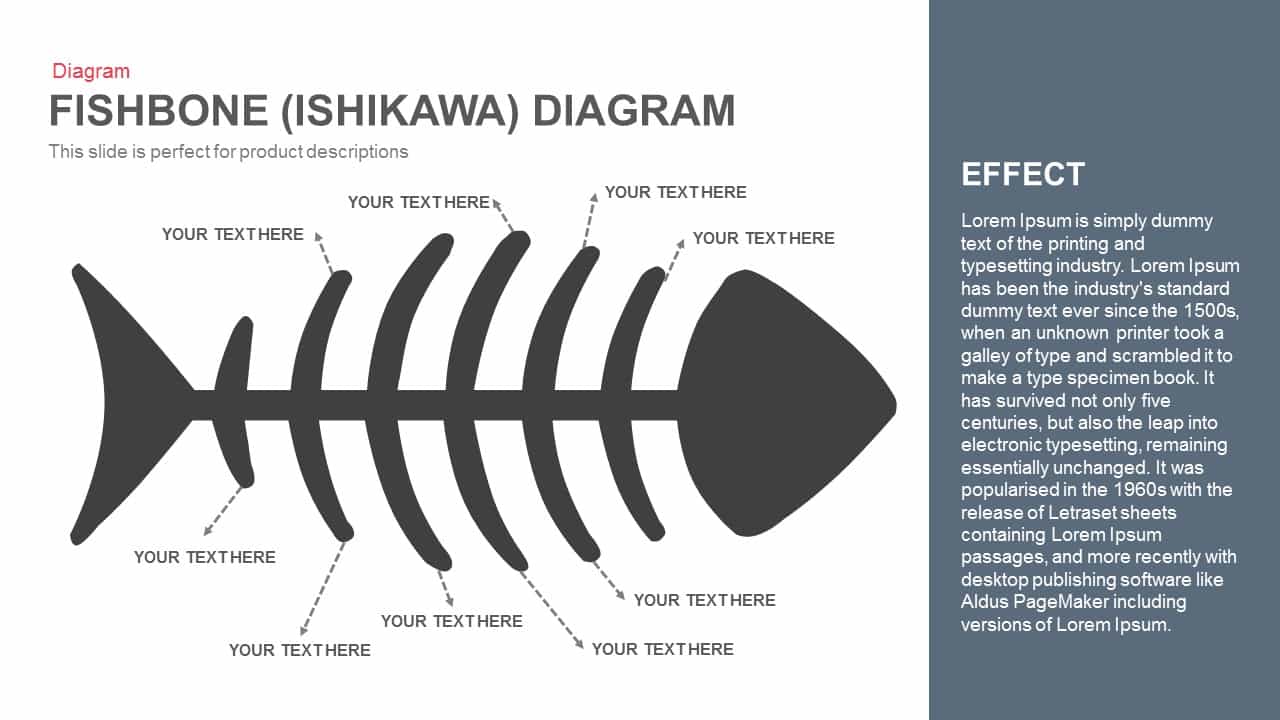
Fishbone PowerPoint template is normally shown by a fish and its skeletons. The Head is the effect bones are the various causes, both are interrelated and interdependent. It can be useful to classify many dissimilar causes behind an effect. The fishbone PowerPoint diagram is not as simple to present brief concepts. So this research PowerPoint is shaped for the professionals who are theoretically sounded with scientific knowledge. The user can label different causes and their possibilities to make an effect. The structure of a fishbone diagram contains four major elements: the effect, the spine, the branches, and ultimately the causes.
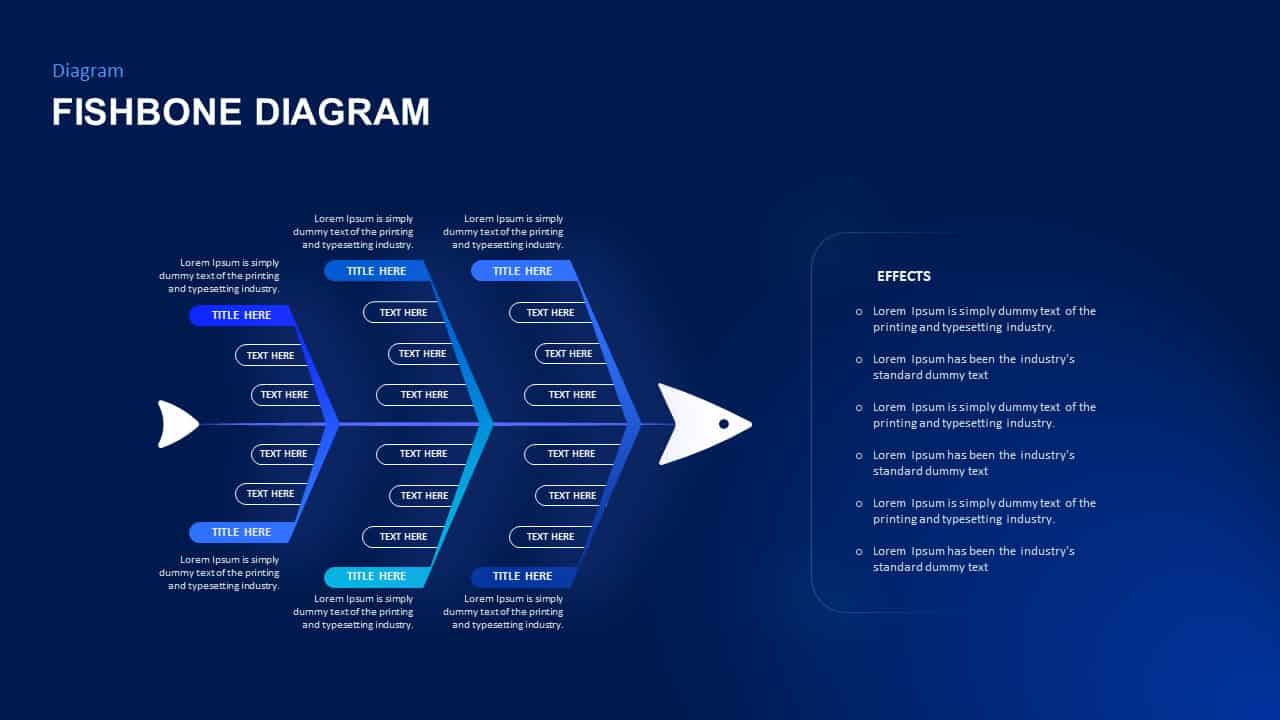
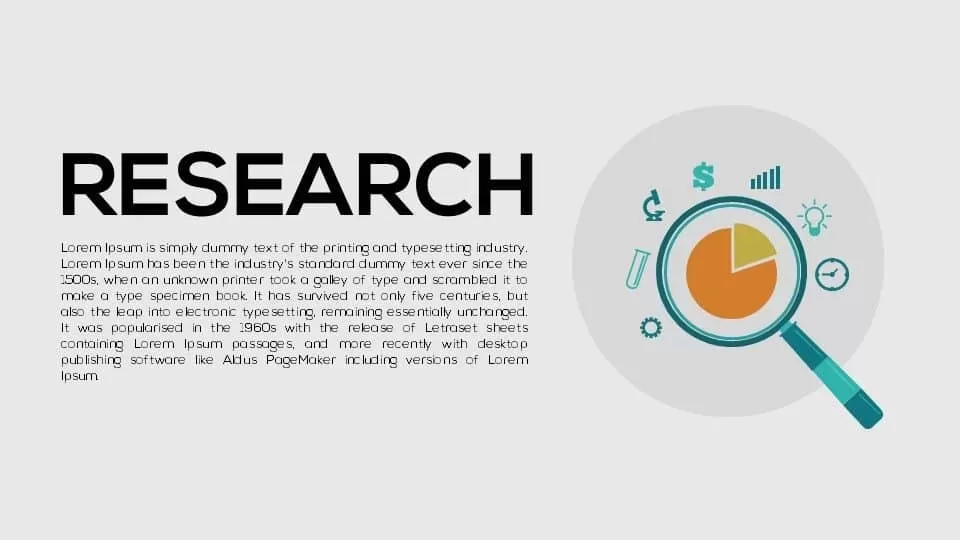
Fishbone infographic template is a perfect research PowerPoint to conclude the logical connections between the variables. Data presentation templates are high impactful PowerPoint tools that allow the users to create precise data before their audience. If you use generic PowerPoint presentation templates to display your research topics, it wouldn’t affect your desires and wishes. so if you are a researcher it’s better to switch on particular templates that are created to showcase research problems and their root cause analysis.
Attached Files
| File | Action |
|---|---|
| https://premiumdownloads.s3.amazonaws.com/SB01987-Fishbone Infographics Template.zip | Download |
Login to download this file
Add to favorites
Add to collection
-

Item ID
SB01987 -

Related Templates
-
Fishbone Diagram PowerPoint Template
Fishbone PowerPoint Templates
Premium
-
Fishbone Diagram Template
Fishbone PowerPoint Templates
Premium
-
Fishbone Diagram Template for PowerPoint and Keynote Slide
Fishbone PowerPoint Templates
Premium
-
Fishbone Diagram PowerPoint Template and Keynote Slide
Diagrams
Premium
-
Cause and Effect Diagram Template for PowerPoint and Keynote Slide
Fishbone PowerPoint Templates
Premium
-
Free Root Cause Analysis PowerPoint Template
Fishbone PowerPoint Templates
Free
-
Fishbone Diagram Template PowerPoint and Keynote
Fishbone PowerPoint Templates
Premium
-
Root Cause Analysis PowerPoint Template
Arrow Diagrams
Premium
-
Root Cause Analysis PowerPoint Template
Business Models
Premium
-
Fishbone Diagram PowerPoint Template and Keynote Slide
Diagrams
Premium
-
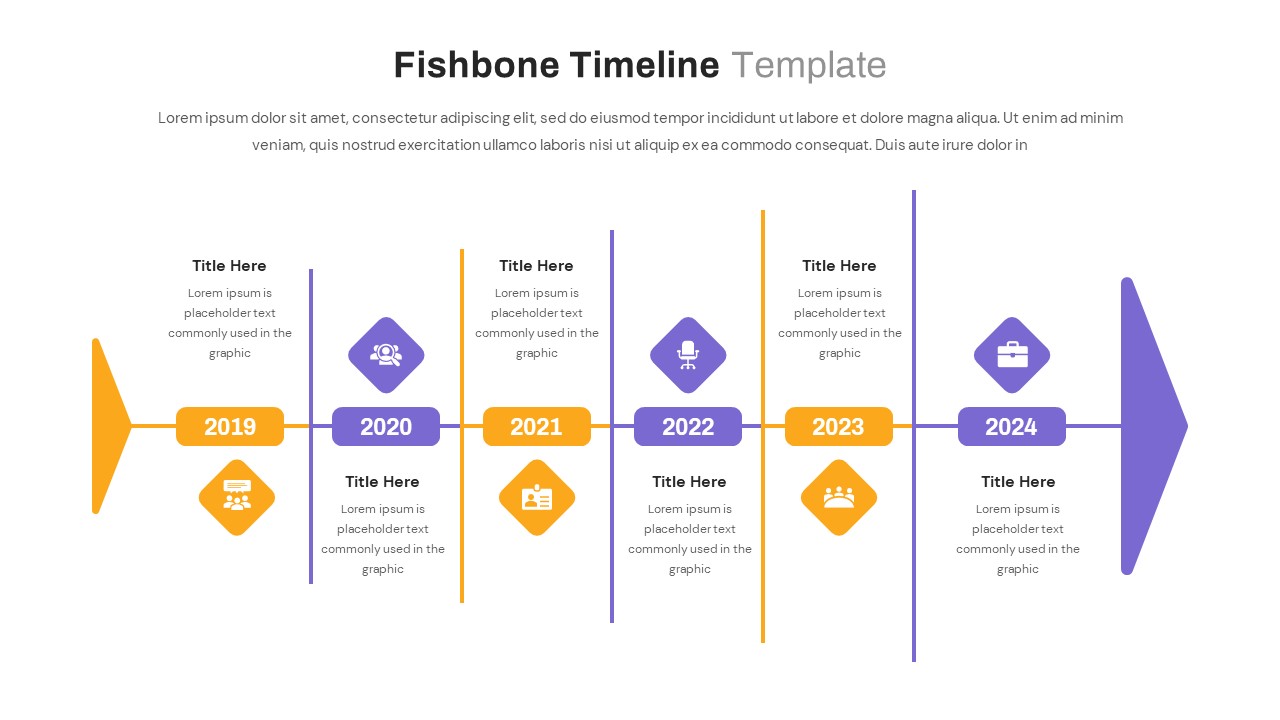
Fishbone Timeline Template
Timeline PowerPoint Template
Premium
-
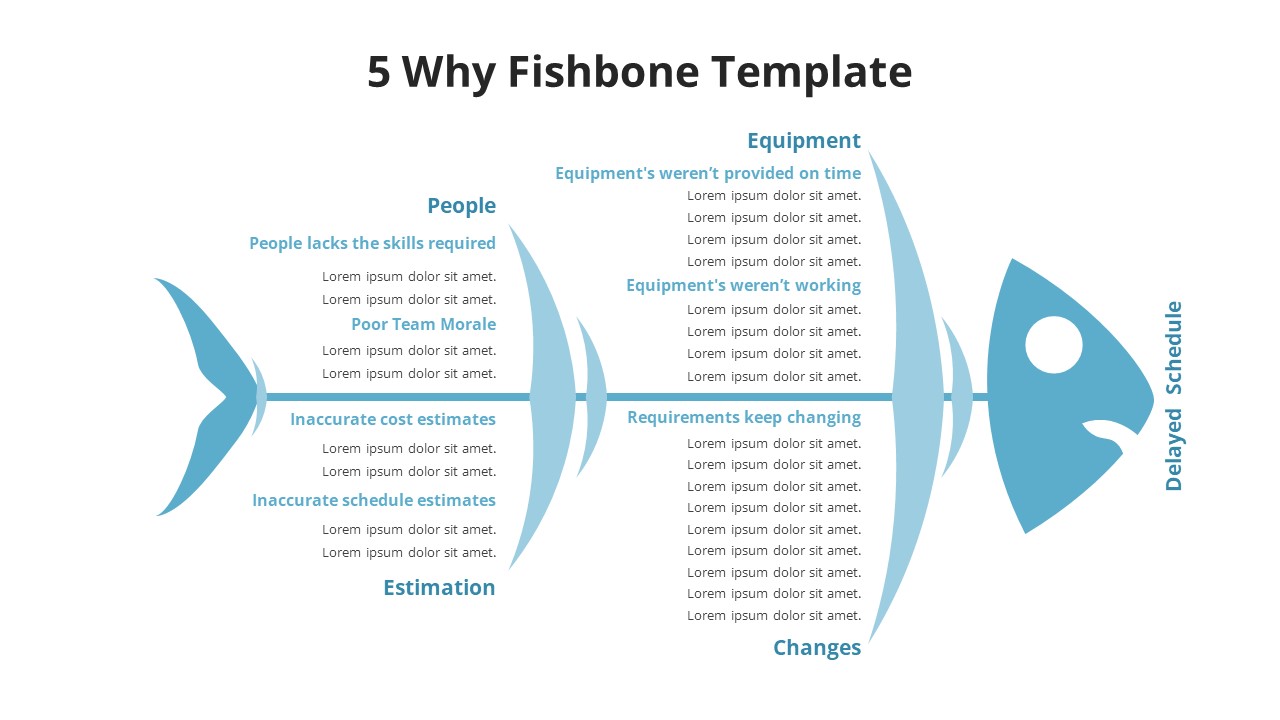
5 Why Fishbone PowerPoint Template
Fishbone PowerPoint Templates
Premium
-
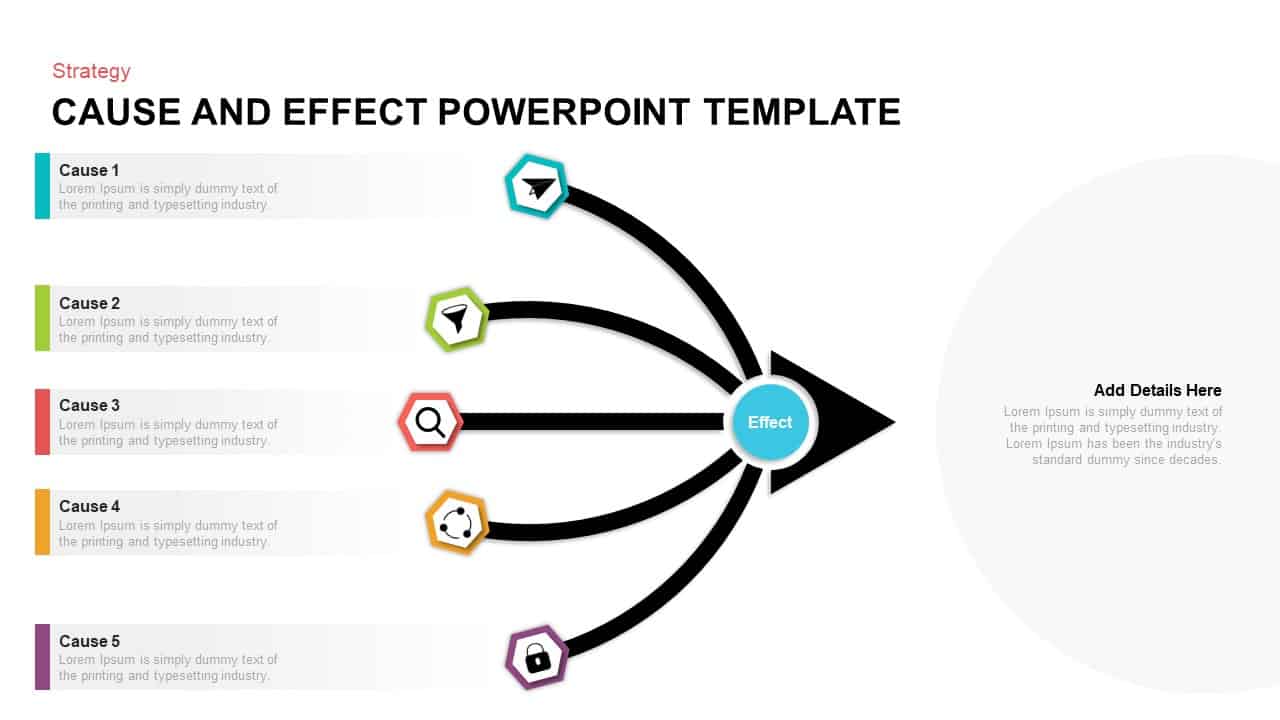
Cause and Effect Template for PowerPoint & Keynote
Fishbone PowerPoint Templates
Premium
-
Root Cause Analysis PowerPoint Presentation Template
Tree Diagrams
Premium
-
Free Fishbone Diagram Template PowerPoint
Fishbone PowerPoint Templates
Free
-
Fishbone Powerpoint Template Keynote Diagram
Fishbone PowerPoint Templates
Premium
-
Fishbone Template for PowerPoint Presentation
Fishbone PowerPoint Templates
Premium
-
Cause and Effect Diagram PowerPoint Template and Keynote Slide
Business Models
Premium
-
Fishbone Diagram PPT Template and Keynote Slide
Diagrams
Premium
-
Research PowerPoint Template and Metaphor Keynote Template
Keynote Templates
Premium
-
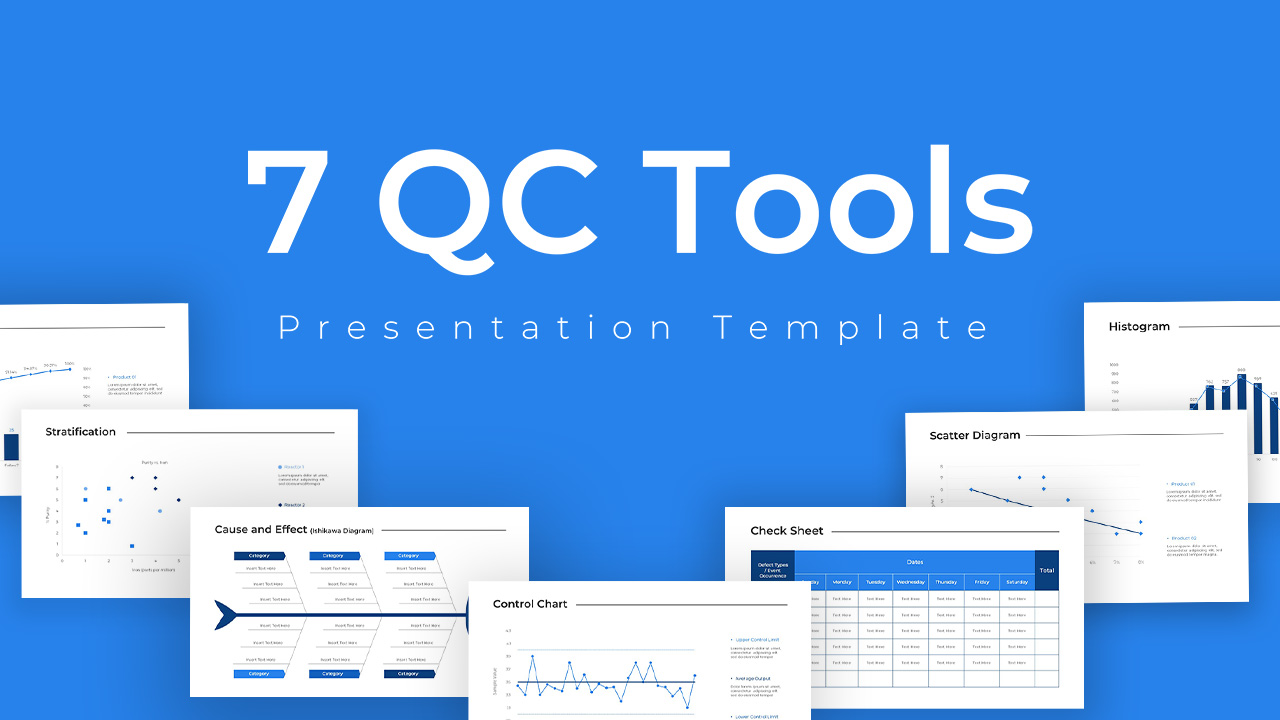
QC Tools PowerPoint Template
Infographic
Premium
-
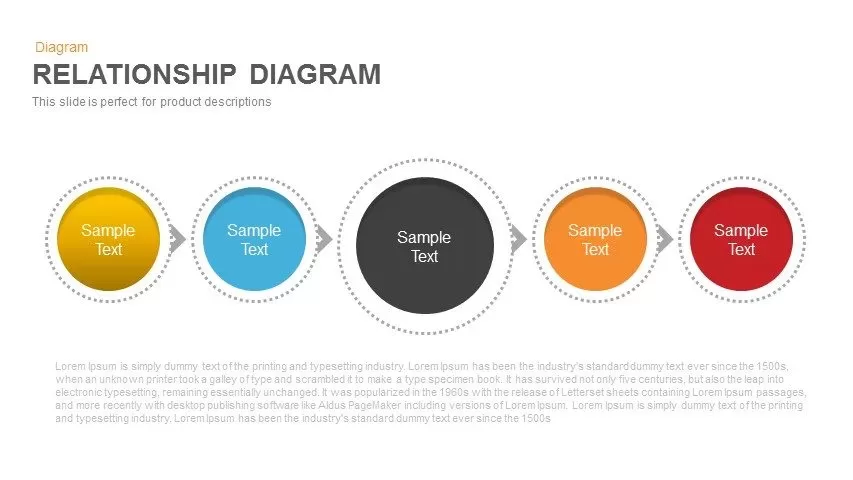
Relationship Diagram PowerPoint Template and Keynote Slide
Business Models
Premium
-
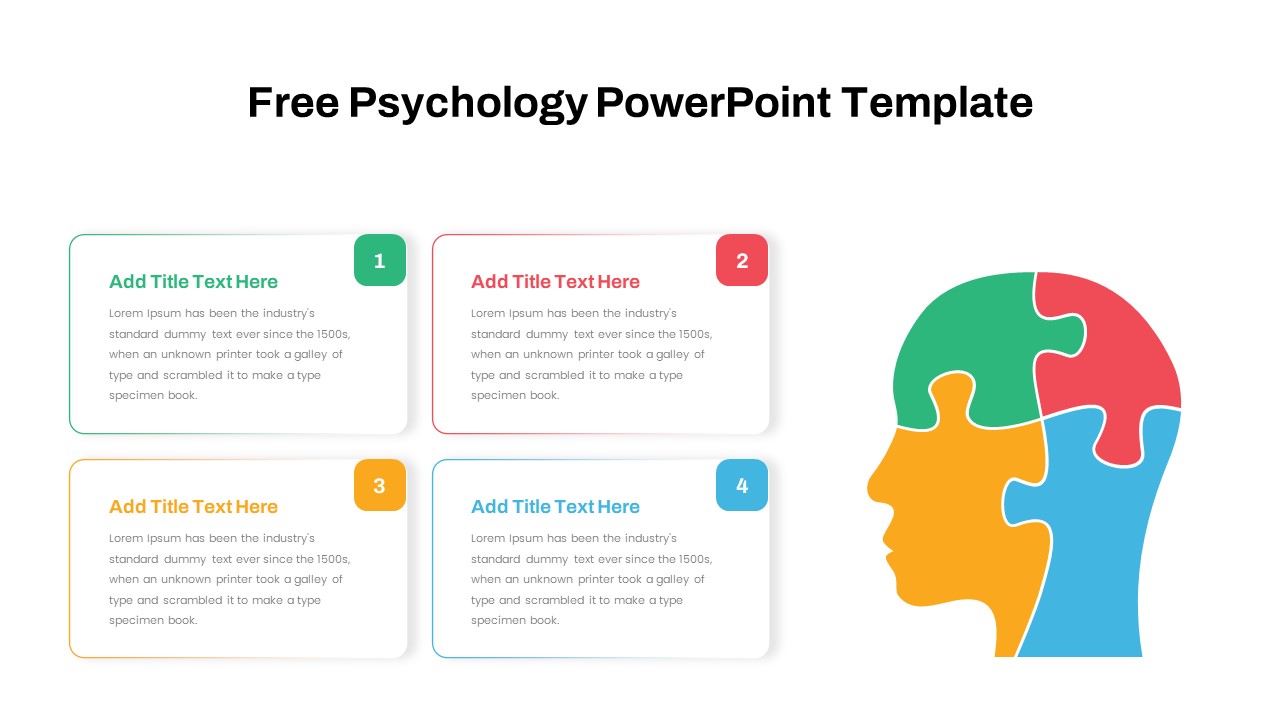
Free Psychology PowerPoint Template
PowerPoint Templates
Free
-

Research Proposal PowerPoint Template
PowerPoint Templates
Premium
-
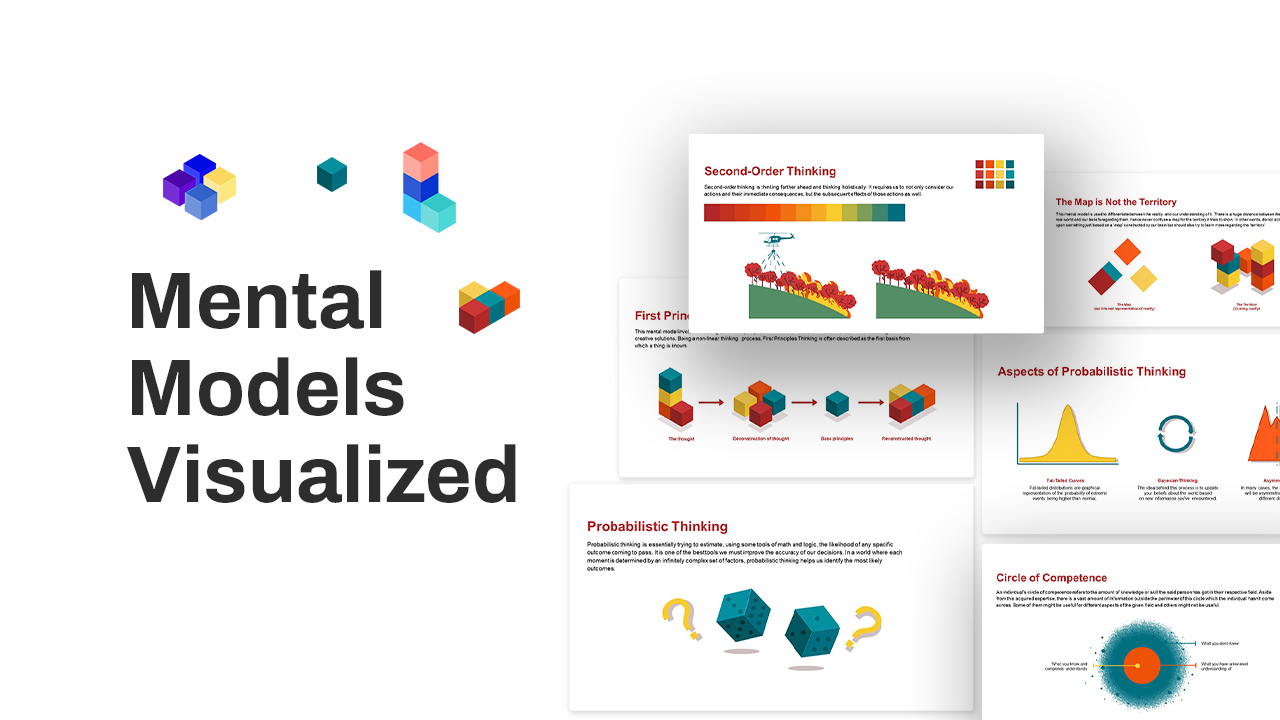
Free Mental Models Visualized
Business Models
Free
-
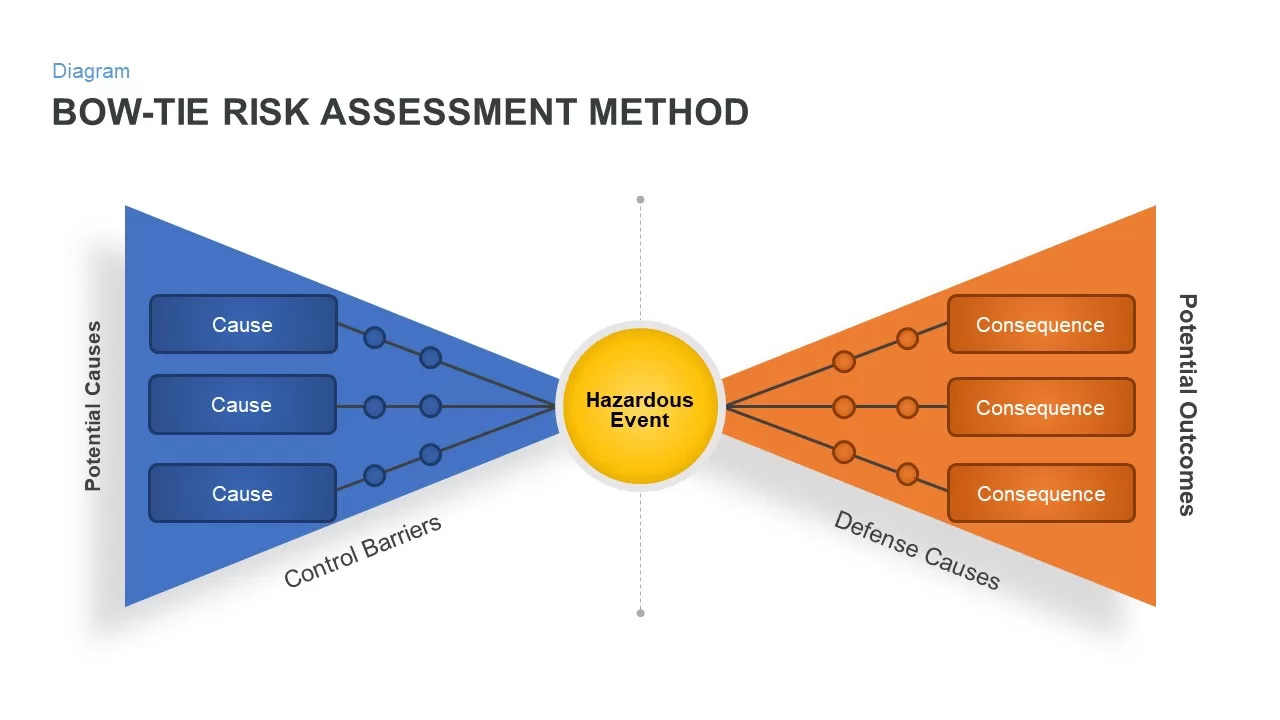
Bow Tie PowerPoint Template
Business Models
Premium
-
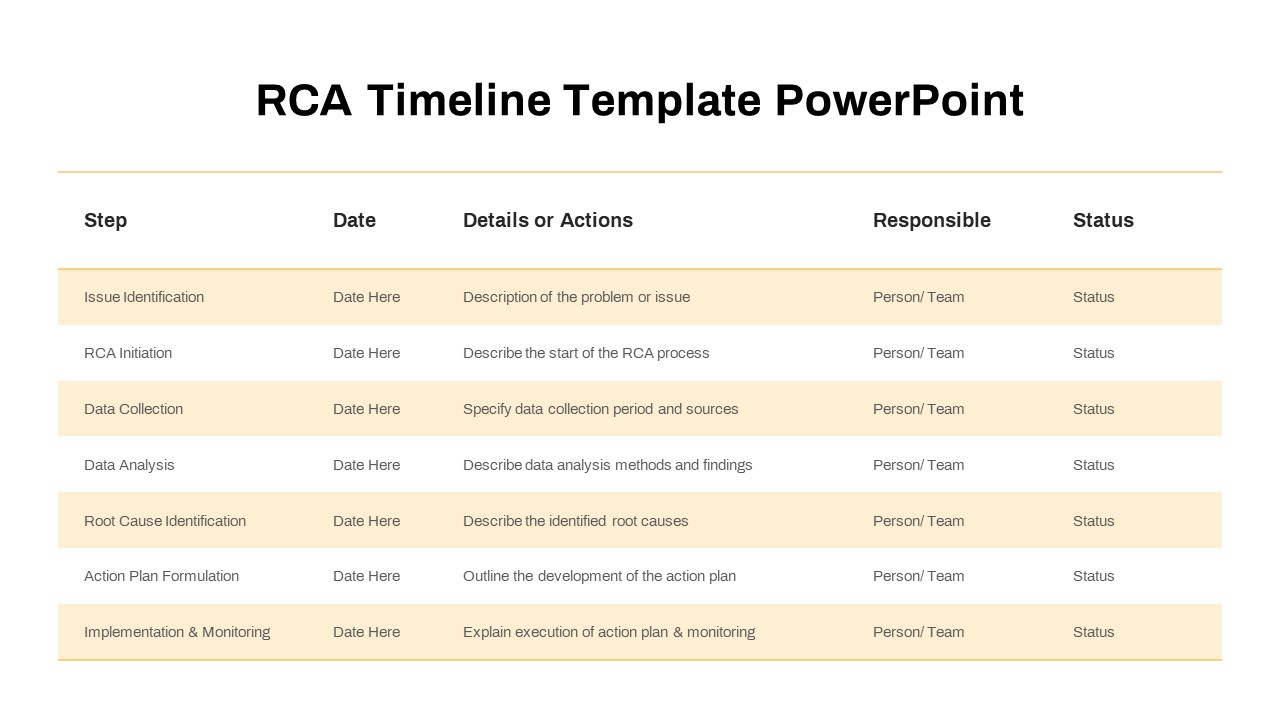
RCA Timeline Template for PowerPoint
Timeline PowerPoint Template
Premium
-
Problem Solving PowerPoint Template and Keynote Diagram
Keynote Templates
Premium
-
5 Key Points Template for PowerPoint & Keynote
Business Models
Premium
-
Domino Falling Infographics
PowerPoint Templates
Premium
-
Creative Venn Diagram Template for PowerPoint & Keynote
Circular Diagrams
Premium
-
Venn Diagram infographic PowerPoint Template
Business Models
Premium
-
Free Mental Health PowerPoint Template
PowerPoint Templates
Free
-
Domino Effect Presentation Template for PowerPoint and Keynote
Metaphor, Simile & Analogy
Premium
-
Medical Experimenting Measuring PowerPoint Template
Business Models
Premium
-
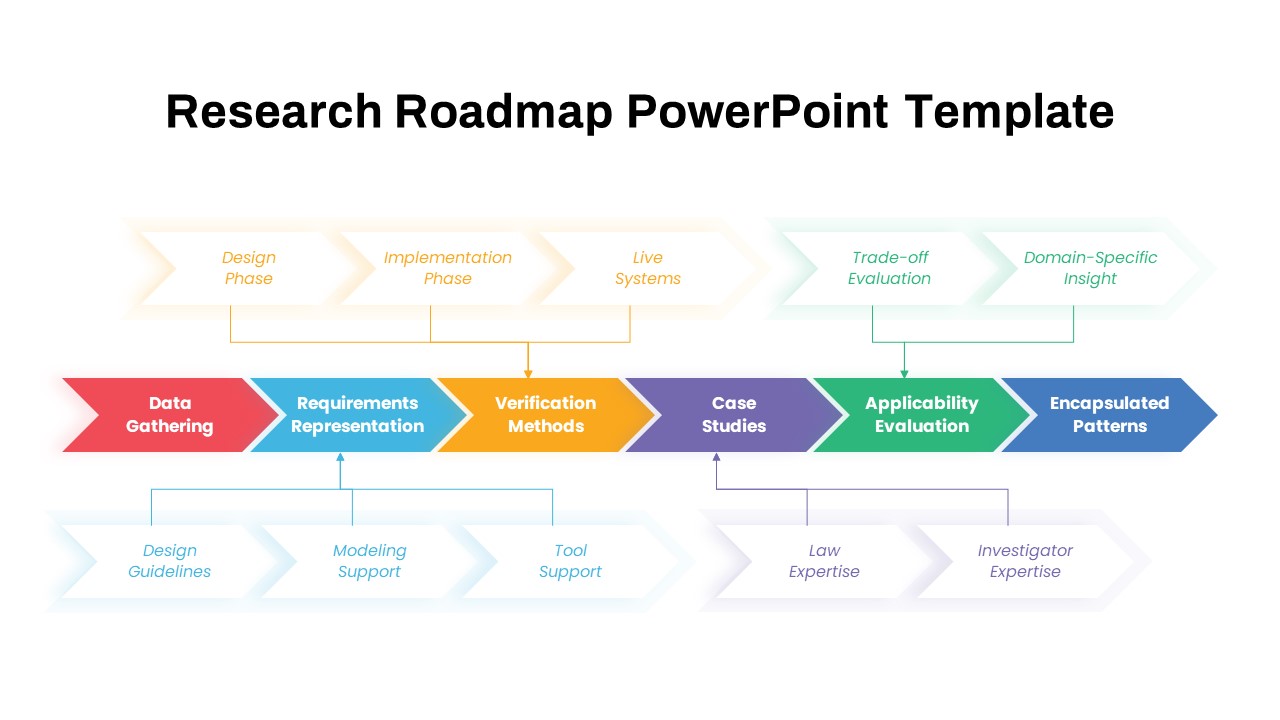
Research Roadmap PowerPoint Template
PowerPoint Templates
Premium
-
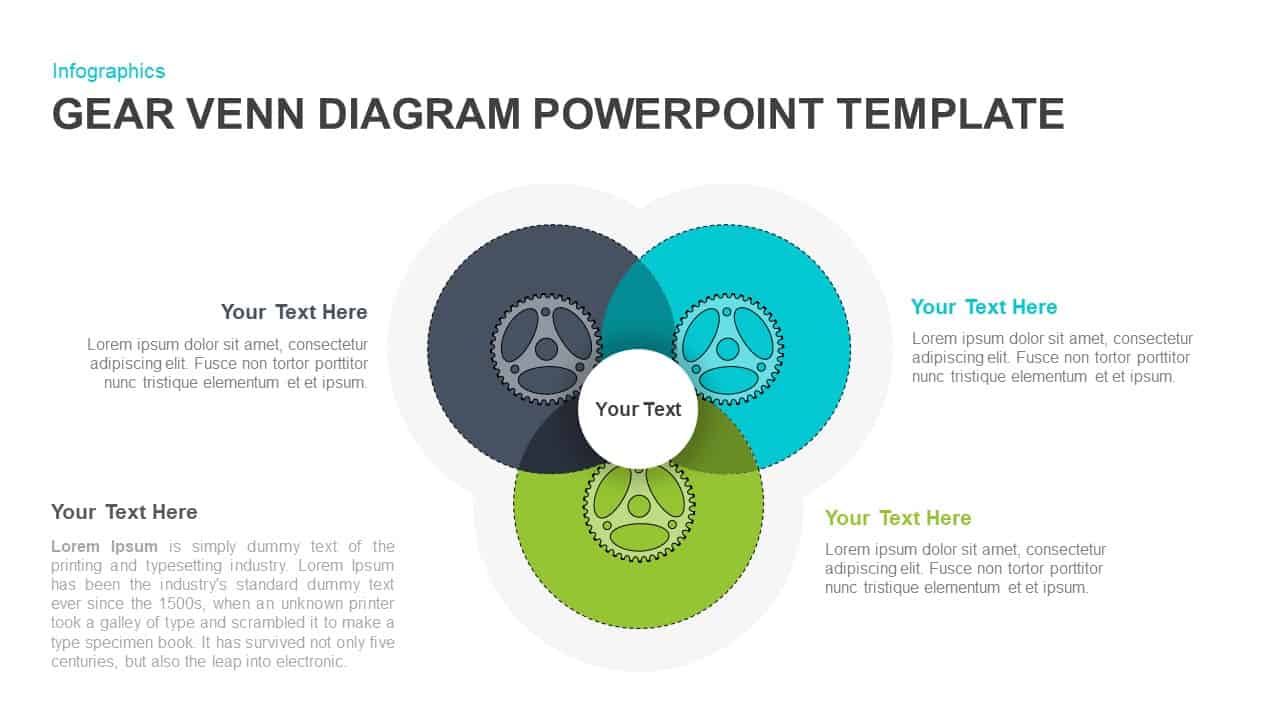
Gear Venn Diagram PowerPoint Template
Business Models
Premium
-
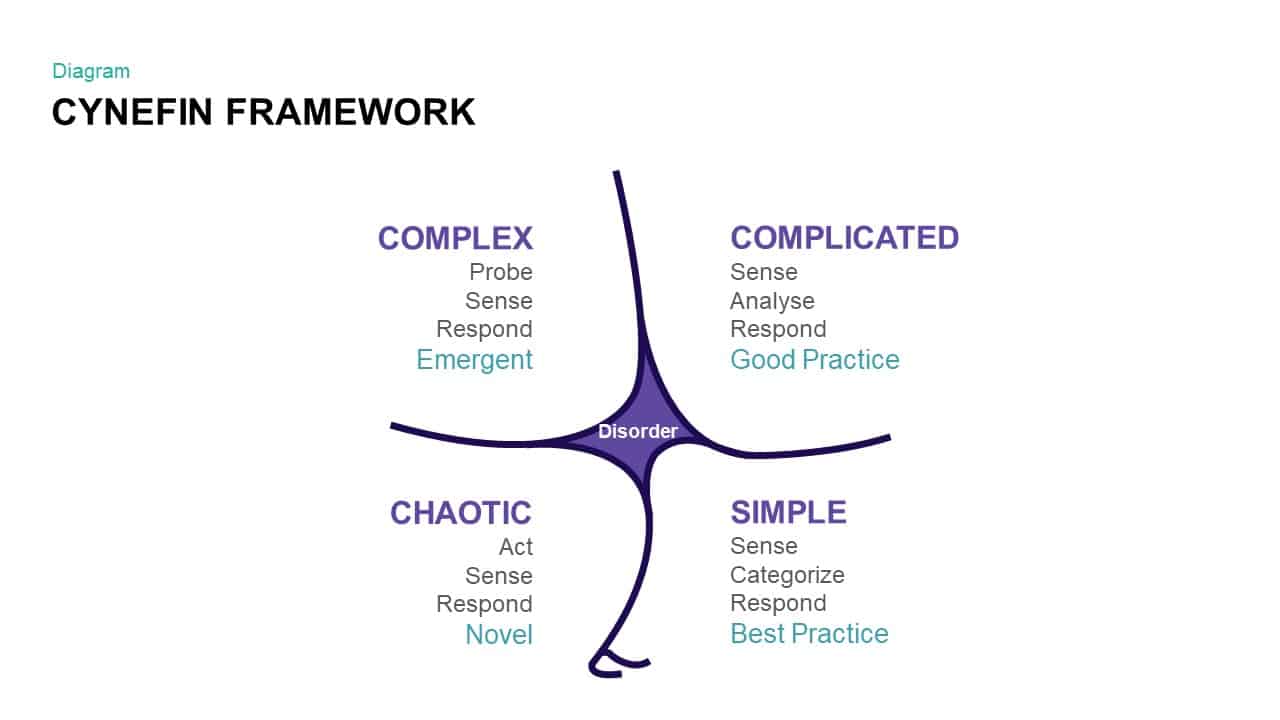
Cynefin Framework PowerPoint Templates and Keynote Slide
Business Models
Premium
-
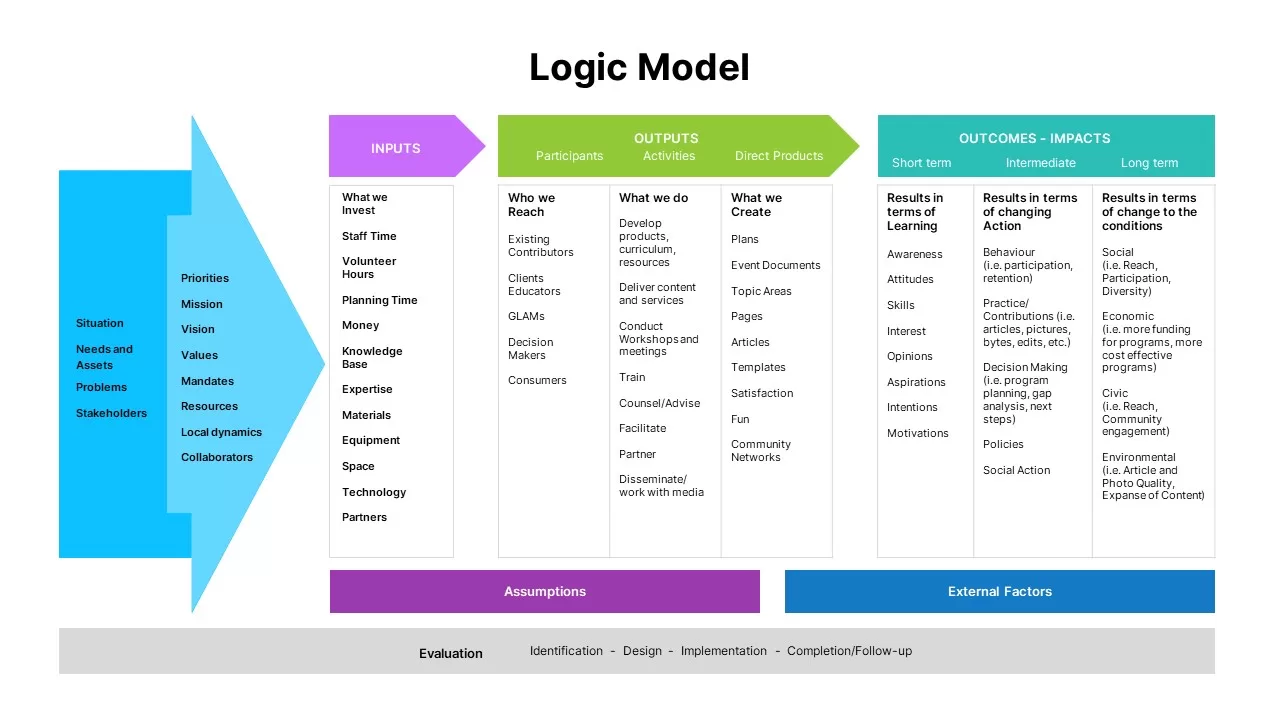
Logic Model Template PowerPoint
PowerPoint Templates
Premium
-
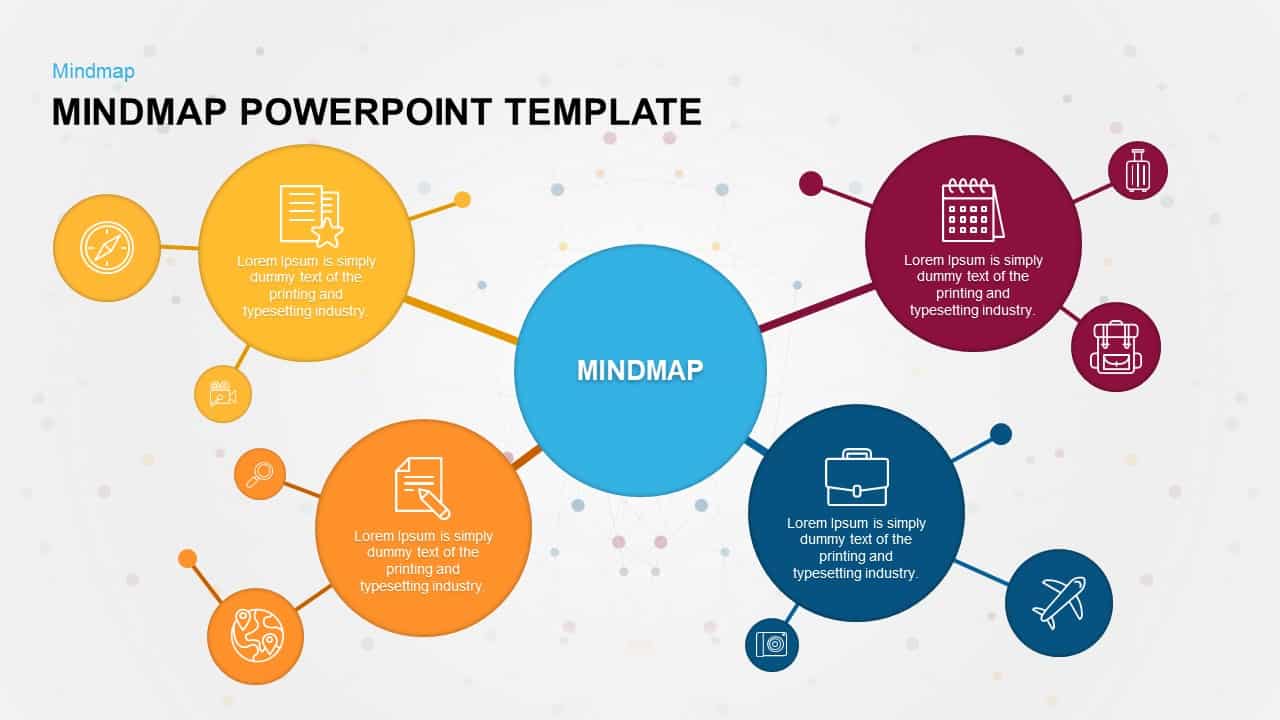
Mind Map PowerPoint Template and Keynote Slide
Diagrams
Premium
-
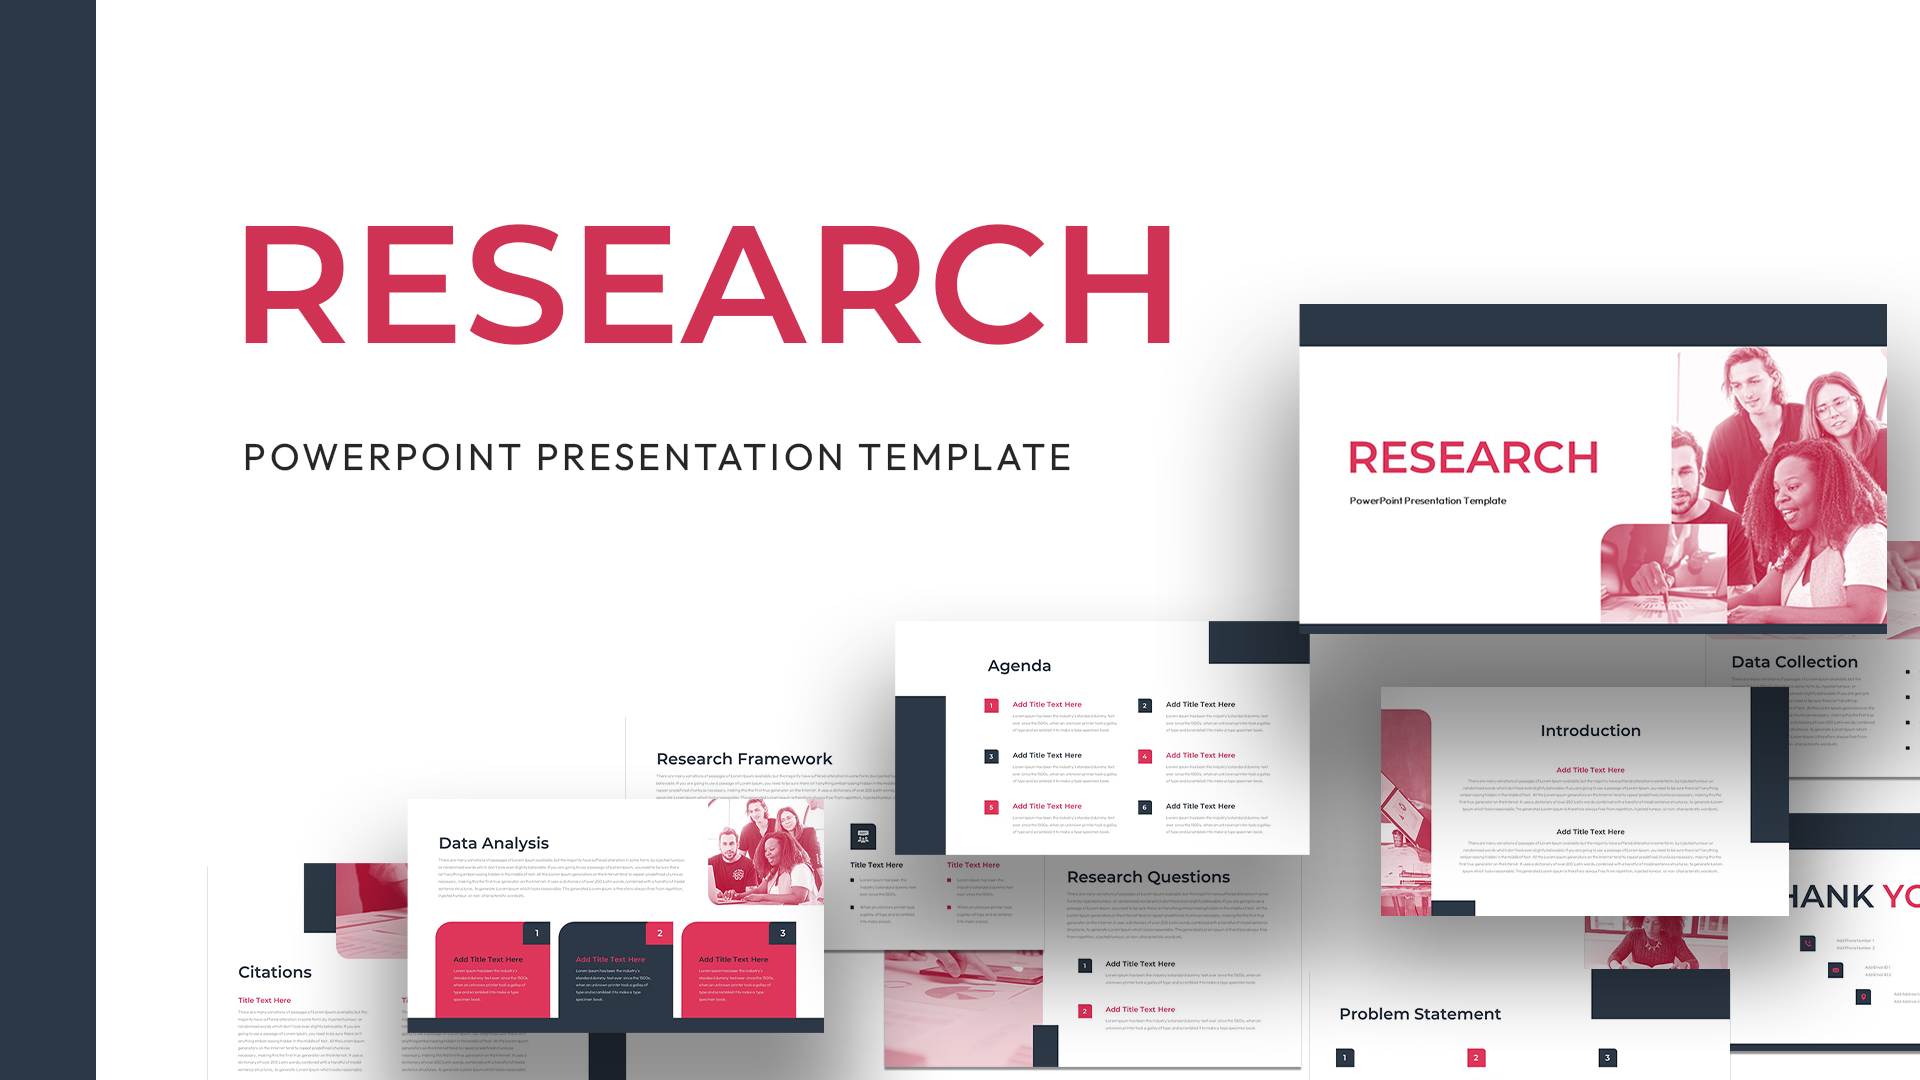
Research Presentation PowerPoint Template Free
PowerPoint Templates
Free
-
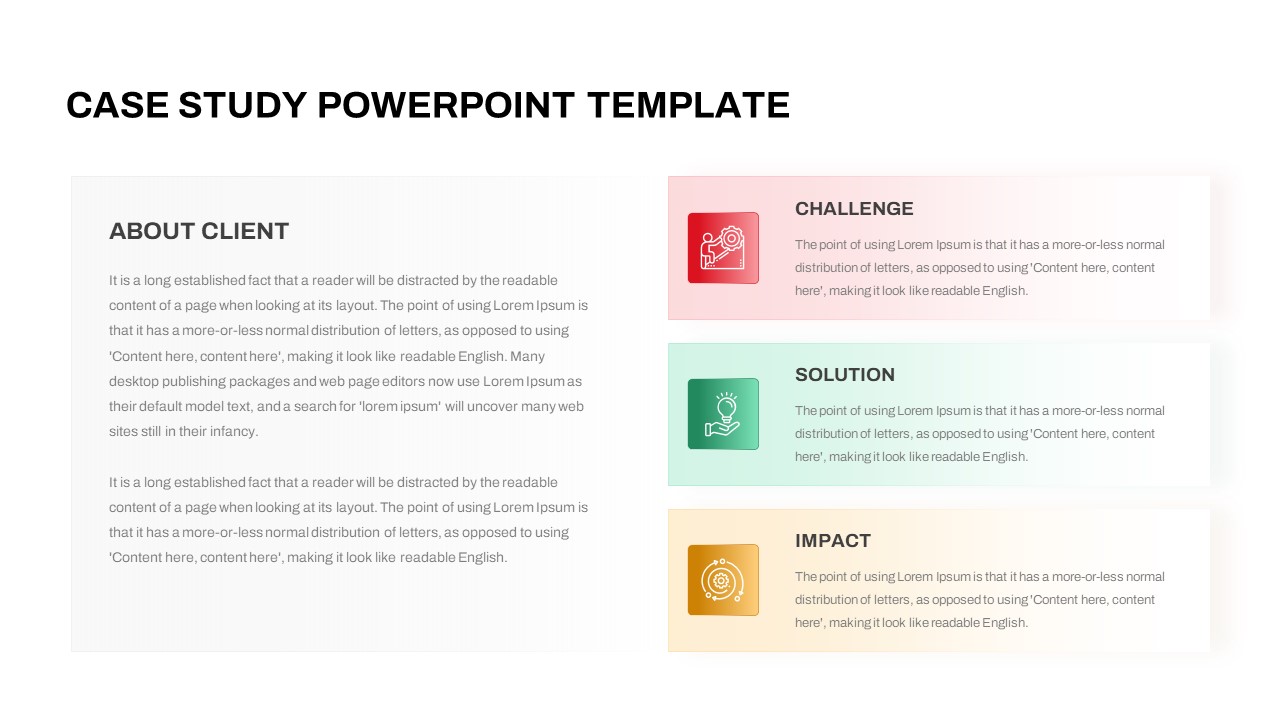
Free Case Study PowerPoint Template
PowerPoint Templates
Free
-
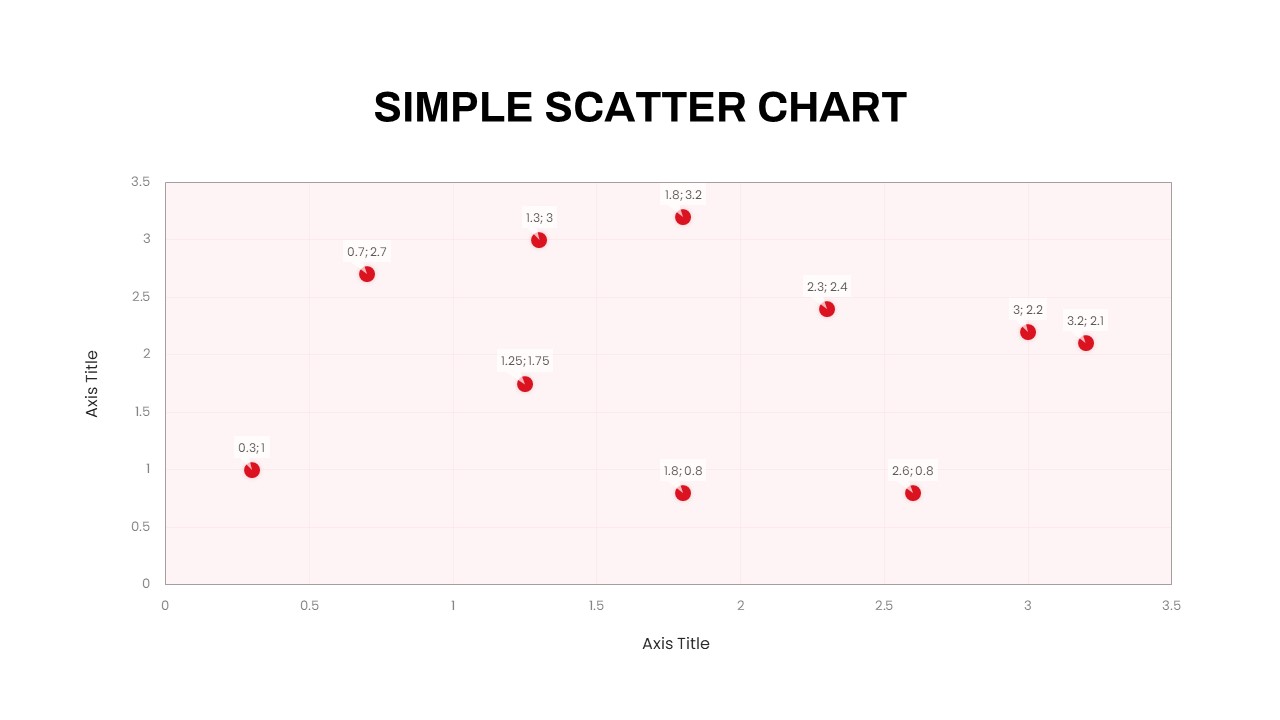
Simple Scatter Chart PowerPoint Template
PowerPoint Charts
Premium
-
Venn Diagram PPT Template and Keynote Slide
Diagrams
Premium
-
Rectangular Contributing Factors PowerPoint Diagram and Keynote Template
Infographic
Premium
-
Free Venn Diagram Presentation Template
Infographic
Free
-
Mind Mapping PPT Template
Mind Map PowerPoint Template
Premium
-
Relationship Chart PowerPoint Template and Keynote Slide
Diagrams
Premium
-
Gap Analysis Strategic Planning PowerPoint Template
Business Models
Premium
-
Mind Map PowerPoint Template PPT
Mind Map PowerPoint Template
Premium
-
Radar Chart Product Comparison PowerPoint Template
Business Models
Premium
-
Market Research PowerPoint Template Free
PowerPoint Templates
Free
-
Quality Assurance PowerPoint Deck Template
PowerPoint Business Templates
Premium
-
Personal SWOT Analysis PPT
professional
Premium
-
6 M Analysis Template for PowerPoint and Keynote
Circular Diagrams
Premium
-
Interaction Infographic PowerPoint Template
Infographic
Premium
-
Multiple Line Chart PowerPoint Template
PowerPoint Charts
Premium
-
Snowball Effect PowerPoint Template
PowerPoint Templates
Premium
-
Connect The Dots PowerPoint Template
Mind Map PowerPoint Template
Premium
-
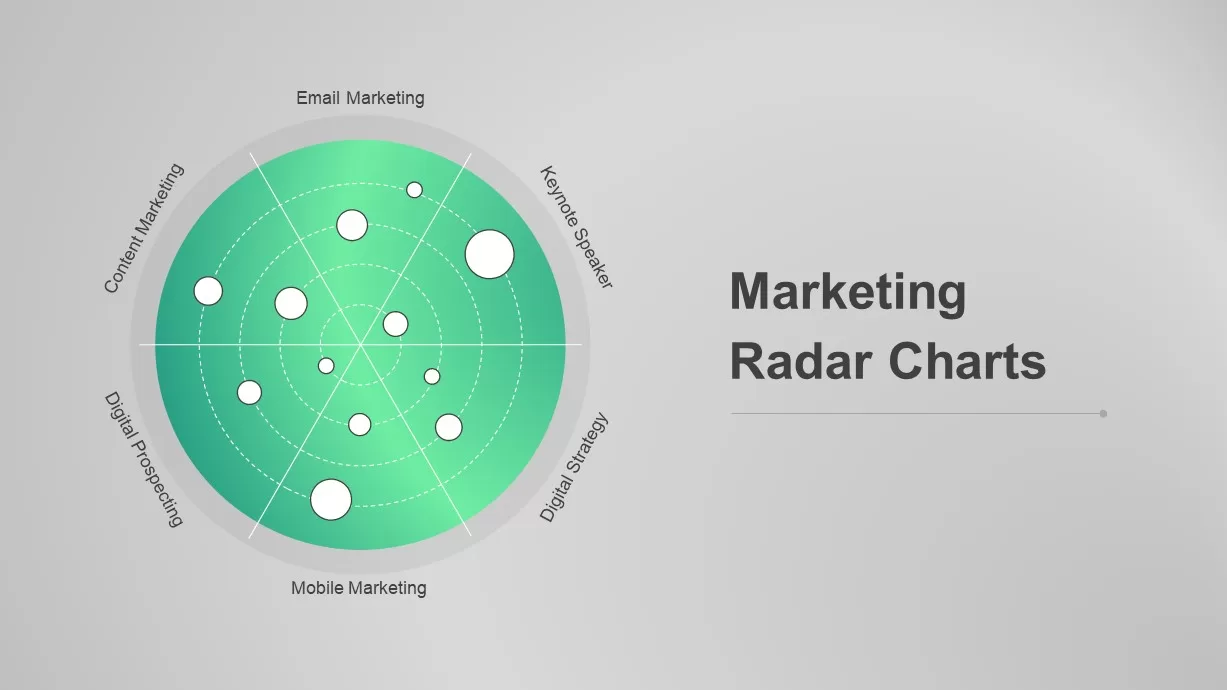
Marketing Radar Charts for PowerPoint
PowerPoint Charts
Premium
-
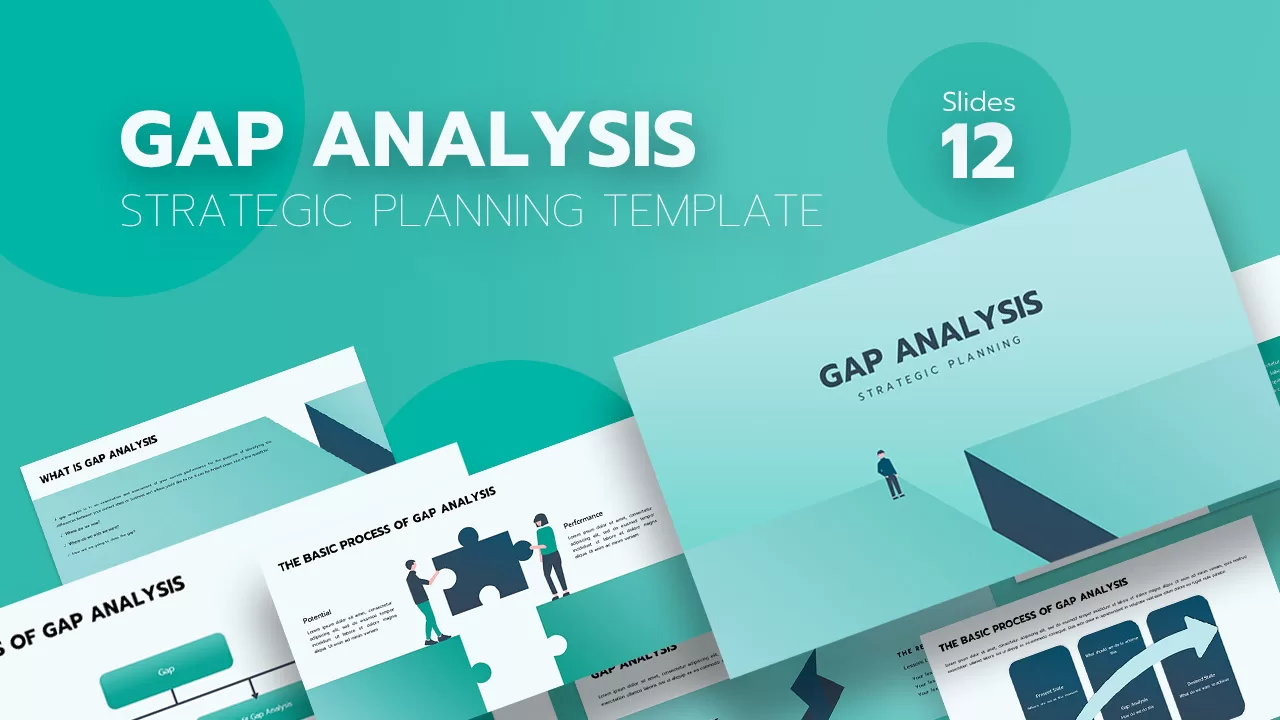
Gap Analysis Strategic Planning Template
PowerPoint Templates
Premium
-
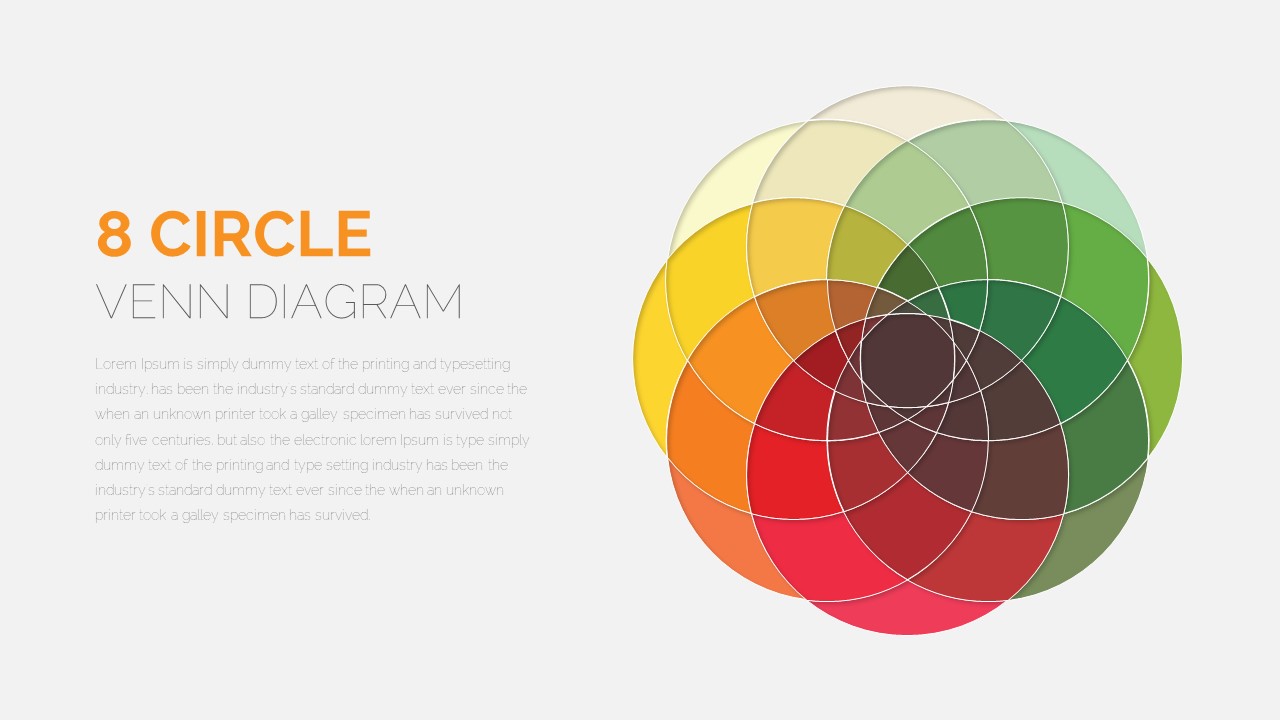
8 Circle Venn Diagram PowerPoint Template
PowerPoint Templates
Premium
-
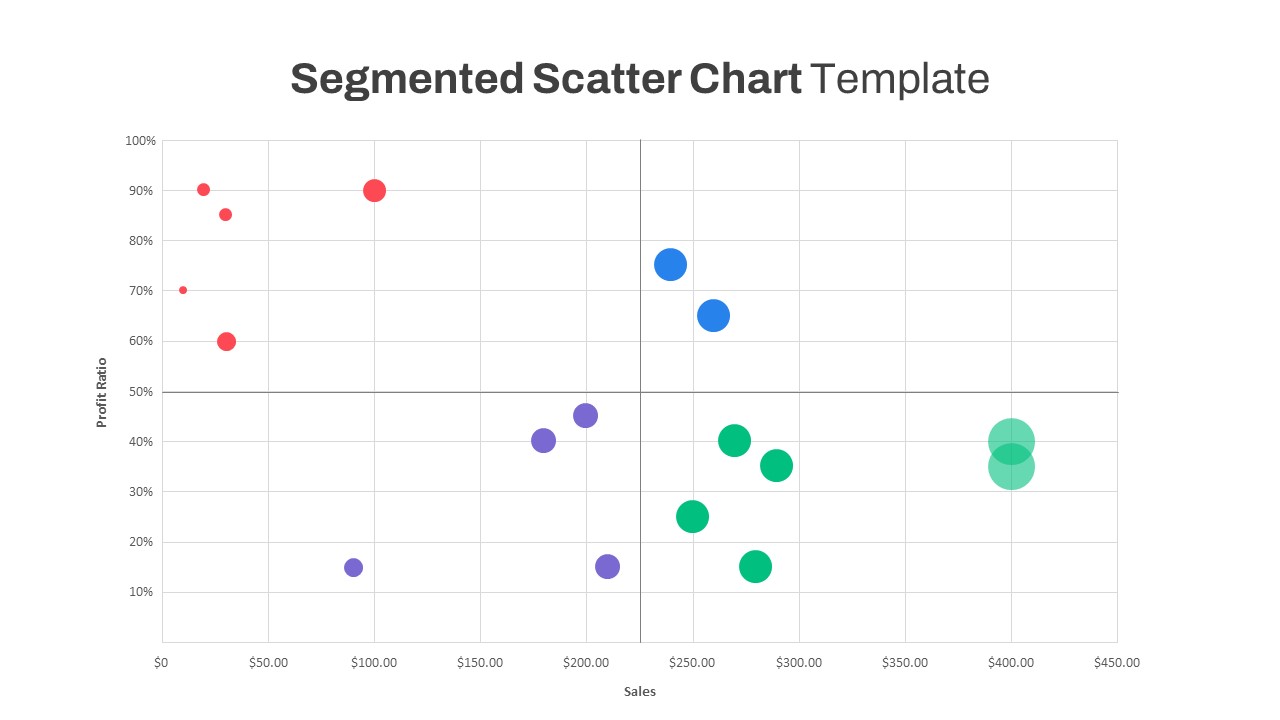
Segmented Scatter Chart PowerPoint Template
PowerPoint Charts
Premium
-
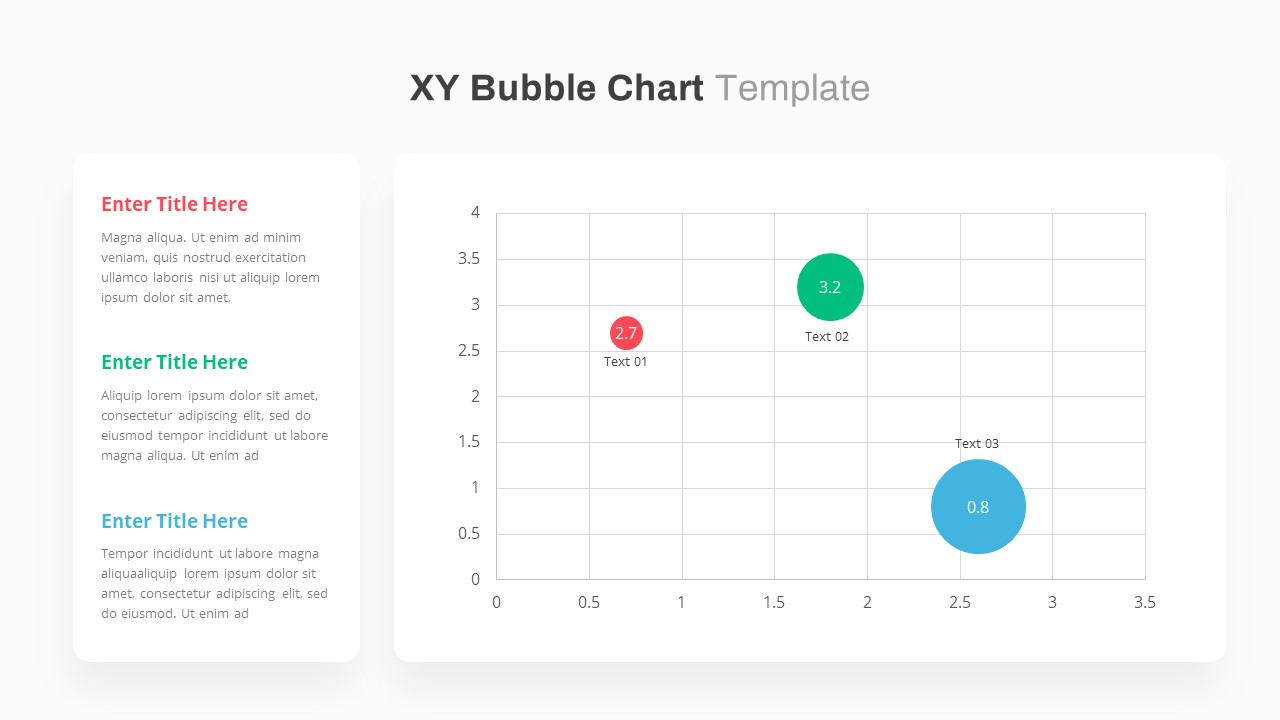
X Y Bubble Chart PowerPoint Template
PowerPoint Charts
Premium
-
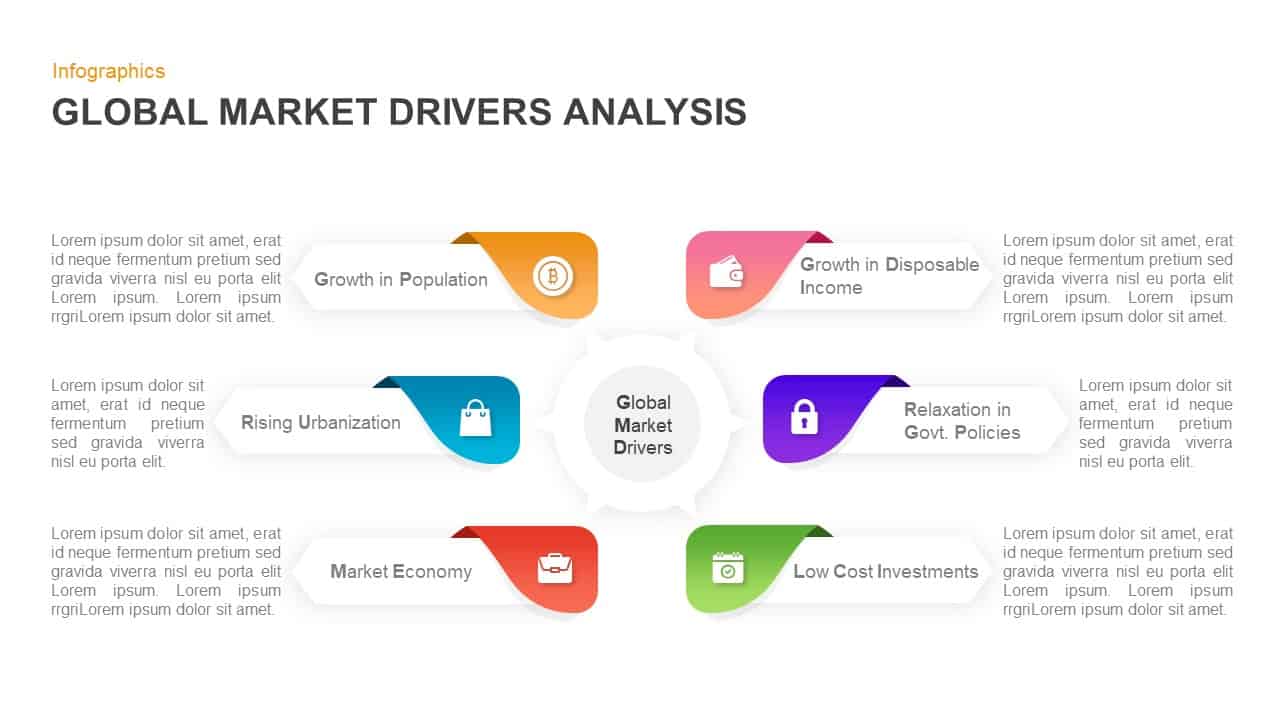
Global Market Drivers Analysis PowerPoint & Keynote
Circular Diagrams
Premium
-
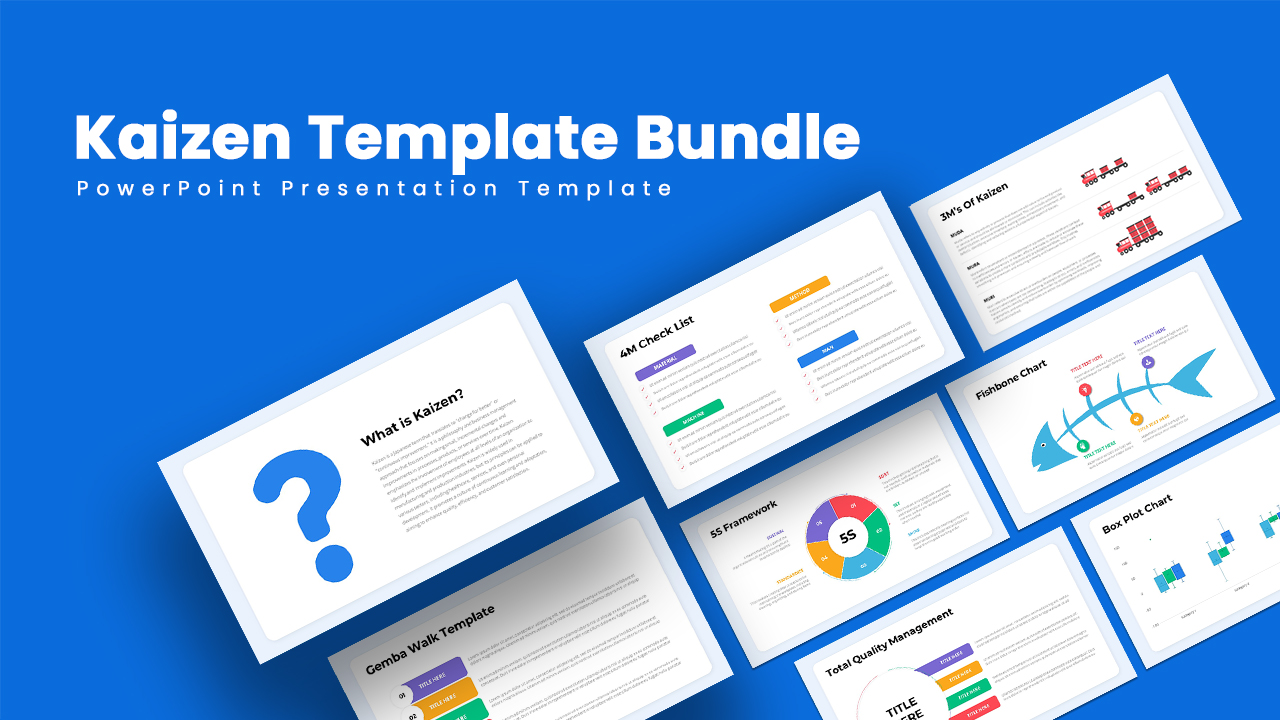
Kaizen PowerPoint Template Bundle
Business Models
Premium
-
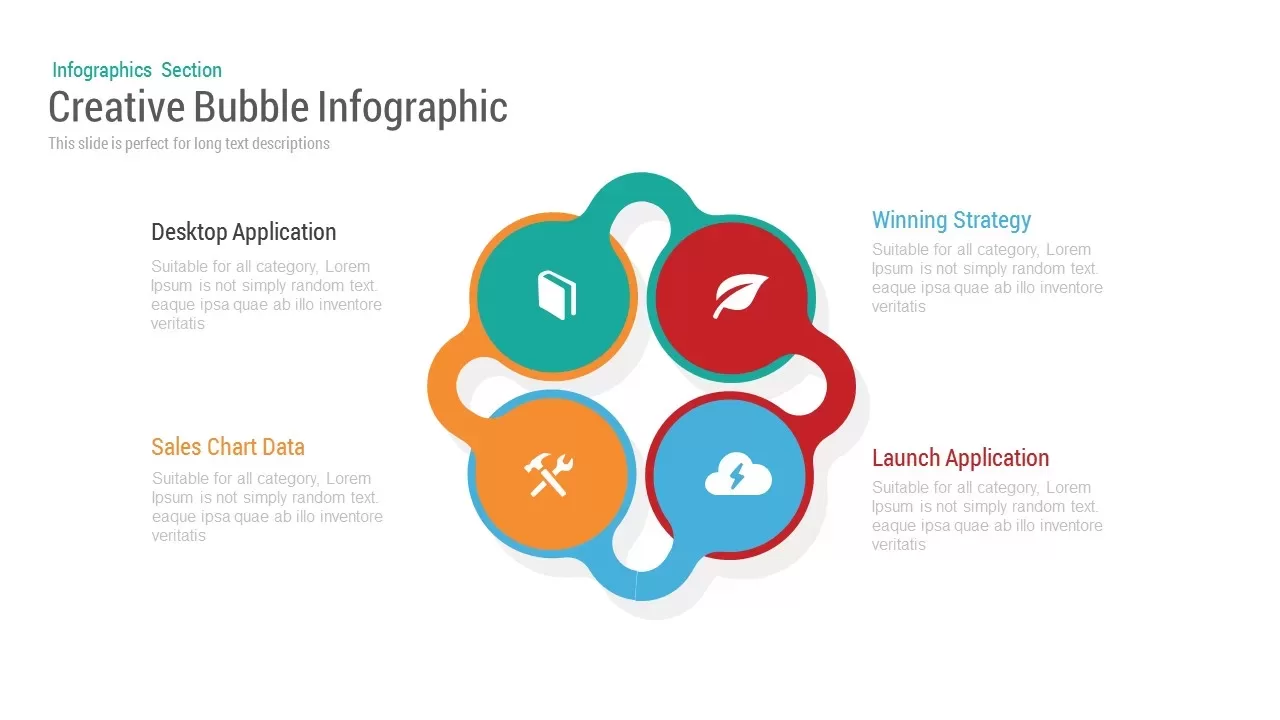
Four Bubble Infographic PowerPoint Template and Keynote
Business Models
Premium
-
Twin Circle Process Diagram PowerPoint Template and Keynote Template
Circular Diagrams
Premium
-
Work Relationship Template for PowerPoint
Business Models
Premium
-
6 Staged Semi Circle Diagram PowerPoint Template with Icons
Diagrams
Premium
-
Free Simple Venn Diagram PowerPoint Template
Free PowerPoint Templates
Free
-
8D Problem Solving PowerPoint Template
Timeline PowerPoint Template
Premium
-
PEST Analysis PowerPoint Template and Keynote Slide
Business Models
Premium
-
Requirements Analysis Ppt Template
Business Models
Premium
-
6 Stage Cycle Template for PowerPoint and Keynote
Circular Diagrams
Premium
-
PESTLE Analysis PowerPoint Template and Keynote
Business Models
Premium
-
Free Family Tree PowerPoint Template
PowerPoint Templates
Free
-
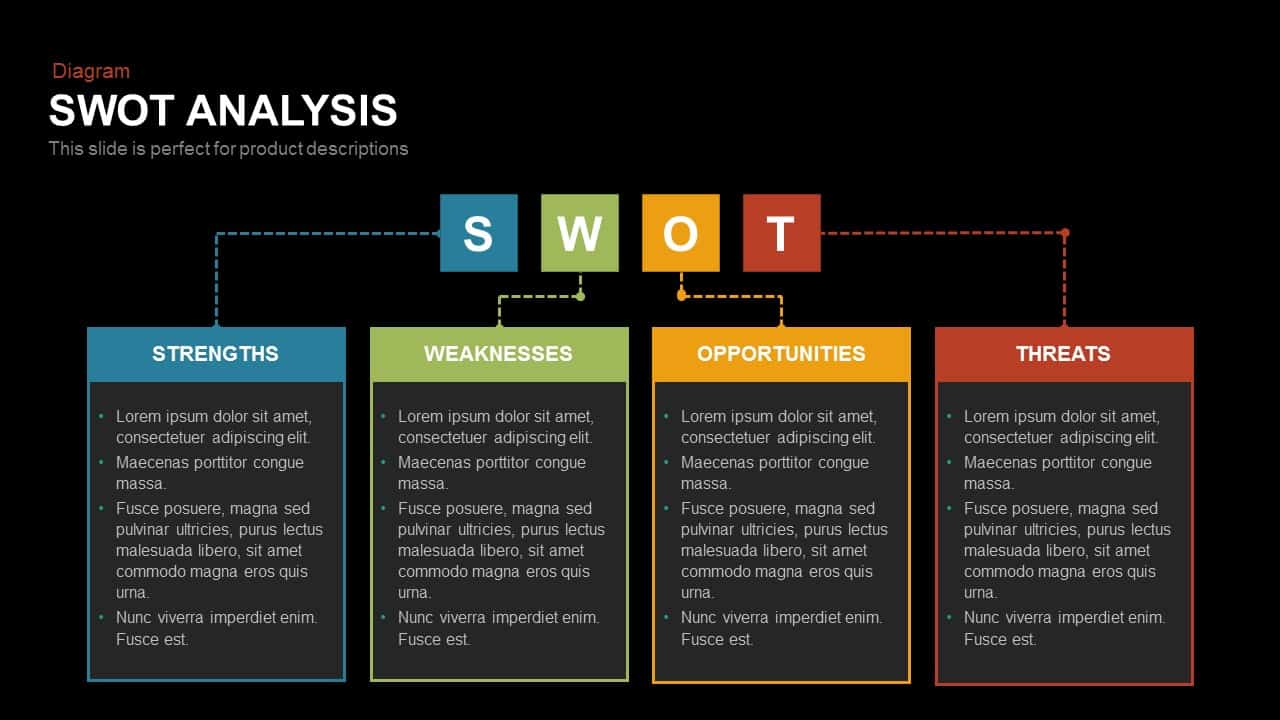
Free SWOT Analysis PowerPoint Template and Keynote Slide
Business Models
Free
-
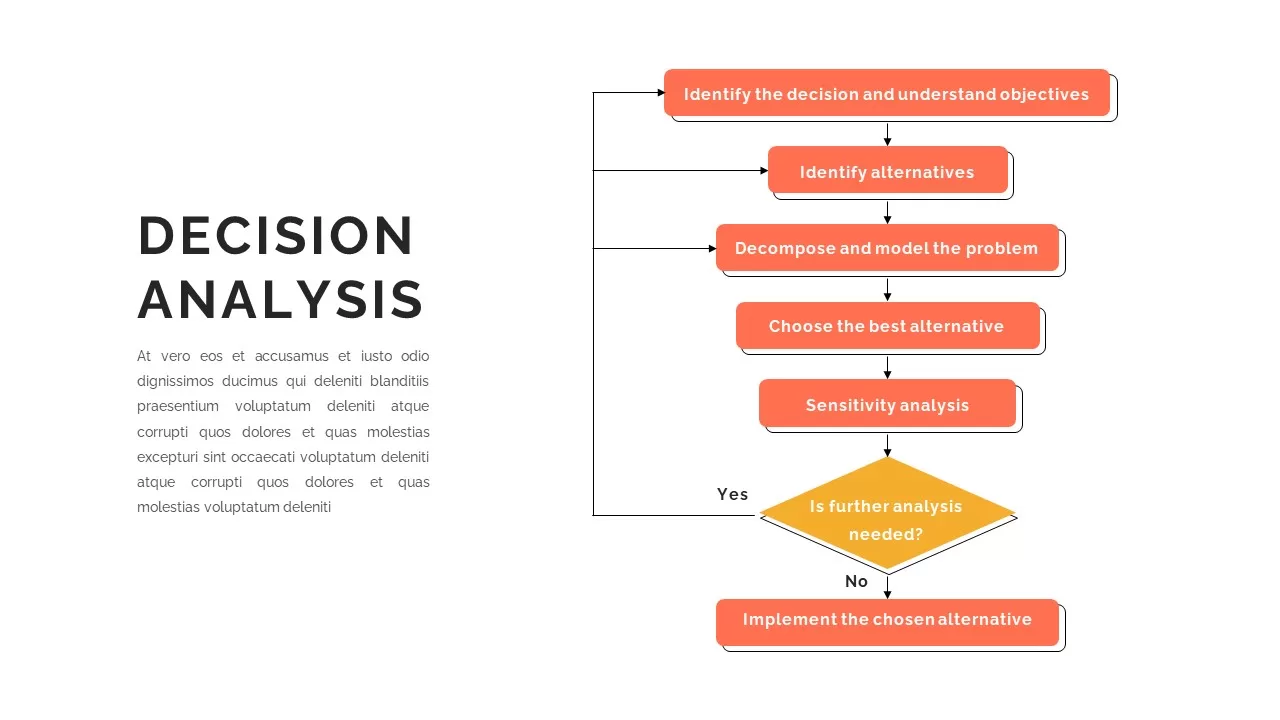
Decision Analysis Template
Flow Charts
Premium
-
SWOT analysis table PPT Template And Keynote
Diagrams
Premium
-
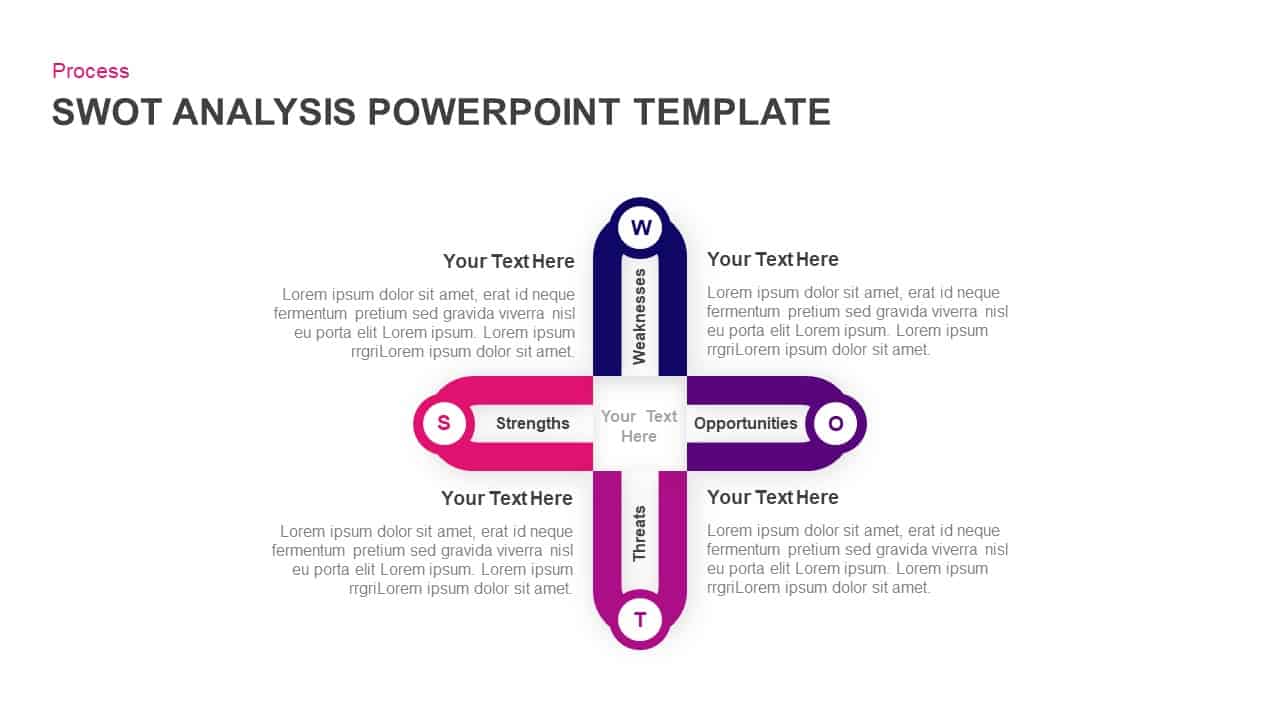
SWOT Template for PowerPoint & Keynote Presentation
Business Models
Premium
-
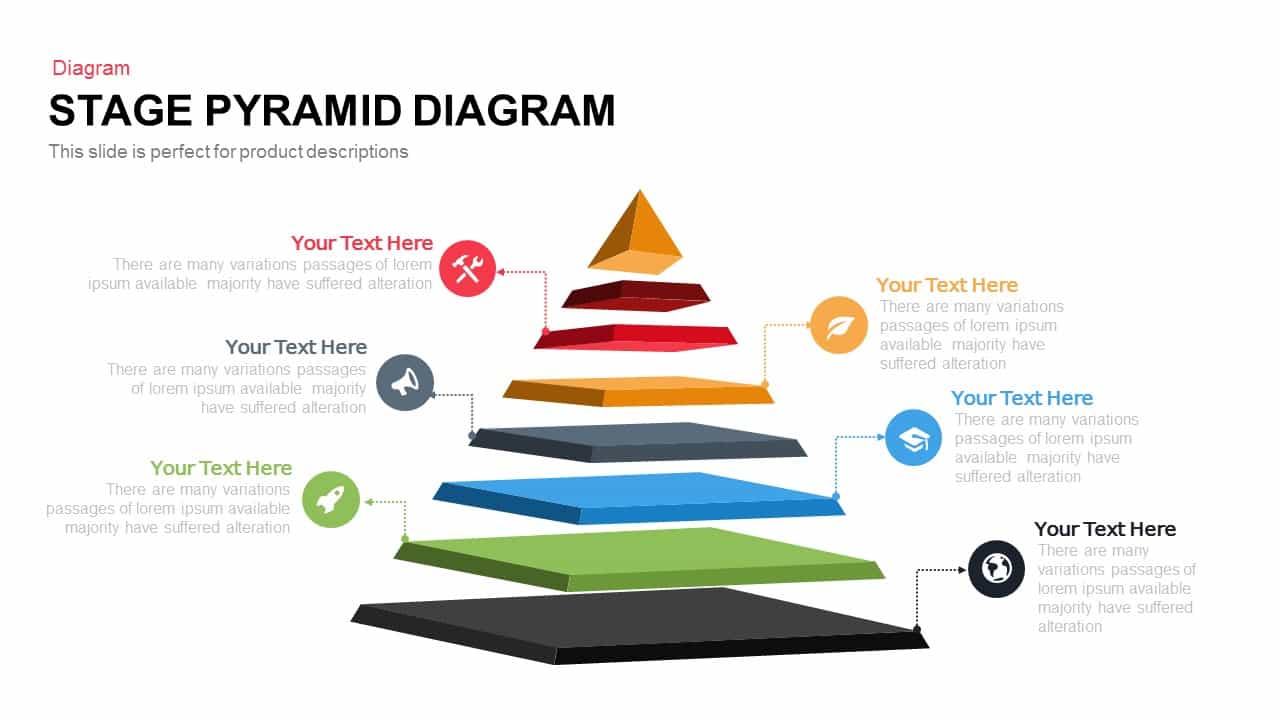
Stage Pyramid Diagram PowerPoint Template and Keynote
3D Shapes
Premium
-
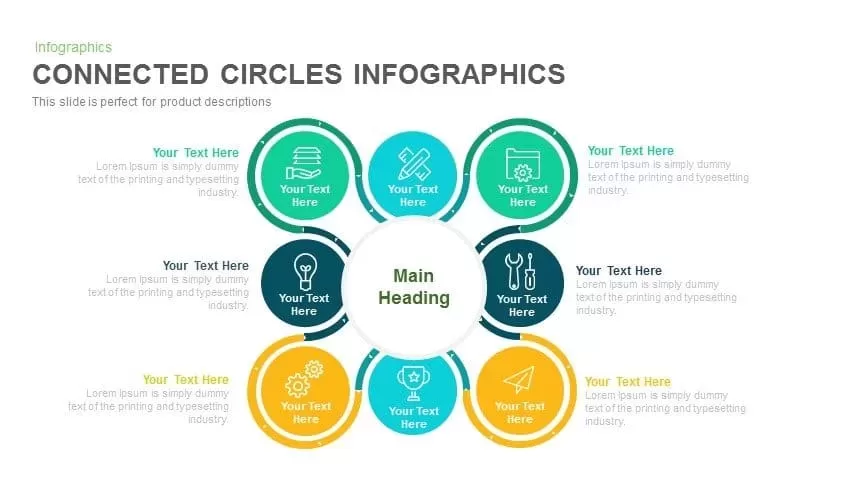
Connected Circles Infographics PowerPoint Template and Keynote
Circular Diagrams
Premium
-
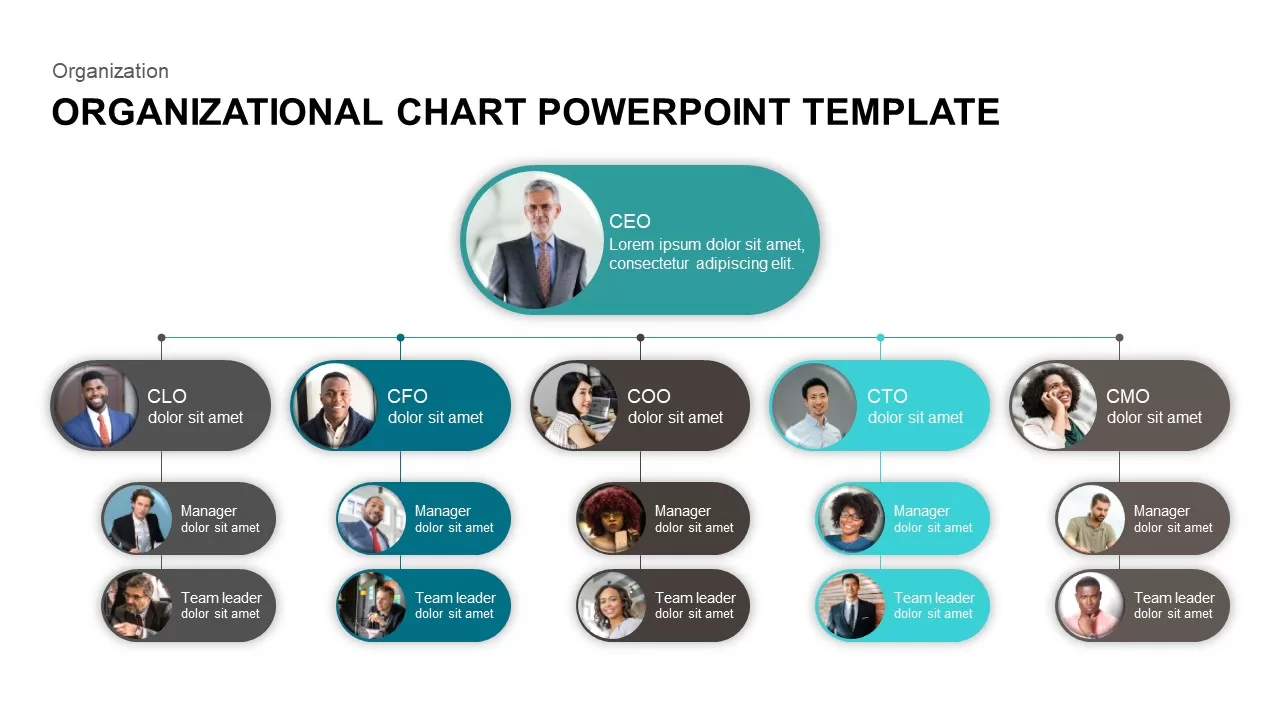
Org Chart PowerPoint Presentation Template
PowerPoint Charts
Premium
-
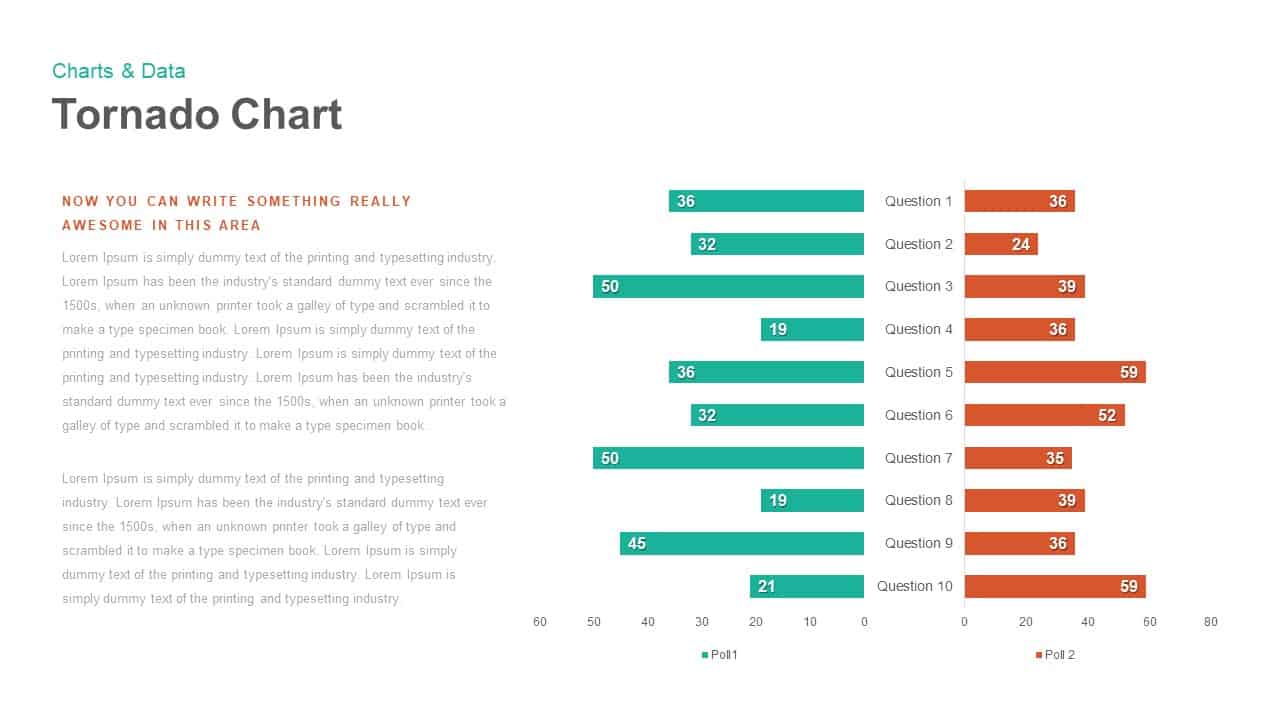
Tornado Chart PowerPoint template and keynote Slide
Diagrams
Premium
-
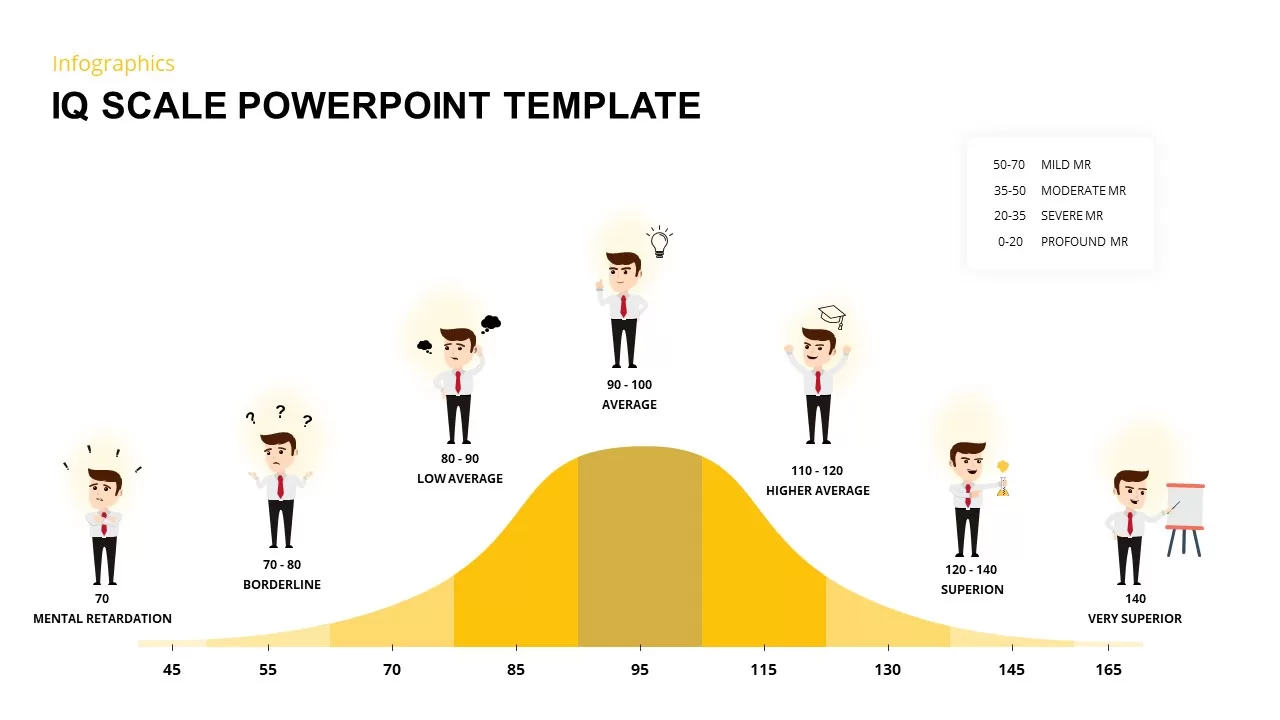
IQ Scale PowerPoint Template
Infographic
Premium
-
Case Study PowerPoint and Keynote Template
PowerPoint Templates
Premium
-
Gap Analysis PowerPoint Template
Business Models
Premium
-
Traditional Tree Diagram PowerPoint Template and Keynote Slide
Diagrams
Premium
-
PESTLE Analysis Diagram Template
Business Models
Premium
-
Three Stage Process Diagram Template for PowerPoint and Keynote
Diagrams
Premium
-
Explore Metaphor PowerPoint and Keynote Template
Keynote Templates
Premium
-
Management Consulting Toolkit PowerPoint Template
PowerPoint Templates
Premium
-
5 Circle Venn Diagram PowerPoint Template
Diagrams
Premium
-

Macroeconomics PowerPoint Template
PowerPoint Templates
Premium
-
10 Sequence of Events Flow chart Template for PowerPoint and Keynote
Process Flow Diagrams
Premium
-
Cycle Process PowerPoint Template and Keynote Diagram
Diagrams
Premium
-
Problem Statement PowerPoint Template
Metaphor, Simile & Analogy
Premium
-
Iceberg Infographic Template
Infographic
Premium
-
4 Staged PowerPoint Puzzle Diagram Template and Keynote Slide
Puzzle
Premium