Mastering Efficiency: Experience Curve PowerPoint Presentation Template
Experience Curve PowerPoint Template offers a graphical representation of the productivity concept in an editable chart slideshow. Every business professional should understand the concept of the experience curve since it is crucial for sustainable growth and enhanced productivity. The PowerPoint business presenters can provide cost reduction strategies, efficiency gains, and the cumulative benefits of the experience with this experience curve PPT presentation.
What is the experience curve?
The experience curve is a business concept that focuses on the correlation between accumulated experience and production costs within a business. Expertise and experience combinedly work together and as a result, it produces more units of a product. Hence, an experienced worker would be a cause of a decrease in production costs per unit. The concept argues if you want strategic cuts in product cost and operational process, you should have experienced hands. In business, the experience curve enables strategic planning for sustainable growth by implementing cost-reduction strategies. Knowing the experience curve provides a competitive edge in the market whereby companies can achieve their long-term goals.
Experience Curve PowerPoint Template is a study tool when you are conducting a training session, discussing strategy with your team, and presenting stakeholders with the importance of experience in business and productivity. Business executives and managers streamline their strategic discussions and decision-making processes by illustrating the impact of the experience curve on your organization's performance. Similarly, consultants, educators, entrepreneurs, and analysts can use the experience curve graph for PowerPoint presentations.
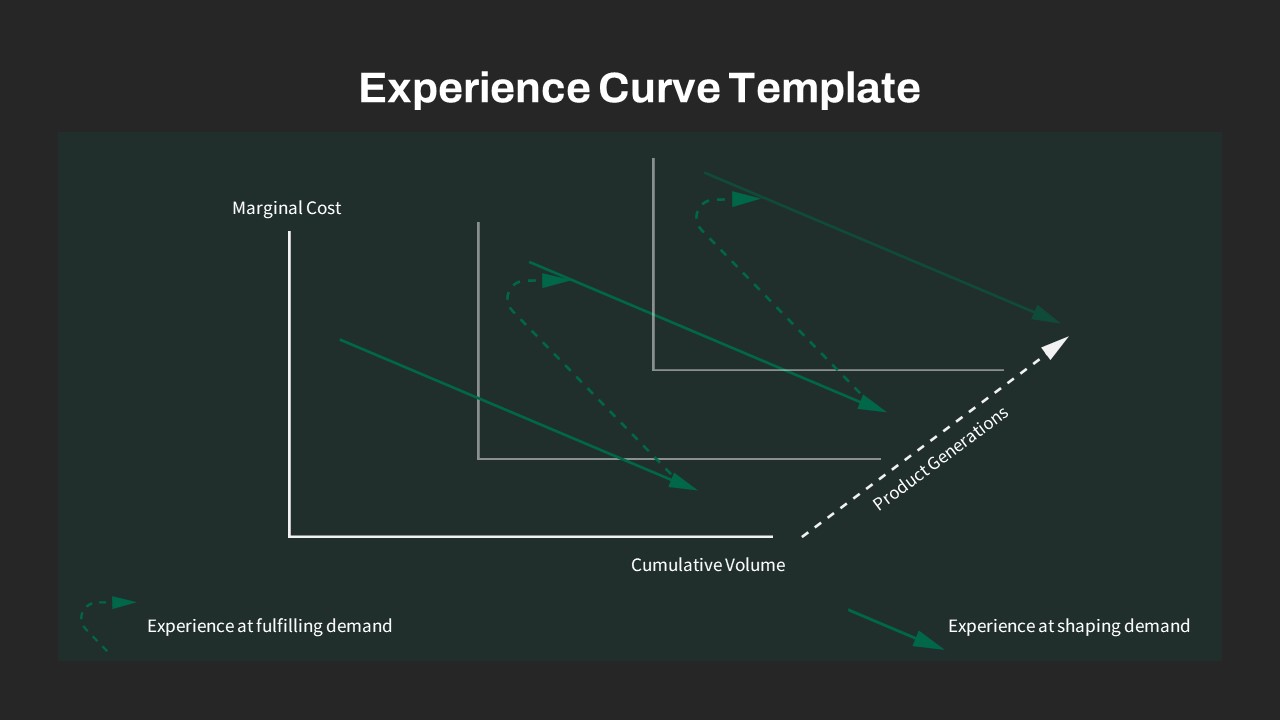
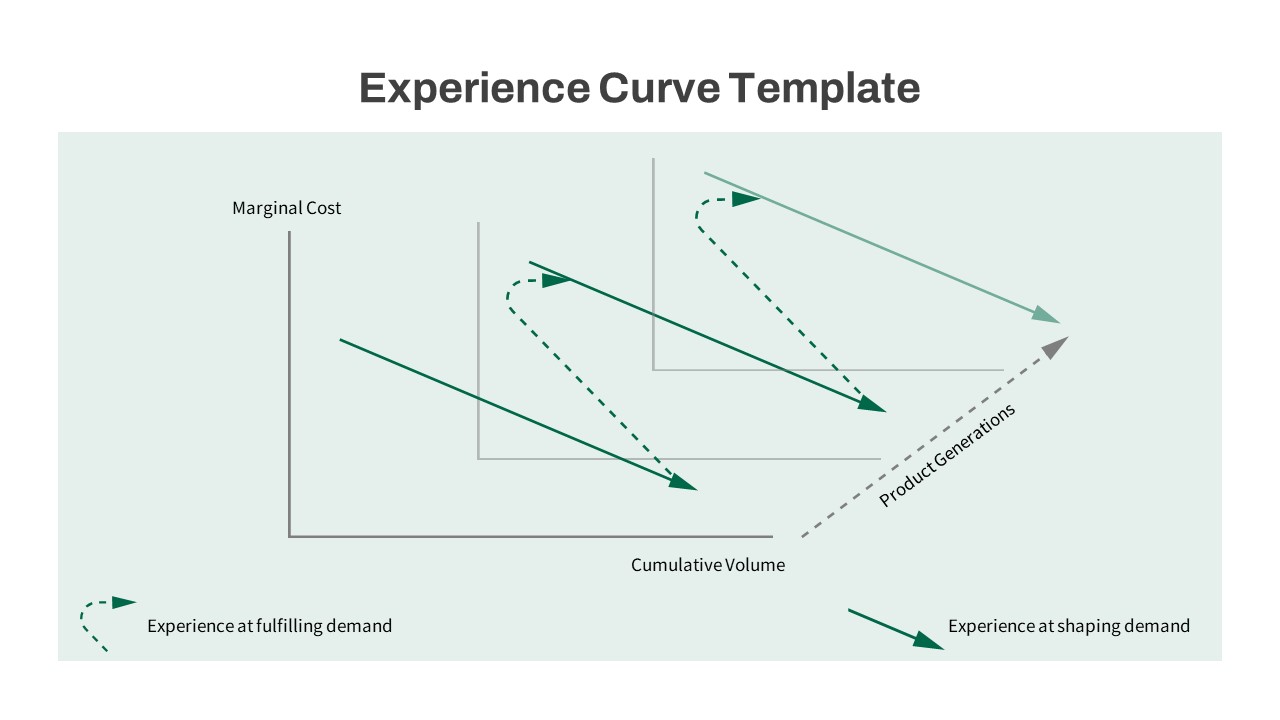
Our experience curve PowerPoint template is a graphical slideshow of the concept with a dotted arrow line and a straight arrow line. These two show how experience at shaping demand differs from and complements experience at fulfilling demand. Here the dotted arrow shape shows the experience of fulfilling demand, while the straight arrow displays experience and shaping demand. There are other concepts in the graphs like marginal cost, cumulative volume, and product generations to ease the understanding of the concept.