


Donut Split Analysis Chart PowerPoint Template and Keynote Slide
- Version
- Download 753
- File Size 0.00 KB
- File Count 1
- Create Date September 19, 2015
- Last Updated July 25, 2024
Donut Split Analysis Chart PowerPoint Template and Keynote Slide
Donut Split Analysis Chart PowerPoint Template and Keynote Slide
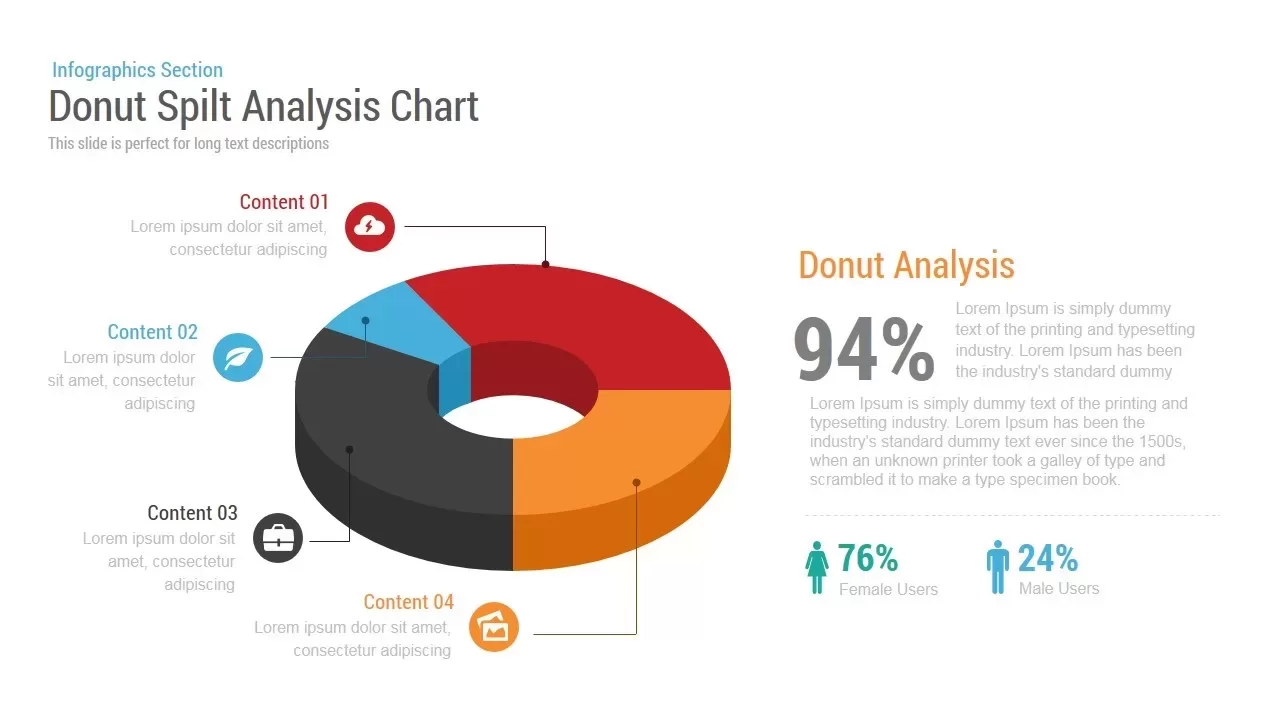
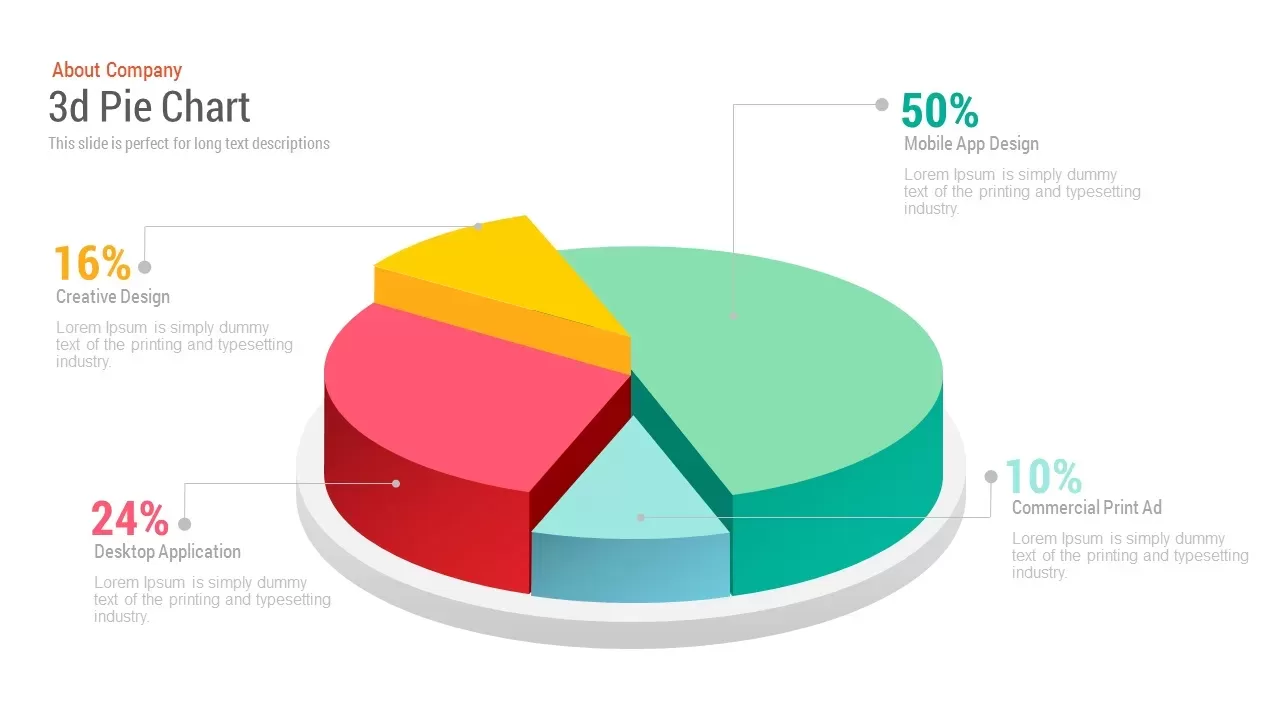
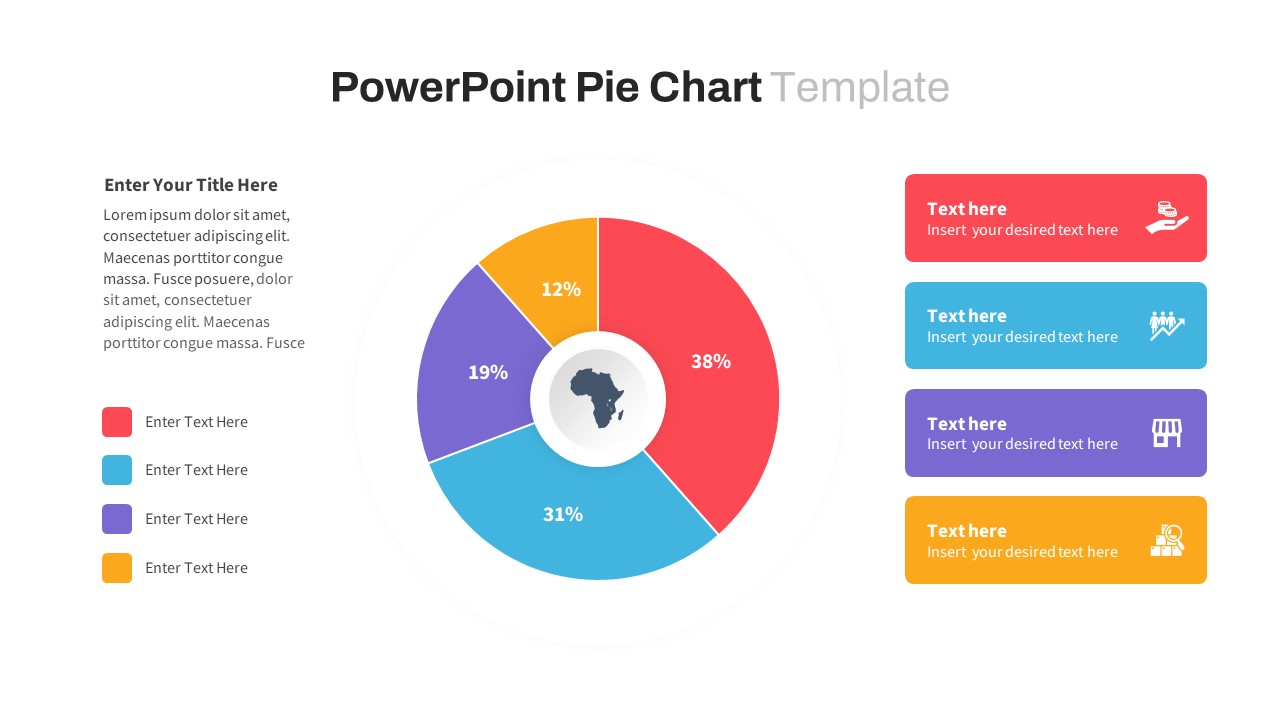
Donut split analysis chart powerpoint template and keynote slide, which has a 3d pie chart the split sections should be changed manually the split donut are created using shapes which might be difficult to change if you are not an expert in powerpoint or keynote. The template is designed in both PowerPoint and keynote version in 16:9(widescreen) and 4:3(Normal) Version.
Donut split analysis chart powerpoint template and keynote slide—Generating data representation is a customary task in today’s contemporary workplace. Viewers can easily comprehend the information with clear arithmetical tools rather using note, or explanative documents. Business executives and other professionals from diverse arenas trust more and more in the statistical depictions because key performance indicators can be examined in spontaneous style.
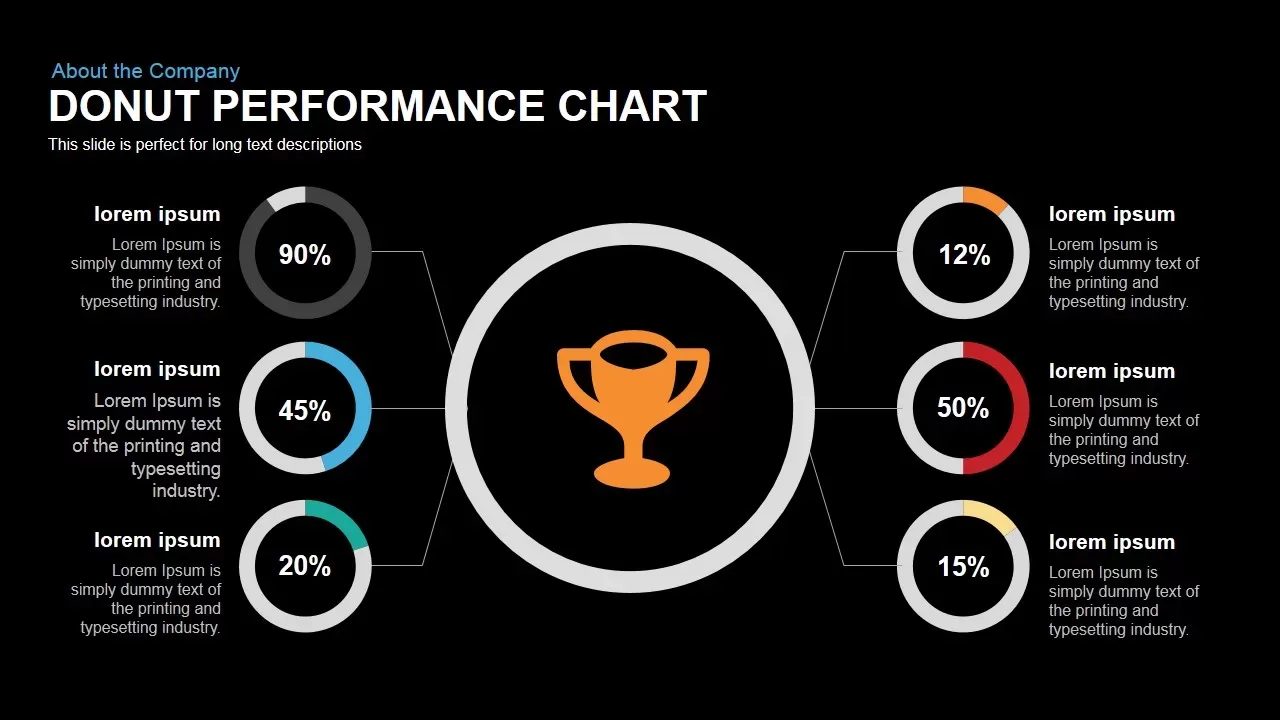
Donut split analysis chart powerpoint template and keynote slide helps to show proportions and percentages between classes, by separating a circle into relative sections. Each arc length signifies a proportion of each group, whereas the full circle signifies the total sum of all the data. Donut charts are perfects for given that the viewer a rapid view of the segmented distribution of the data. Analyzed values can accurately display with this four segmented donut chart. Each piece carried relatively distinguishable values. If the host uses to exhibit product wise sales, they can effortlessly monitor which product has the maximum market possession. Here the red part shows the maximum and the light blue shows the minimum of the products market possession. Donut chart is common for all grounds which hinge on statistics and concrete data. Physical sciences, as well as social sciences, continuously use methodical and statistical approaches for their enquiry, even natural sciences and behavioral sciences couldn’t evade the prospects of statistics. Bio-informatics and data analytics need statistics and donut charts to display tested data. So there is no area that can be exempted from the scope of statistics and its data representation techniques. Donut chart is a visual data representation instrument that can use every field of knowledge.
Donut split analysis chart powerpoint template and keynote slide can be used to display your data is been split according to your analytic outcomes and reports. Customization may be a difficult one, if you are not an expert in PowerPoint or keynote. Presenters can search our charts and data menu for quick illustration of information.
The 3d Donut is created using shapes, might be difficult to change if you are not an expert in powerpoint or keynote
Attached Files
| File |
|---|
| SB00030-Donut-Spilt-Analysis-Chart.zip |
Login to download this file
Add to favorites
Add to collection
-

Item ID
SB00030 -

Related Templates
-
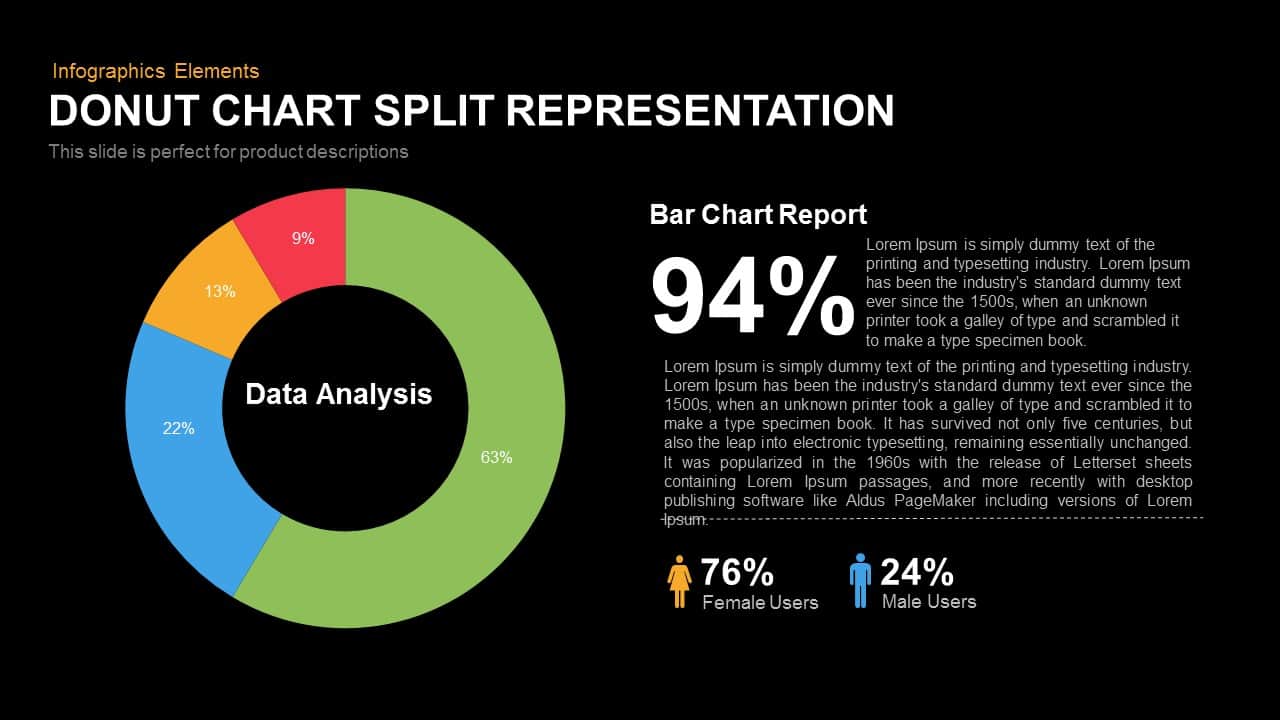
Split Representation Donut Chart Template for PowerPoint and Keynote
Keynote Templates
Premium
-
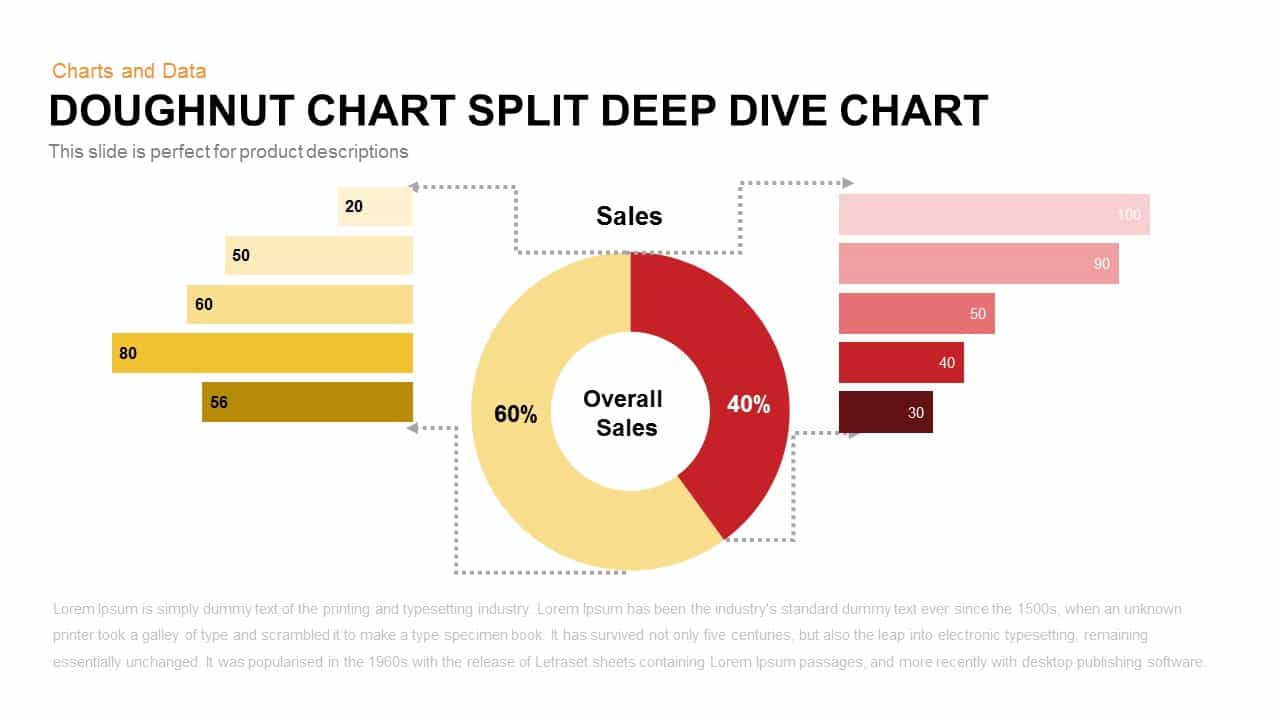
Donut Chart Split Deep Dive Chart Template For PowerPoint and Keynote
Keynote Templates
Premium
-

Research Proposal PowerPoint Template
PowerPoint Templates
Premium
-

Nature PowerPoint Presentation Template
PowerPoint Business Templates
Premium
-

Cab Service PowerPoint Template
PowerPoint Templates
Premium
-

Free Space Minimal Deck Template
PowerPoint Templates
Free
-

Sales Deck Free PowerPoint Template
PowerPoint Templates
Free
-

Free Vertical PowerPoint Template
PowerPoint Business Templates
Free
-

Free Nursing Capstone PowerPoint Deck
PowerPoint Templates
Free
-

VET Clinic PowerPoint Template
PowerPoint Templates
Premium
-

Gym PowerPoint Template
PowerPoint Templates
Premium
-

Free Physical Education PowerPoint Template Deck
Free PowerPoint Templates
Free
-

Travel Agency PowerPoint Template
PowerPoint Templates
Premium
-

IoT Presentation Template
PowerPoint Templates
Premium
-

Effective Communication PowerPoint Template
PowerPoint Templates
Premium
-
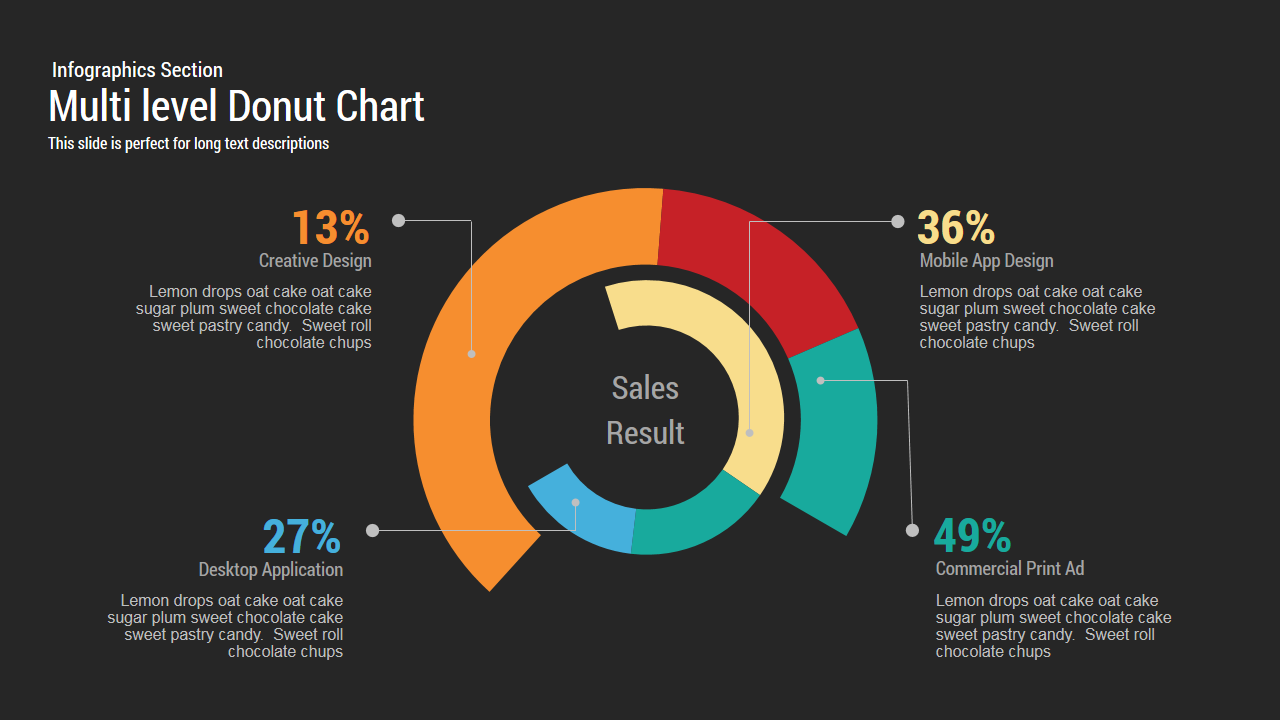
Multi level Donut Chart Template for PowerPoint and Keynote
PowerPoint Charts
Premium
-

PowerPoint Quiz With Timer
PowerPoint Templates
Premium
-
Donut Chart Performance PowerPoint Template and Keynote Slide
Pie & Donut
Premium
-

Graph Paper PowerPoint Template Deck
PowerPoint Templates
Premium
-
Free 3d Pie Chart PowerPoint Template & Keynote slide
Pie & Donut
Free
-
Comparison Donut Chart PowerPoint Template and Keynote
Keynote Templates
Premium
-

Macroeconomics PowerPoint Template
PowerPoint Templates
Premium
-
8 Section Donut Chart PowerPoint Template and Keynote Slide
Circular Diagrams
Premium
-

Free Economics PowerPoint Template
Free PowerPoint Templates
Free
-

Free Aviation PowerPoint Template
Free PowerPoint Templates
Free
-

Free Army PowerPoint Template
PowerPoint Templates
Free
-

Free Charity PowerPoint Template Deck
PowerPoint Templates
Free
-

Free Cartoon PowerPoint Template
Free PowerPoint Templates
Free
-

Customer Experience Loyalty PowerPoint Deck Template
PowerPoint Templates
Premium
-

Free Real Estate Listing PowerPoint Template
Free PowerPoint Templates
Free
-

Animated Agriculture PowerPoint Deck Template
PowerPoint Templates
Premium
-

Global Warming Infographic PowerPoint Template Deck
PowerPoint Templates
Premium
-

Free Event Planning PowerPoint Template
Free PowerPoint Templates
Free
-

Free Book Review PowerPoint Template
Free PowerPoint Templates
Free
-

Data Science PowerPoint Template
PowerPoint Templates
Premium
-

Free University Presentation PowerPoint Template
PowerPoint Templates
Free
-

Annual Report PowerPoint Template and Keynote
PowerPoint Templates
Premium
-
Pie Chart PowerPoint Template
Infographic
Premium
-
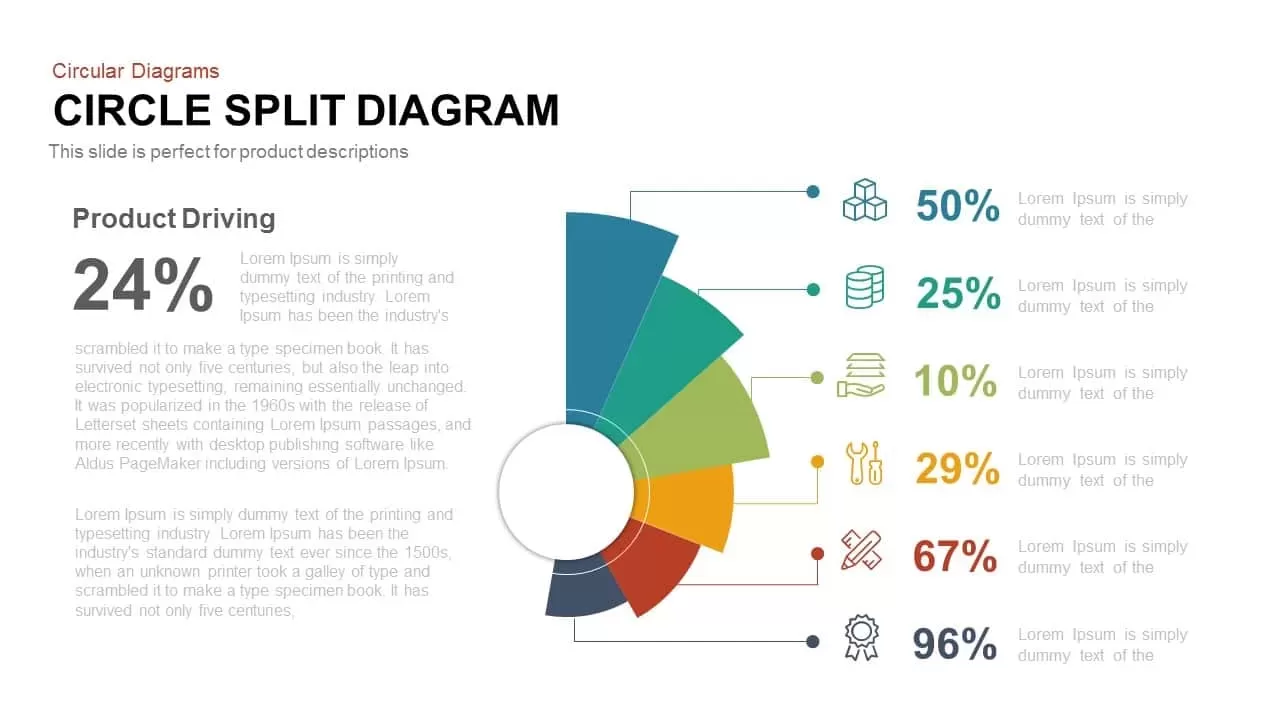
Circle Split Diagram PowerPoint Template and Keynote Slide
Circular Diagrams
Premium
-

Real Estate PowerPoint Theme
PowerPoint Themes
Premium
-
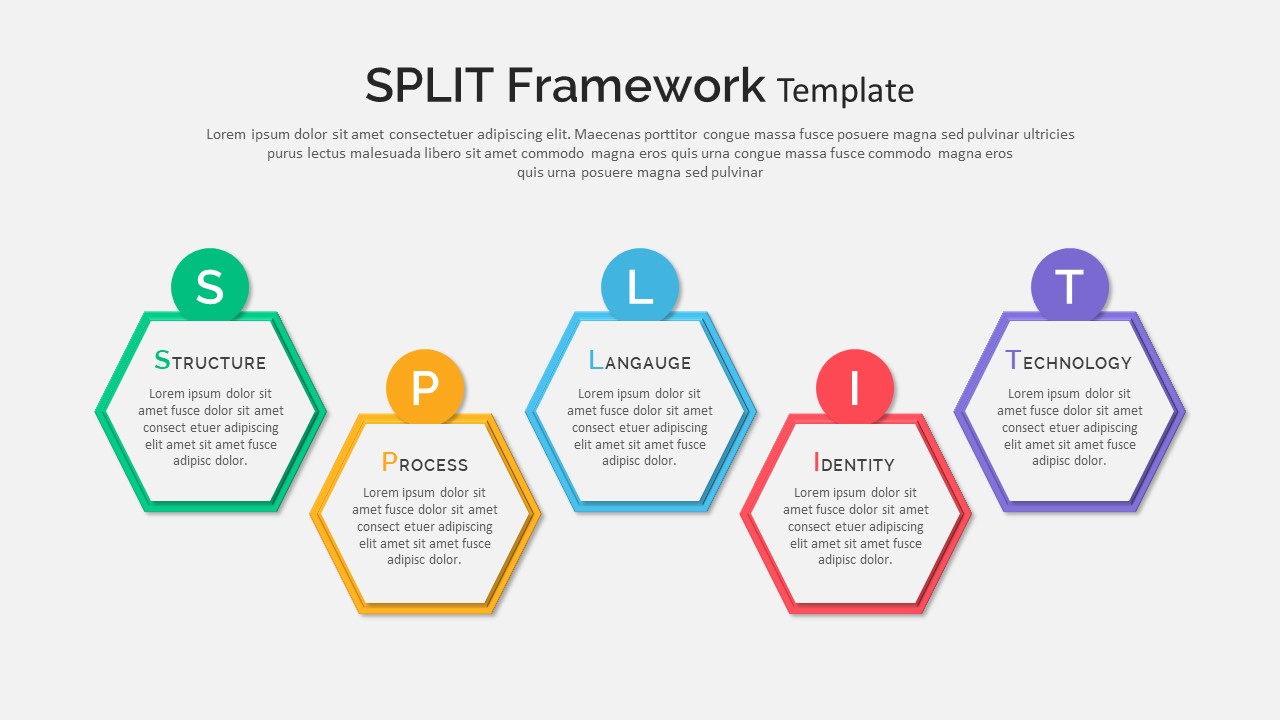
Split Framework PowerPoint Template
PowerPoint Templates
Premium
-

EFQM Model PowerPoint Template
PowerPoint Templates
Premium
-

Free Dunder Mifflin Paper Company Pitch Deck
Free PowerPoint Templates
Free
-

Free AI Artificial Intelligence PowerPoint Template
PowerPoint Templates
Free
-

Stakeholder Register PowerPoint Template
PowerPoint Templates
Premium
-

Business Process Reengineering Template
PowerPoint Templates
Premium
-

Creative Bar Chart Data Analysis PowerPoint Template and Keynote
Infographic
Premium
-
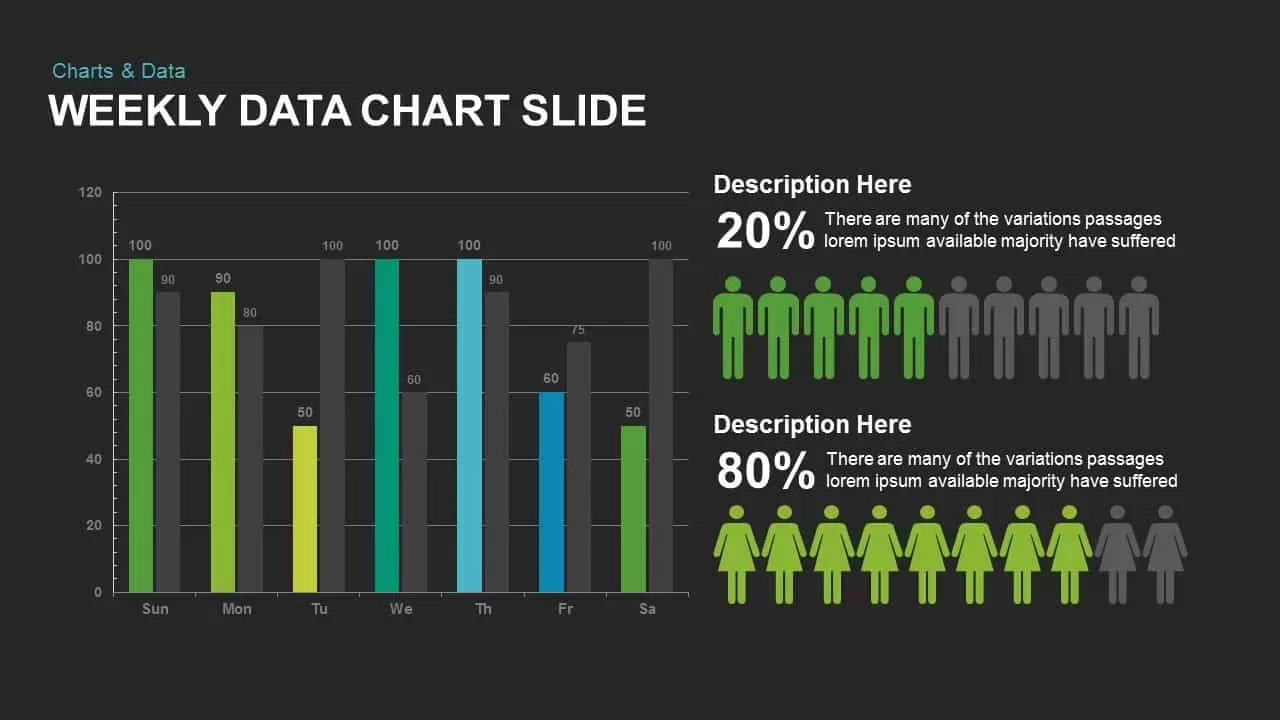
Weekly Data Charts PowerPoint Presentation Template and Keynote Slide
Infographic
Premium
-

Animated Upcoming Event Poster PowerPoint Template
PowerPoint Templates
Premium
-
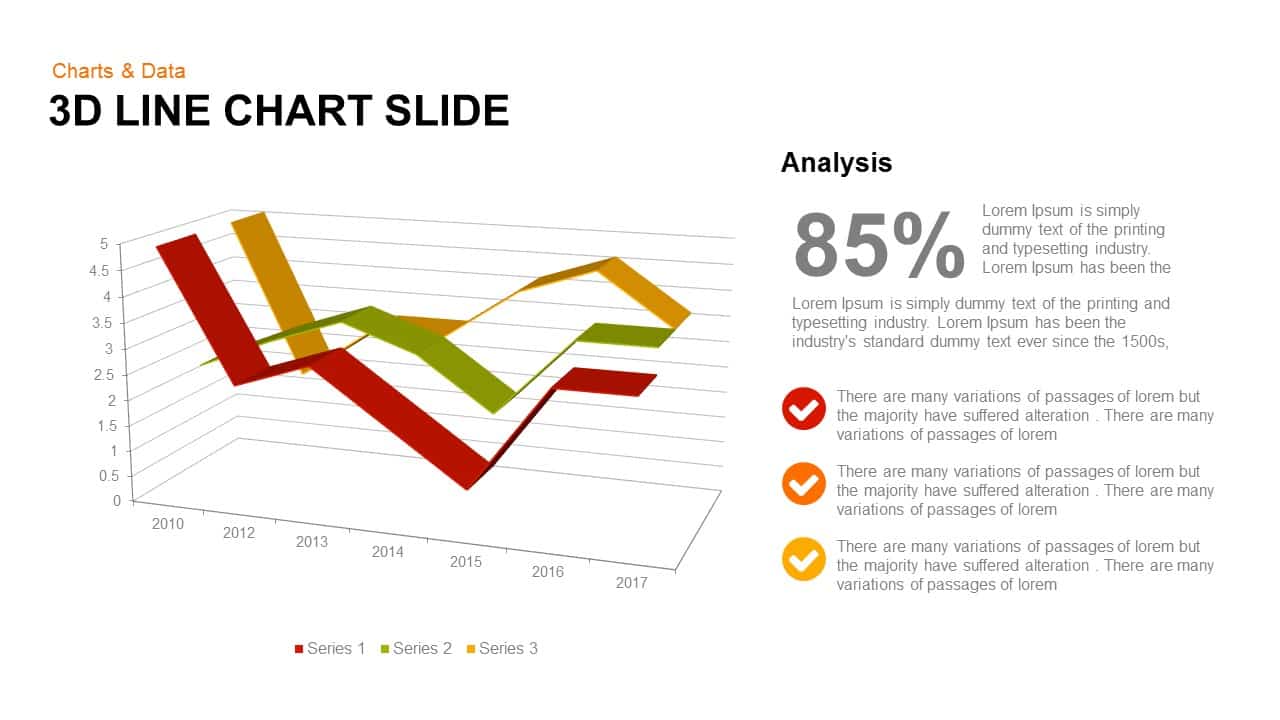
3d Line Chart PowerPoint Template and Keynote Slide
3D Shapes
Premium
-
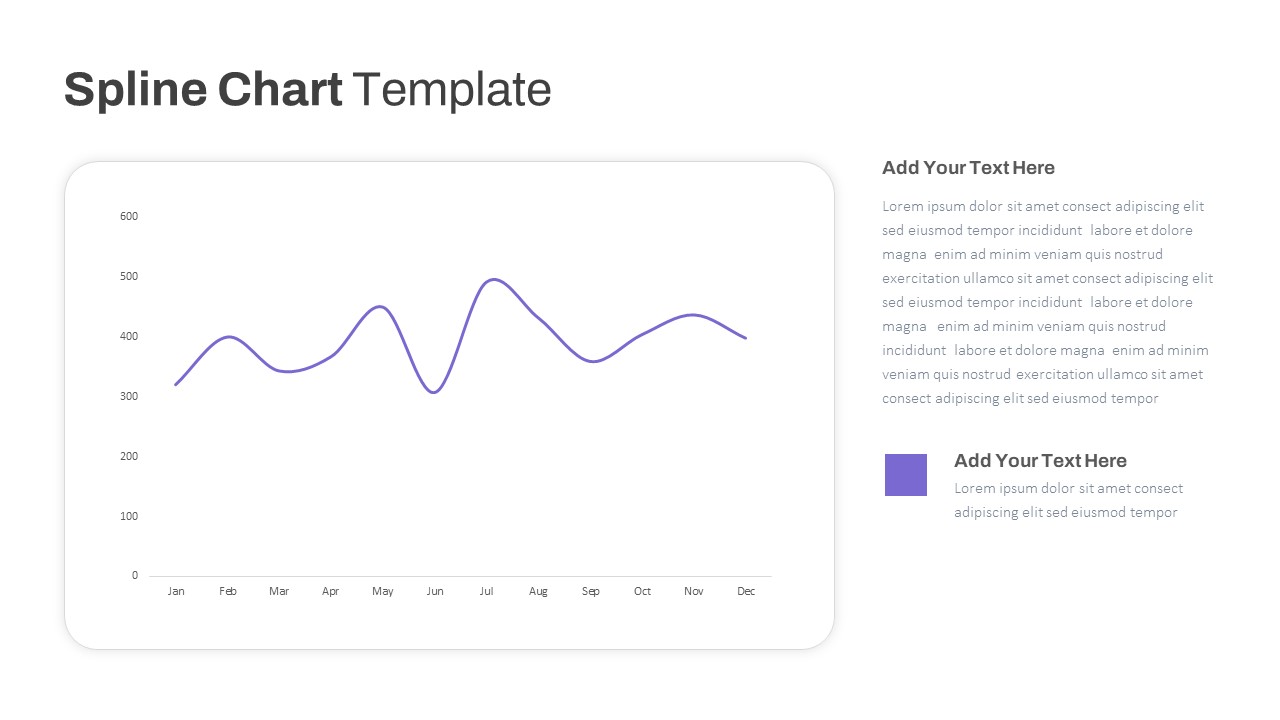
Spline Chart PowerPoint Template
PowerPoint Charts
Premium
-
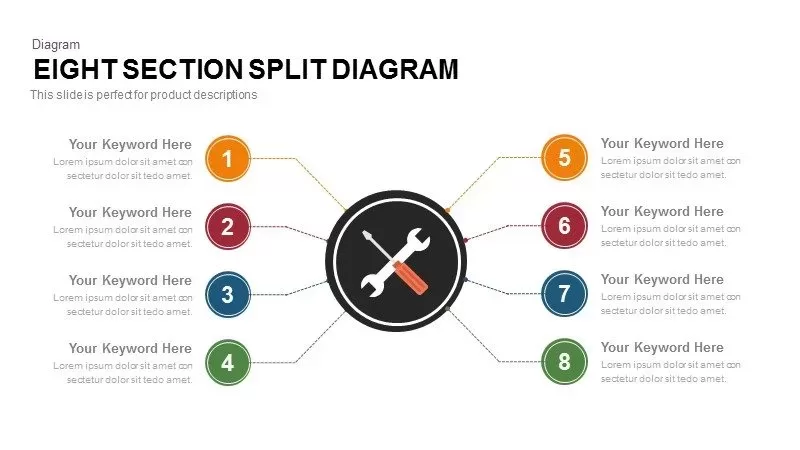
8 Section Split Diagram for PowerPoint Presentation
Business Models
Premium
-

Combination Chart PowerPoint Template
PowerPoint Charts
Premium
-
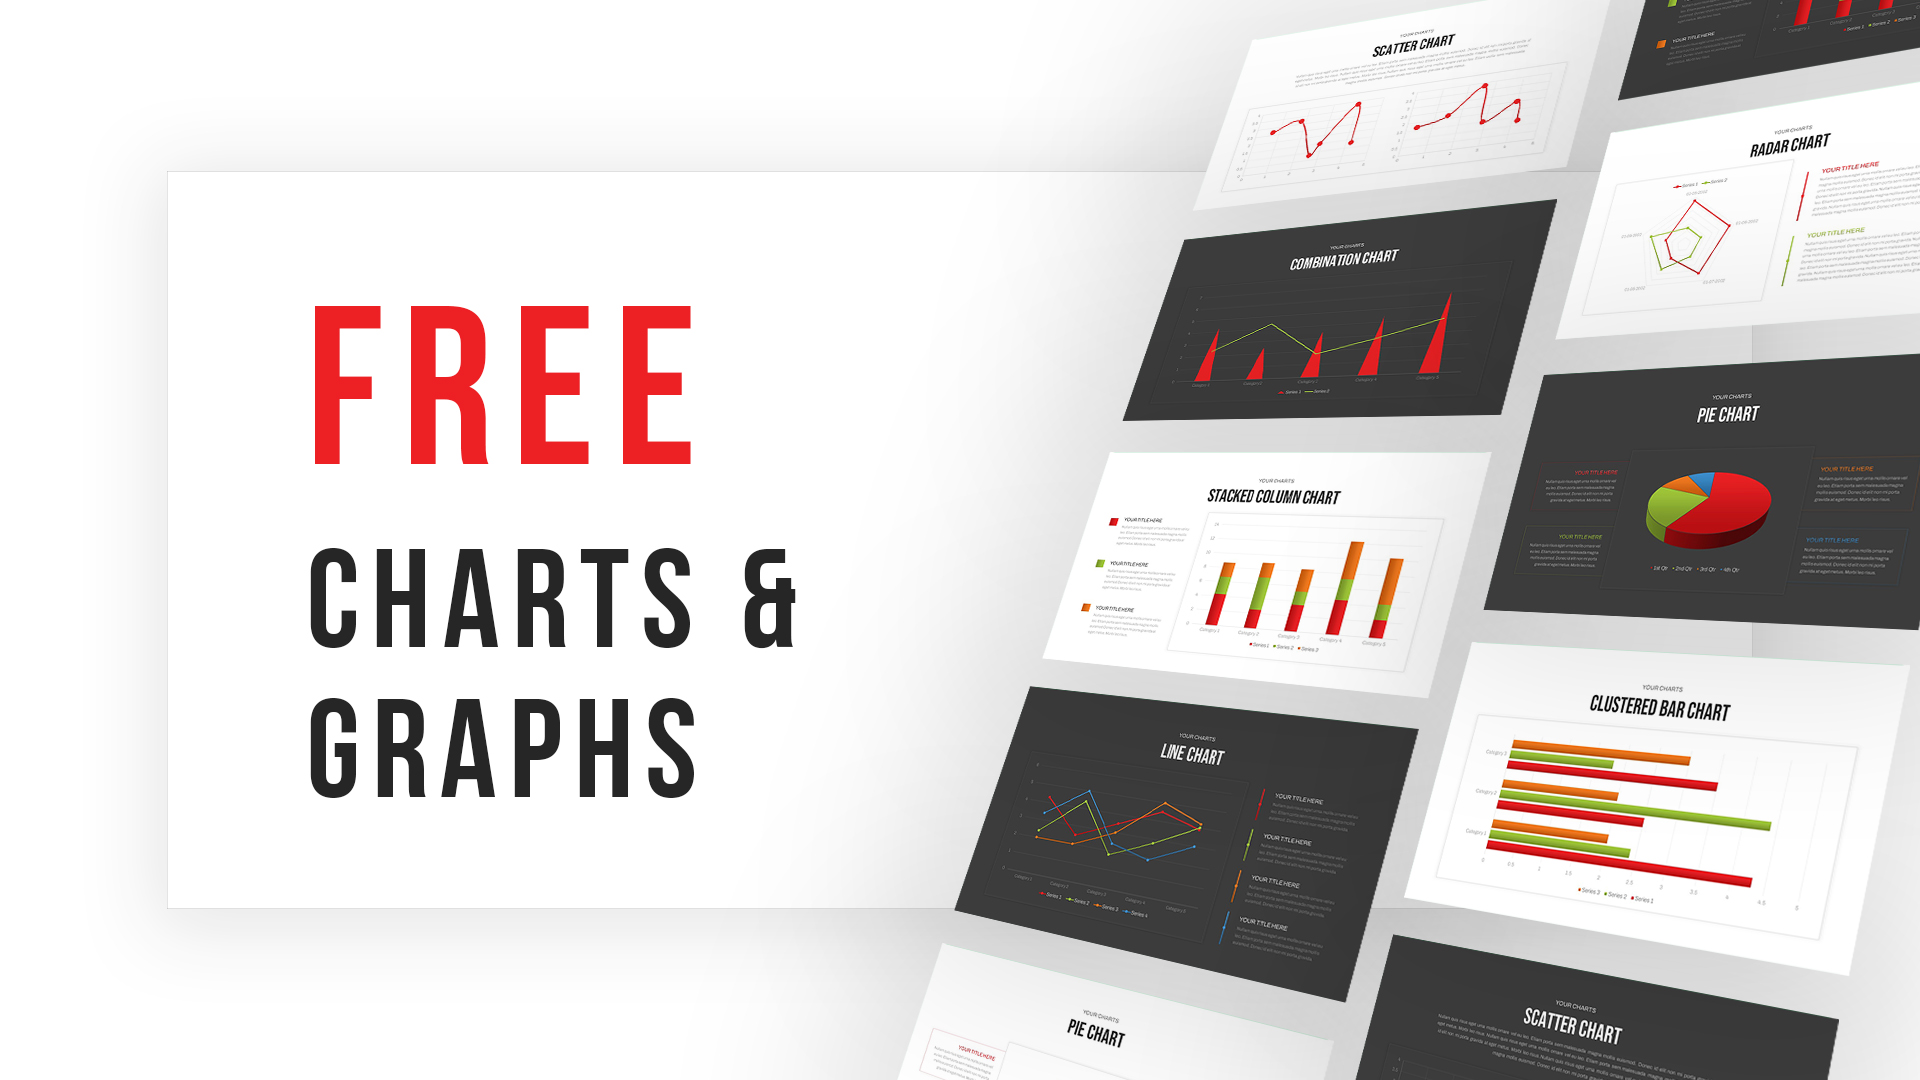
Free Charts & Graphs Deck PowerPoint Template
PowerPoint Templates
Free
-

Biotechnology PowerPoint Presentation Template
PowerPoint Templates
Premium
-

Open Door Policy PowerPoint Template
PowerPoint Templates
Premium
-

Mekko Chart Template
PowerPoint Templates
Premium
-
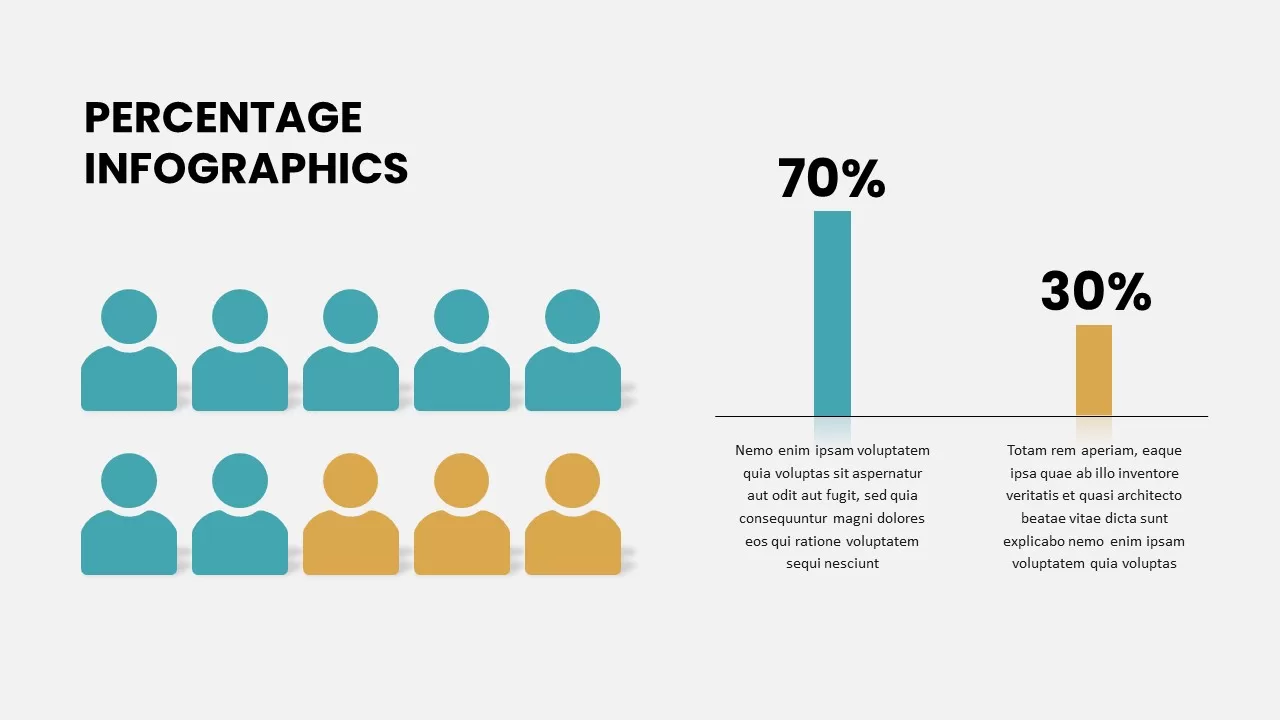
Percentage Infographic
Column and Bar chart
Premium
-
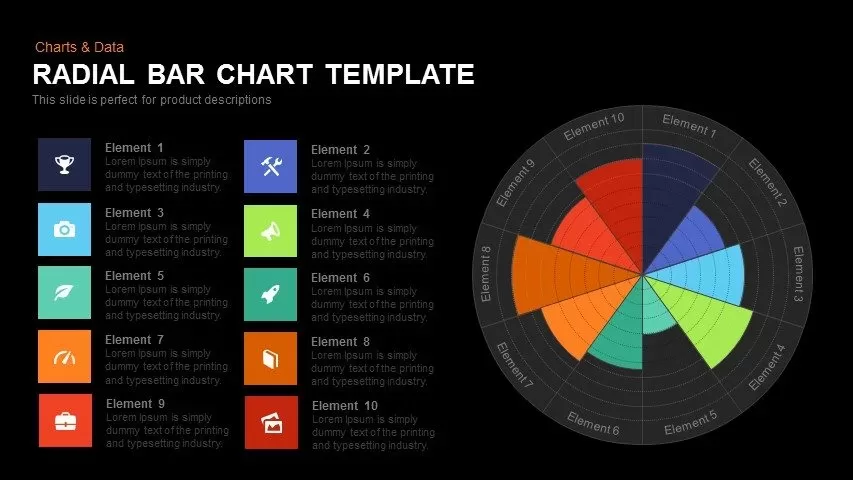
Radial Bar Chart Template for PowerPoint and Keynote
Circular Diagrams
Premium
-
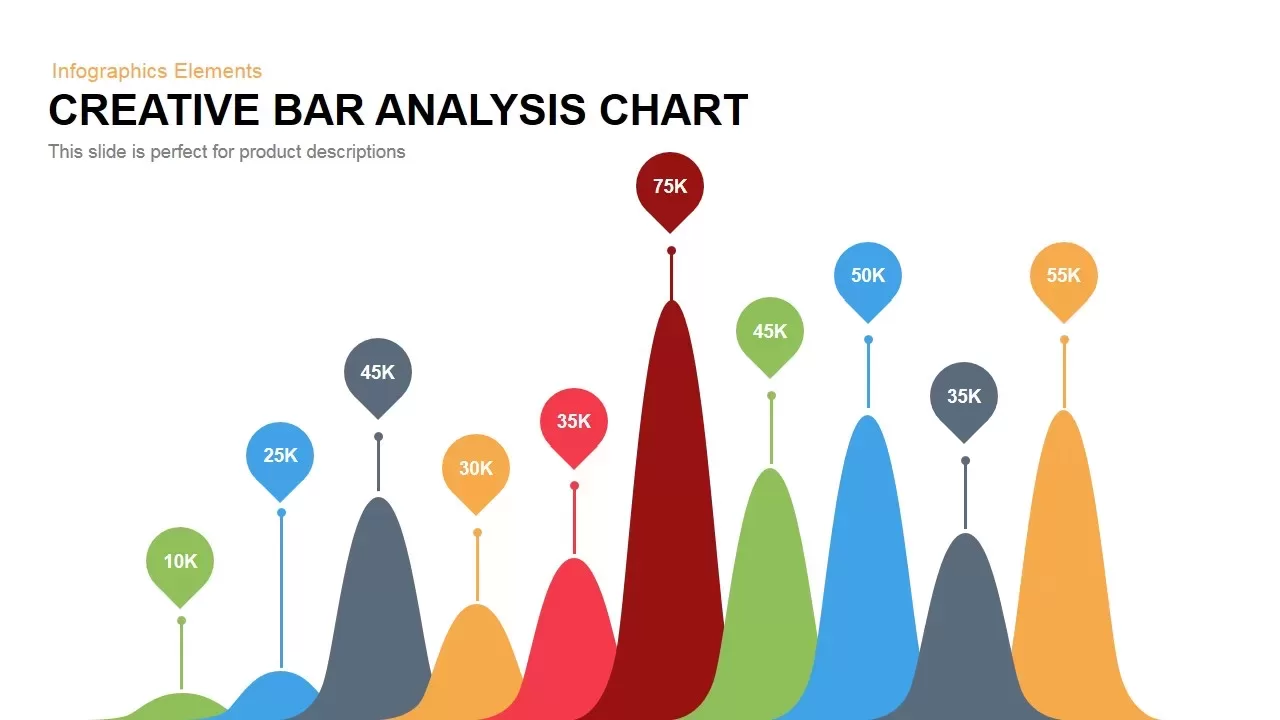
Creative Bar Chart Analysis PowerPoint Template and Keynote
Column and Bar chart
Premium
-
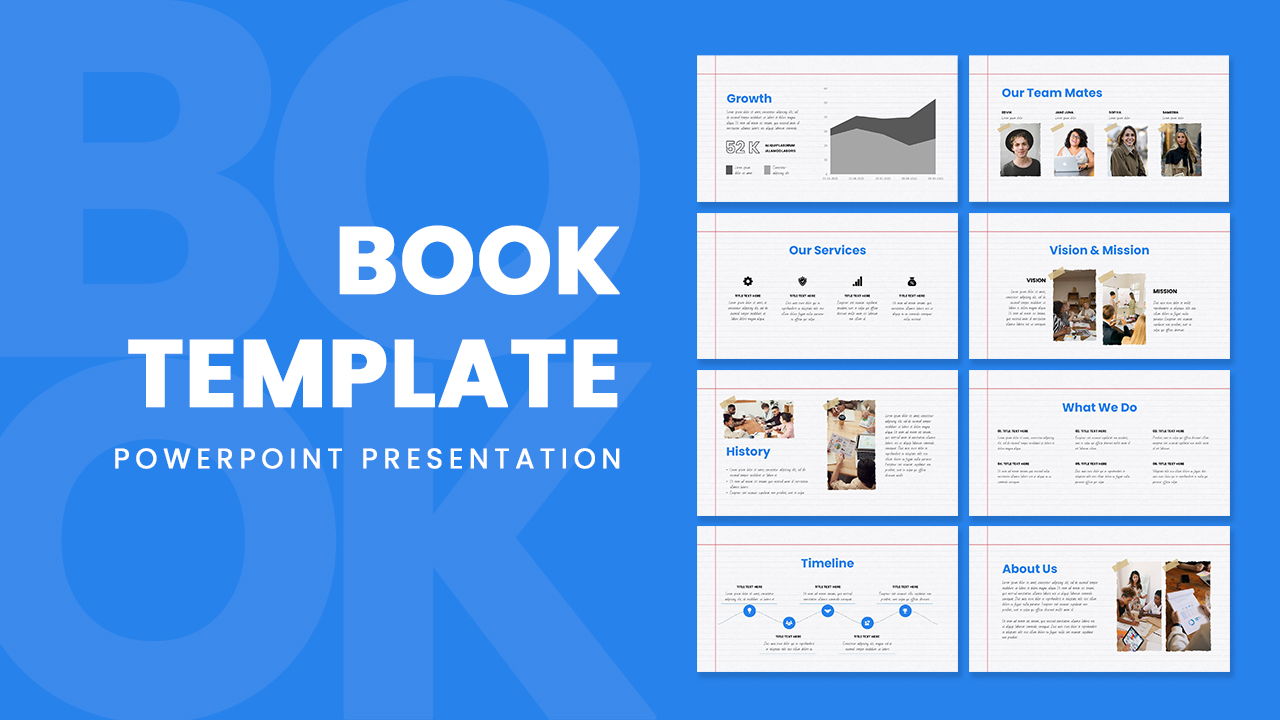
Free PowerPoint Book Template
Free slides
Free
-
3D Printing Deck PowerPoint Template
PowerPoint Templates
Premium
-
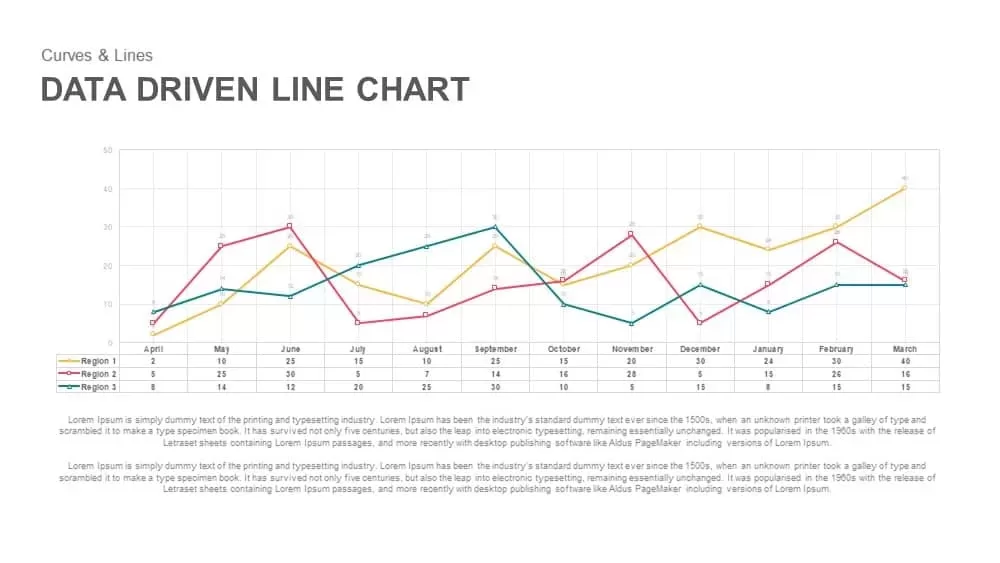
Data Driven Line Chart Template for PowerPoint & Keynote
Curves and Lines
Premium
-
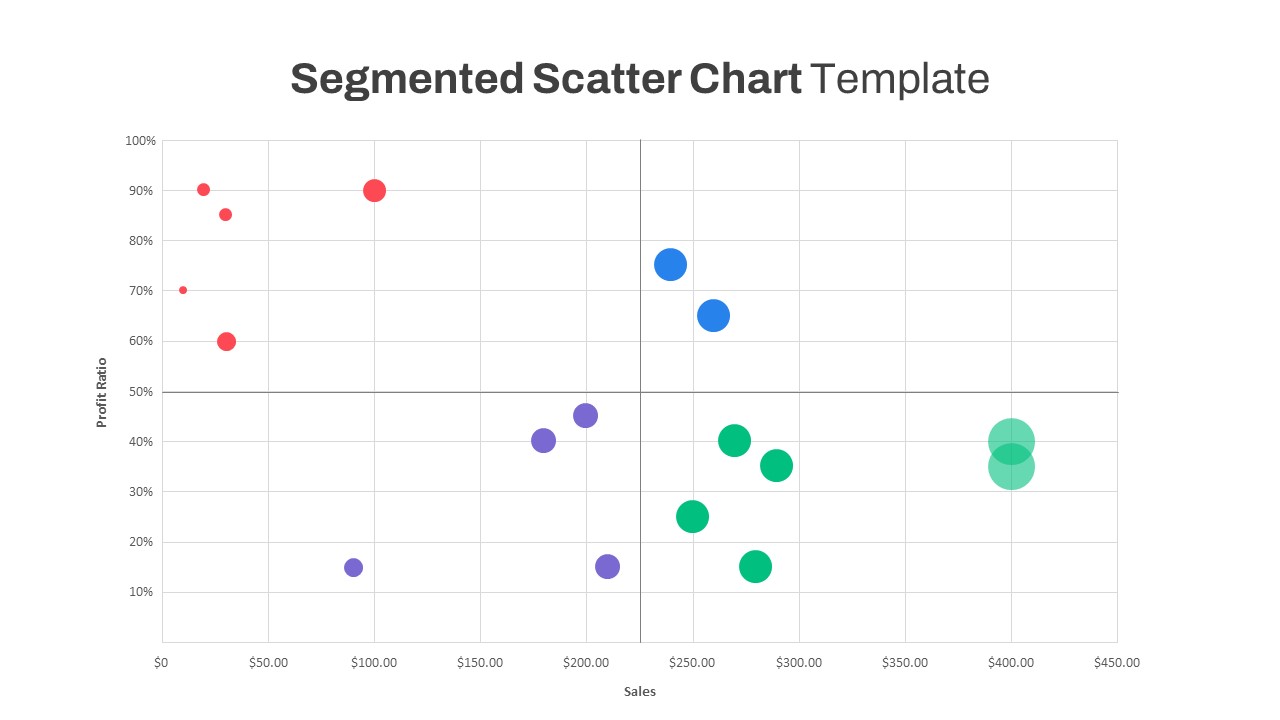
Segmented Scatter Chart PowerPoint Template
PowerPoint Charts
Premium
-
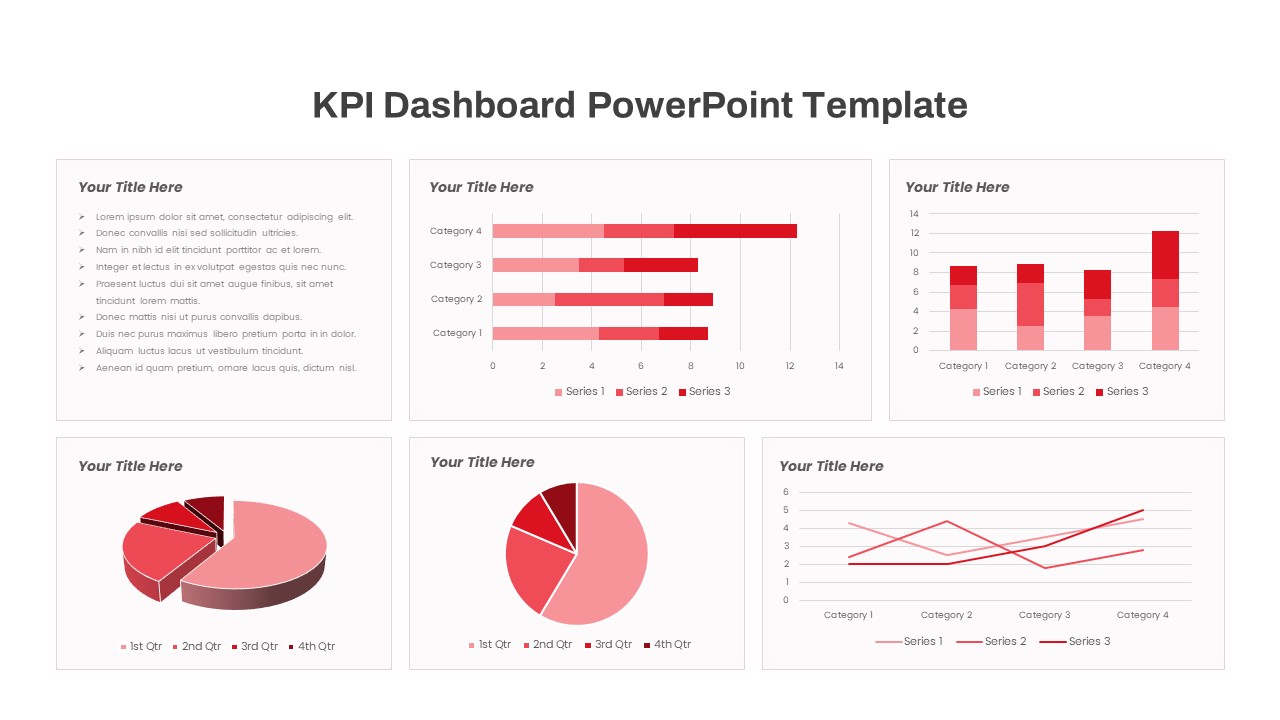
Free KPI Dashboard PowerPoint Template
PowerPoint Templates
Free
-

Area Chart PowerPoint Template
PowerPoint Charts
Premium
-
Free Statistics PowerPoint Template
Free PowerPoint Templates
Free
-

Power Analogy Metaphor PowerPoint Template
Metaphor, Simile & Analogy
Premium
-
Business Growth Chart Template for PowerPoint and Keynote
Business Models
Premium
-

Pencil Bar Chart PowerPoint Template and Keynote Slide
Column and Bar chart
Premium
-

Free Teacher’s Week Plan PowerPoint Template
PowerPoint Templates
Free
-

Radial Bar Chart PowerPoint Templates and Keynote Slides
PowerPoint Charts
Premium
-
Sun Burst Chart PowerPoint Template
Circular Diagrams
Premium
-
Data Flow PowerPoint Presentation Template
PowerPoint Templates
Premium
-

Free Charts and Graphs PowerPoint Template
PowerPoint Templates
Free
-

Proportional Area Chart PowerPoint Template
PowerPoint Templates
Premium
-
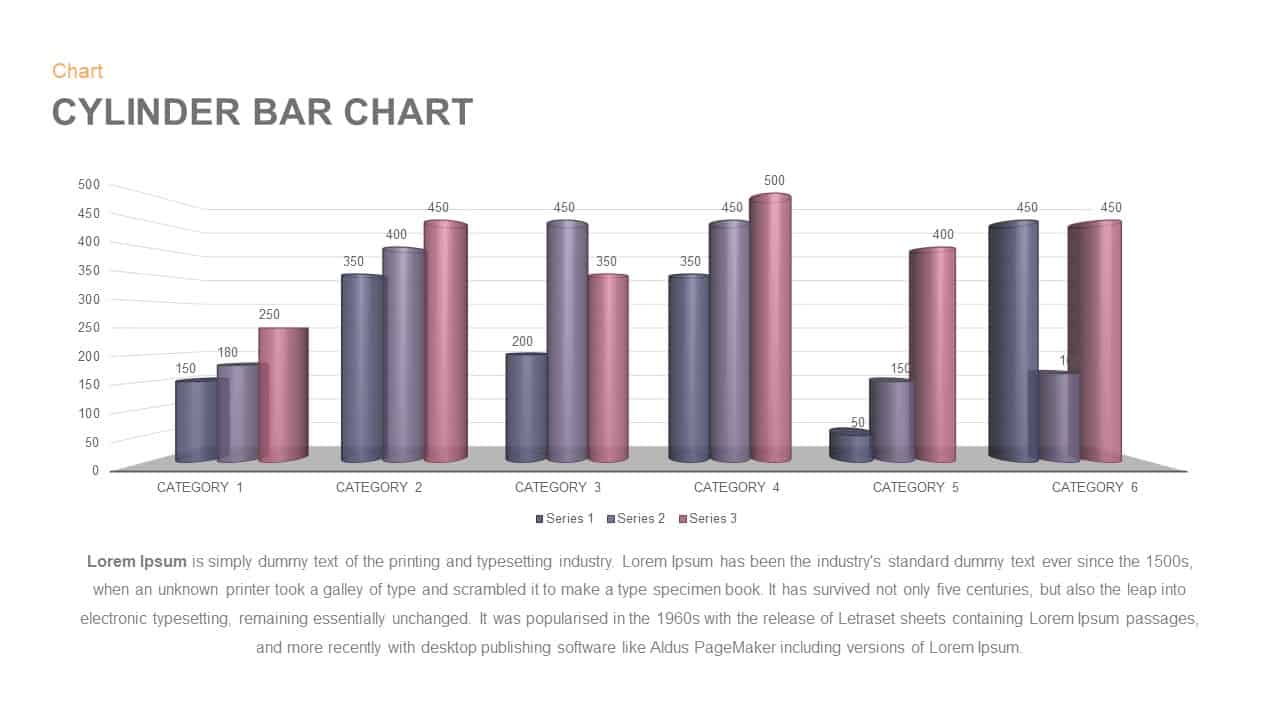
Cylinder Bar Chart PowerPoint Template and Keynote Slide
Column and Bar chart
Premium
-
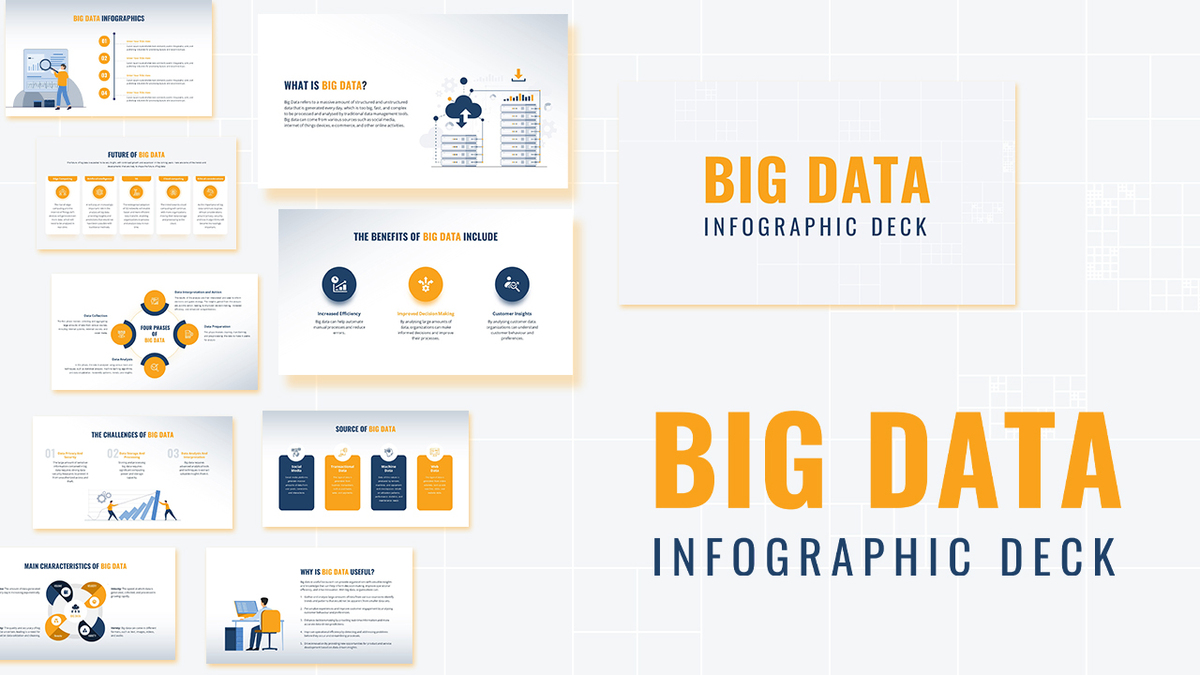
Big Data Infographic Deck For PowerPoint
PowerPoint Business Templates
Premium
-

Animated Clustered Bar Chart PowerPoint Template
PowerPoint Charts
Premium
-

Finance Consulting PowerPoint Template
PowerPoint Templates
Premium
-
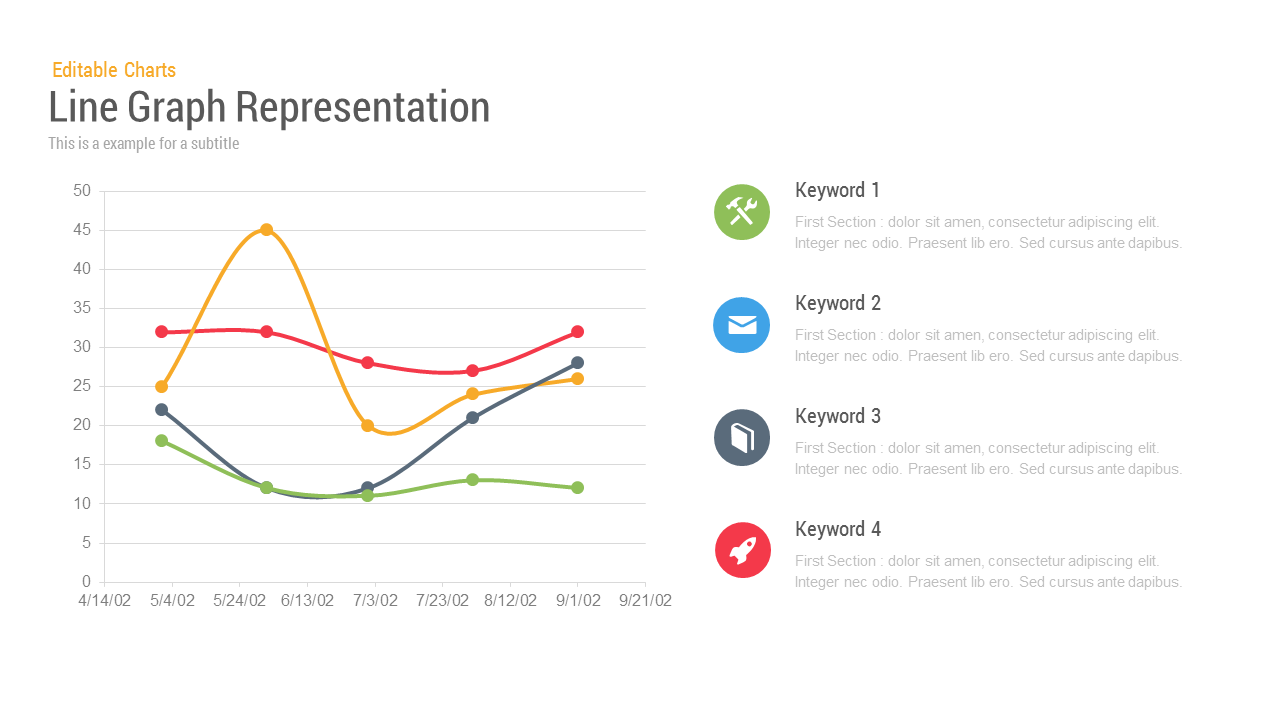
Line Chart Representation PowerPoint Templates and Keynote Slides
PowerPoint Charts
Premium
-

Disaster Management Template
PowerPoint Templates
Premium
-

Cyber Monday PowerPoint Template
PowerPoint Business Templates
Premium
-

Creative Studio PowerPoint Template
PowerPoint Business Templates
Premium
-
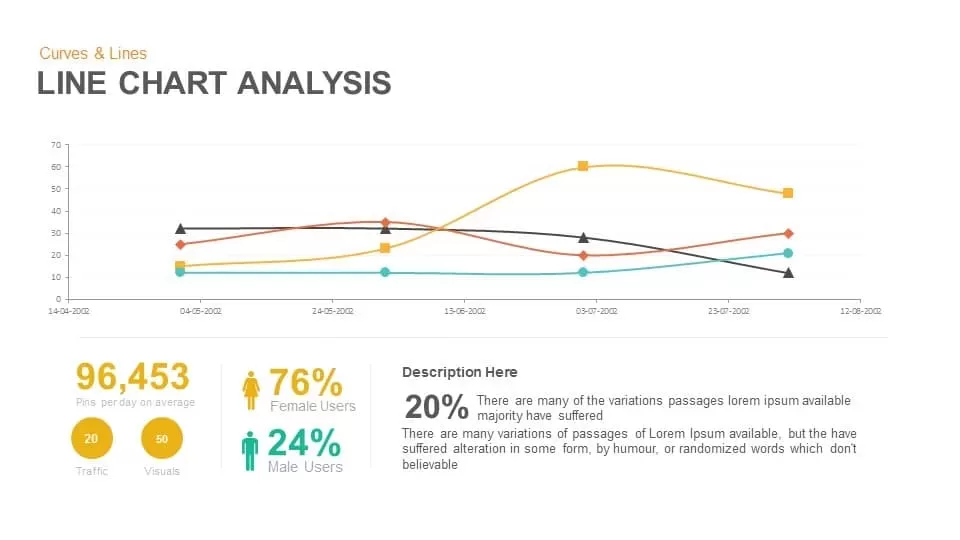
Line Chart Analysis PowerPoint Template and Keynote Slide
Curves and Lines
Premium
-
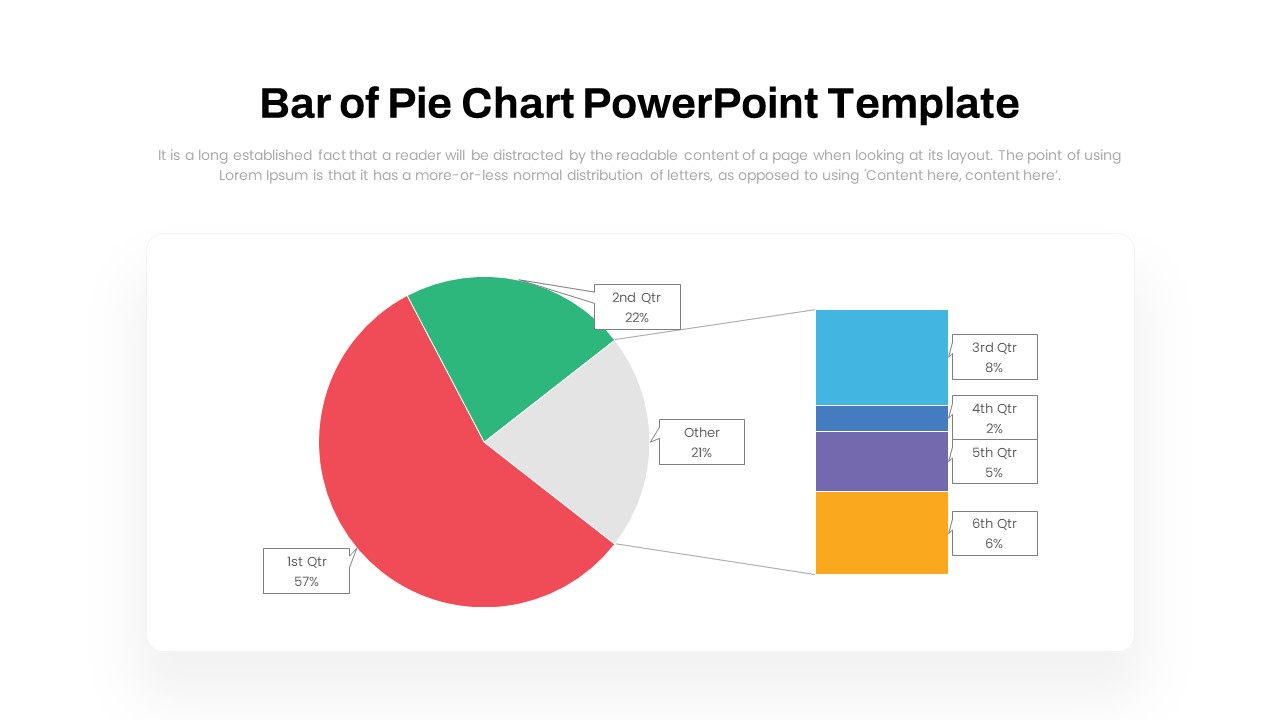
Bar of Pie Chart PowerPoint Template
PowerPoint Templates
Premium
-
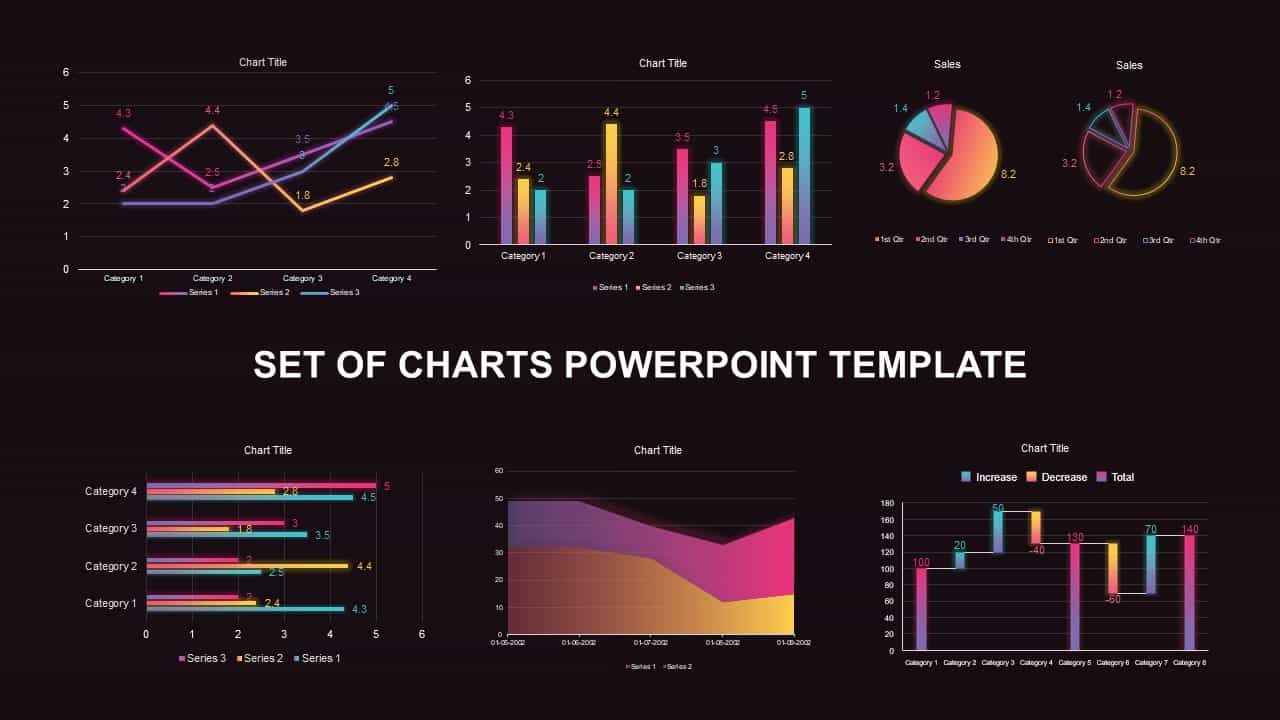
Set of Chart PowerPoint Template and Keynote Diagram
PowerPoint Charts
Premium
-

Multipurpose Business PowerPoint Template
PowerPoint Business Templates
Premium
-
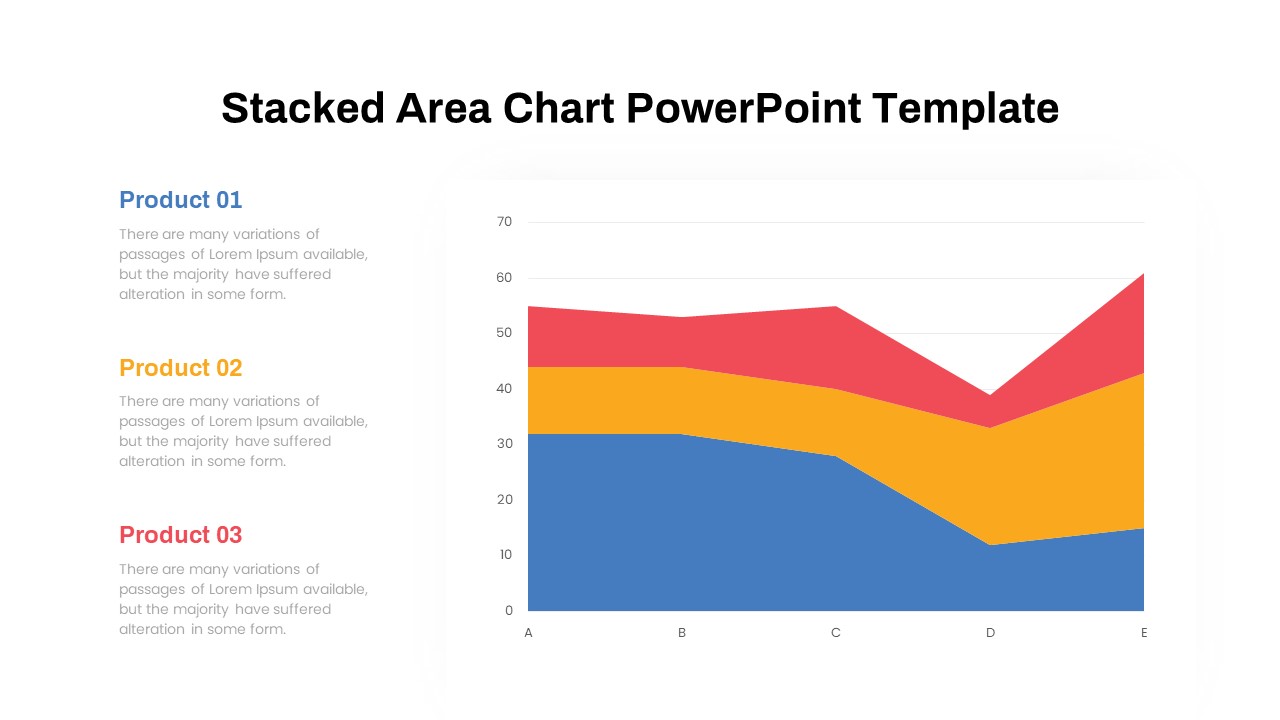
Stacked Area Chart PowerPoint Template
PowerPoint Charts
Premium
-
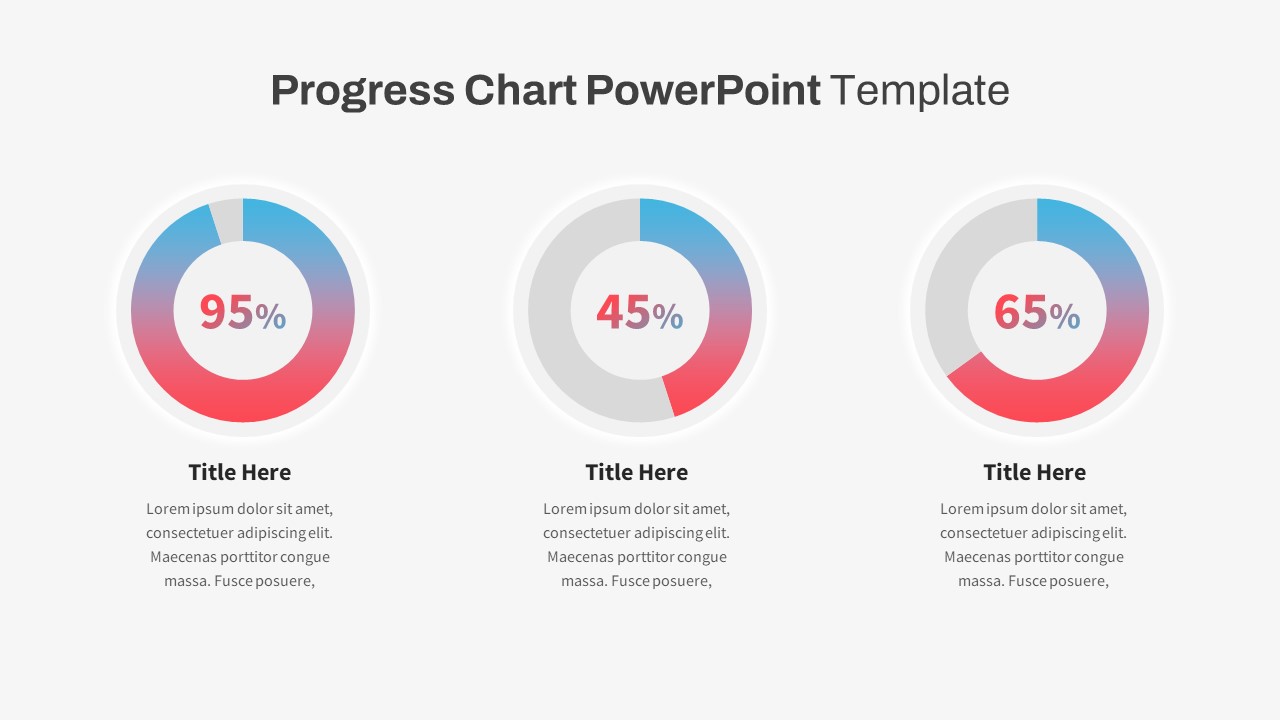
Progress Chart PowerPoint Template
PowerPoint Templates
Premium
-
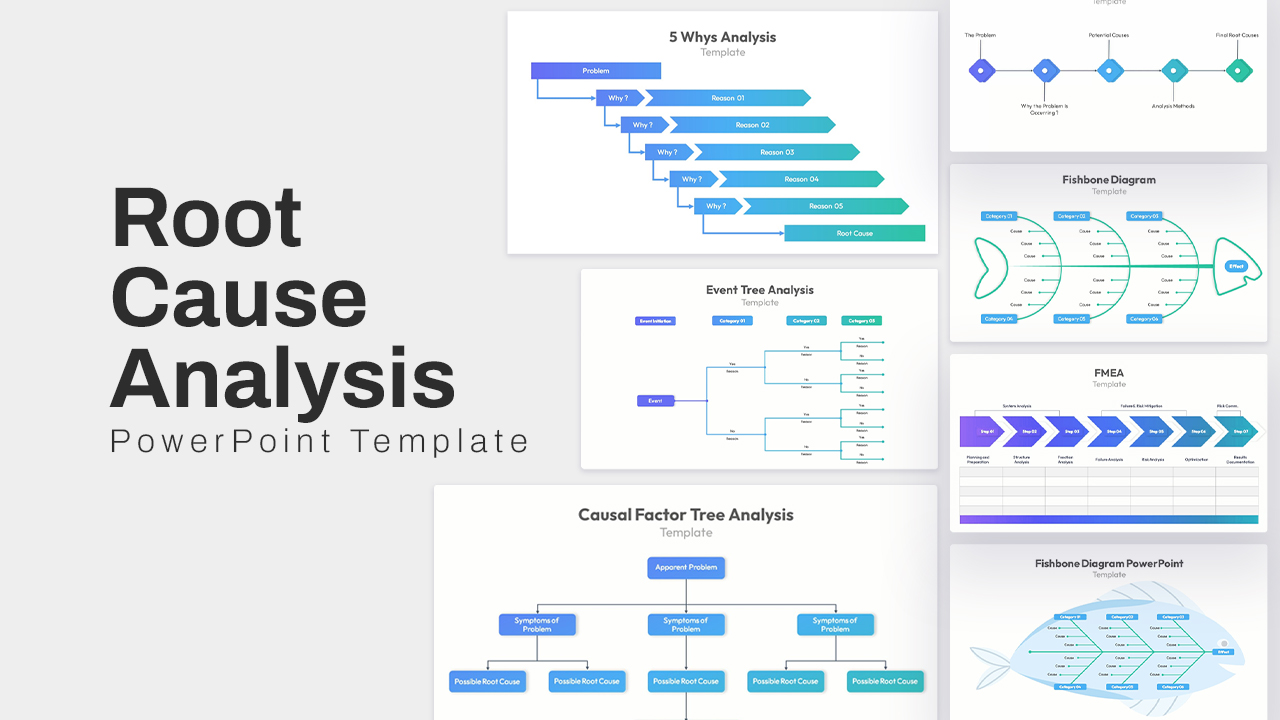
Root Cause Analysis PowerPoint Template
Arrow Diagrams
Premium
-

Business Case PowerPoint Presentation Template
PowerPoint Business Templates
Premium
-
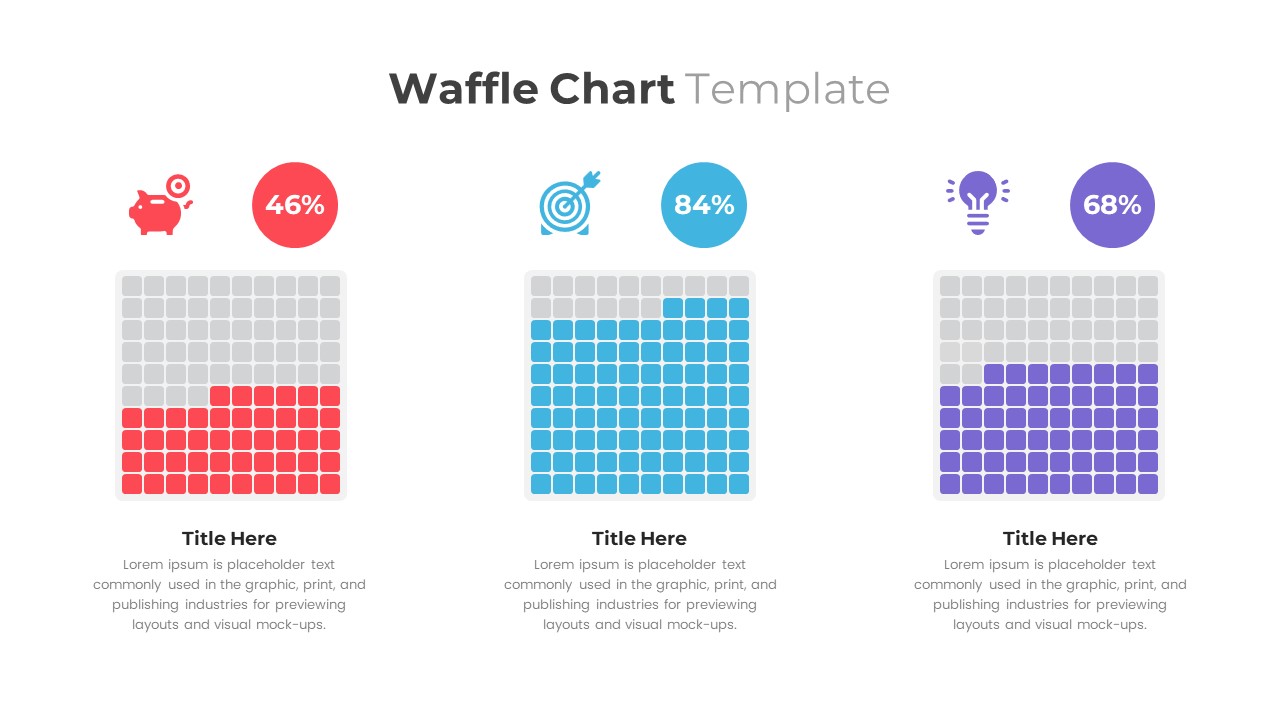
Waffle Chart PowerPoint Template
PowerPoint Templates
Premium
-
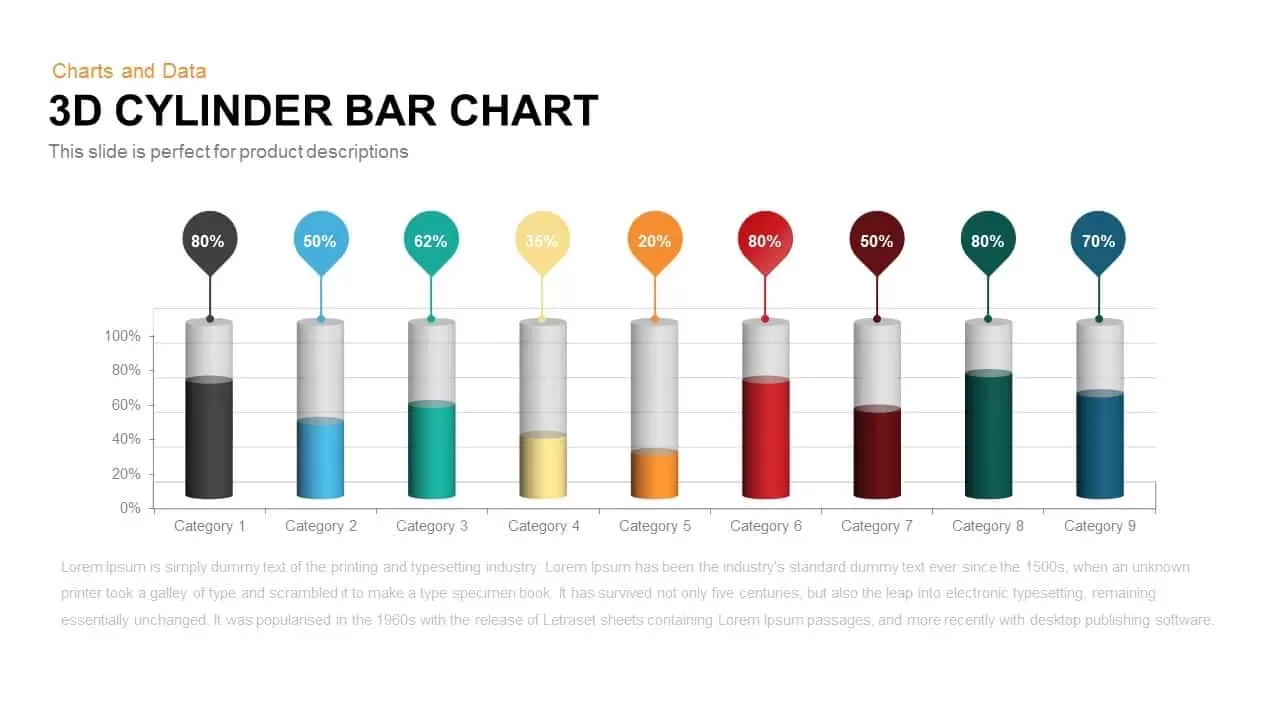
3D Cylinder Bar Chart PowerPoint Template and Keynote Slide
Column and Bar chart
Premium
-
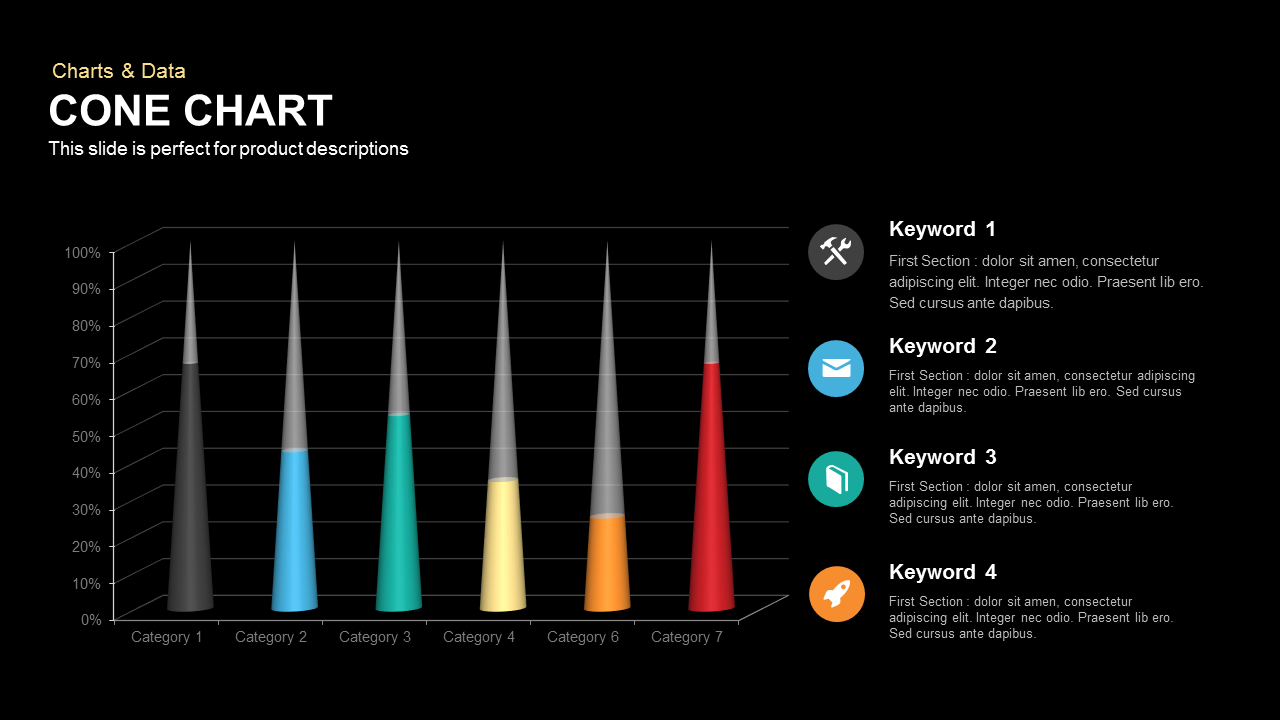
Cone Chart PowerPoint Template
Column and Bar chart
Premium
-
Polar Chart PowerPoint Template
PowerPoint Templates
Premium
-

Corporate PowerPoint Presentation Template
PowerPoint Business Templates
Premium
-
Four Quadrant Scatter Chart PowerPoint Template
PowerPoint Charts
Premium
-
Data Strategy Roadmap PowerPoint Template
PowerPoint Templates
Premium
-
Pert Chart PowerPoint Templates
Diagrams
Premium