


Multi level Donut Chart Template for PowerPoint and Keynote
- Version
- Download 324
- File Size 0.00 KB
- File Count 1
- Create Date November 17, 2015
- Last Updated July 25, 2024
Multi level Donut Chart Template for PowerPoint and Keynote
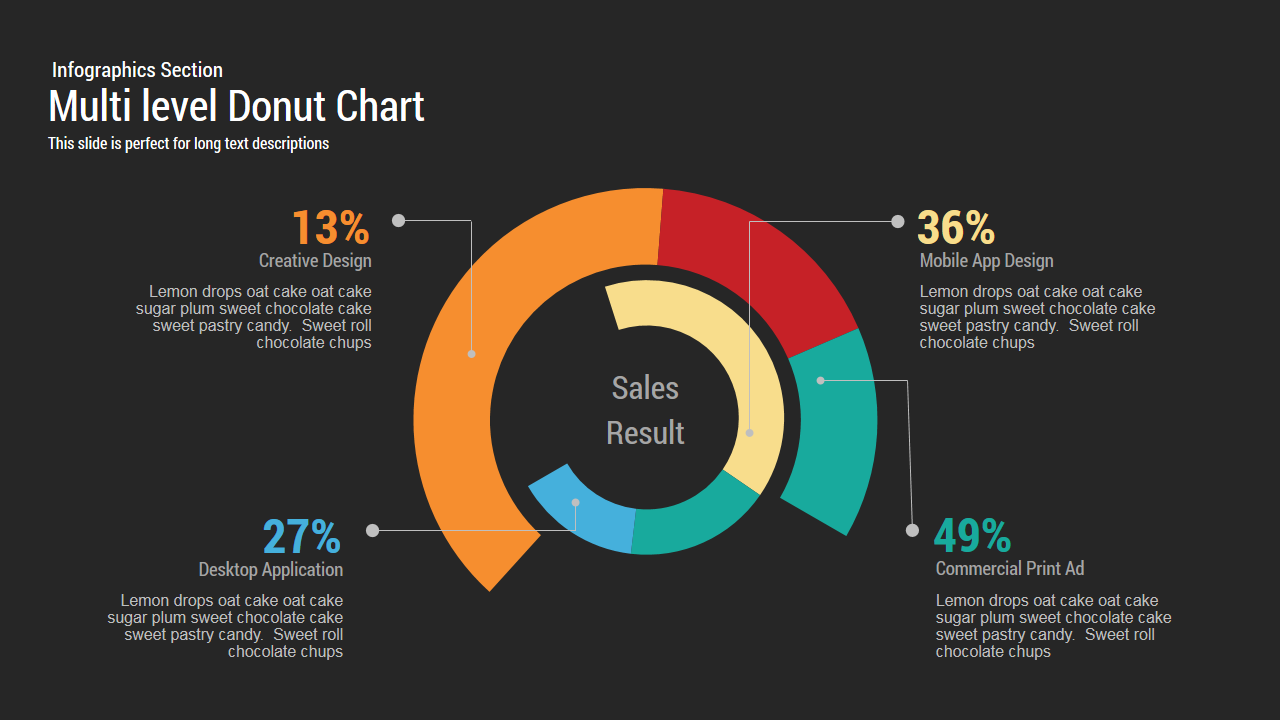
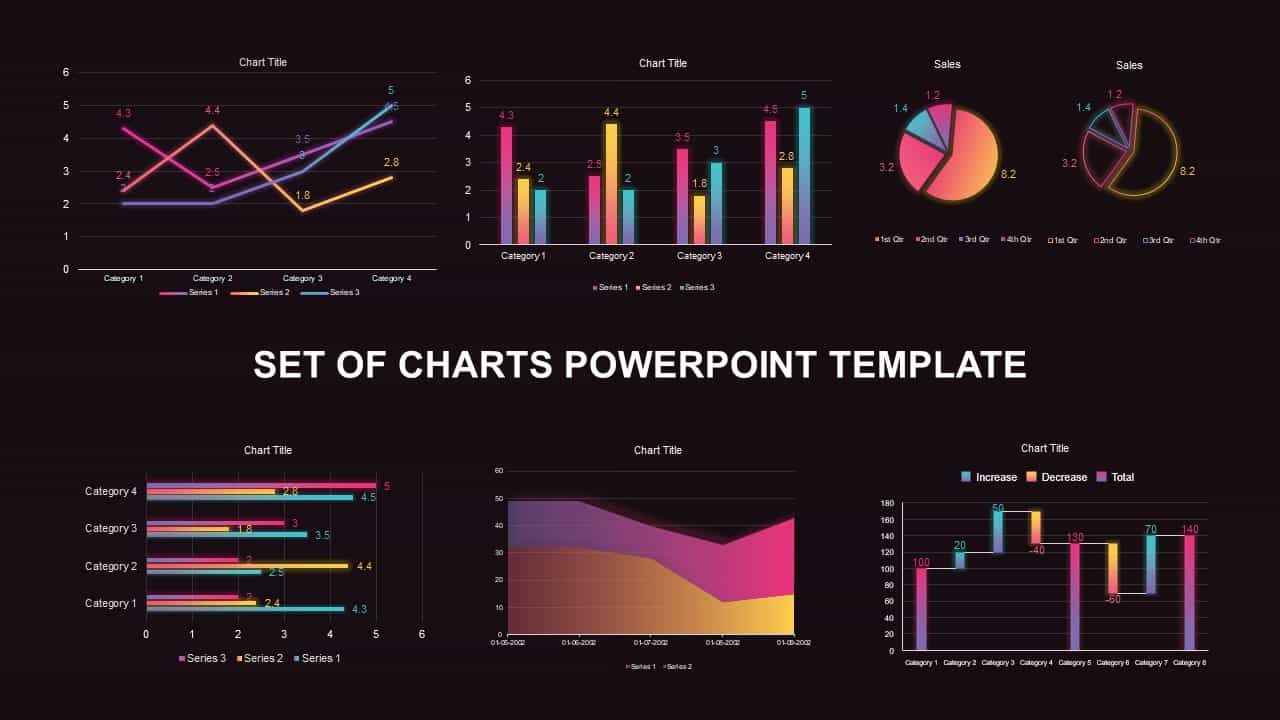
Multi-level Donut Chart Template for Powerpoint and Keynote Slide
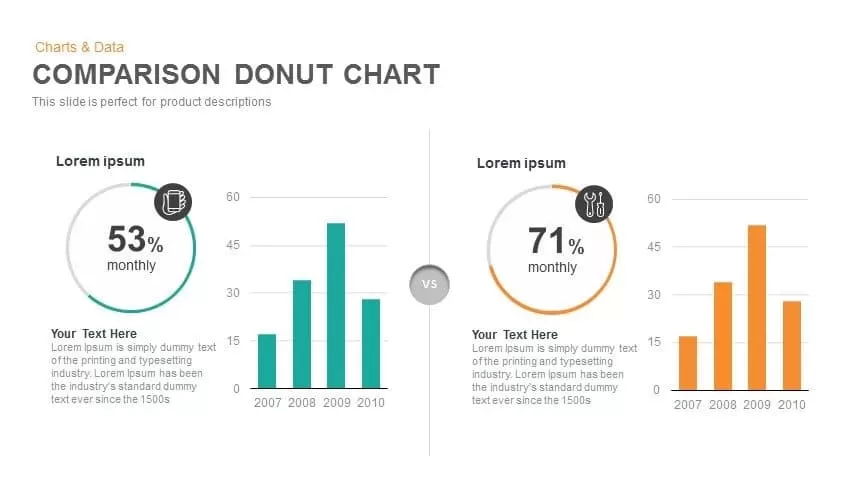
Multi-level donut chart template for powerpoint & keynote Slide which is created with two donut charts which you can show your company percentage and values. The template is designed in both powerpoint and keynote versions in 16:9(widescreen) and 4:3(Normal) Version.
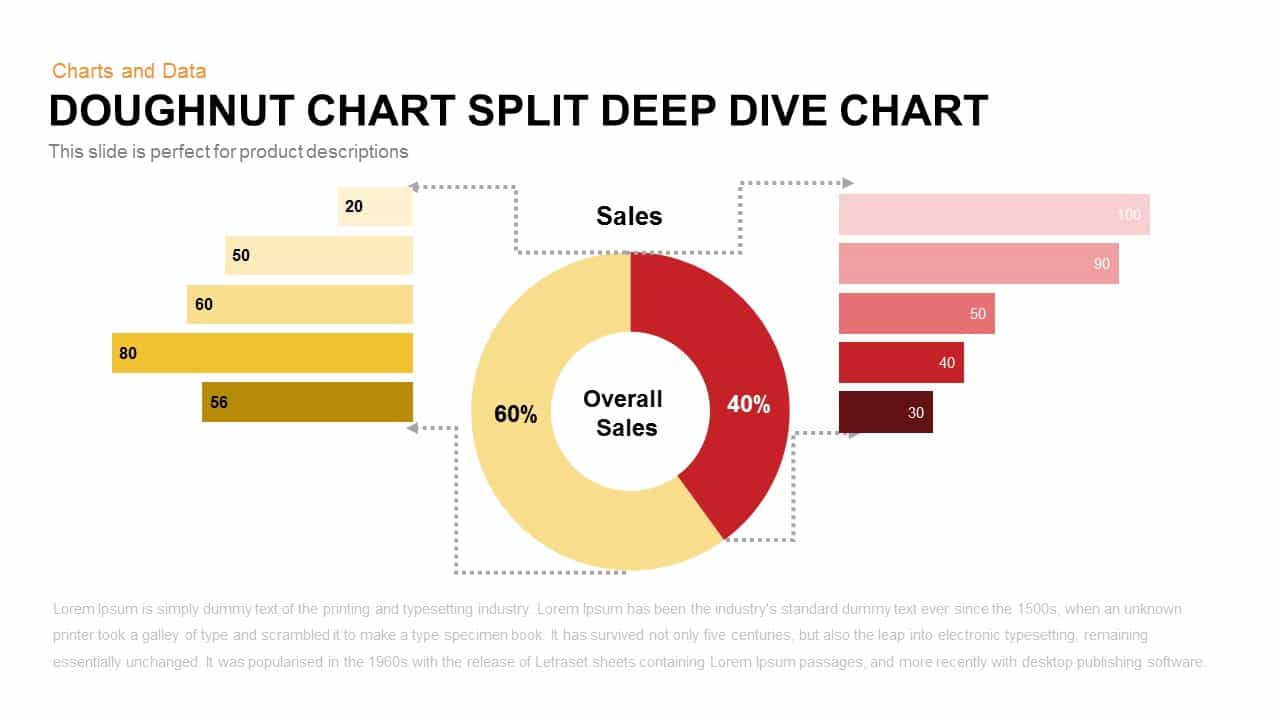
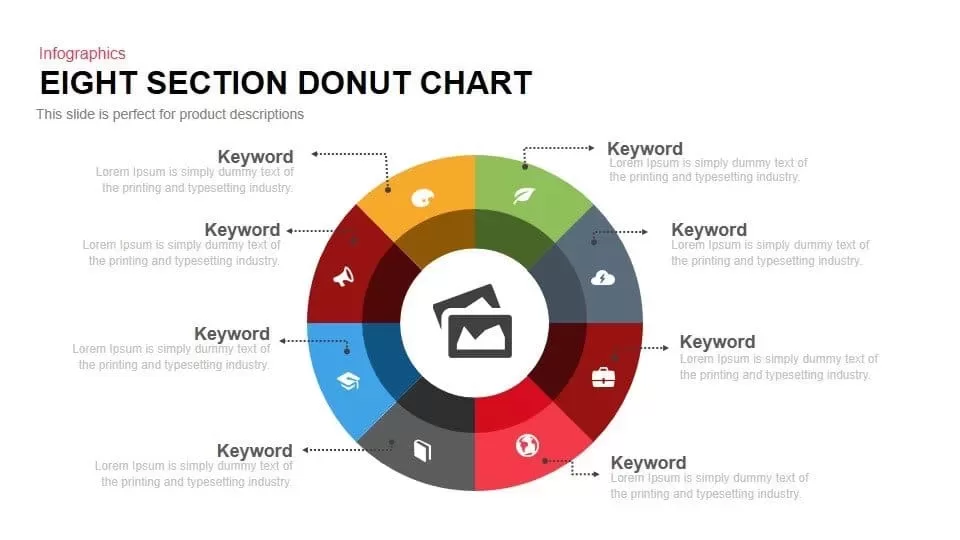
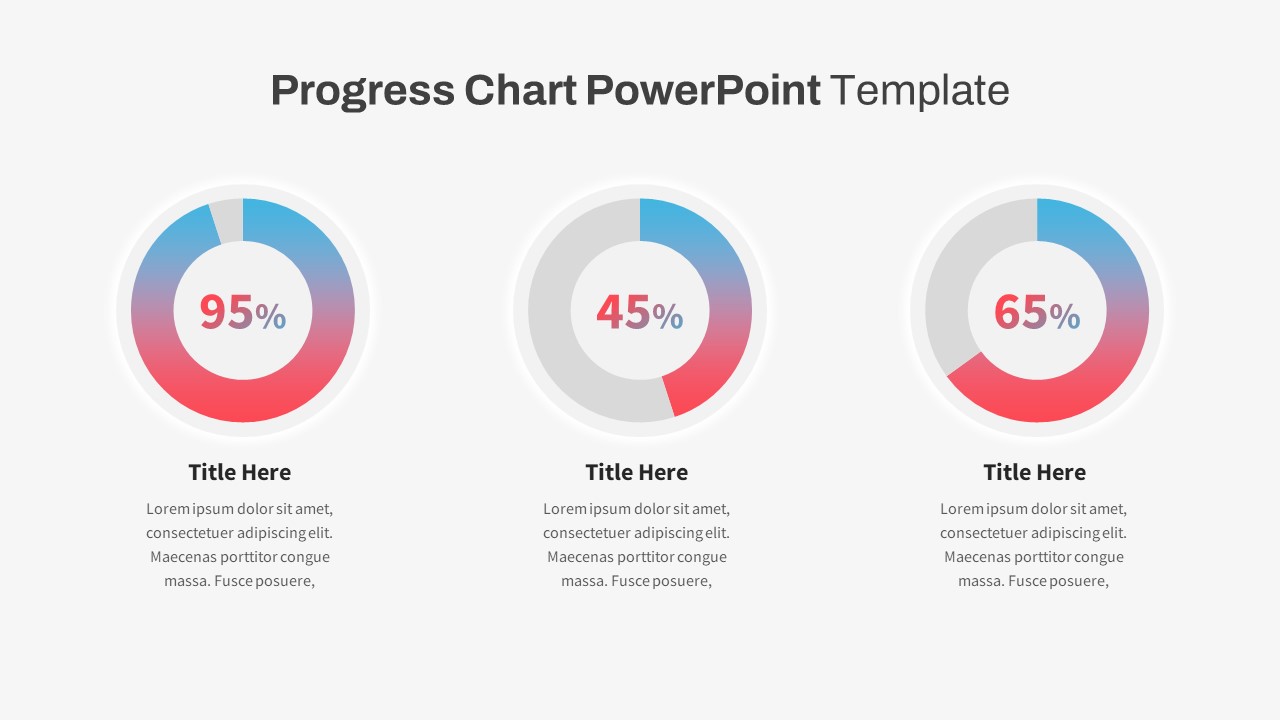
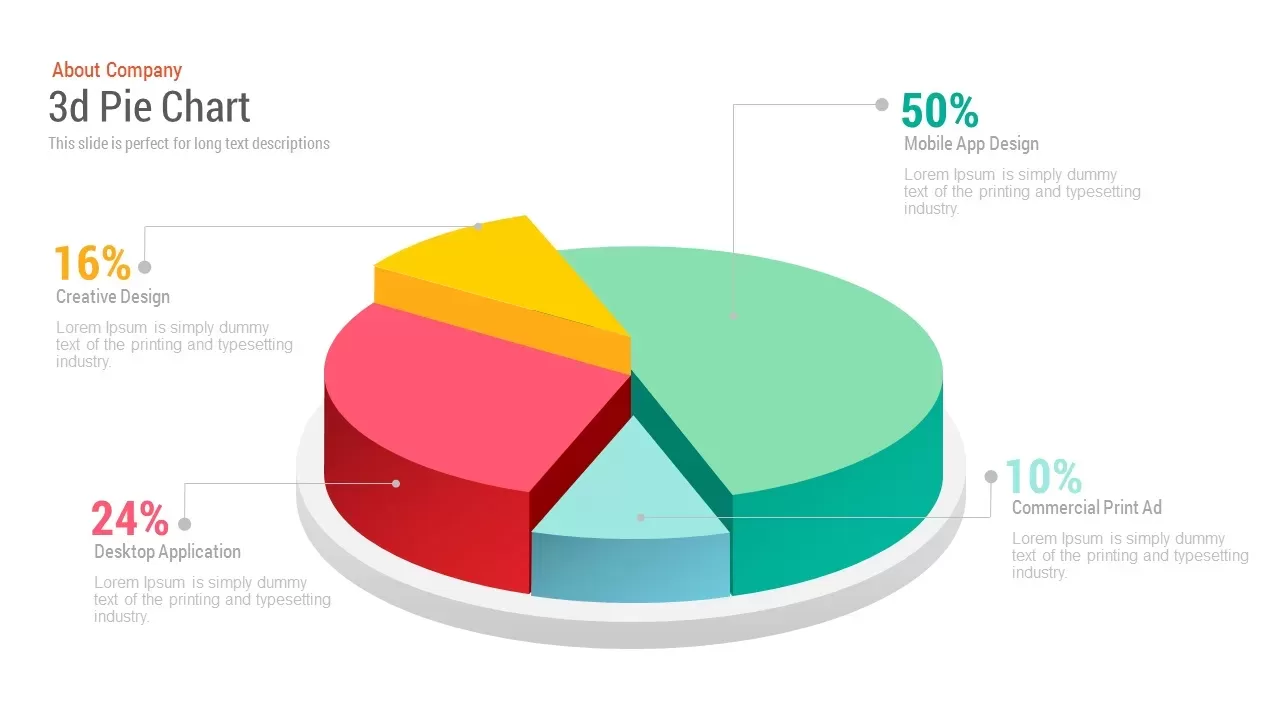
Multi-level donut chart template for powerpoint & keynote Slide can be used to demonstrate the application of complex data settings. Donut chart is functionally analogous to a pie chart, with exception of a blank centre and the ability to support multiple statistics at once. Donut charts show a healthier data concentration ratio because the empty centre can be used to display additional, related data. The donut chart emphasizes the use of an area with a percentage value. Diffidently colored arc divisions show the segmented distribution precisely and accurately and are also ideal to show proportions that highlight the differences between two or more values.
Donut chart powerpoint template provides elusive artistic rather focuses on the importance of the percentage data. Users can deliver sales reports with the help of this multi-level donut chart. Descriptive columns have ample space to show the percentage-wise distributions and proportions. This chart is available on two backgrounds and four text areas. Presenters can customize the beautiful clipart in accordance with the data they have. Sales managers, financial analysts, economic and social planners, demographers, geo-environmental scientists and other professionals who need statistical announcements can download and use this multi-level donut chart PowerPoint template & keynote slide
Multi-level donut chart contains two slides that you can use to display percentages and values. The template is designed in both PowerPoint and keynote version in 16:9 {widescreen} and 4:3{Normal} version. Users can search our charts and data’s collection to provide statistical presentations.
You can access and download more Free PowerPoint Templates here Grab the free ppt now!
Attached Files
| File |
|---|
| SB00038-Multi-level-Donut-Chart.zip |
Login to download this file
Add to favorites
Add to collection
-

Item ID
SB00038 -

Related Templates
-

Nature PowerPoint Presentation Template
PowerPoint Business Templates
Premium
-

Cab Service PowerPoint Template
PowerPoint Templates
Premium
-

Free Vertical PowerPoint Template
PowerPoint Business Templates
Free
-

Research Proposal PowerPoint Template
PowerPoint Templates
Premium
-

Sales Deck Free PowerPoint Template
PowerPoint Templates
Free
-

Free Nursing Capstone PowerPoint Deck
PowerPoint Templates
Free
-

VET Clinic PowerPoint Template
PowerPoint Templates
Premium
-

Free Space Minimal Deck Template
PowerPoint Templates
Free
-

Gym PowerPoint Template
PowerPoint Templates
Premium
-

Free Physical Education PowerPoint Template Deck
Free PowerPoint Templates
Free
-

Travel Agency PowerPoint Template
PowerPoint Templates
Premium
-

IoT Presentation Template
PowerPoint Templates
Premium
-

Effective Communication PowerPoint Template
PowerPoint Templates
Premium
-

PowerPoint Quiz With Timer
PowerPoint Templates
Premium
-
Split Representation Donut Chart Template for PowerPoint and Keynote
Keynote Templates
Premium
-
Donut Split Analysis Chart PowerPoint Template and Keynote Slide
Infographic
Premium
-
Donut Chart Performance PowerPoint Template and Keynote Slide
Pie & Donut
Premium
-
Comparison Donut Chart PowerPoint Template and Keynote
Keynote Templates
Premium
-

Graph Paper PowerPoint Template Deck
PowerPoint Templates
Premium
-

Free Economics PowerPoint Template
Free PowerPoint Templates
Free
-
Donut Chart Split Deep Dive Chart Template For PowerPoint and Keynote
Keynote Templates
Premium
-

Free Charity PowerPoint Template Deck
PowerPoint Templates
Free
-

Free Army PowerPoint Template
PowerPoint Templates
Free
-

Free Aviation PowerPoint Template
Free PowerPoint Templates
Free
-

Customer Experience Loyalty PowerPoint Deck Template
PowerPoint Templates
Premium
-
8 Section Donut Chart PowerPoint Template and Keynote Slide
Circular Diagrams
Premium
-

Macroeconomics PowerPoint Template
PowerPoint Templates
Premium
-

Free Cartoon PowerPoint Template
Free PowerPoint Templates
Free
-

Free Real Estate Listing PowerPoint Template
Free PowerPoint Templates
Free
-

Animated Agriculture PowerPoint Deck Template
PowerPoint Templates
Premium
-

Free Event Planning PowerPoint Template
Free PowerPoint Templates
Free
-

Free Book Review PowerPoint Template
Free PowerPoint Templates
Free
-

Free University Presentation PowerPoint Template
PowerPoint Templates
Free
-

Global Warming Infographic PowerPoint Template Deck
PowerPoint Templates
Premium
-

Annual Report PowerPoint Template and Keynote
PowerPoint Templates
Premium
-

EFQM Model PowerPoint Template
PowerPoint Templates
Premium
-

Free Dunder Mifflin Paper Company Pitch Deck
Free PowerPoint Templates
Free
-

Real Estate PowerPoint Theme
PowerPoint Themes
Premium
-
Multi-Level Marketing PowerPoint Template
PowerPoint Templates
Premium
-

Data Science PowerPoint Template
PowerPoint Templates
Premium
-

Business Process Reengineering Template
PowerPoint Templates
Premium
-
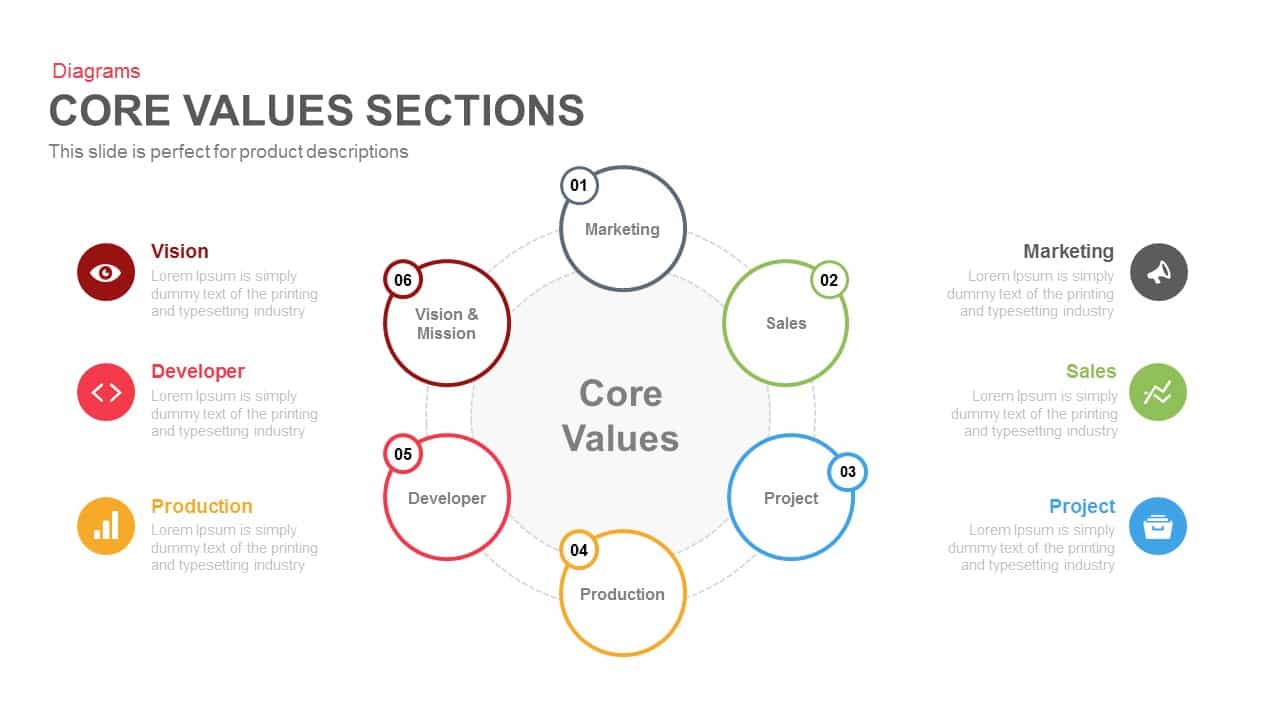
Core Values Sections PowerPoint Template and Keynote
Business Models
Premium
-

Free AI Artificial Intelligence PowerPoint Template
PowerPoint Templates
Free
-

Stakeholder Register PowerPoint Template
PowerPoint Templates
Premium
-

Animated Upcoming Event Poster PowerPoint Template
PowerPoint Templates
Premium
-
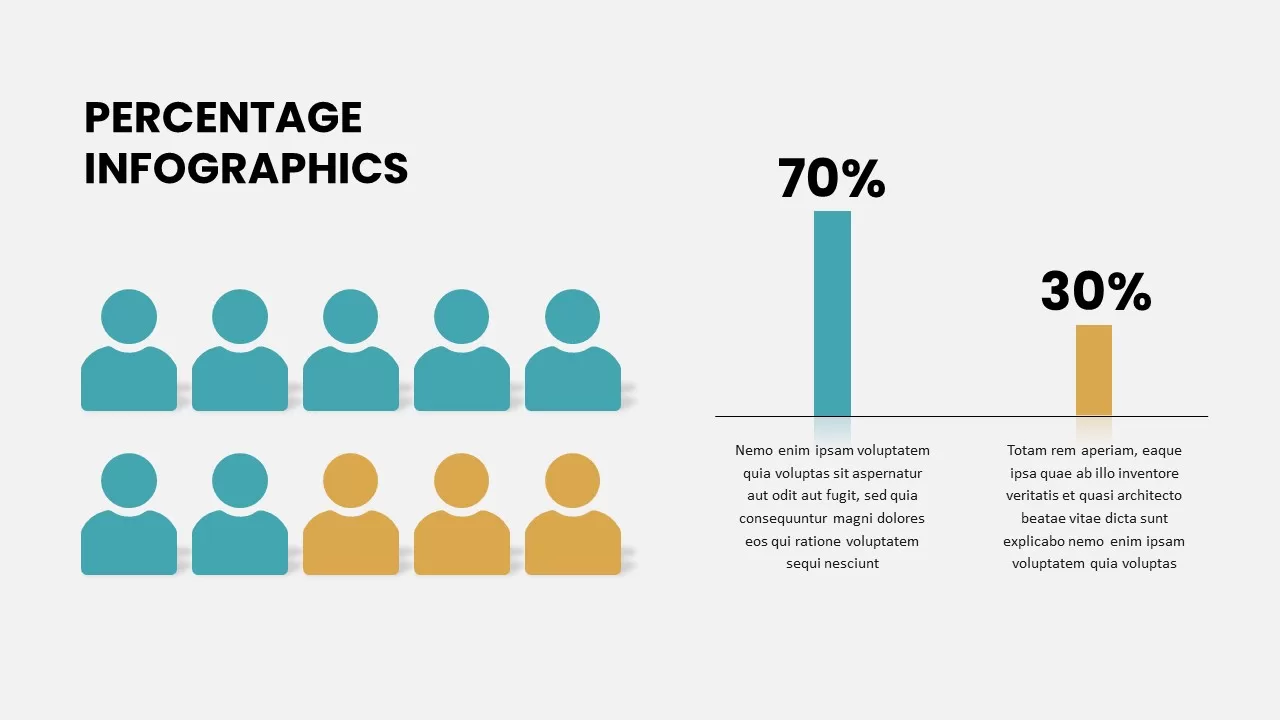
Percentage Infographic
Column and Bar chart
Premium
-

Creative Bar Chart Data Analysis PowerPoint Template and Keynote
Infographic
Premium
-

Open Door Policy PowerPoint Template
PowerPoint Templates
Premium
-
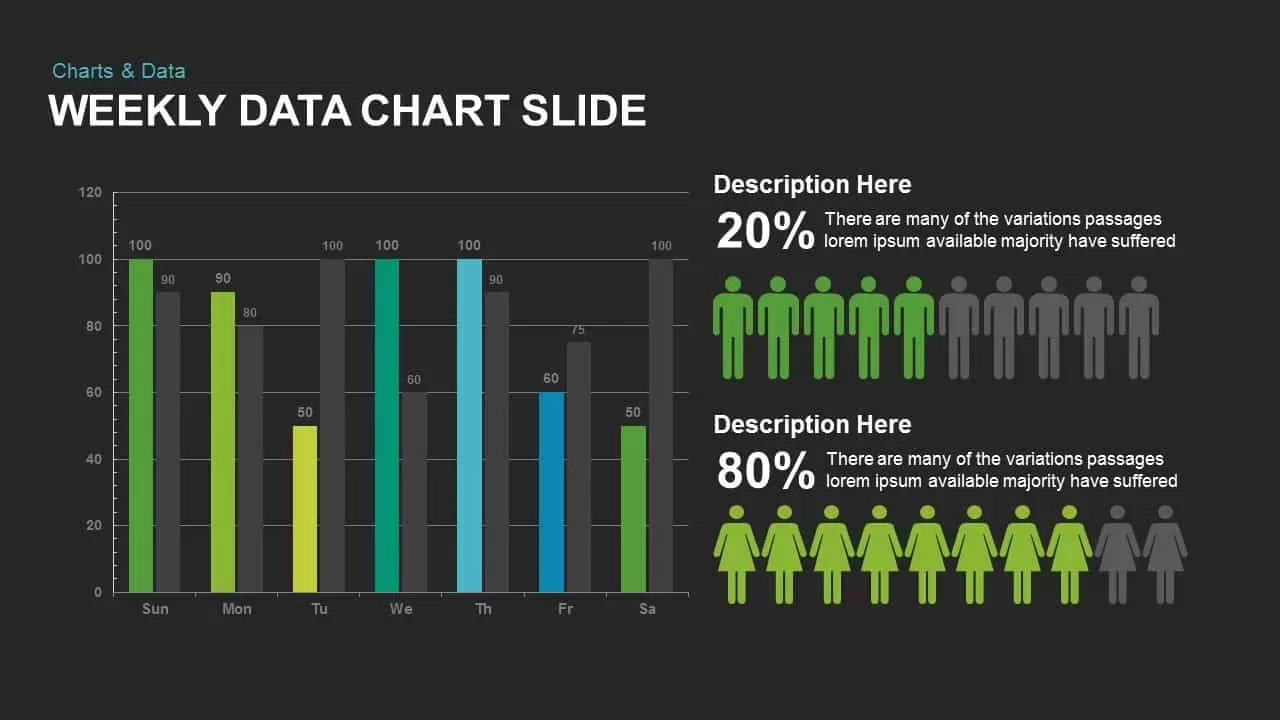
Weekly Data Charts PowerPoint Presentation Template and Keynote Slide
Infographic
Premium
-

Area Chart PowerPoint Template
PowerPoint Charts
Premium
-

Proportional Area Chart PowerPoint Template
PowerPoint Templates
Premium
-

Mekko Chart Template
PowerPoint Templates
Premium
-
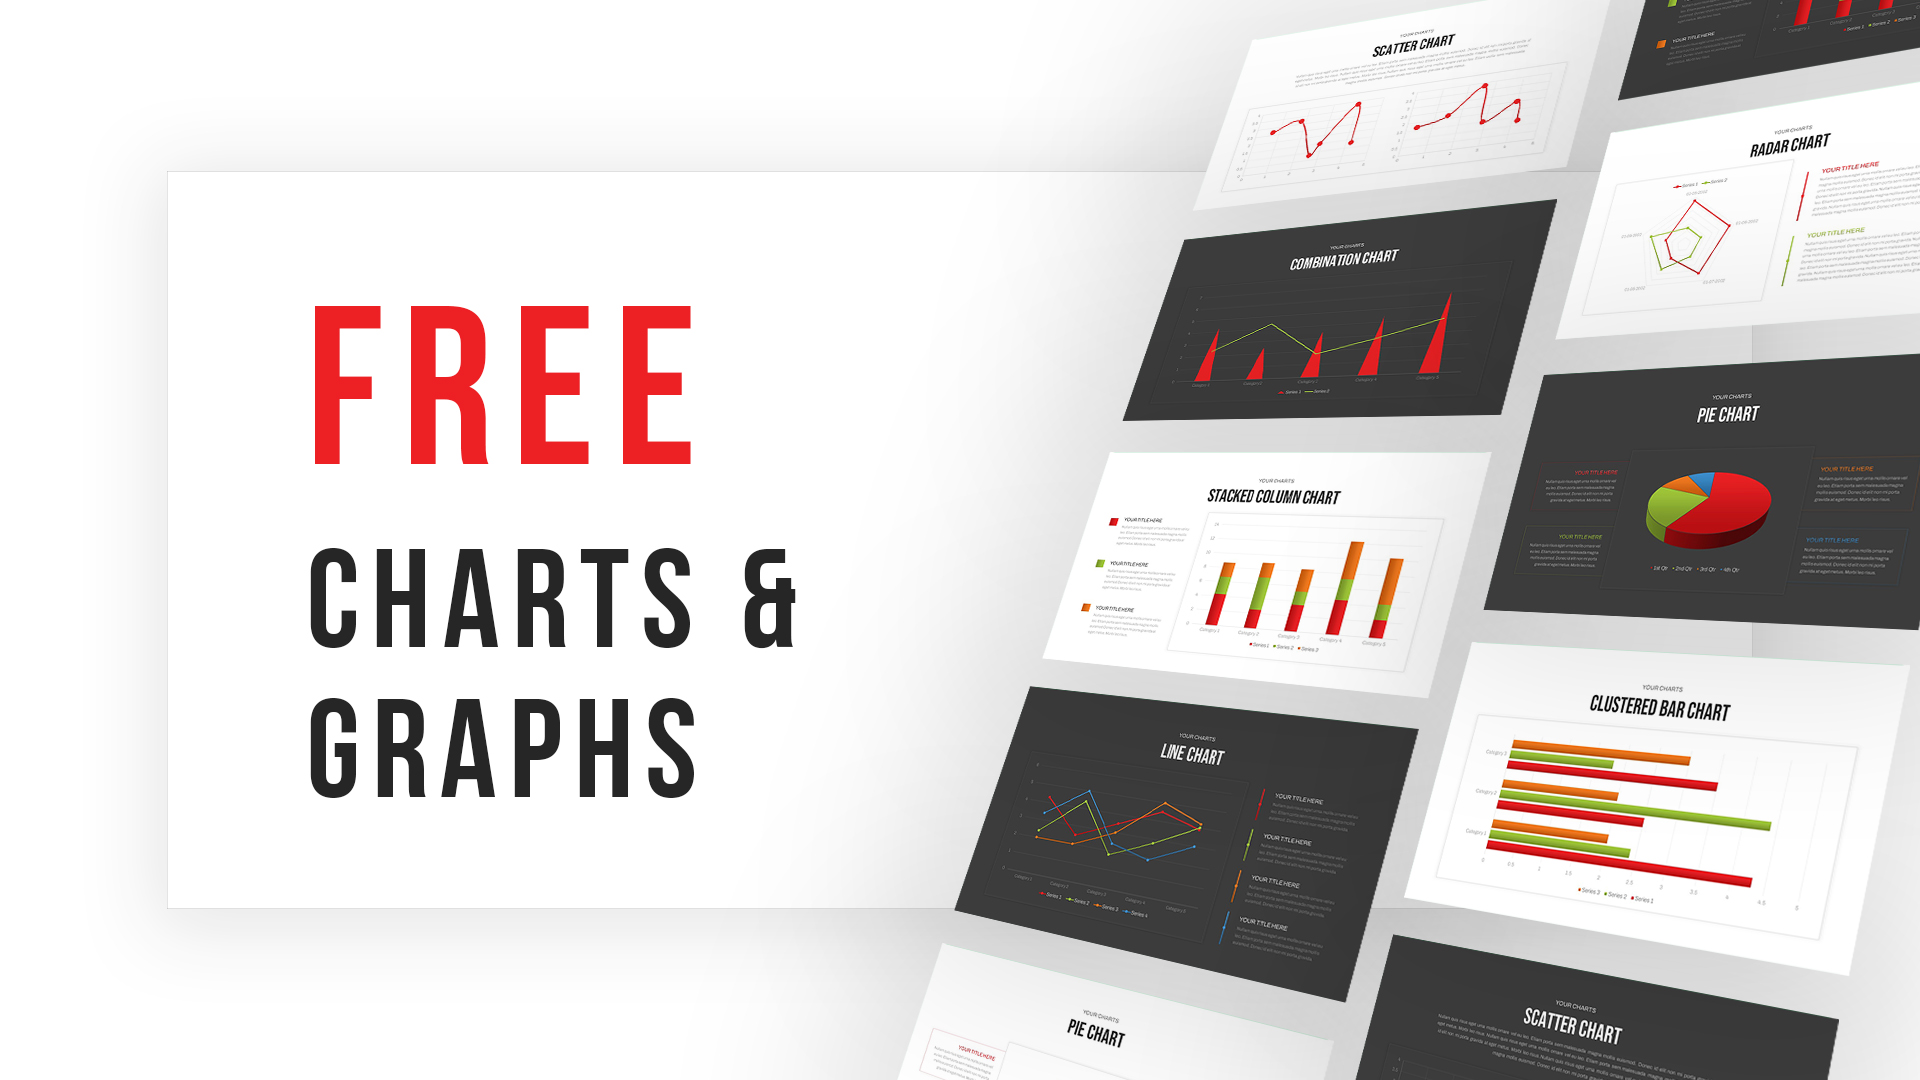
Free Charts & Graphs Deck PowerPoint Template
PowerPoint Templates
Free
-
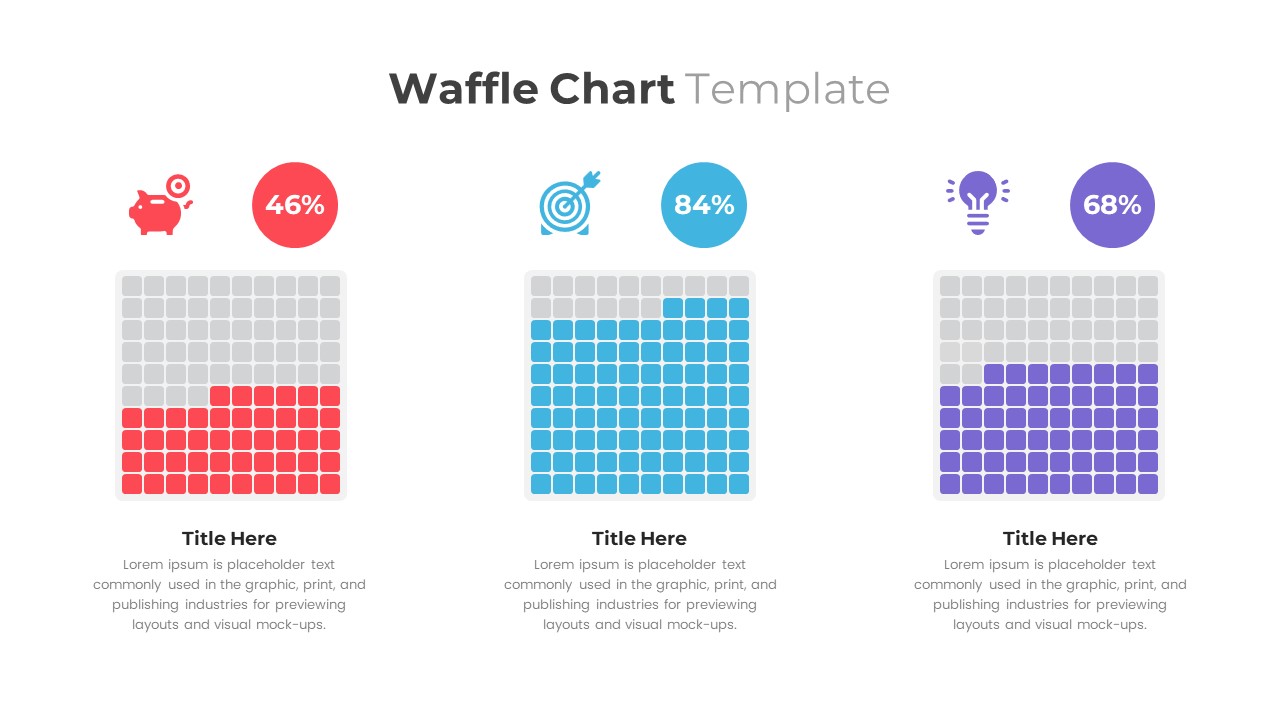
Waffle Chart PowerPoint Template
PowerPoint Templates
Premium
-

Power Analogy Metaphor PowerPoint Template
Metaphor, Simile & Analogy
Premium
-
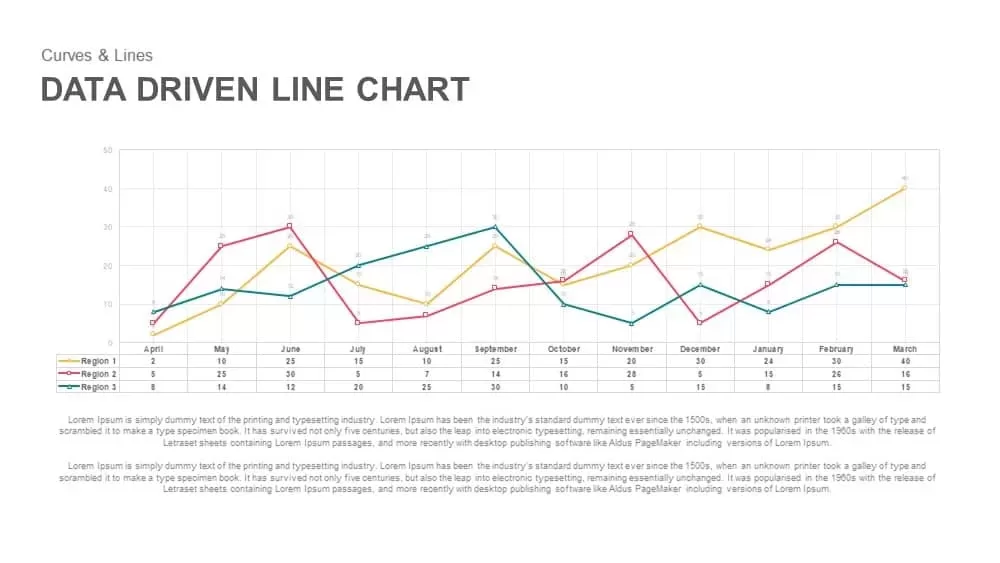
Data Driven Line Chart Template for PowerPoint & Keynote
Curves and Lines
Premium
-

Biotechnology PowerPoint Presentation Template
PowerPoint Templates
Premium
-

Free Charts and Graphs PowerPoint Template
PowerPoint Templates
Free
-
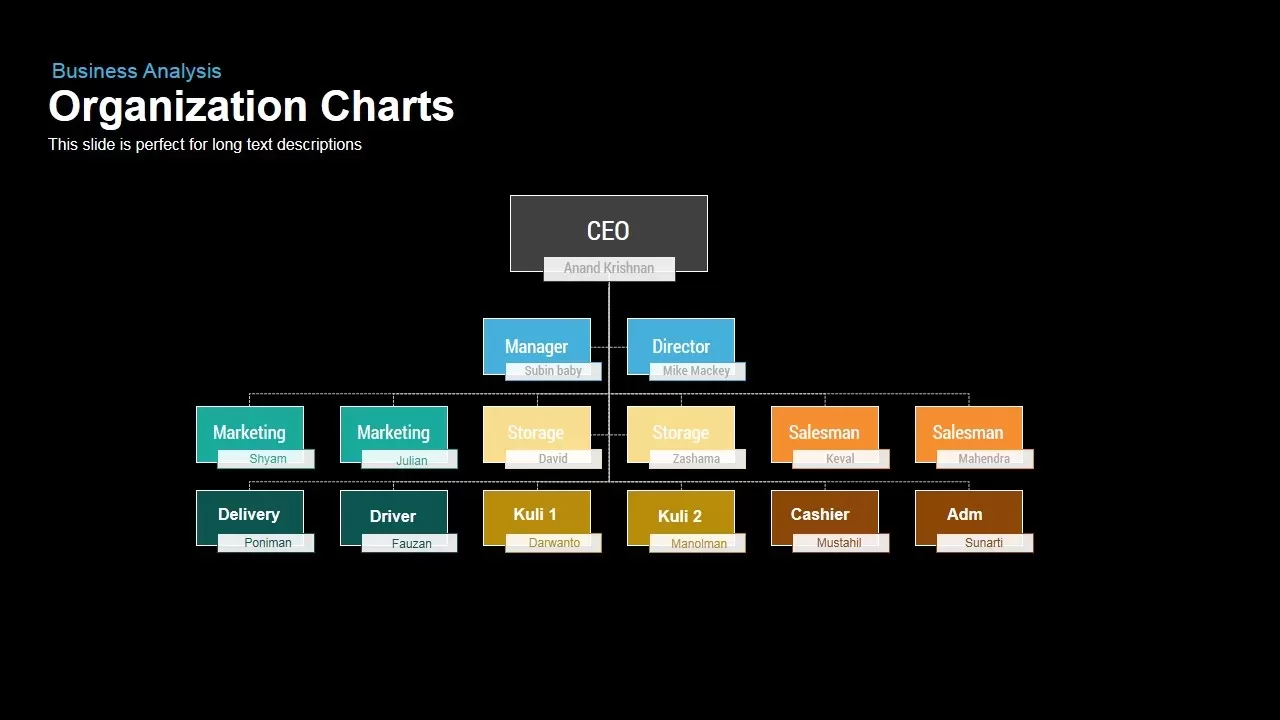
Organization Chart PowerPoint Template and Keynote slide
Org Charts
Premium
-
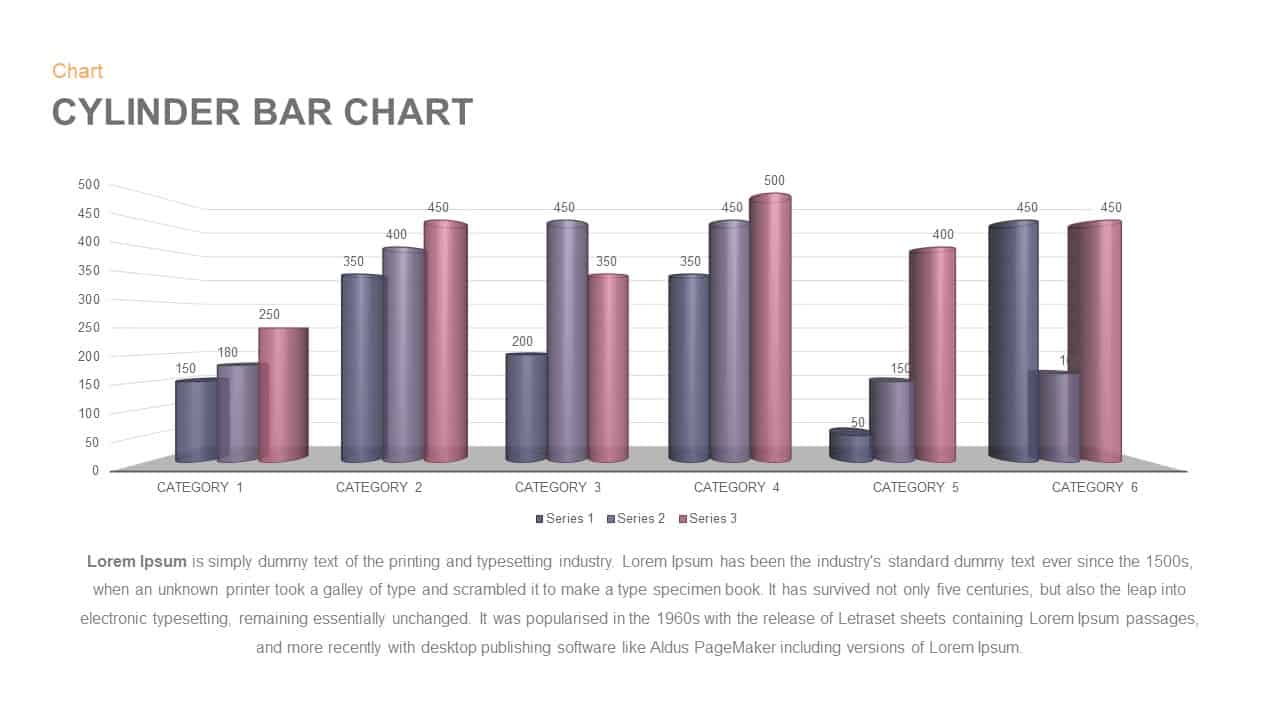
Cylinder Bar Chart PowerPoint Template and Keynote Slide
Column and Bar chart
Premium
-

Combination Chart PowerPoint Template
PowerPoint Charts
Premium
-
4 Step Core Values PowerPoint Template
Business Models
Premium
-

Radial Bar Chart PowerPoint Templates and Keynote Slides
PowerPoint Charts
Premium
-
Sun Burst Chart PowerPoint Template
Circular Diagrams
Premium
-
Data Over Time Line Chart PowerPoint Template
PowerPoint Charts
Premium
-
Business Growth Chart Template for PowerPoint and Keynote
Business Models
Premium
-
Progress Chart PowerPoint Template
PowerPoint Templates
Premium
-
Waterfall Bar Chart PowerPoint Template
PowerPoint Charts
Premium
-
Free 3d Pie Chart PowerPoint Template & Keynote slide
Pie & Donut
Free
-
High Level Timeline PowerPoint Template
Timeline PowerPoint Template
Premium
-

Doodle Multi Presentation Template
PowerPoint Business Templates
Premium
-
Set of Chart PowerPoint Template and Keynote Diagram
PowerPoint Charts
Premium
-

Finance Consulting PowerPoint Template
PowerPoint Templates
Premium
-
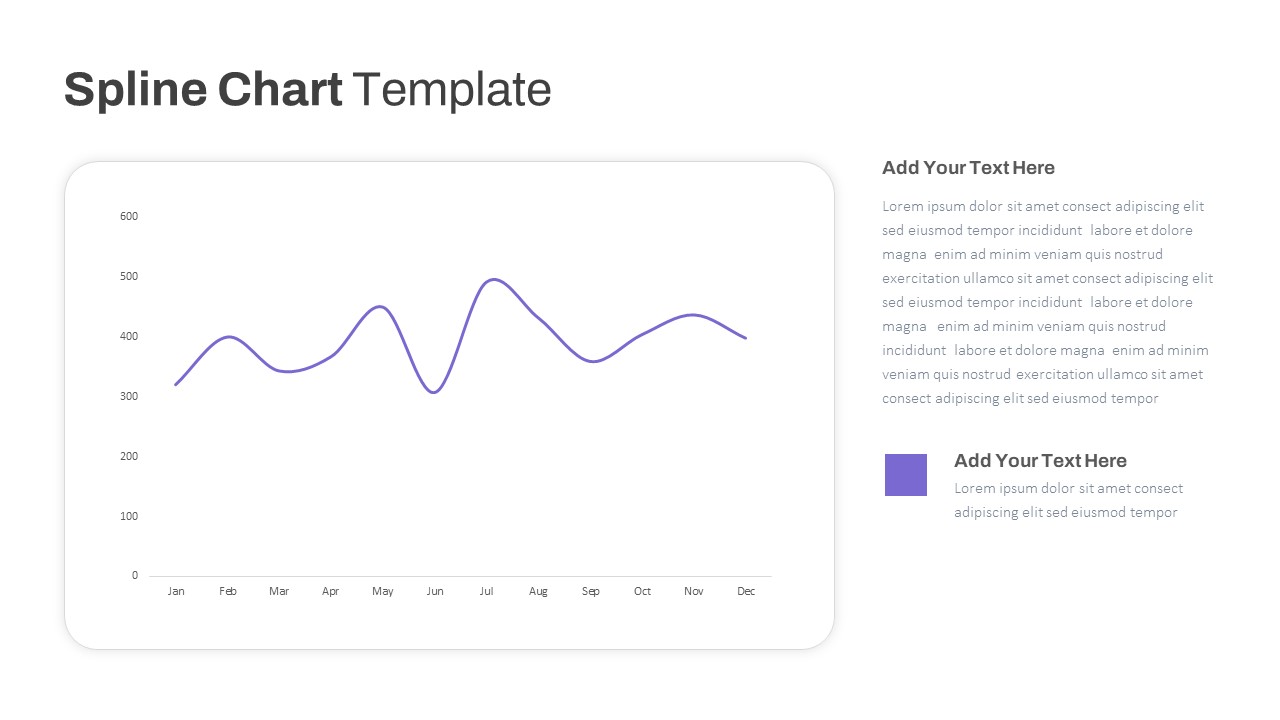
Spline Chart PowerPoint Template
PowerPoint Charts
Premium
-

Clustered Column Chart PowerPoint Template
PowerPoint Charts
Premium
-
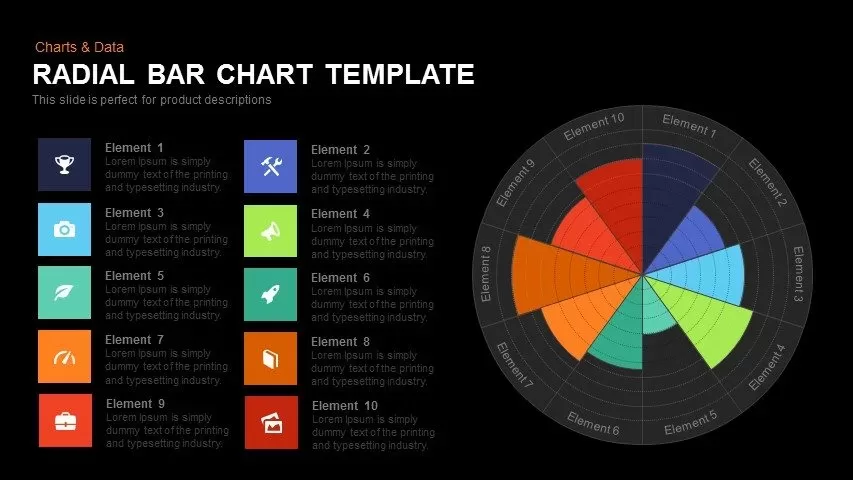
Radial Bar Chart Template for PowerPoint and Keynote
Circular Diagrams
Premium
-
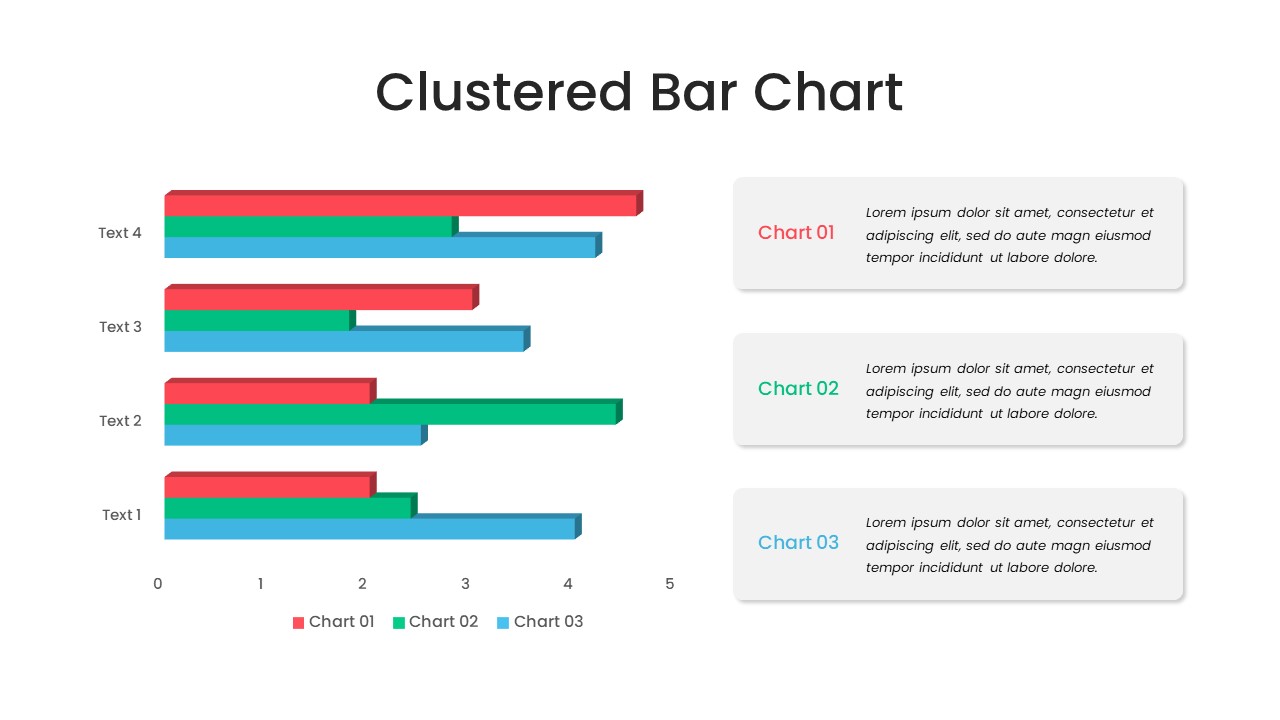
Clustered Bar Chart PowerPoint Template
Column and Bar chart
Premium
-
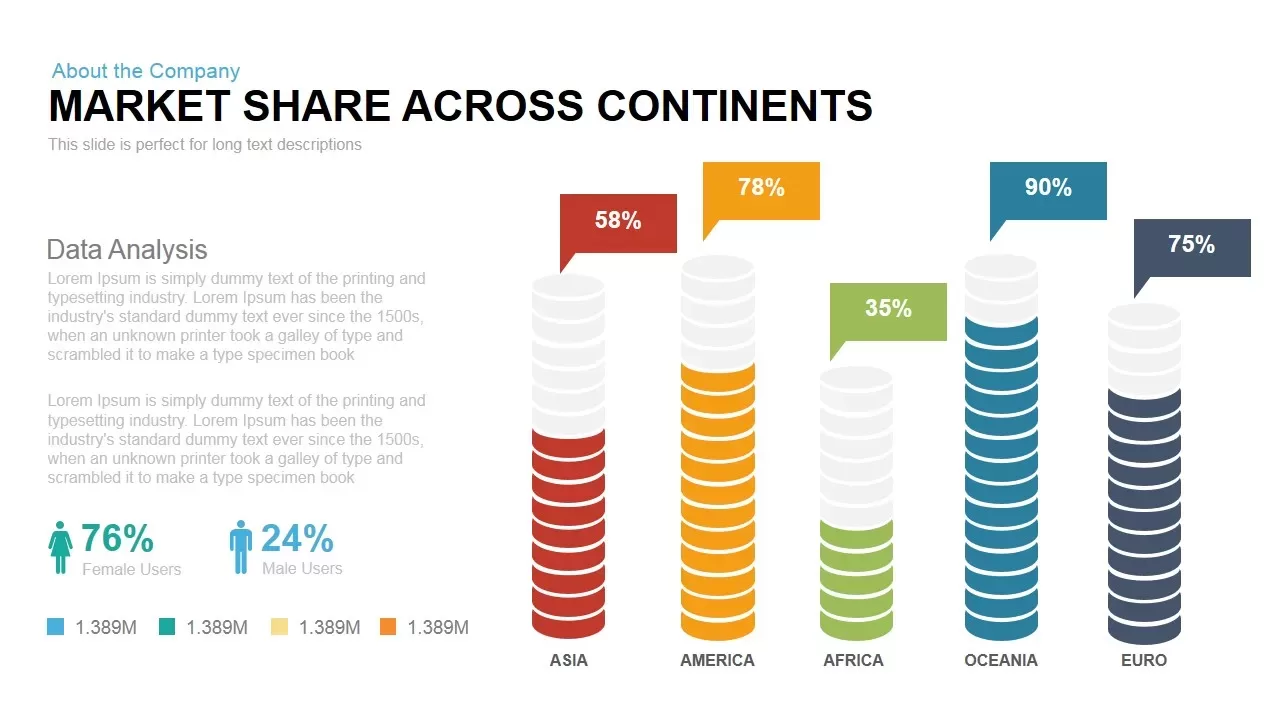
Market Share across Continents PowerPoint & Keynote template
Diagrams
Premium
-
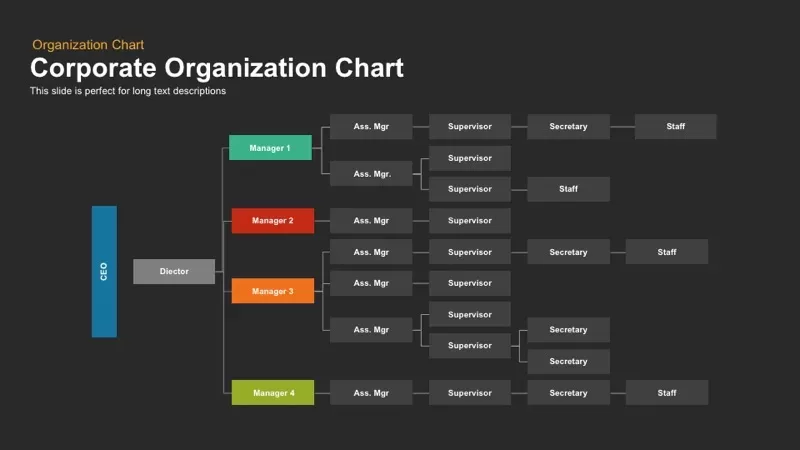
Corporate Organization Chart PowerPoint Template
Org Charts
Premium
-
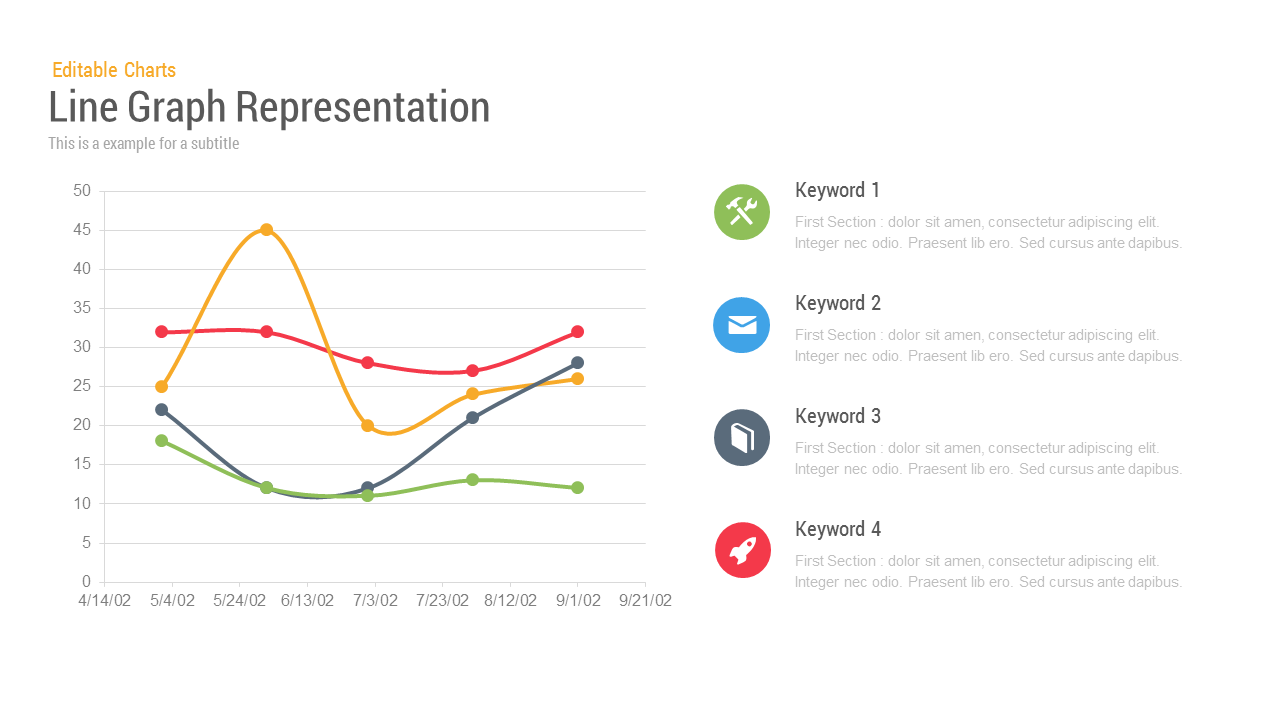
Line Chart Representation PowerPoint Templates and Keynote Slides
PowerPoint Charts
Premium
-
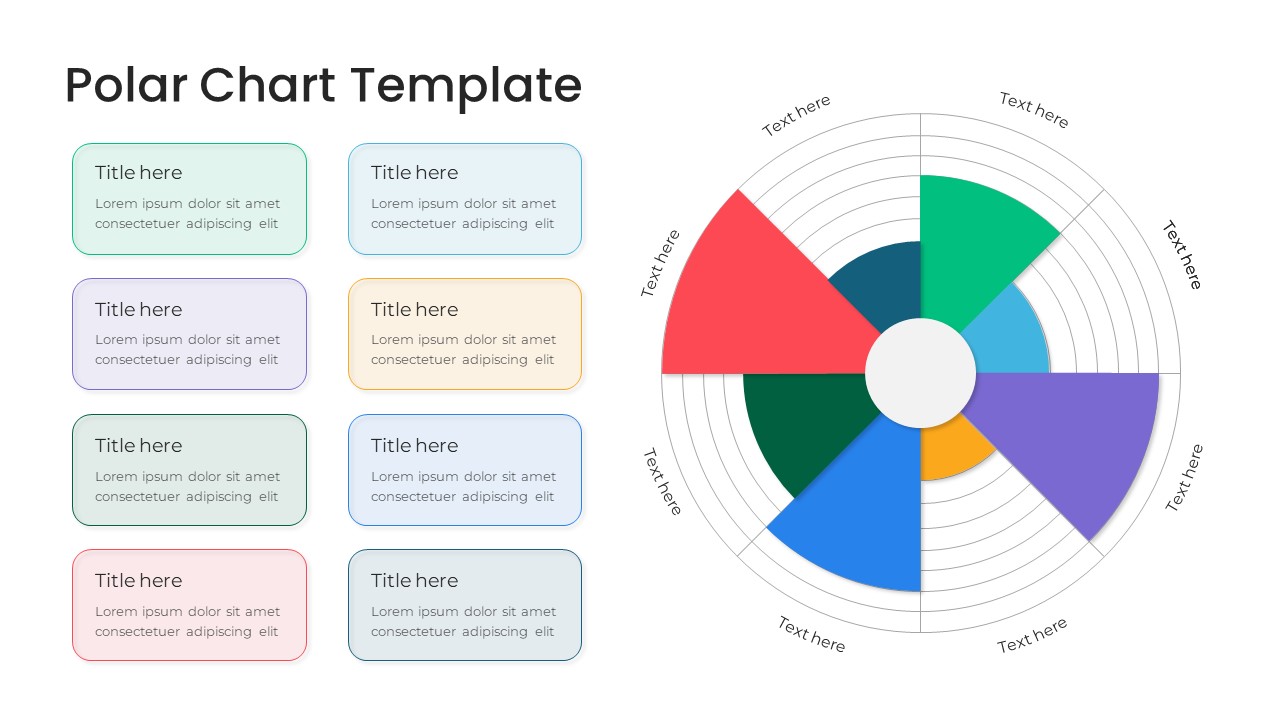
Polar Chart PowerPoint Template
PowerPoint Templates
Premium
-

Free Teacher’s Week Plan PowerPoint Template
PowerPoint Templates
Free
-
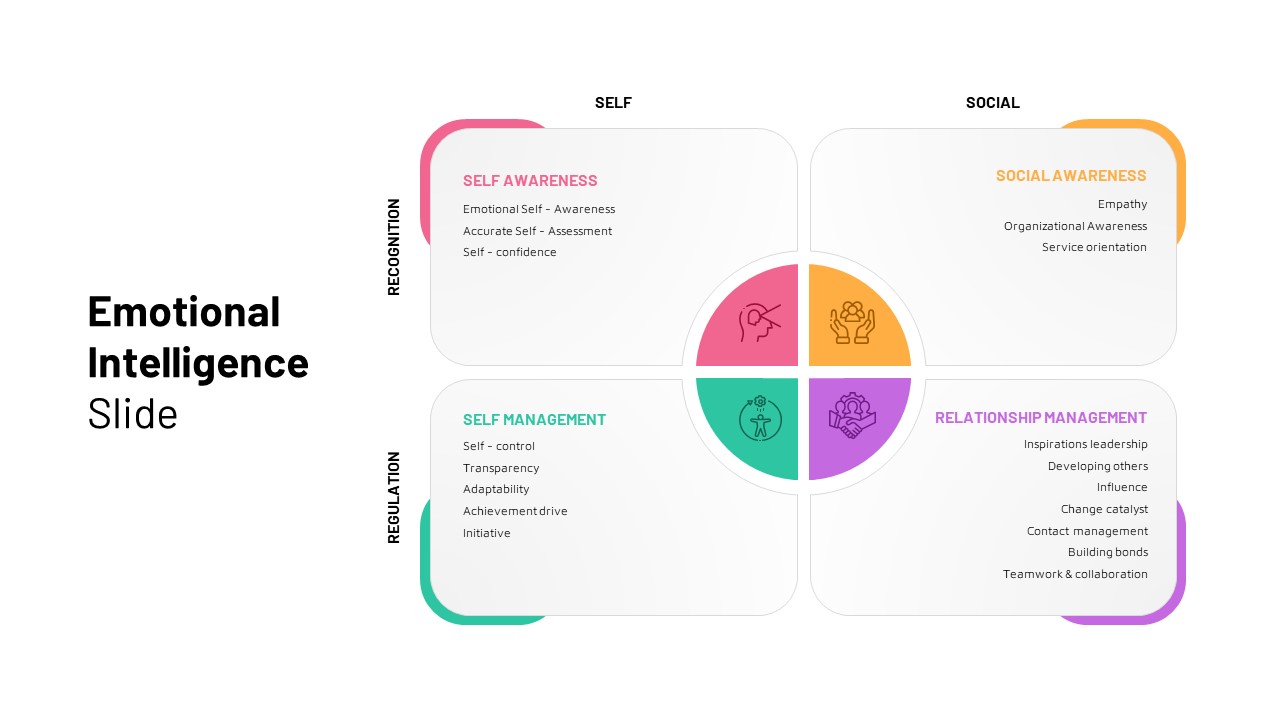
Emotional Intelligence Slide
PowerPoint Templates
Premium
-
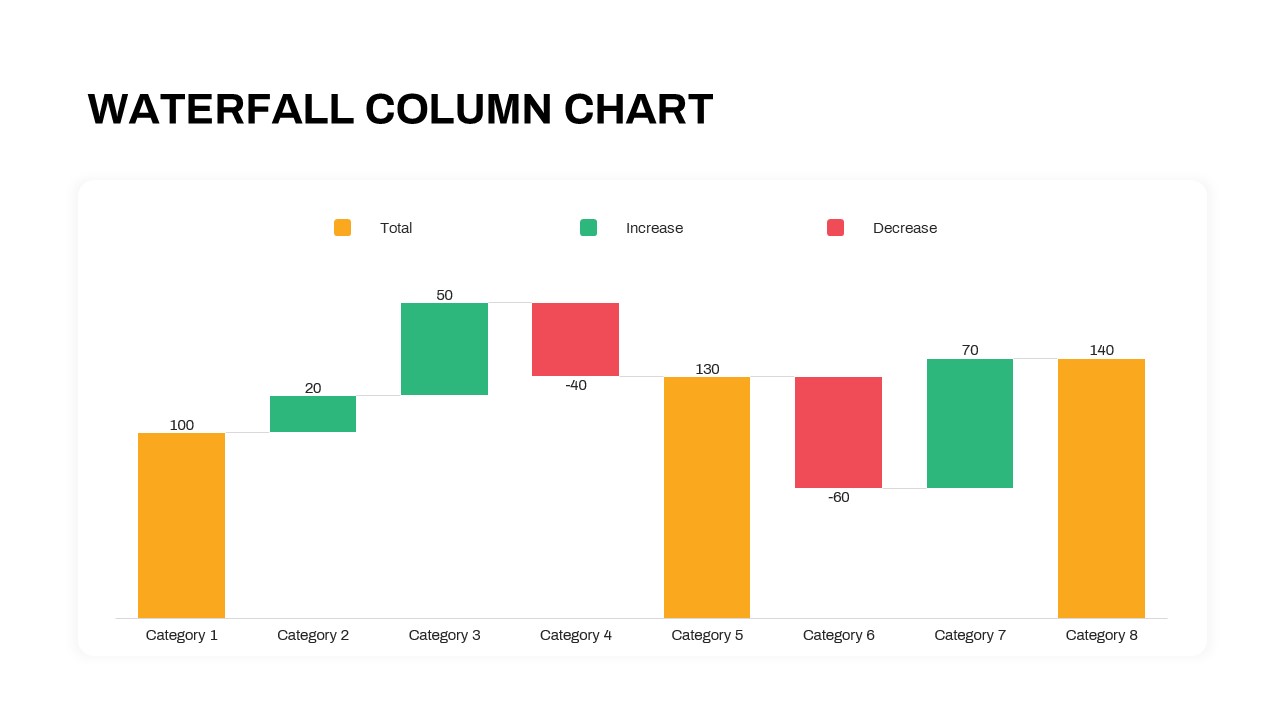
Waterfall Column Chart PowerPoint Template
Column and Bar chart
Premium
-
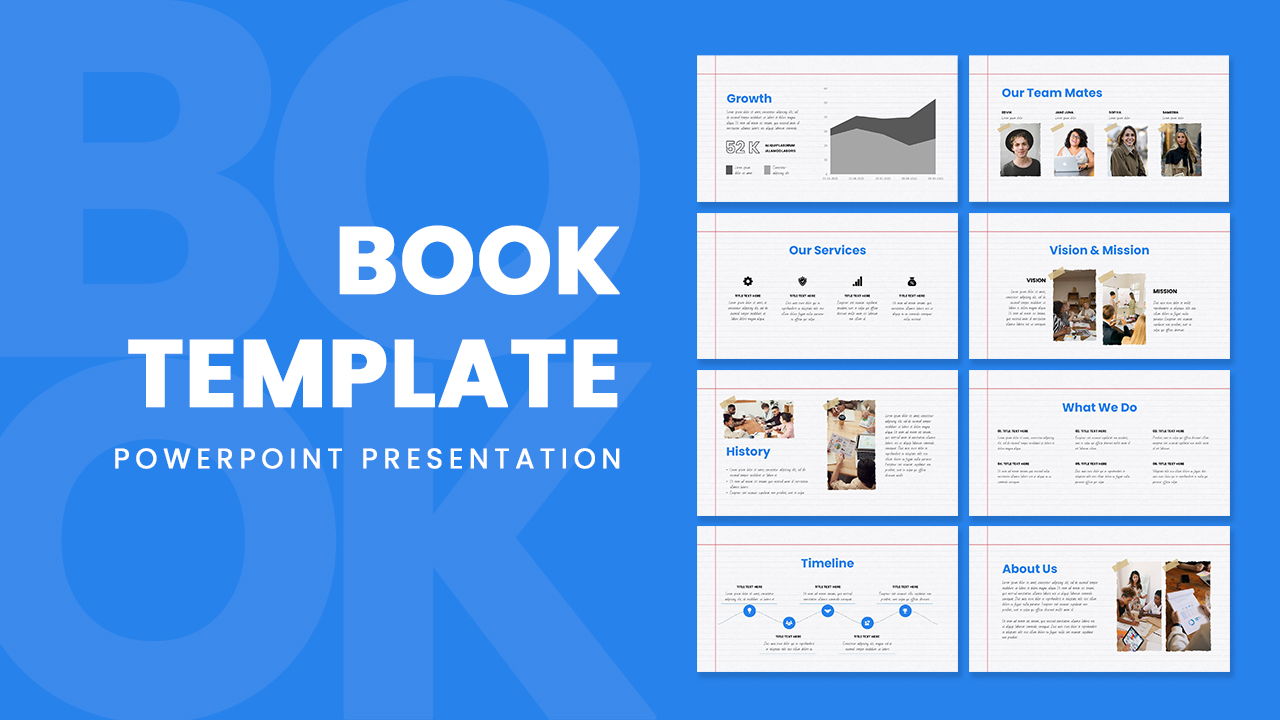
Free PowerPoint Book Template
Free slides
Free
-
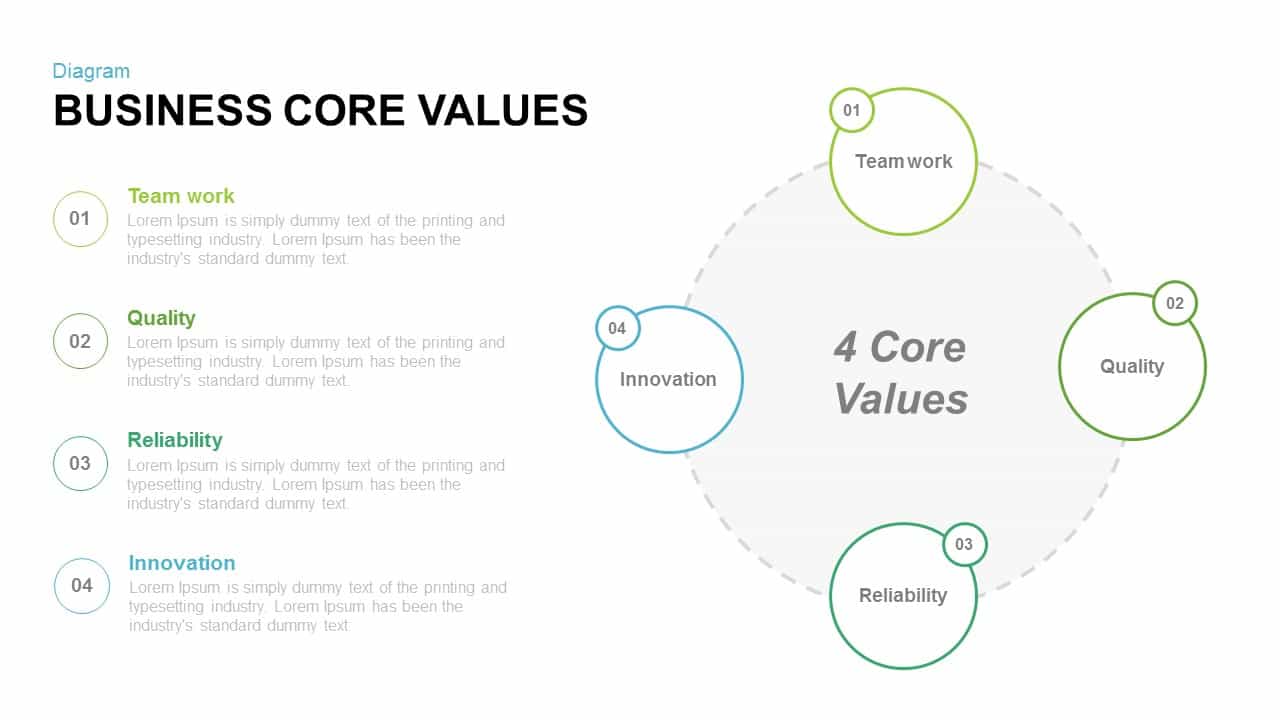
Business Core Values PowerPoint and Keynote template
Business Models
Premium
-
Data Strategy Roadmap PowerPoint Template
PowerPoint Templates
Premium
-
Flow Chart PowerPoint Template and Keynote Presentation
Flow Charts
Premium
-

Pencil Bar Chart PowerPoint Template and Keynote Slide
Column and Bar chart
Premium
-
Four Quadrant Scatter Chart PowerPoint Template
PowerPoint Charts
Premium
-
Creative Bar Chart Analysis PowerPoint Template and Keynote
Column and Bar chart
Premium
-
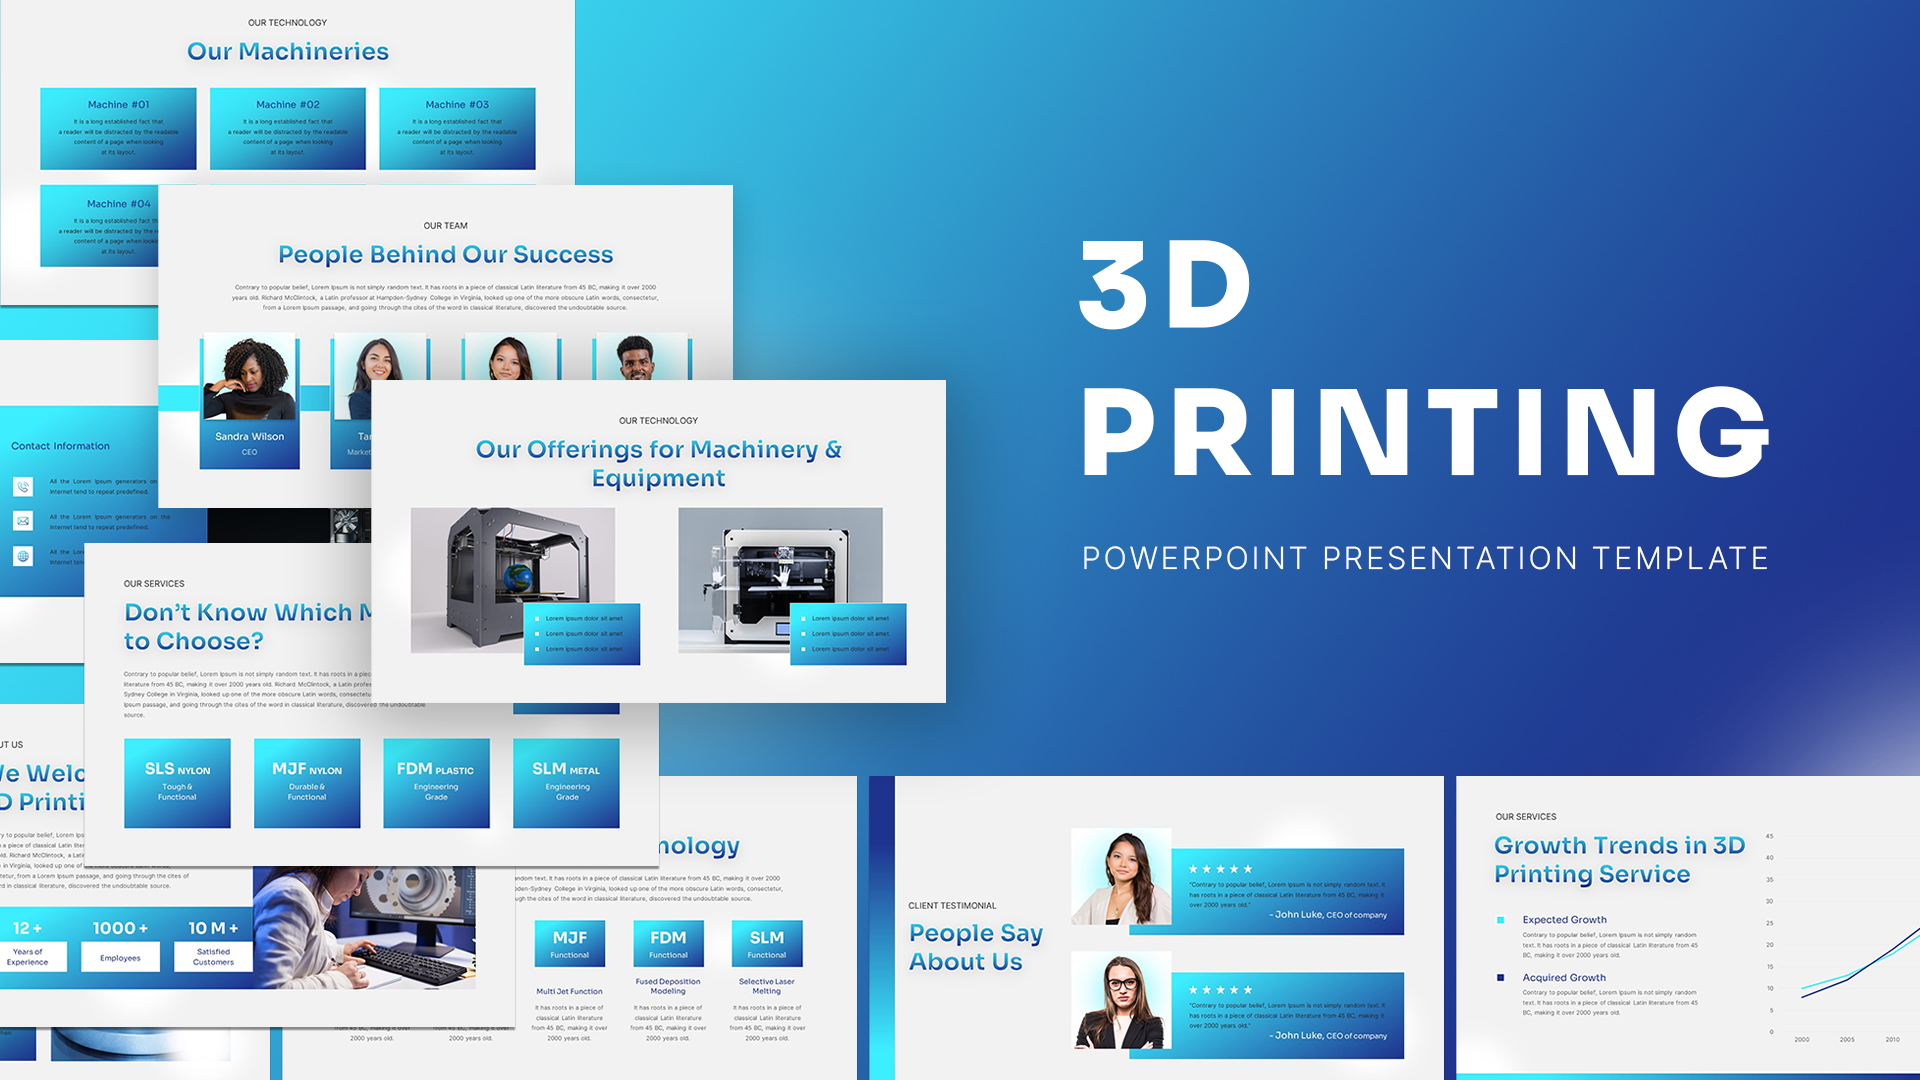
3D Printing Deck PowerPoint Template
PowerPoint Templates
Premium
-
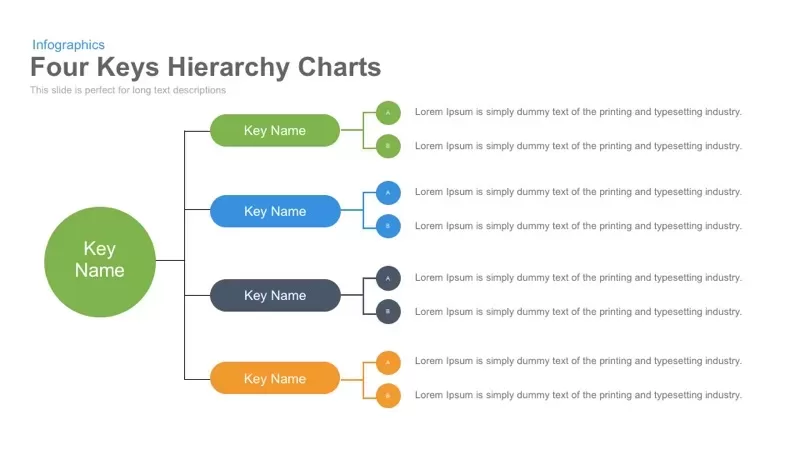
Four Keys Hierarchy Chart PowerPoint Template and Keynote Slide
Flow Charts
Premium
-
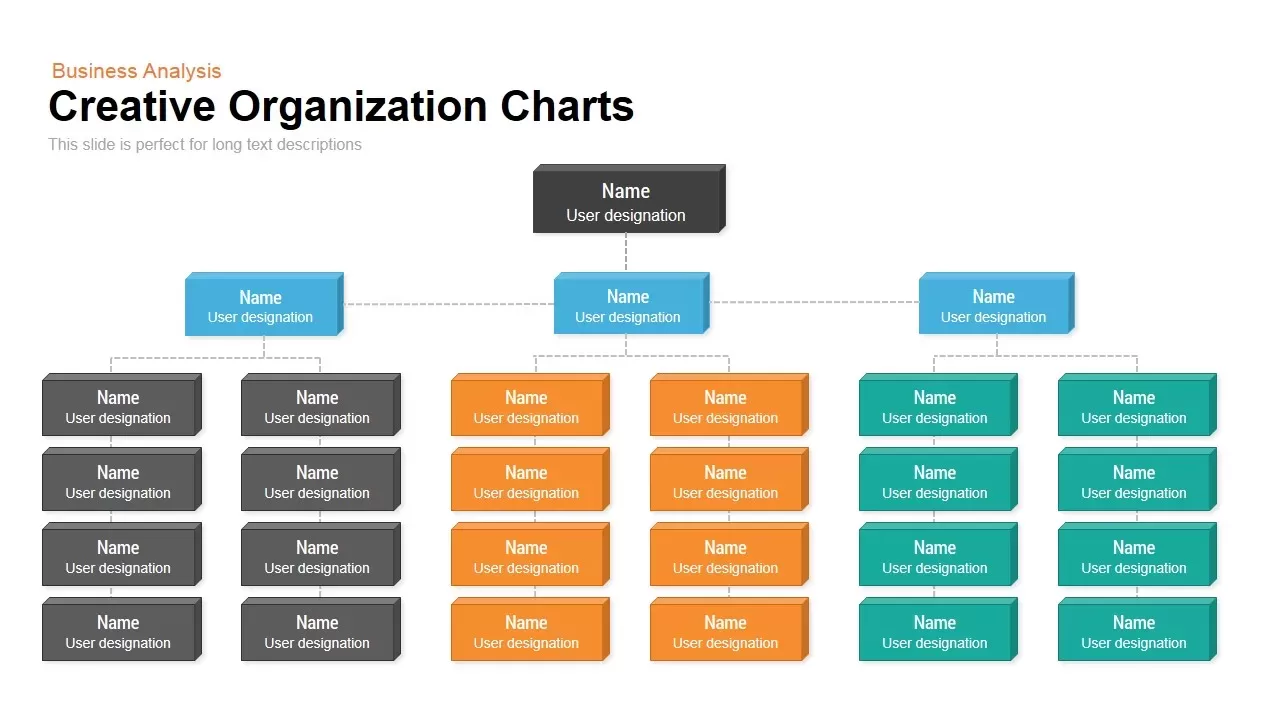
Creative Organization Chart Template for PowerPoint & Keynote
Org Charts
Premium
-
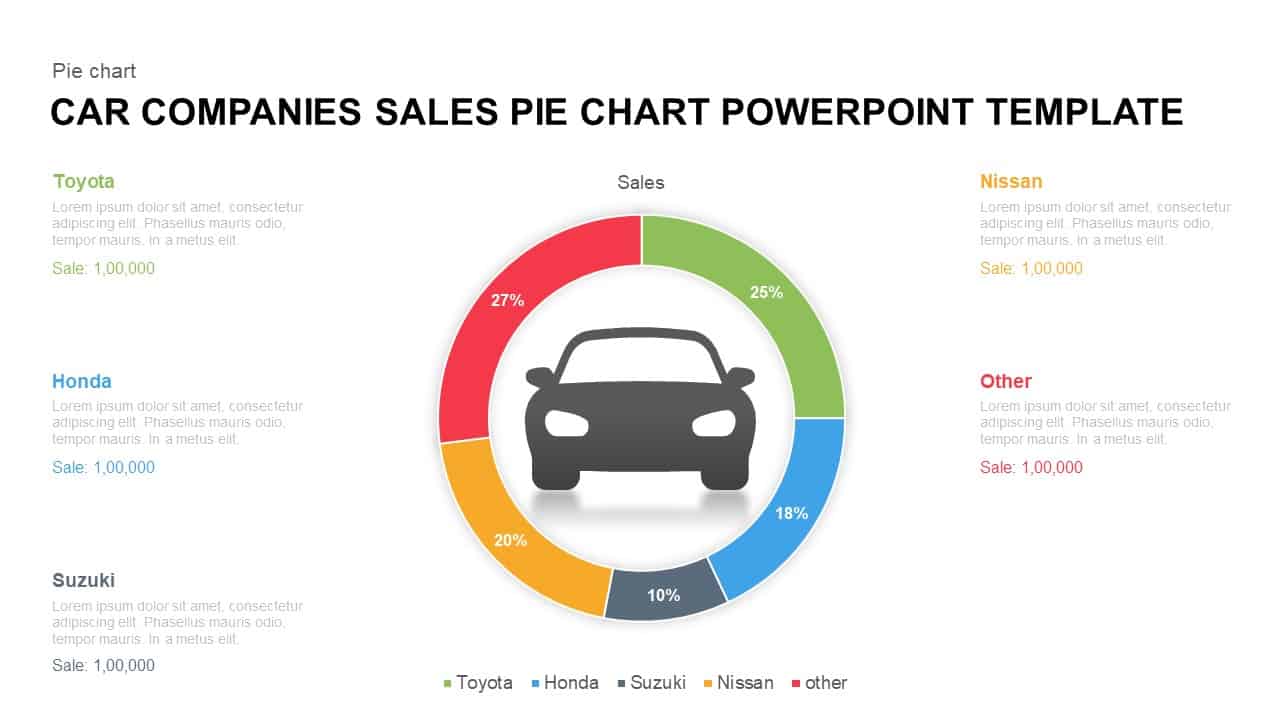
Car Companies Sales Pie Chart Template for PowerPoint & Keynote
Column and Bar chart
Premium
-
Data Analytics Chart PowerPoint Template and Keynote Slide
Diagrams
Premium
-

Cyber Monday PowerPoint Template
PowerPoint Business Templates
Premium
-
Org Chart PowerPoint Presentation Template
PowerPoint Charts
Premium
-

Animated Clustered Bar Chart PowerPoint Template
PowerPoint Charts
Premium
-

Multipurpose Business PowerPoint Template
PowerPoint Business Templates
Premium