


Data Over Time Line Chart PowerPoint Template

- Version
- Download 12
- File Size 0.00 KB
- File Count 1
- Create Date July 11, 2023
- Last Updated July 10, 2023
Data Over Time Line Chart PowerPoint Template
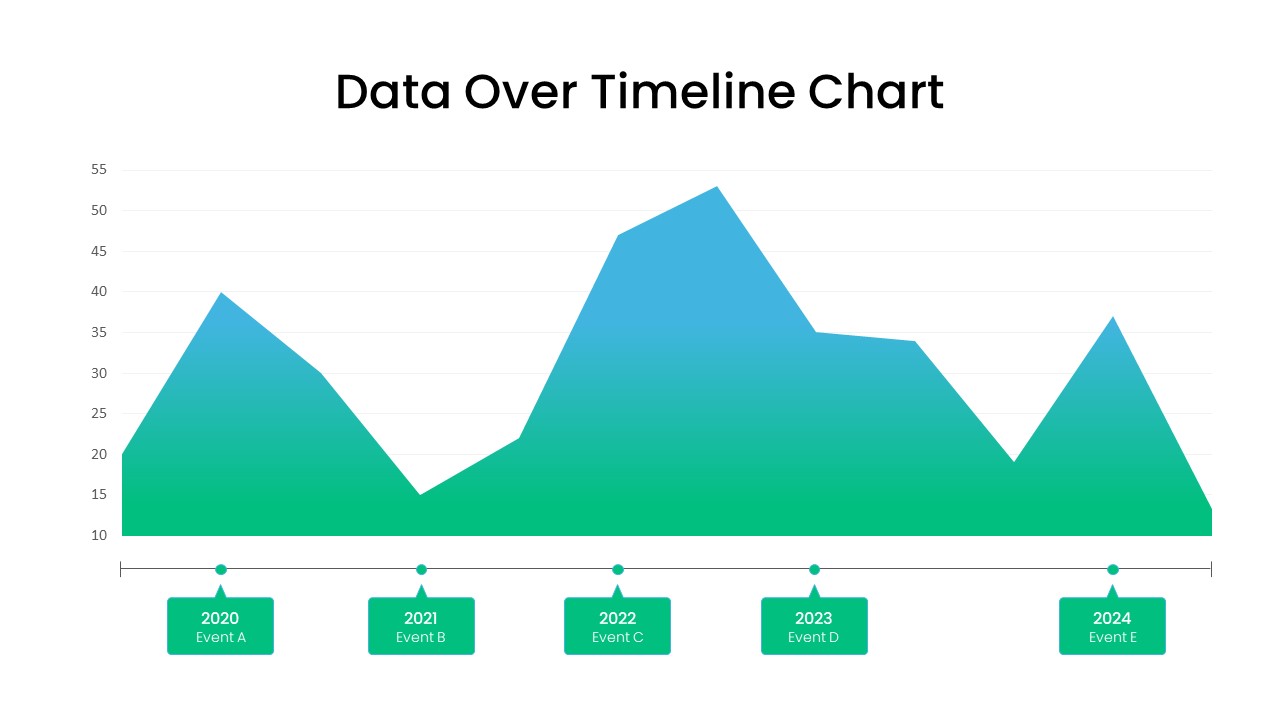
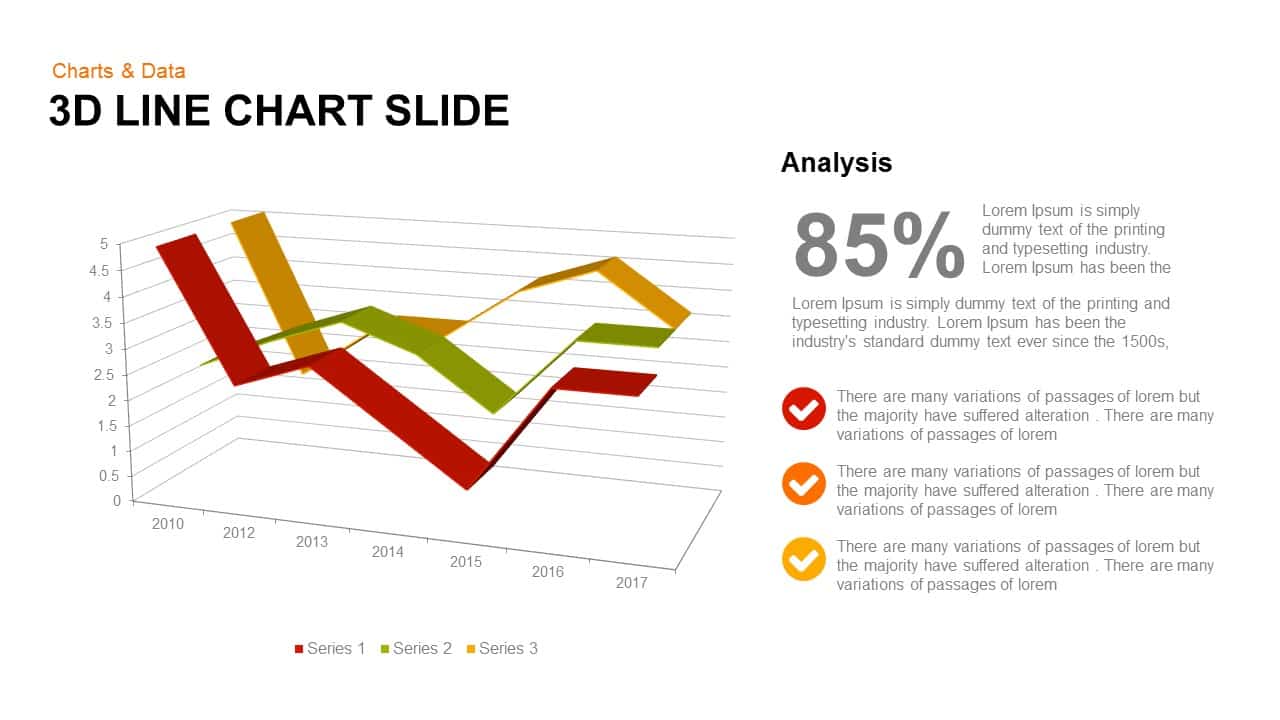
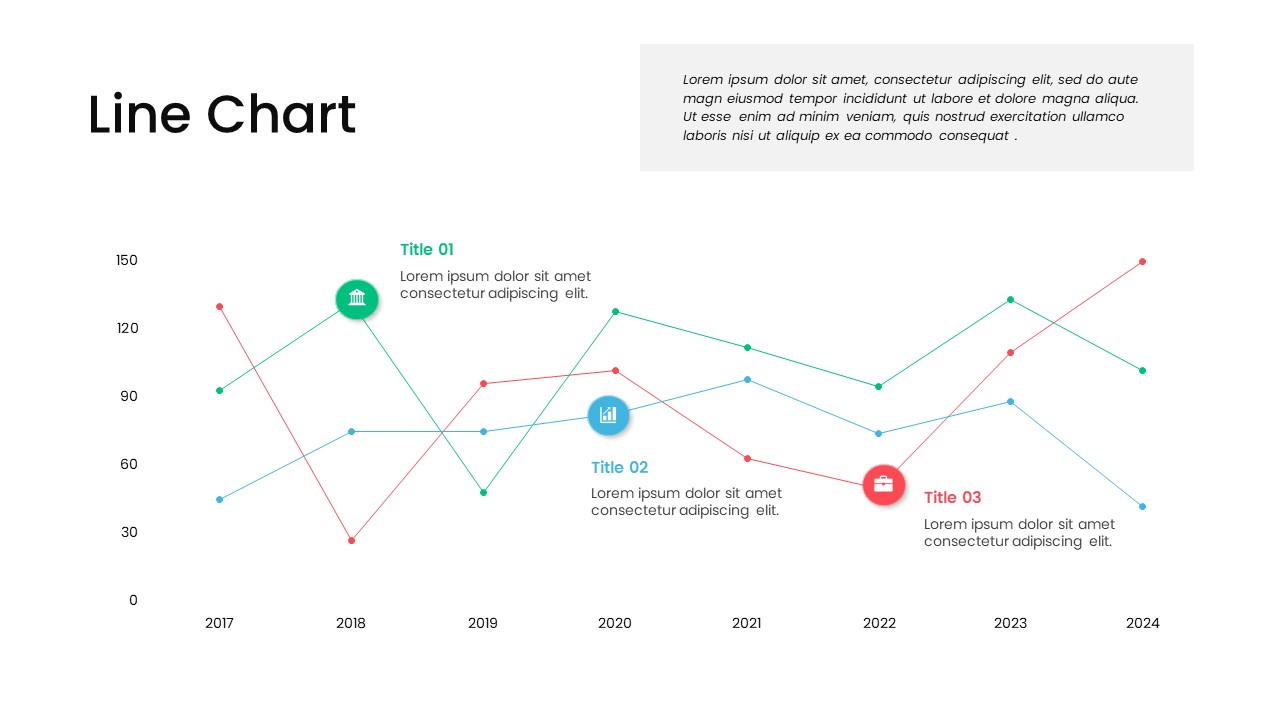
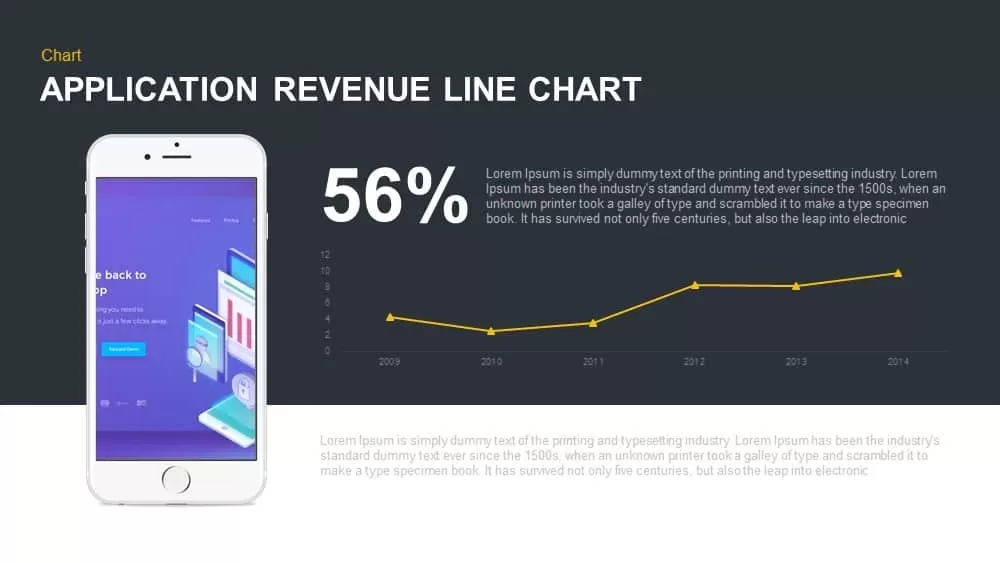
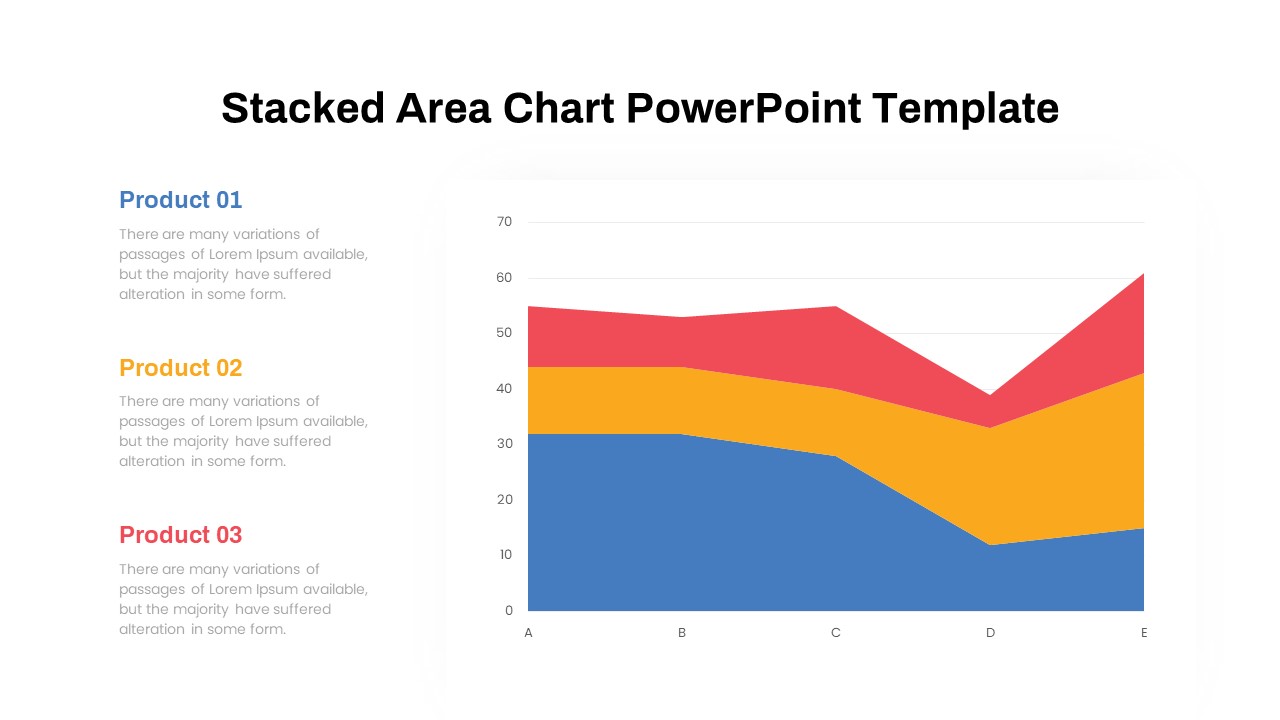
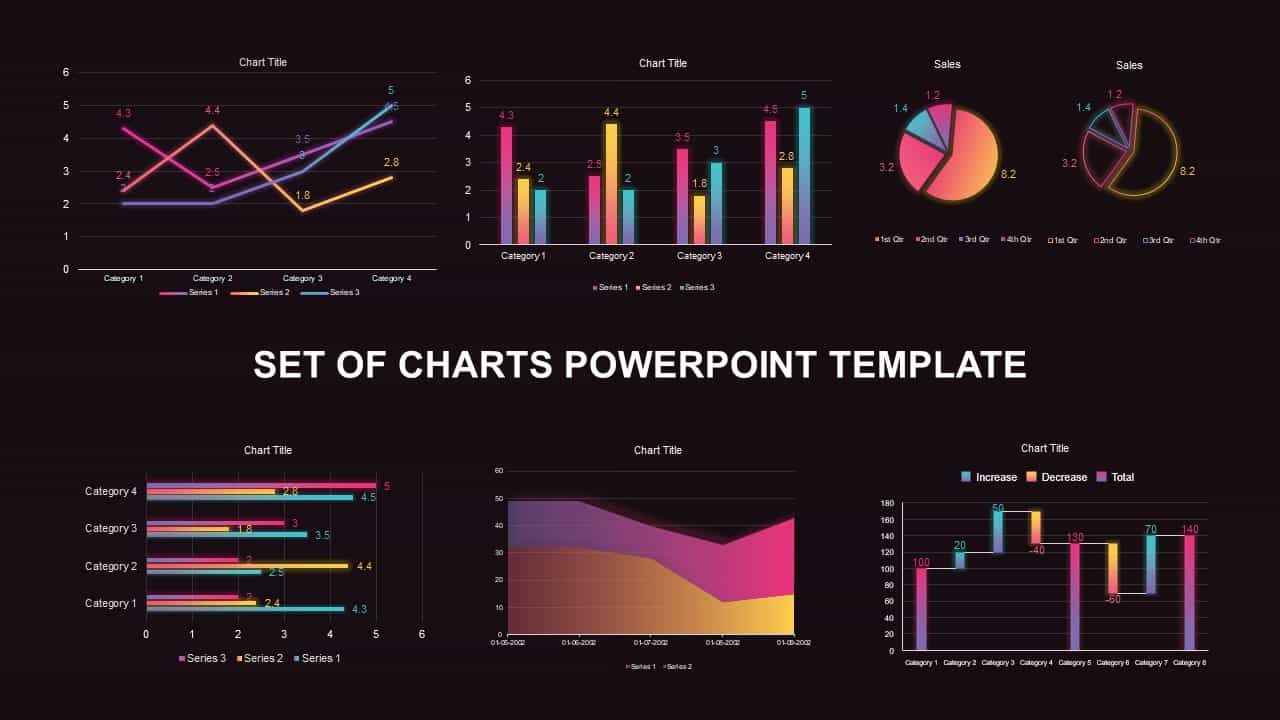
The Line Chart PowerPoint Template for Time-based Data Visualization is the best PowerPoint chart to show trends over time. This chart combines the characteristics of a line graph and an area chart, using vibrant colors to enhance its visual appeal. It is particularly useful for researchers and professionals as it allows for easy updates of statistical values. Unlike a simple line graph, this chart resembles an area graph, capturing the audience's attention and ensuring a clear understanding of the data points. Its purpose is to showcase a range of potential future values based on past trends. These charts are ideal for presenting business reports, sales figures, market trends, and linear movements. When shown in a PowerPoint timeline chart, the audience can easily understand fluctuations in business.
The Line Chart PowerPoint Template for Time-based Data Visualization is useful for project forecasting reports. The crystal-clear appearance and green color mix is one of the key highlights of the data chart in PowerPoint. It helps present financial outcomes, and the uncertainty has been clutching over time. The chart looks like a mountain with ups and downs and is perfect for delivering how the market has moved over the years. The presenters can show the numerical values on the Y-axis. The X-axis will establish the chronology of the timeline chart. The presenters can use the bottom boxes to present events over time.
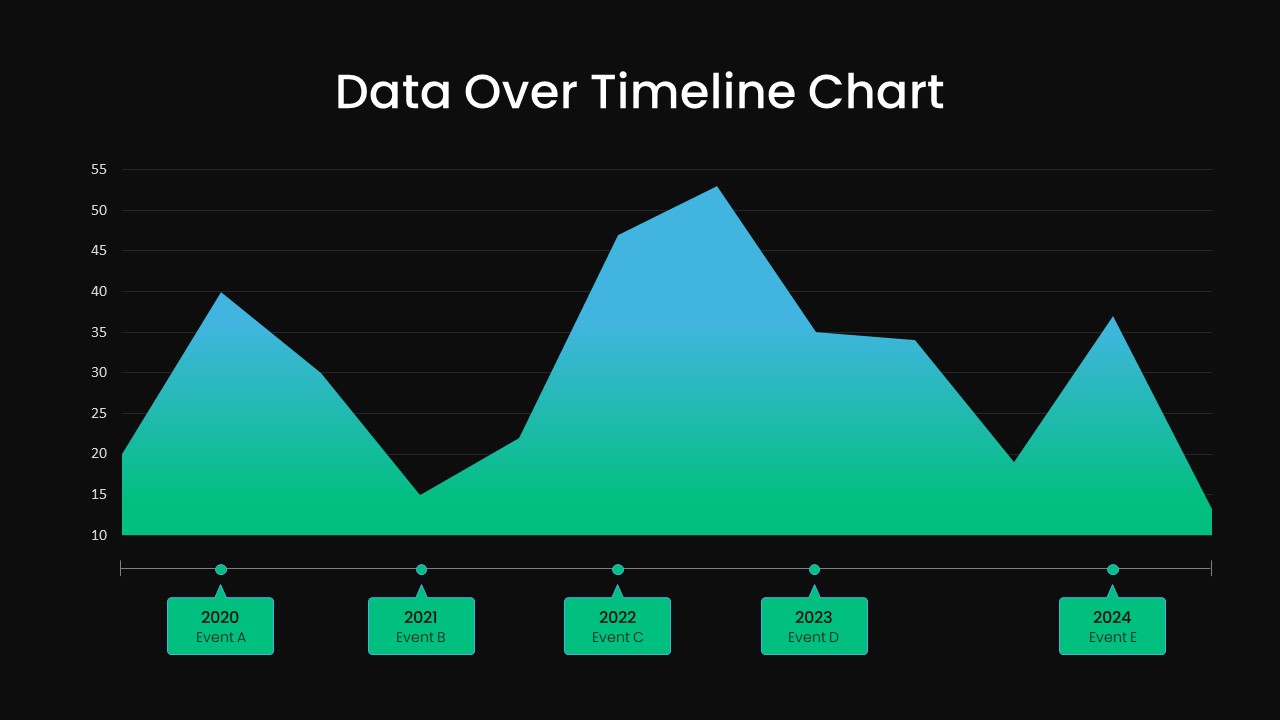
The Line Chart PowerPoint Template for Time-based Data Visualization for PowerPoint presentation is a simple presentation graph in two background colors. The black and white background choices allow the presenter to pick a template according to the color sense. As an editable chart in PowerPoint, users can add their text points in preferred places. It also allows the users to easily update values in real time. So, you can add data on an Excel sheet or PowerPoint to update predictable values. Use captivating PowerPoint graphs and charts for your business presentations. Check out more charts and graph templates here.
Attached Files
| File |
|---|
| https://premiumdownloads.s3.amazonaws.com/SB03629-Data Over Time Line Chart PowerPoint Template.ZIP |
Login to download this file
Add to favorites
Add to collection
-

Item ID
SB03629 -

Related Templates
-

Nature PowerPoint Presentation Template
PowerPoint Business Templates
Premium
-

Free Nursing Capstone PowerPoint Deck
PowerPoint Templates
Free
-

Sales Deck Free PowerPoint Template
PowerPoint Templates
Free
-

Free Vertical PowerPoint Template
PowerPoint Business Templates
Free
-

Cab Service PowerPoint Template
PowerPoint Templates
Premium
-

Research Proposal PowerPoint Template
PowerPoint Templates
Premium
-

Free Physical Education PowerPoint Template Deck
Free PowerPoint Templates
Free
-

Free Space Minimal Deck Template
PowerPoint Templates
Free
-

Gym PowerPoint Template
PowerPoint Templates
Premium
-

VET Clinic PowerPoint Template
PowerPoint Templates
Premium
-

Travel Agency PowerPoint Template
PowerPoint Templates
Premium
-

IoT Presentation Template
PowerPoint Templates
Premium
-

Effective Communication PowerPoint Template
PowerPoint Templates
Premium
-

Graph Paper PowerPoint Template Deck
PowerPoint Templates
Premium
-

PowerPoint Quiz With Timer
PowerPoint Templates
Premium
-
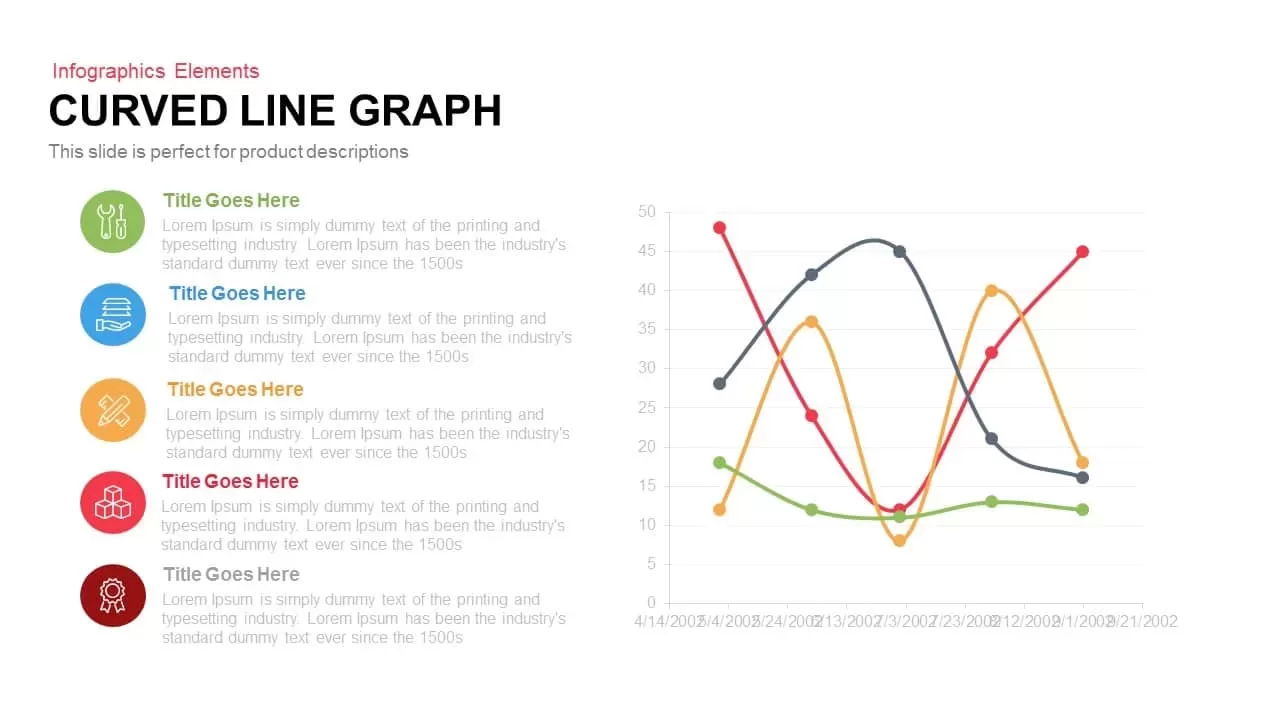
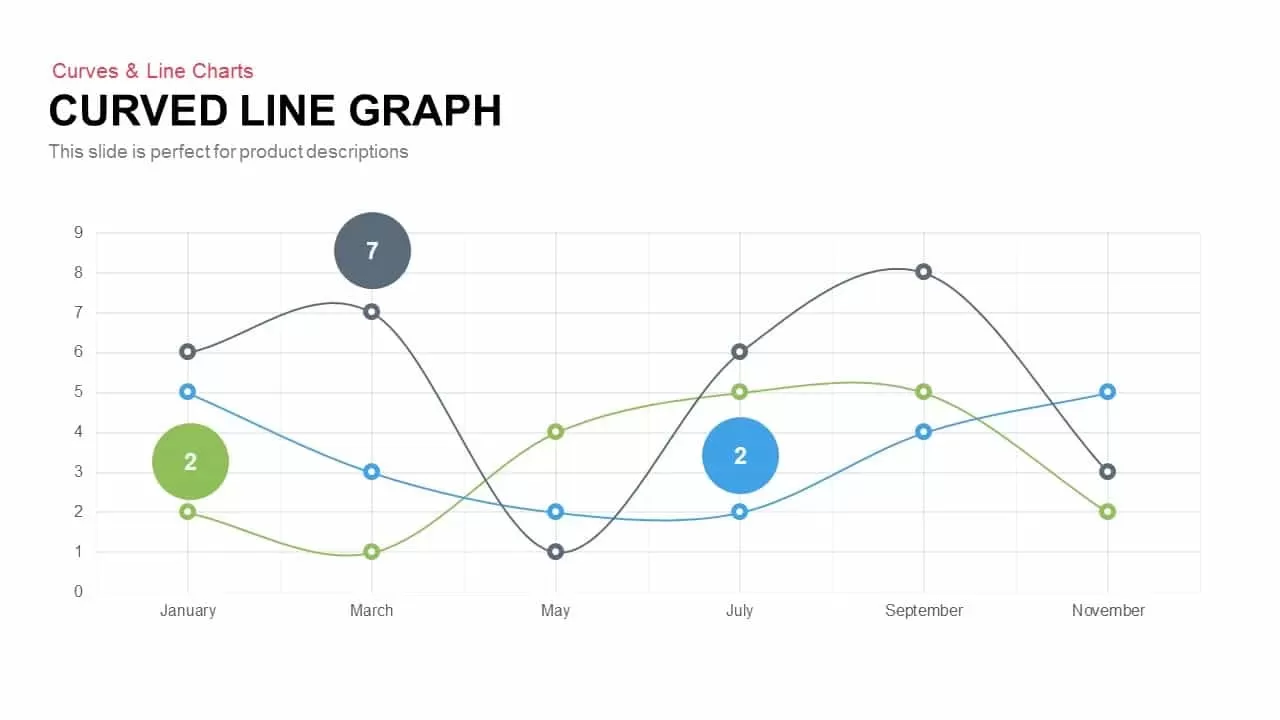
Curved Line Graph PowerPoint Template and Keynote Slide
Curves and Lines
Premium
-
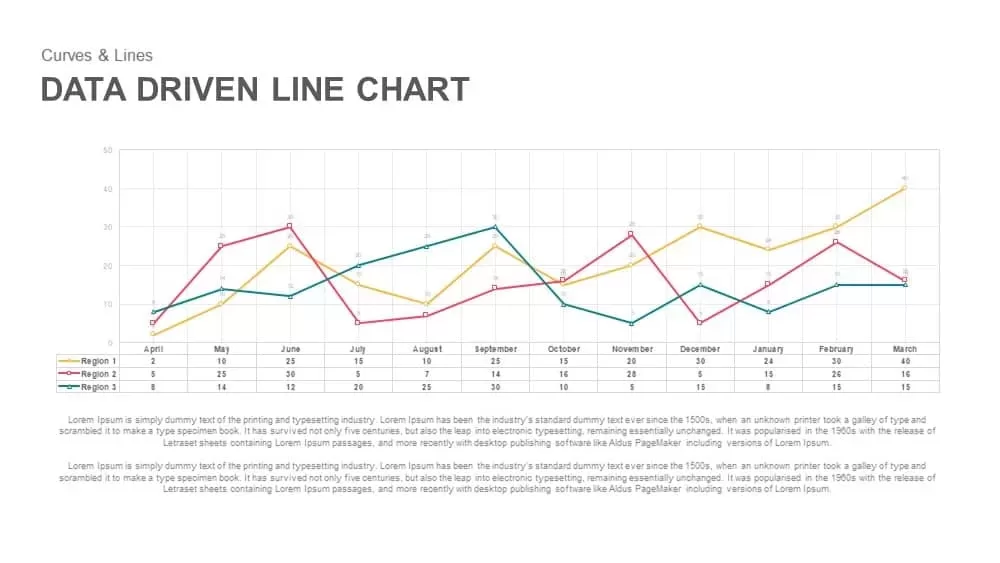
Data Driven Line Chart Template for PowerPoint & Keynote
Curves and Lines
Premium
-
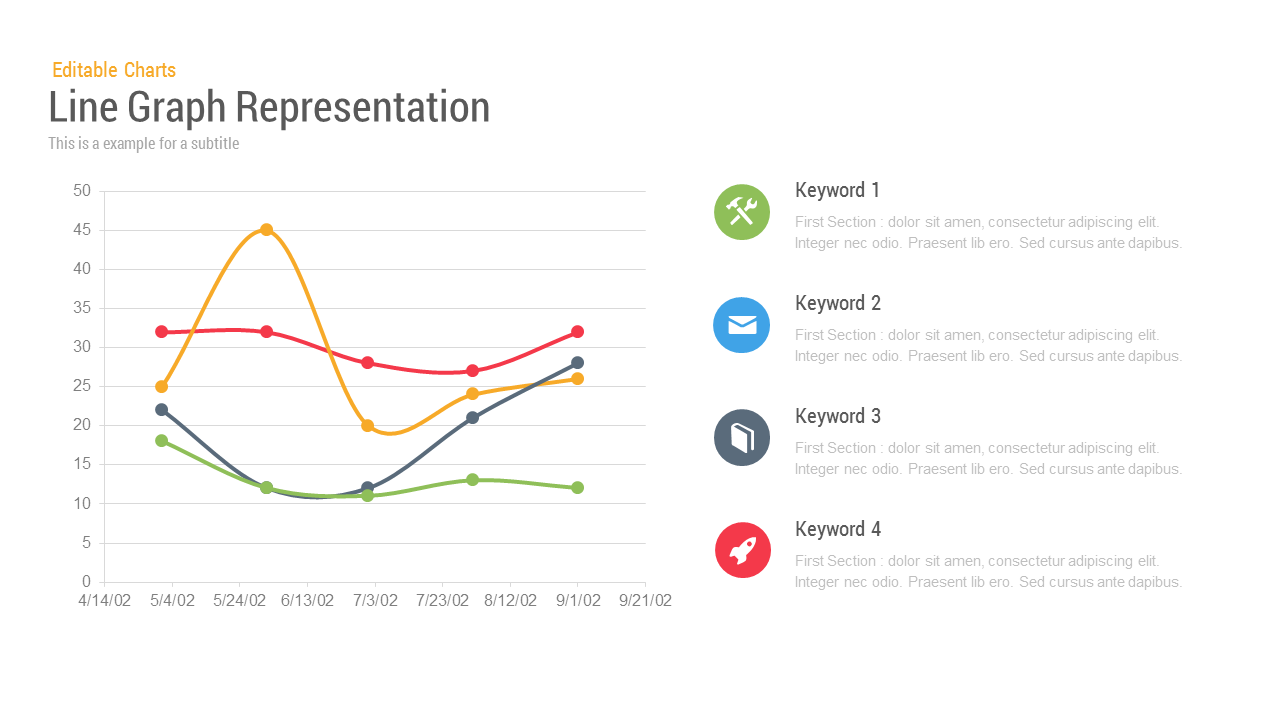
Line Chart Representation PowerPoint Templates and Keynote Slides
PowerPoint Charts
Premium
-

Macroeconomics PowerPoint Template
PowerPoint Templates
Premium
-

Free Economics PowerPoint Template
Free PowerPoint Templates
Free
-
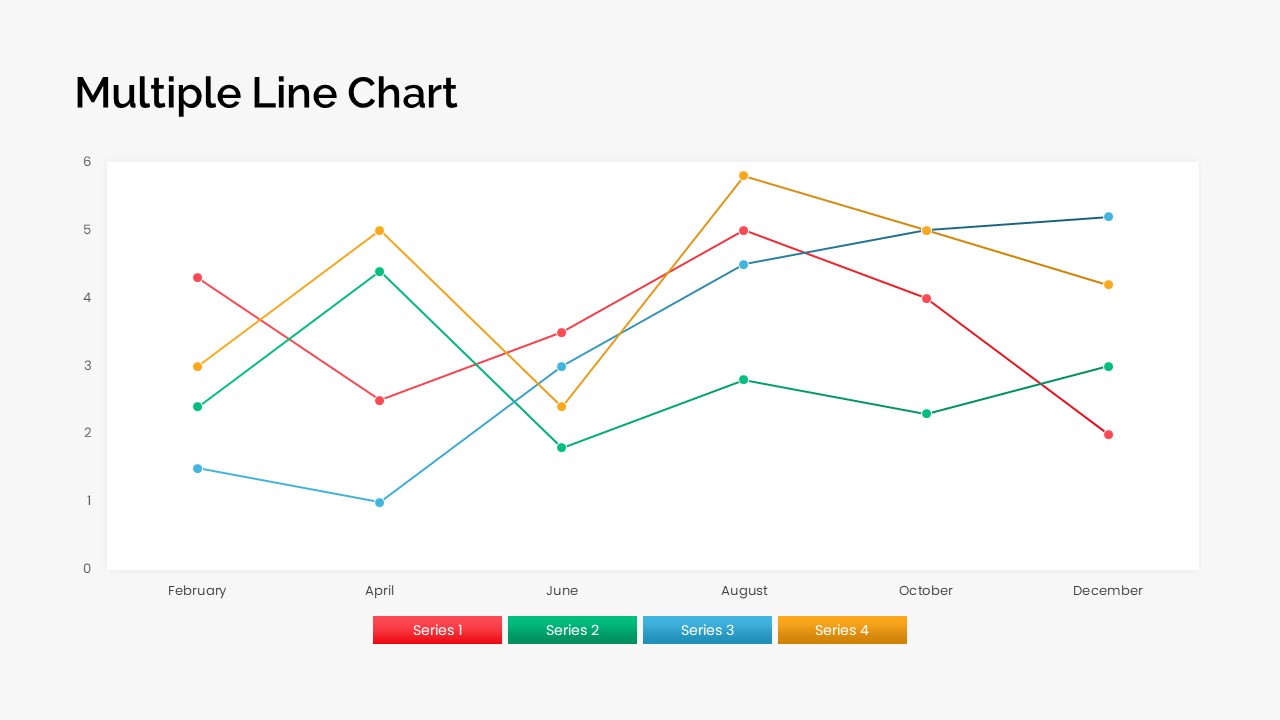
Multiple Line Chart PowerPoint Template
PowerPoint Charts
Premium
-
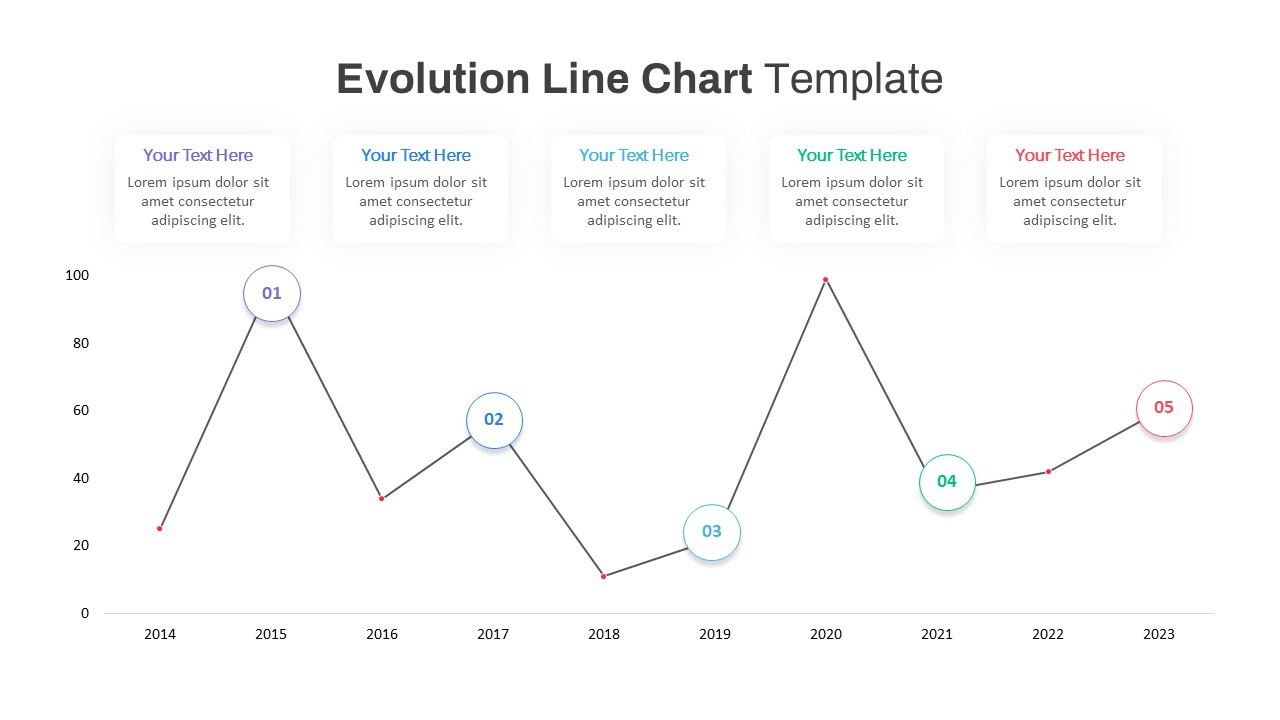
Evolution Line Chart PowerPoint Template
PowerPoint Templates
Premium
-

Free Aviation PowerPoint Template
Free PowerPoint Templates
Free
-
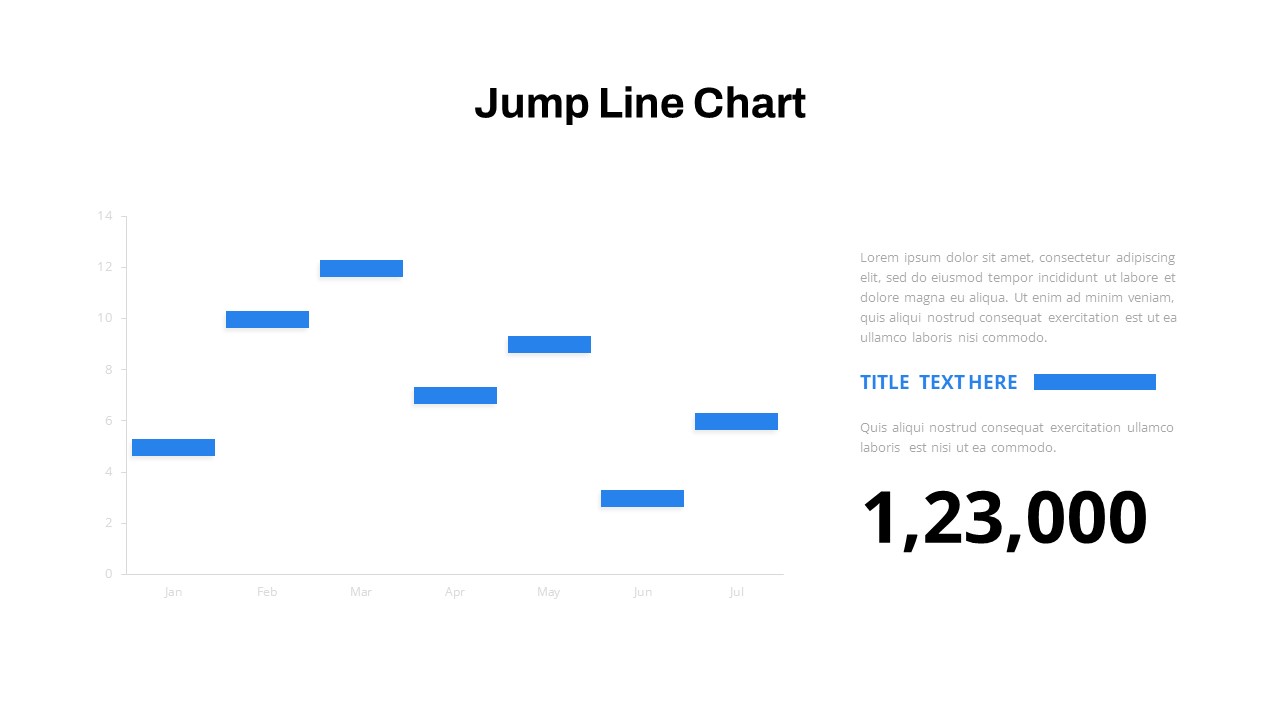
Jump Line Chart PowerPoint Template
Column and Bar chart
Premium
-

Free Charity PowerPoint Template Deck
PowerPoint Templates
Free
-

Customer Experience Loyalty PowerPoint Deck Template
PowerPoint Templates
Premium
-

Free Army PowerPoint Template
PowerPoint Templates
Free
-
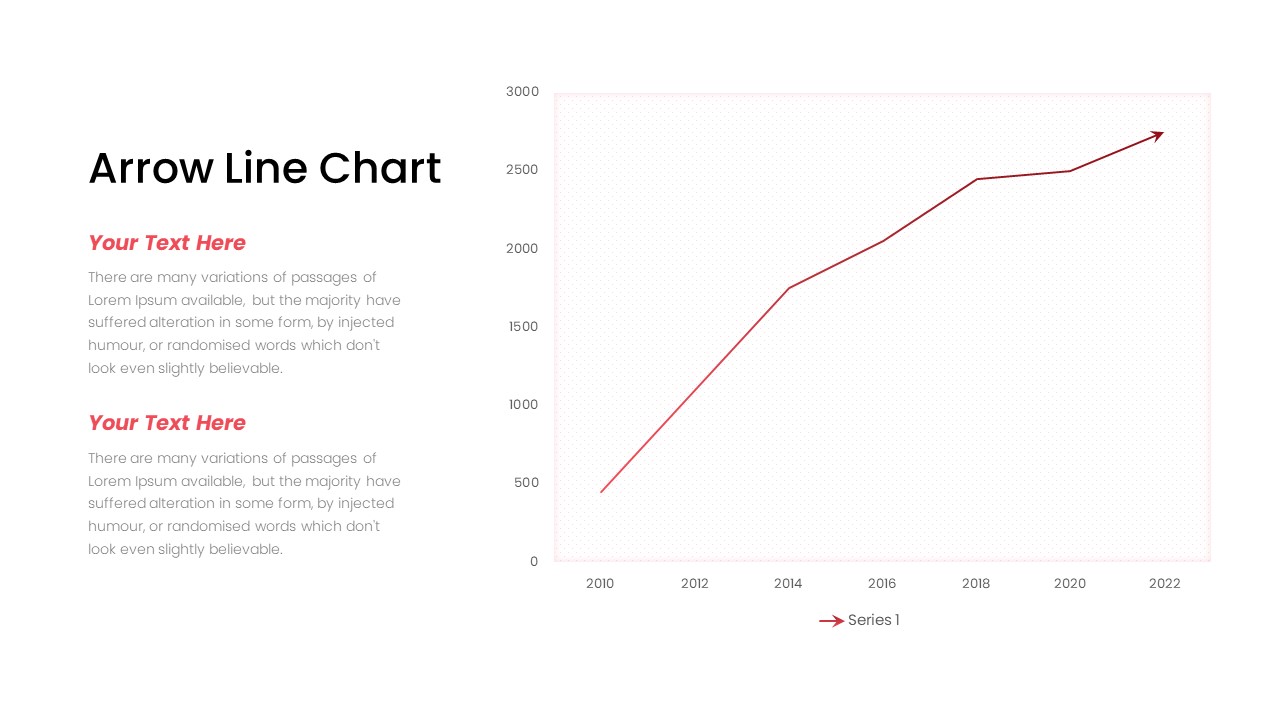
Arrow Line Chart PowerPoint Template
Arrow Diagrams
Premium
-
Curved Line Graph PowerPoint Template and Keynote
Curves and Lines
Premium
-

Animated Agriculture PowerPoint Deck Template
PowerPoint Templates
Premium
-

Free Event Planning PowerPoint Template
Free PowerPoint Templates
Free
-
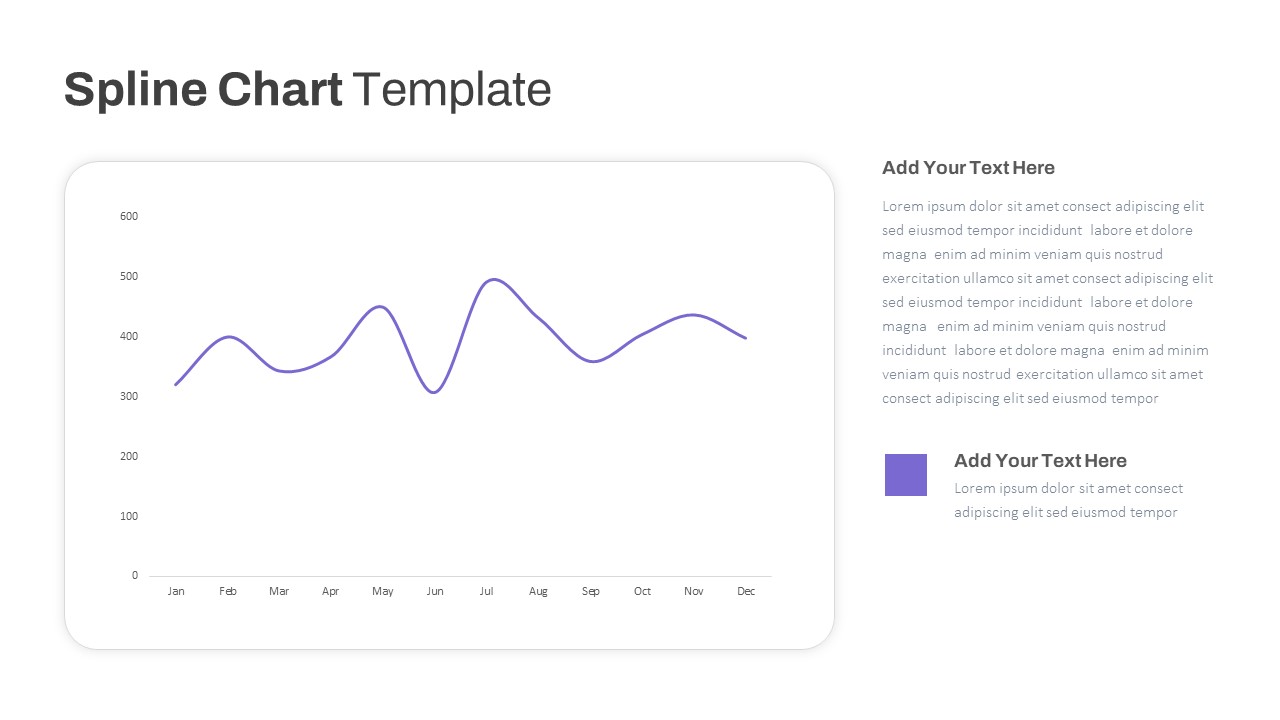
Spline Chart PowerPoint Template
PowerPoint Charts
Premium
-

Free Real Estate Listing PowerPoint Template
Free PowerPoint Templates
Free
-

Free Cartoon PowerPoint Template
Free PowerPoint Templates
Free
-

Data Science PowerPoint Template
PowerPoint Templates
Premium
-
3d Line Chart PowerPoint Template and Keynote Slide
3D Shapes
Premium
-

Free University Presentation PowerPoint Template
PowerPoint Templates
Free
-

Area Chart PowerPoint Template
PowerPoint Charts
Premium
-
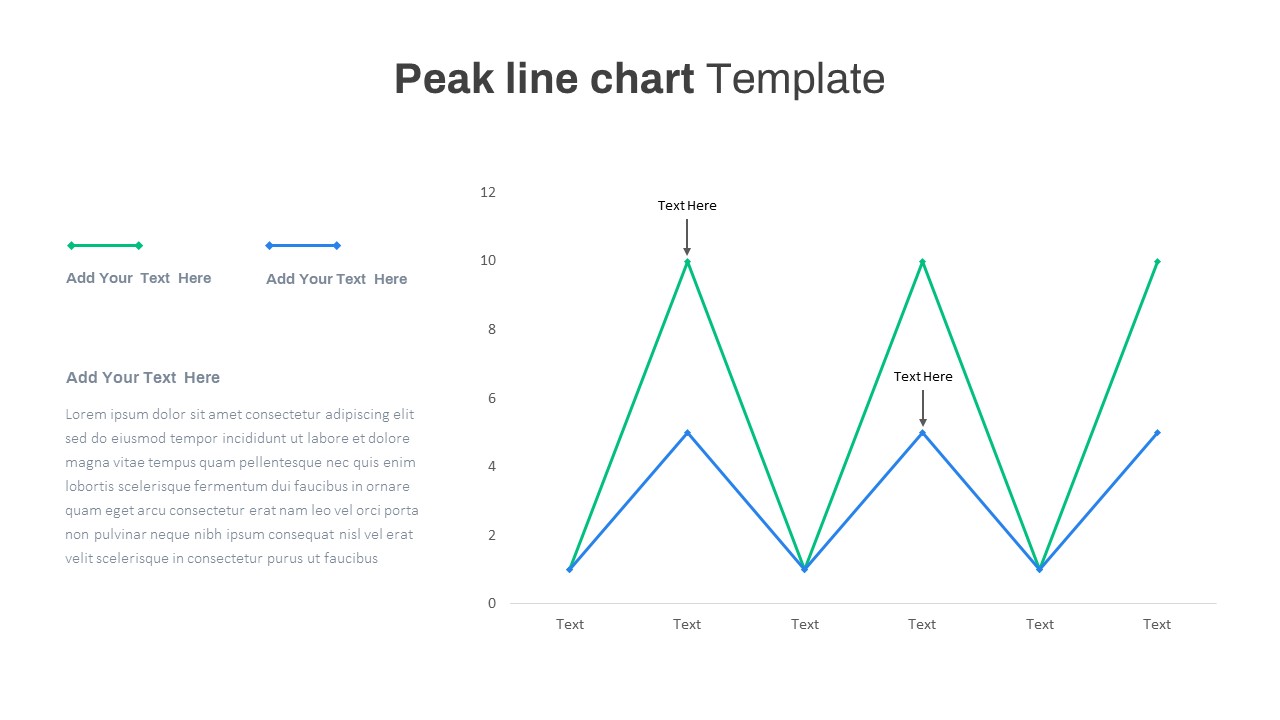
Peak Line Chart PowerPoint Template
PowerPoint Charts
Premium
-

Combination Chart PowerPoint Template
PowerPoint Charts
Premium
-
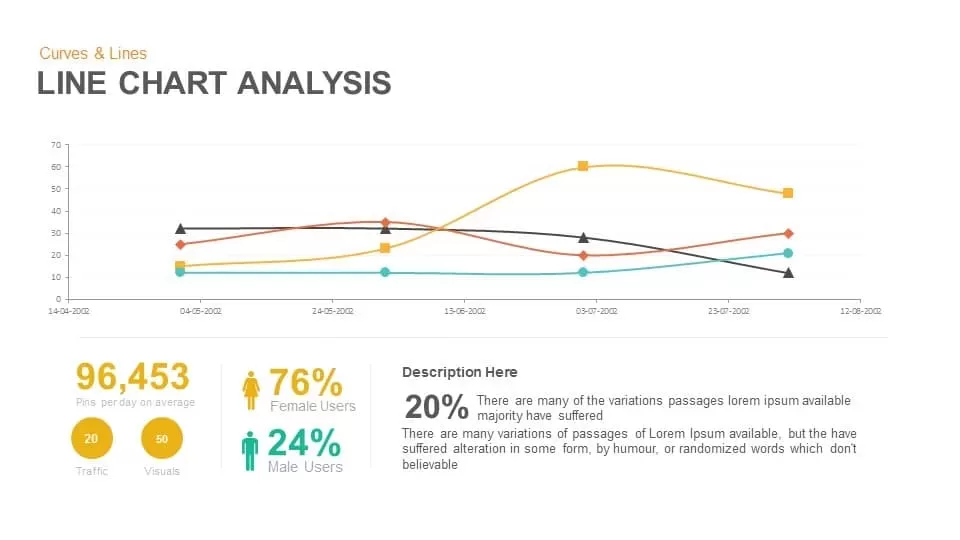
Line Chart Analysis PowerPoint Template and Keynote Slide
Curves and Lines
Premium
-
Free Charts & Graphs Deck PowerPoint Template
PowerPoint Templates
Free
-

Annual Report PowerPoint Template and Keynote
PowerPoint Templates
Premium
-

Free Book Review PowerPoint Template
Free PowerPoint Templates
Free
-

Free Charts and Graphs PowerPoint Template
PowerPoint Templates
Free
-

Global Warming Infographic PowerPoint Template Deck
PowerPoint Templates
Premium
-

EFQM Model PowerPoint Template
PowerPoint Templates
Premium
-
Line Chart PowerPoint Template
PowerPoint Charts
Premium
-

Free Dunder Mifflin Paper Company Pitch Deck
Free PowerPoint Templates
Free
-

Real Estate PowerPoint Theme
PowerPoint Themes
Premium
-

Free AI Artificial Intelligence PowerPoint Template
PowerPoint Templates
Free
-
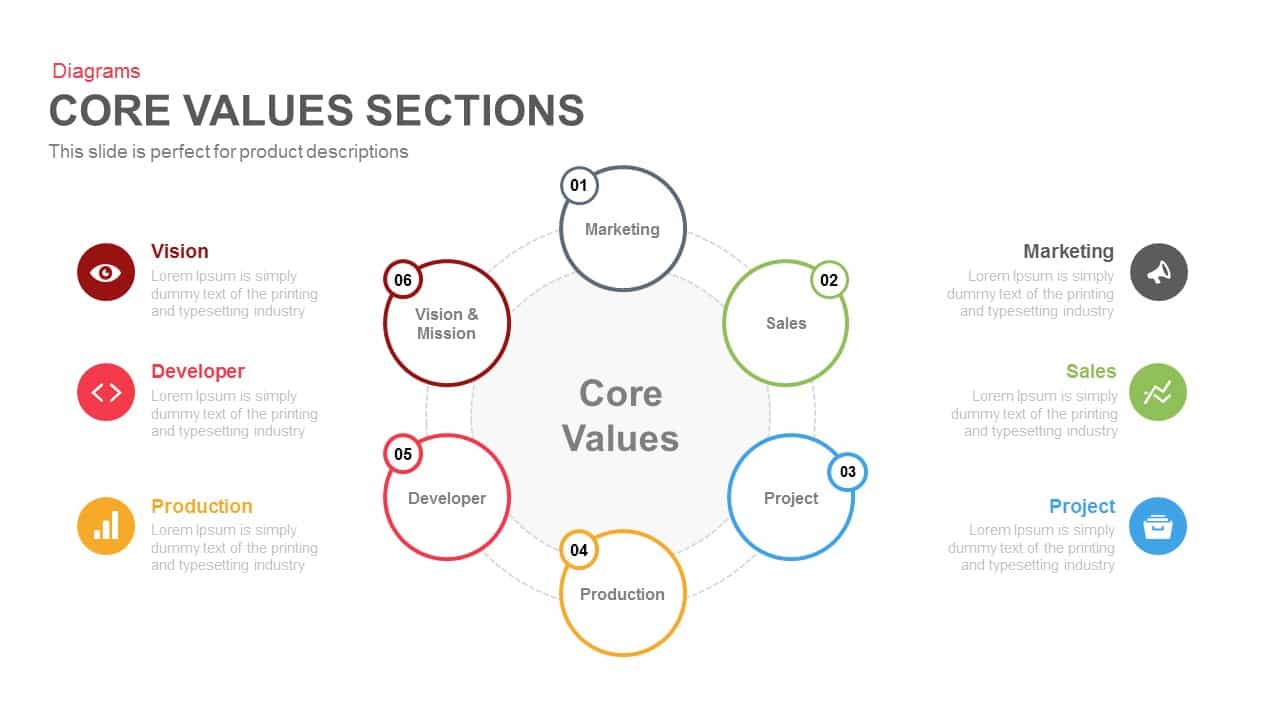
Core Values Sections PowerPoint Template and Keynote
Business Models
Premium
-

Creative Bar Chart Data Analysis PowerPoint Template and Keynote
Infographic
Premium
-
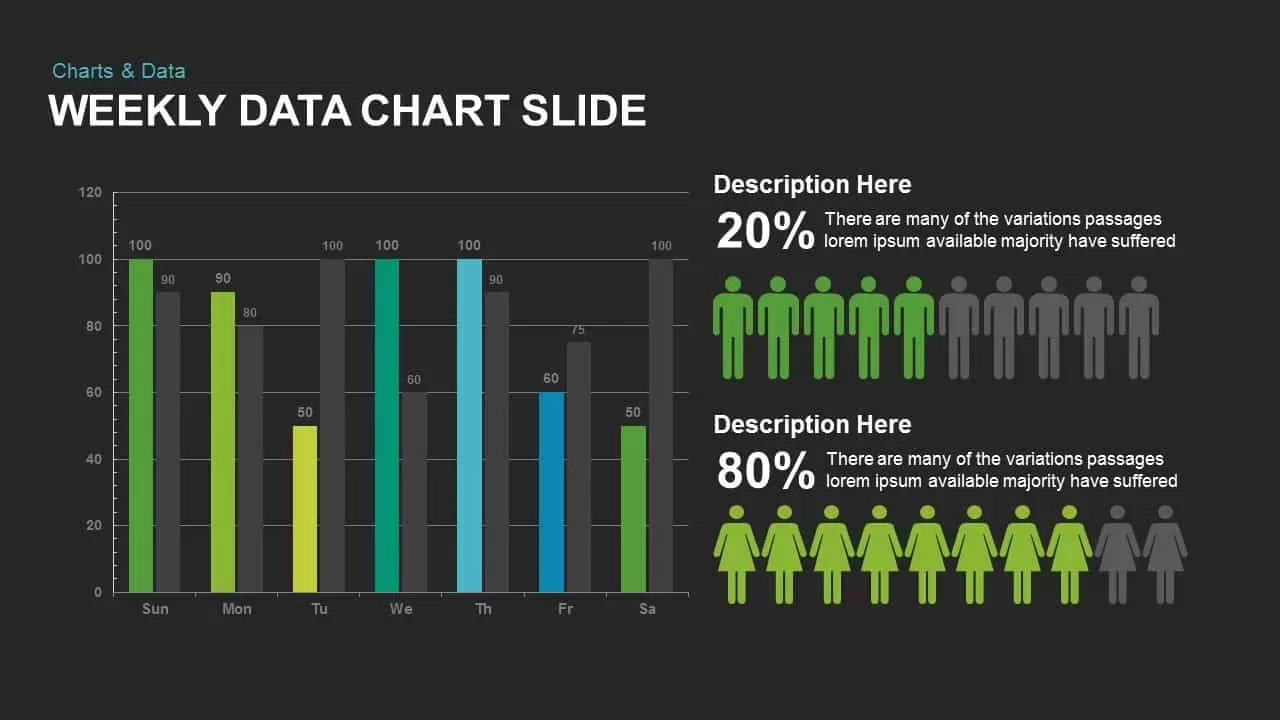
Weekly Data Charts PowerPoint Presentation Template and Keynote Slide
Infographic
Premium
-

Proportional Area Chart PowerPoint Template
PowerPoint Templates
Premium
-

Business Process Reengineering Template
PowerPoint Templates
Premium
-

Clustered Column Chart PowerPoint Template
PowerPoint Charts
Premium
-
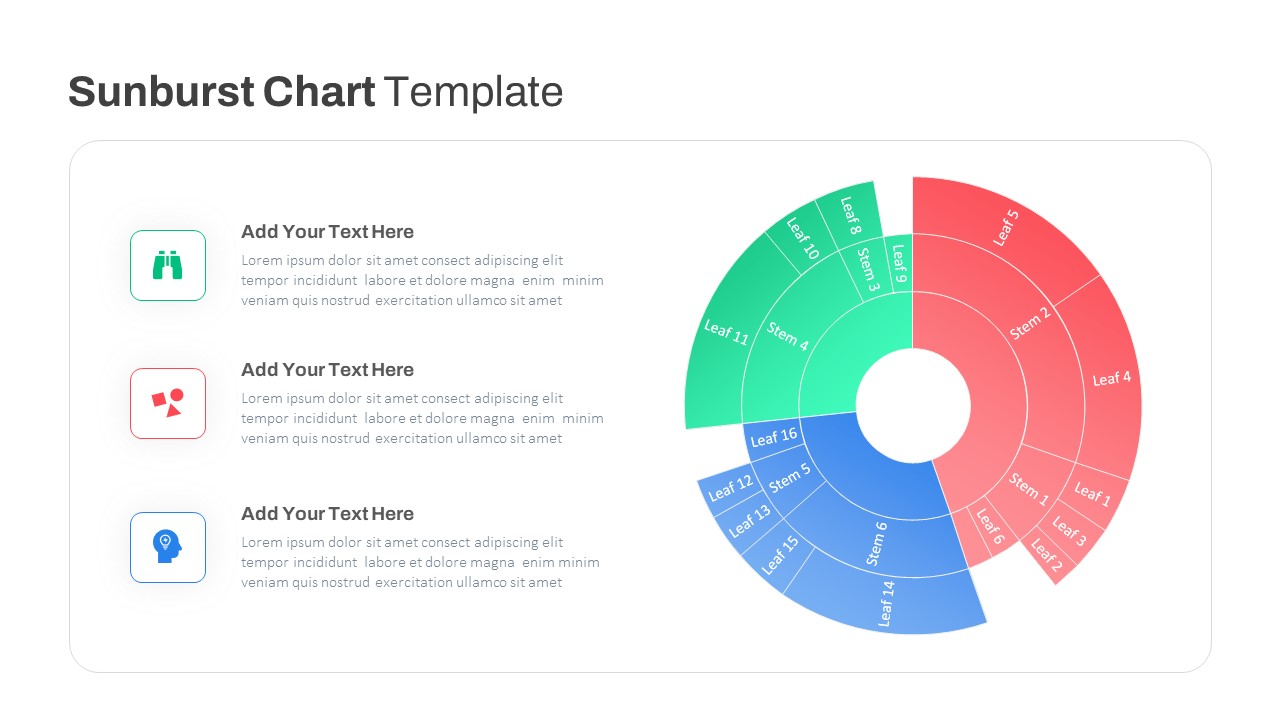
Sun Burst Chart PowerPoint Template
Circular Diagrams
Premium
-
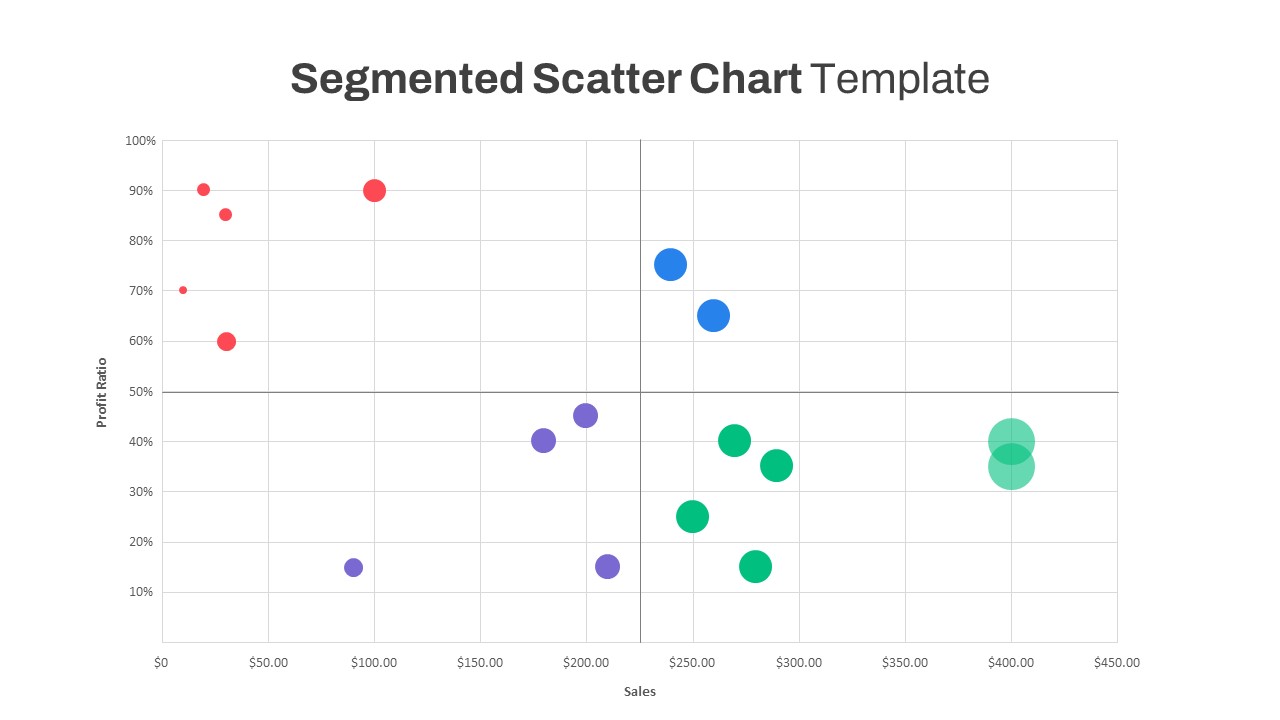
Segmented Scatter Chart PowerPoint Template
PowerPoint Charts
Premium
-

Stakeholder Register PowerPoint Template
PowerPoint Templates
Premium
-

Animated Upcoming Event Poster PowerPoint Template
PowerPoint Templates
Premium
-
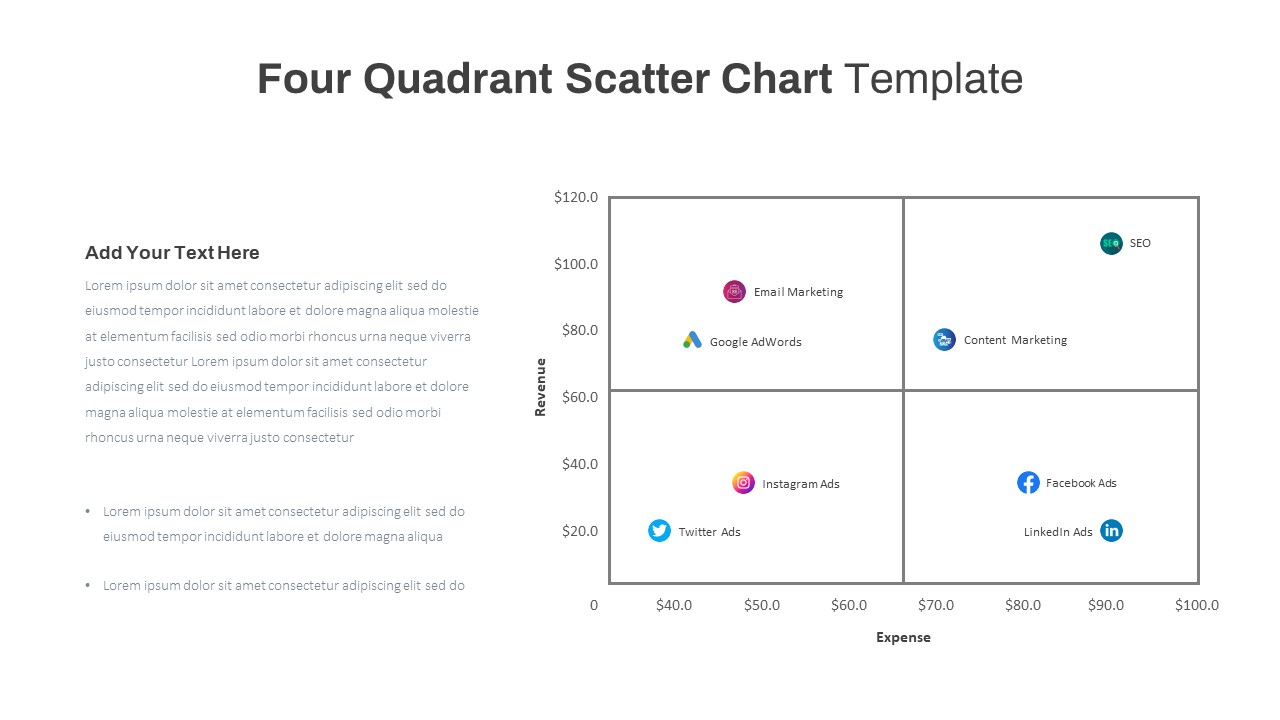
Four Quadrant Scatter Chart PowerPoint Template
PowerPoint Charts
Premium
-
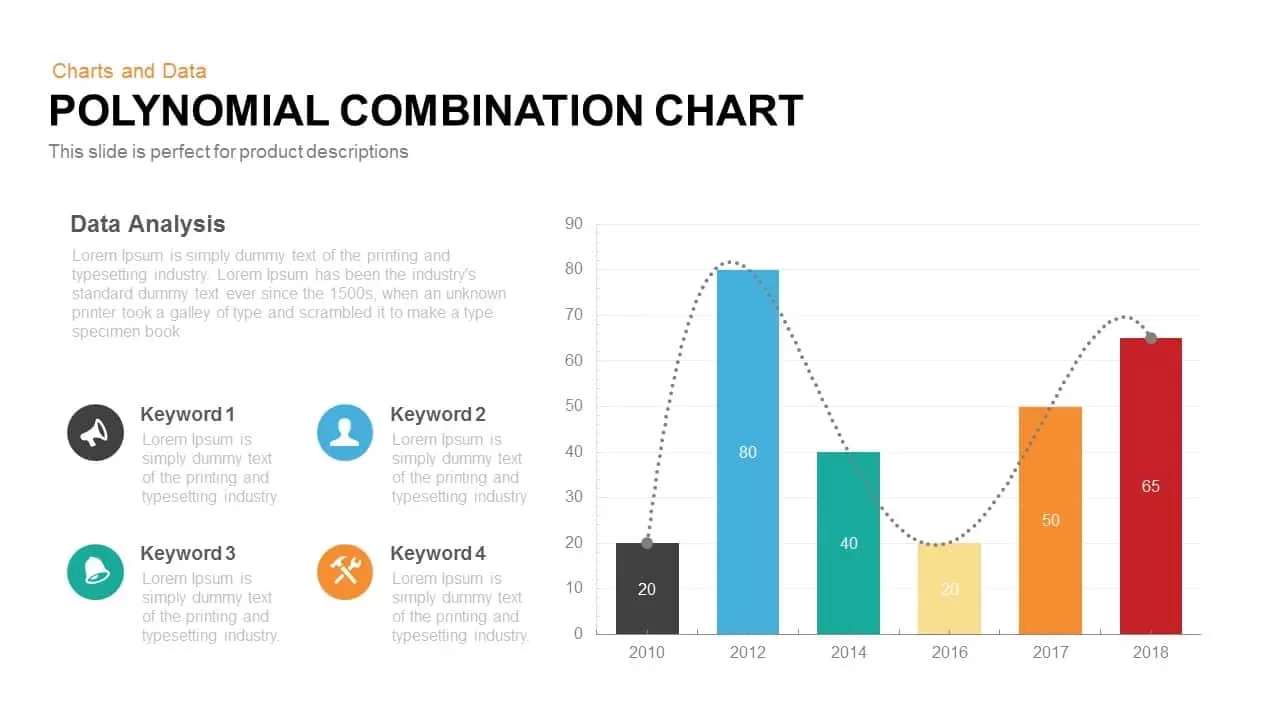
Polynomial Combination Chart PowerPoint Template and Keynote Slide
Column and Bar chart
Premium
-

Mekko Chart Template
PowerPoint Templates
Premium
-

Open Door Policy PowerPoint Template
PowerPoint Templates
Premium
-
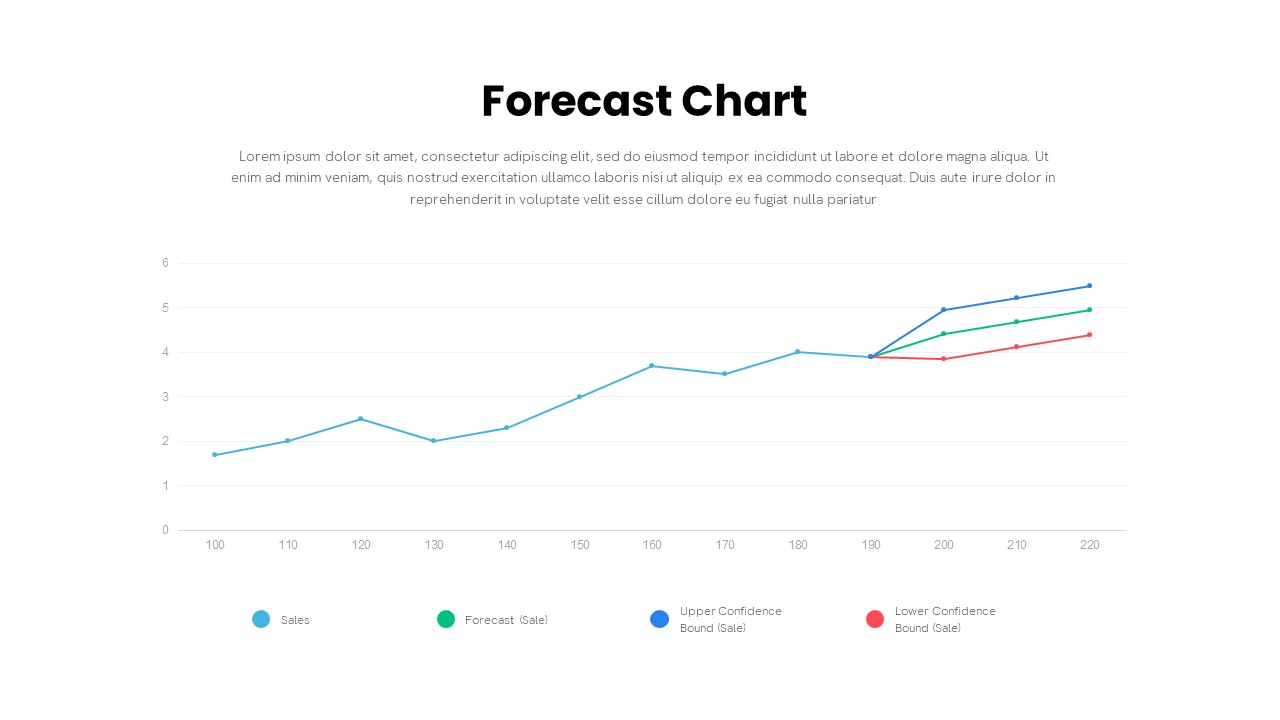
Forecast Chart PowerPoint Template
PowerPoint Charts
Premium
-
Application Revenue Line Chart PowerPoint Template and Keynote
Keynote Templates
Premium
-
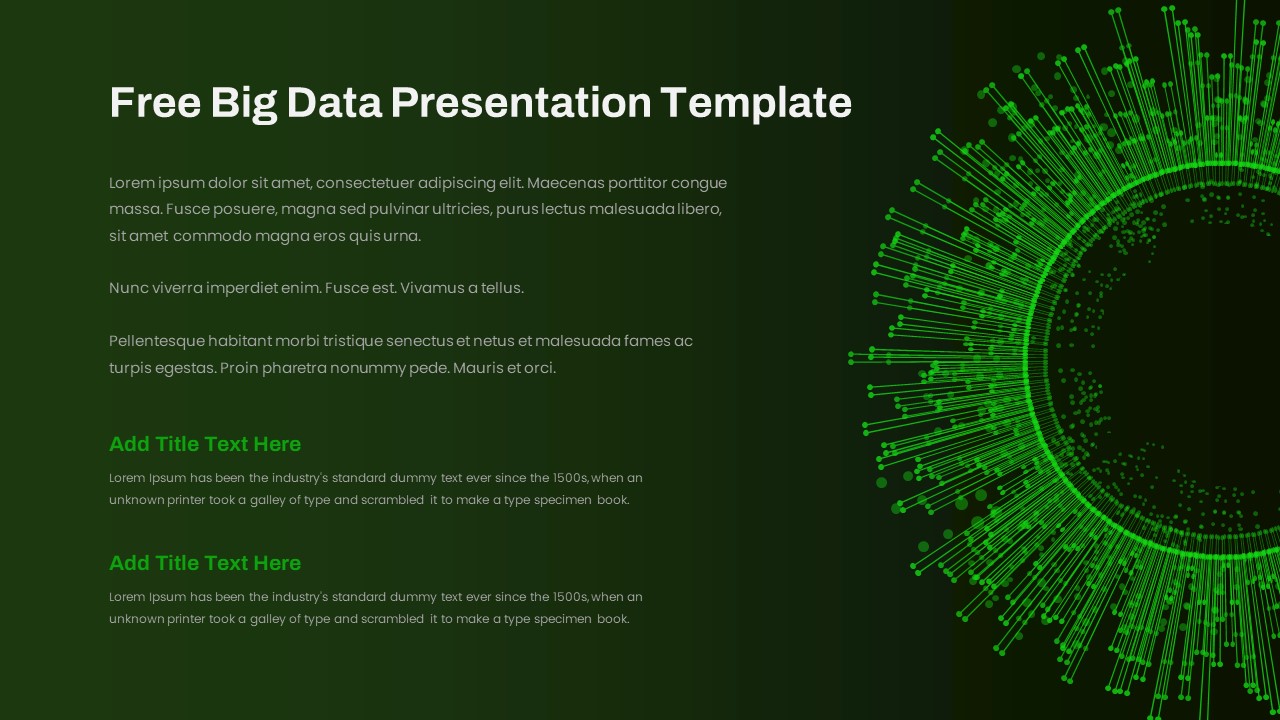
Free Big Data PowerPoint Template
PowerPoint Templates
Free
-
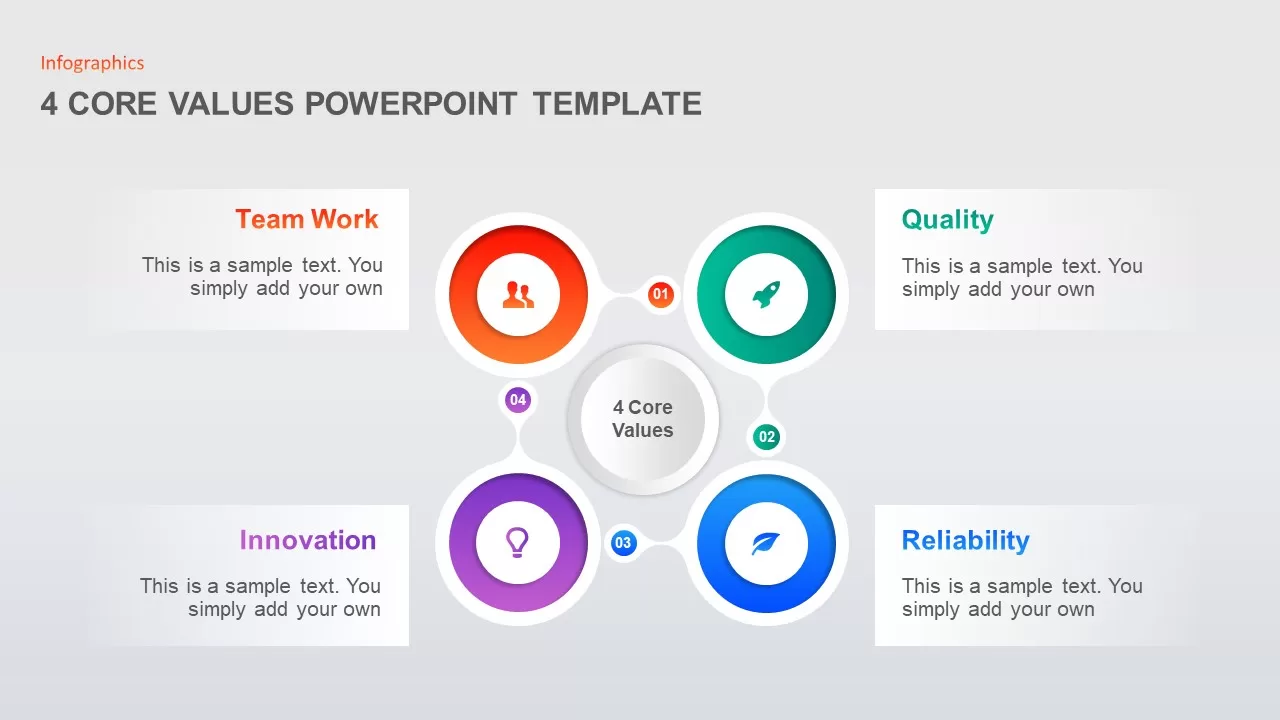
4 Step Core Values PowerPoint Template
Business Models
Premium
-
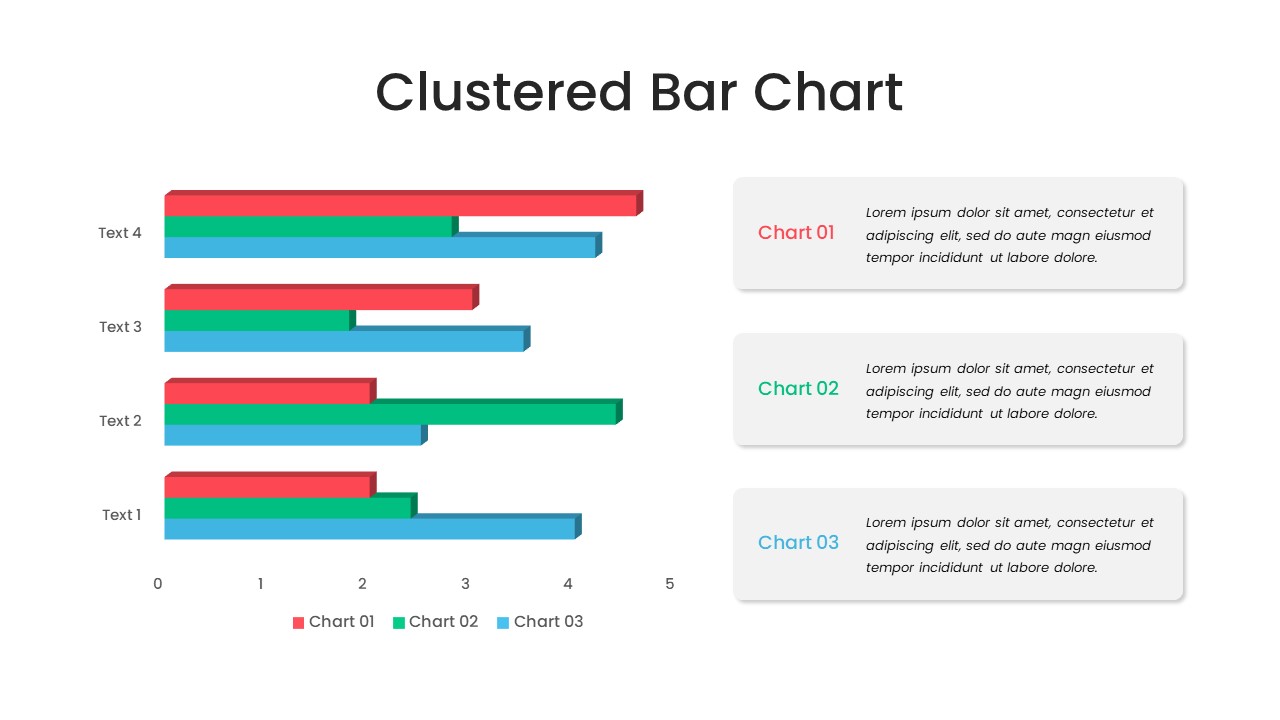
Clustered Bar Chart PowerPoint Template
Column and Bar chart
Premium
-
Stacked Area Chart PowerPoint Template
PowerPoint Charts
Premium
-
Polar Chart PowerPoint Template
PowerPoint Templates
Premium
-

Power Analogy Metaphor PowerPoint Template
Metaphor, Simile & Analogy
Premium
-
Survey Results PowerPoint Template Free
Free PowerPoint Templates
Free
-

Biotechnology PowerPoint Presentation Template
PowerPoint Templates
Premium
-
Growth Curve Line Chart PowerPoint Template
Curves and Lines
Premium
-
Set of Chart PowerPoint Template and Keynote Diagram
PowerPoint Charts
Premium
-
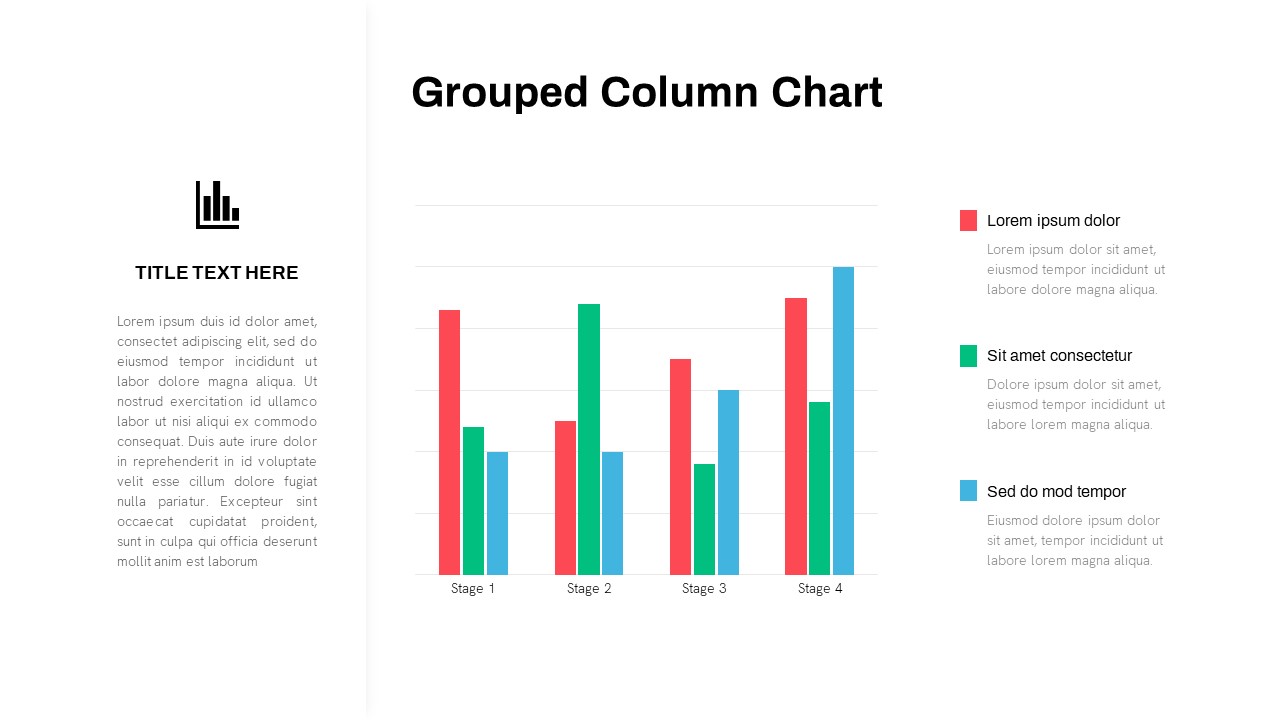
Grouped Column Chart PowerPoint Template
Column and Bar chart
Premium
-
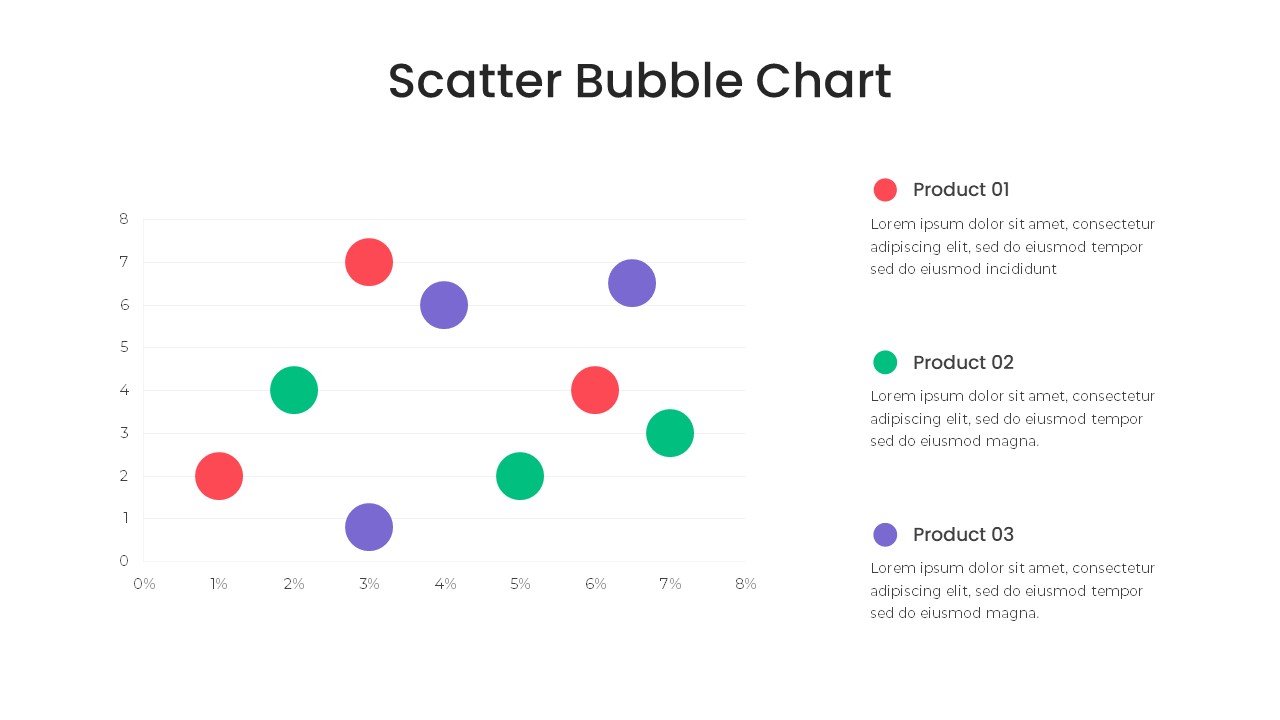
Bubble Chart PowerPoint Template
PowerPoint Templates
Premium
-
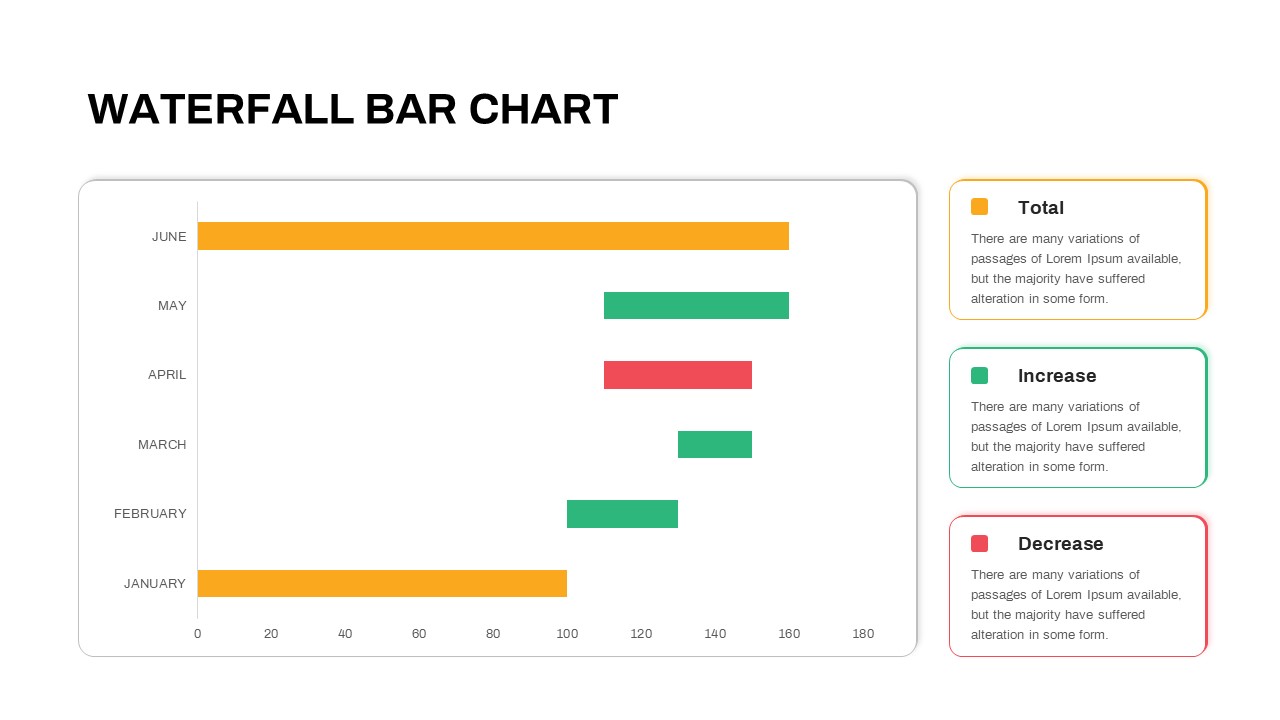
Waterfall Bar Chart PowerPoint Template
PowerPoint Charts
Premium
-

Radial Bar Chart PowerPoint Templates and Keynote Slides
PowerPoint Charts
Premium
-
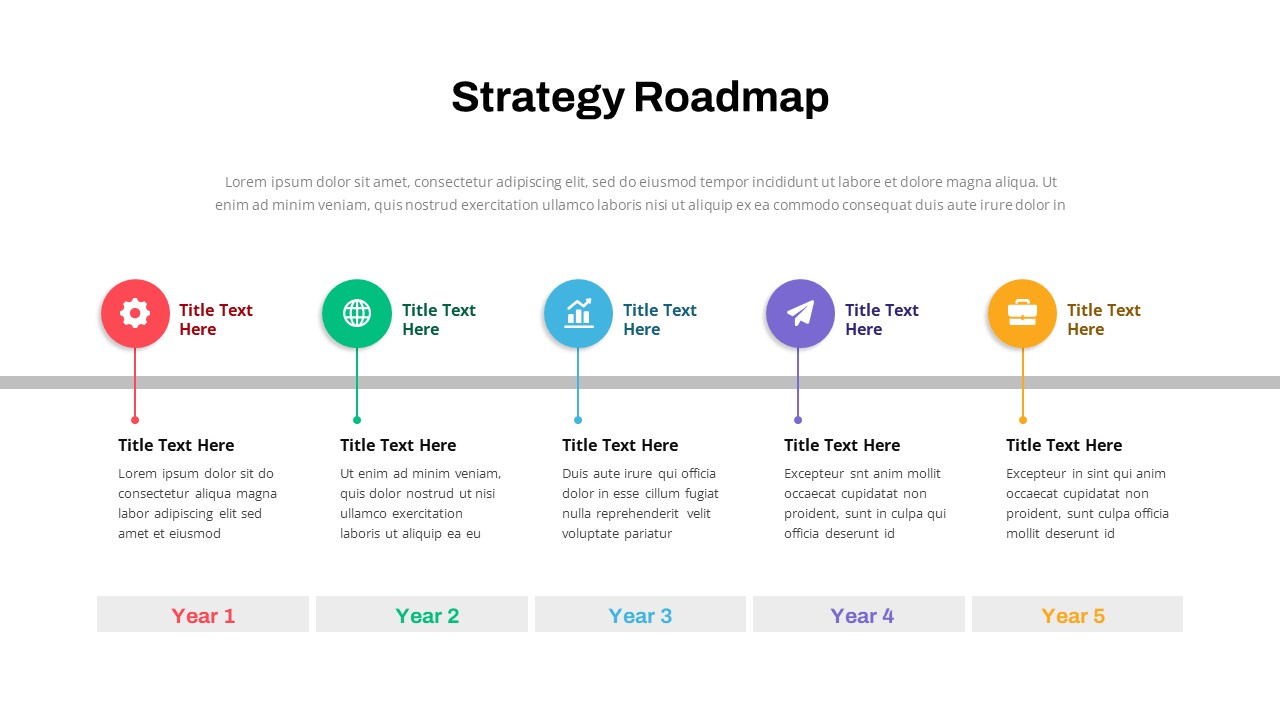
Data Strategy Roadmap PowerPoint Template
PowerPoint Templates
Premium
-
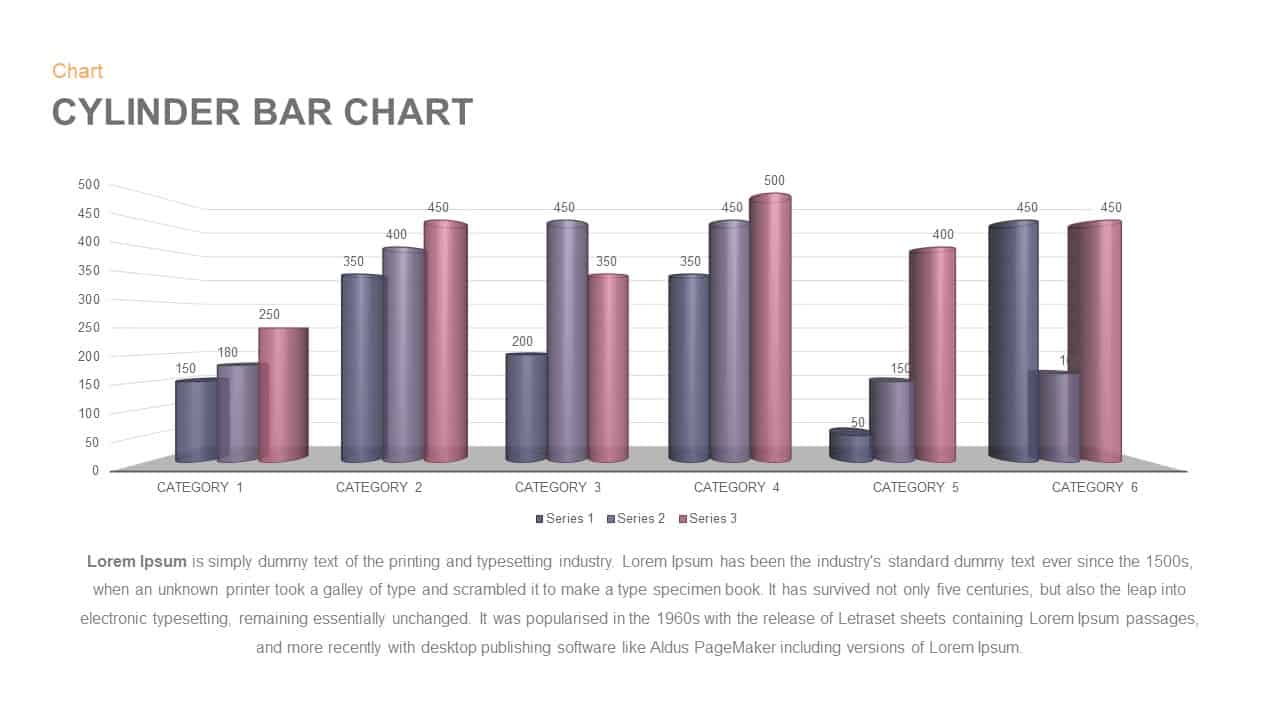
Cylinder Bar Chart PowerPoint Template and Keynote Slide
Column and Bar chart
Premium
-
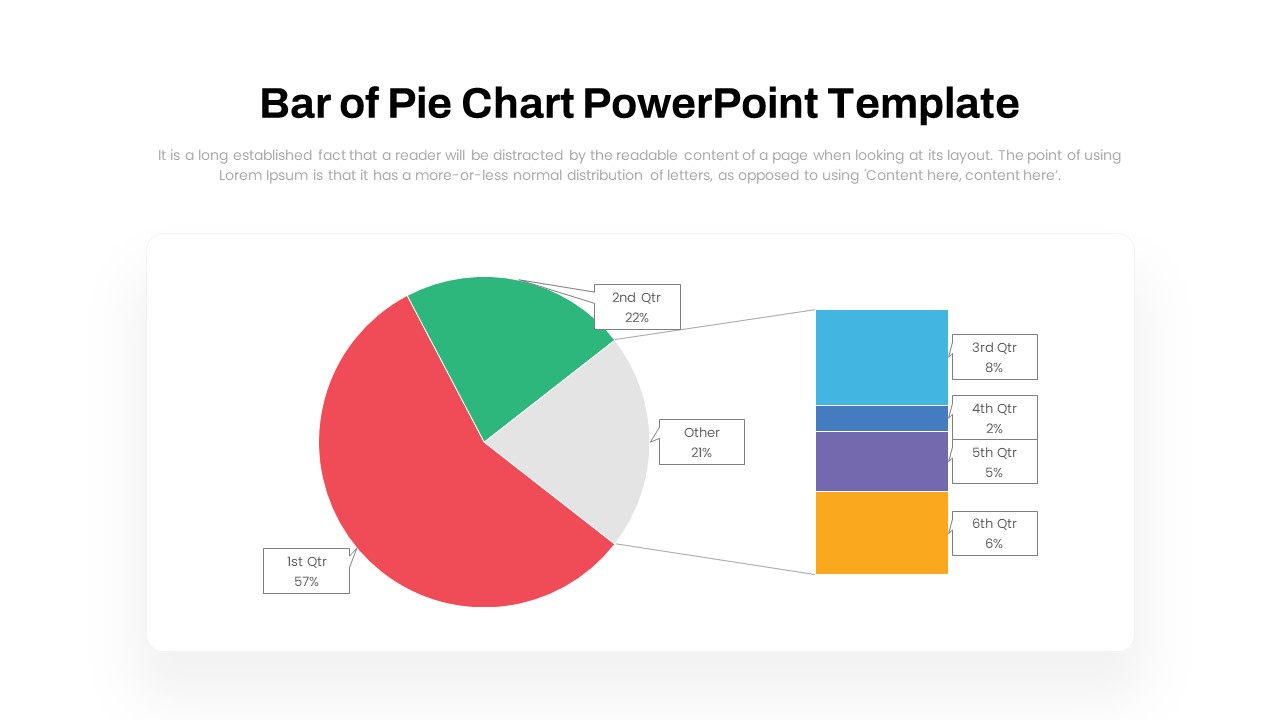
Bar of Pie Chart PowerPoint Template
PowerPoint Templates
Premium
-
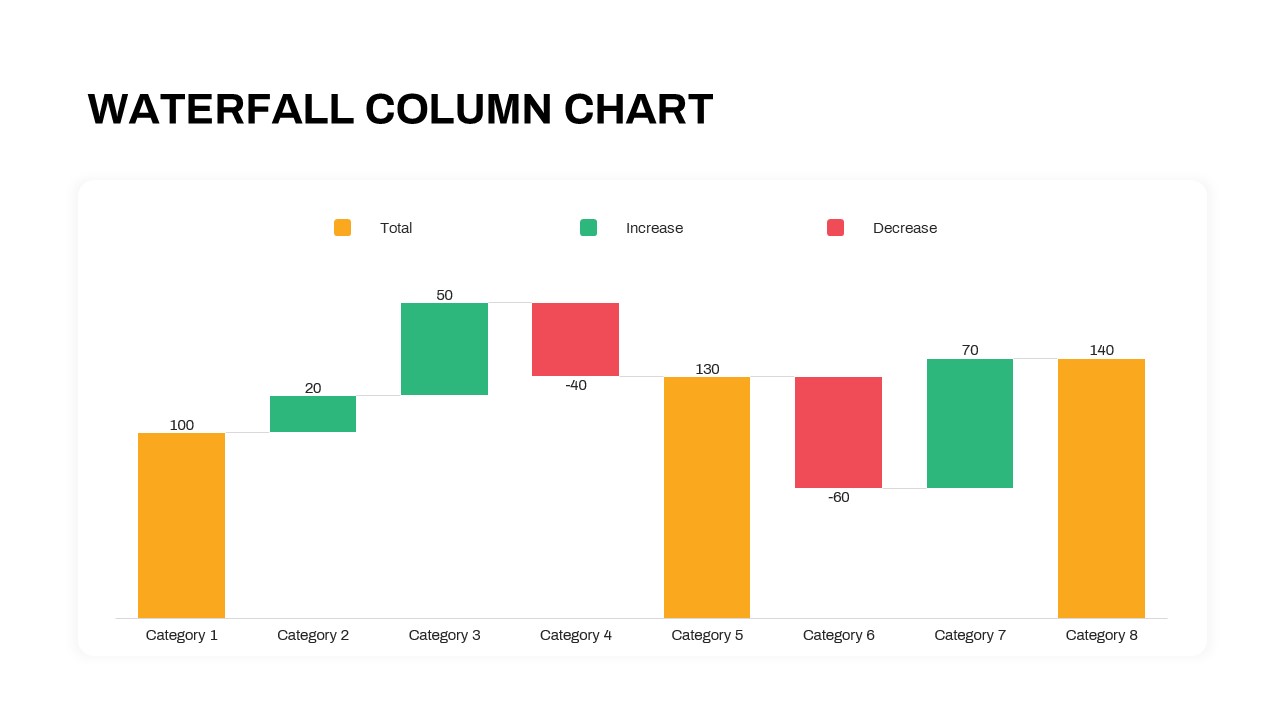
Waterfall Column Chart PowerPoint Template
Column and Bar chart
Premium
-
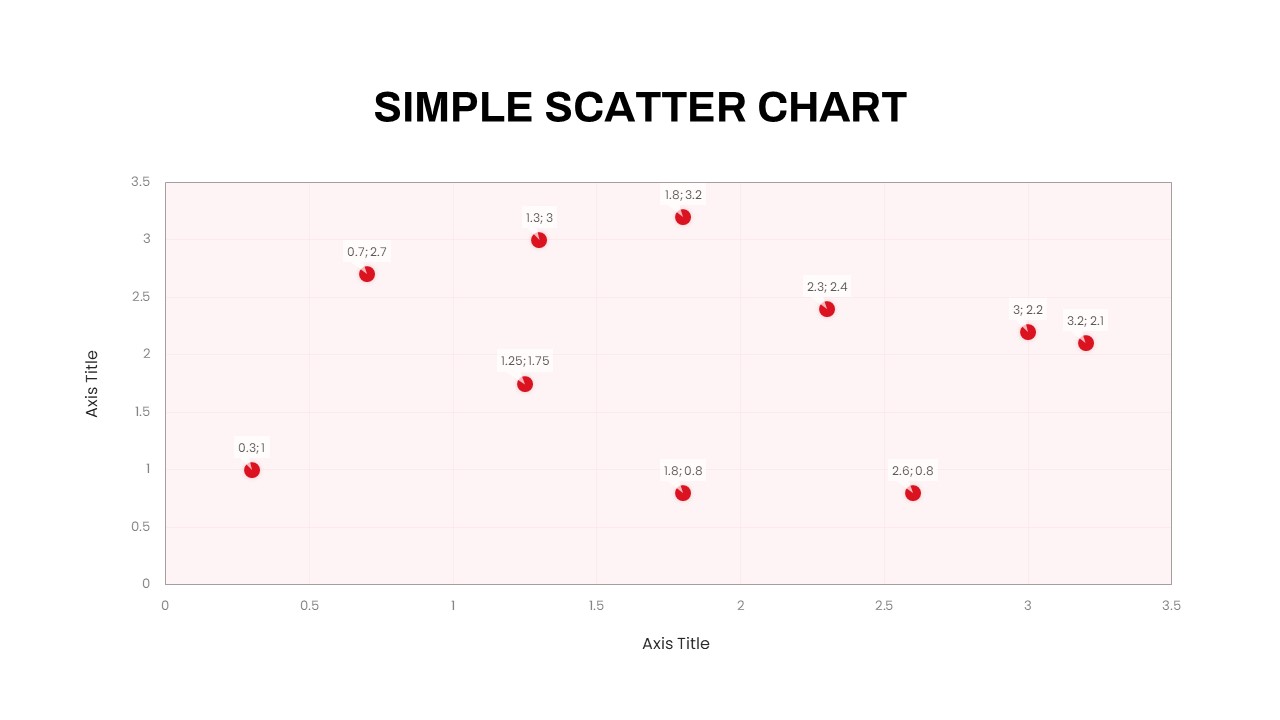
Simple Scatter Chart PowerPoint Template
PowerPoint Charts
Premium
-
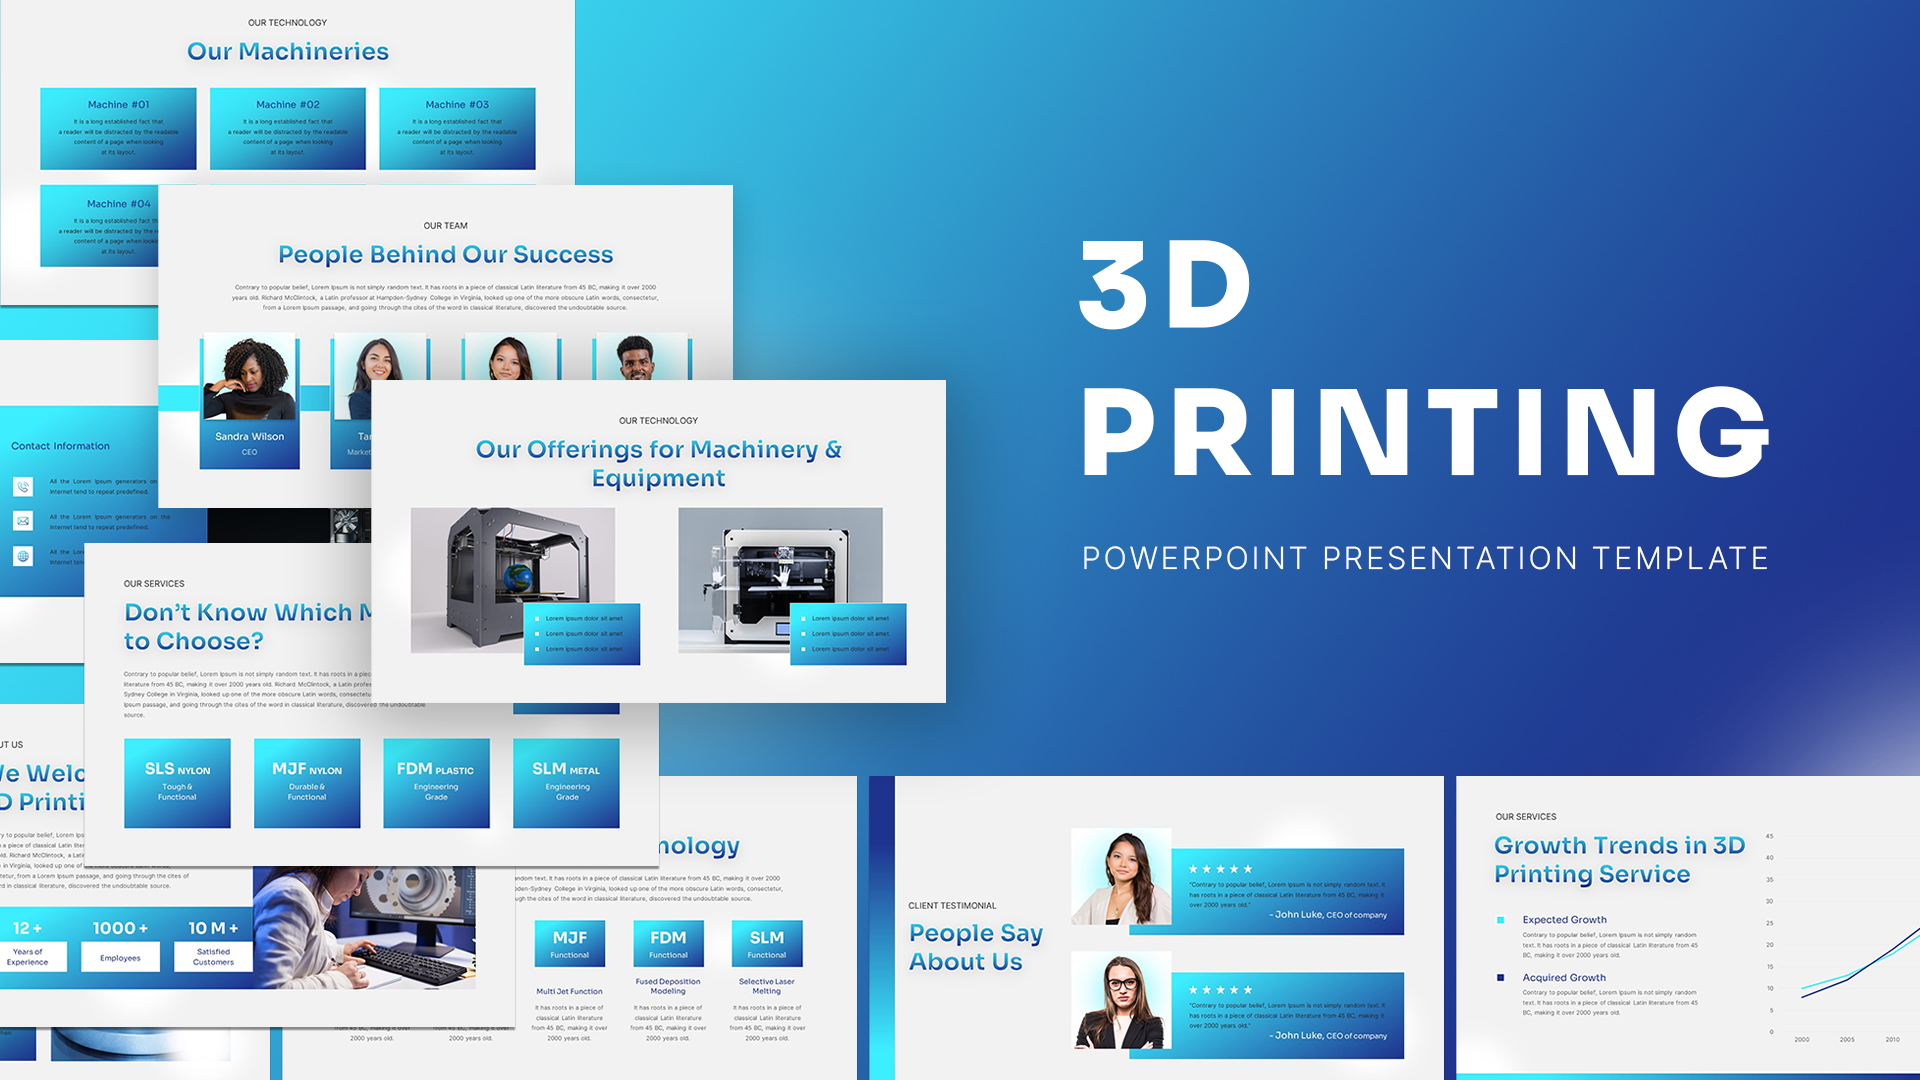
3D Printing Deck PowerPoint Template
PowerPoint Templates
Premium
-
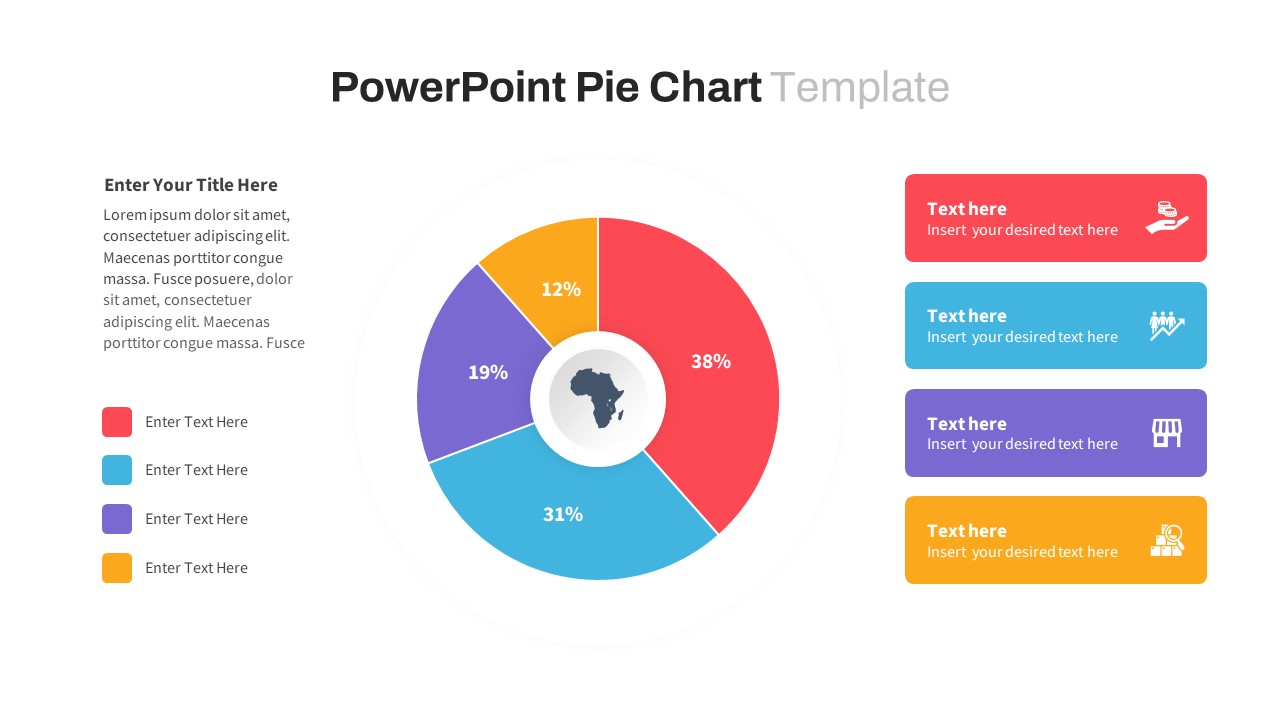
Pie Chart PowerPoint Template
Infographic
Premium
-
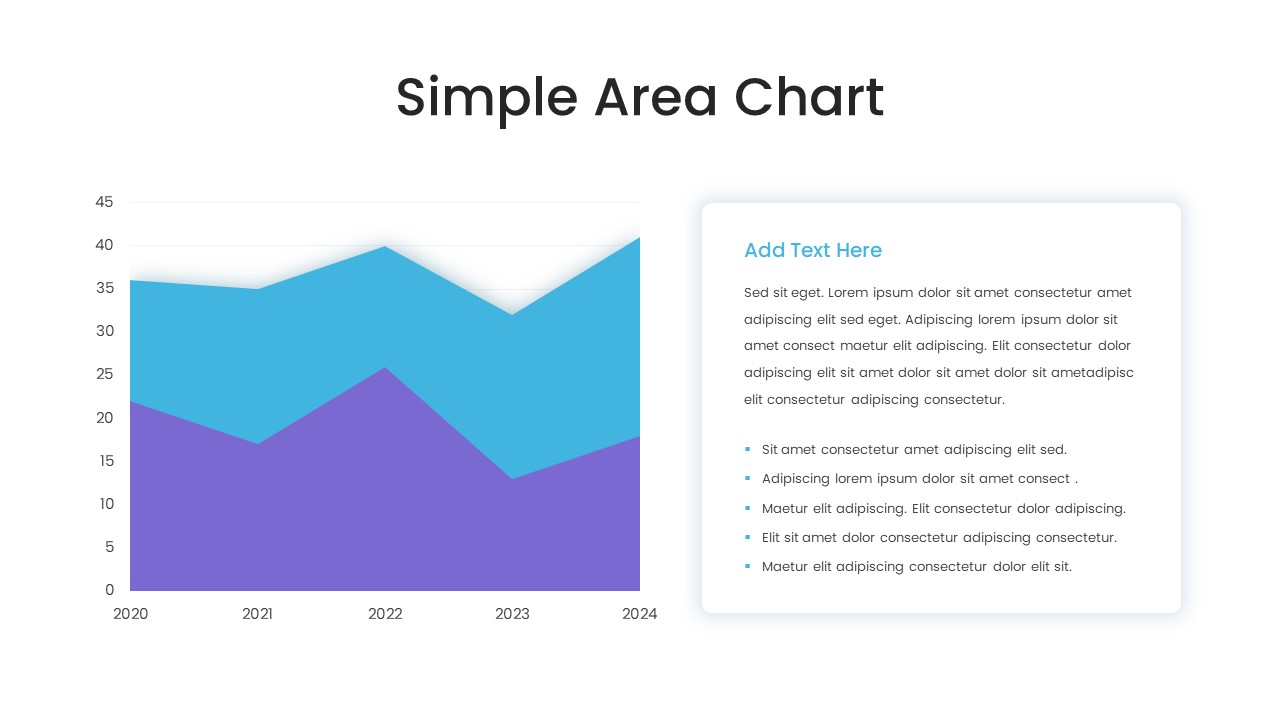
PowerPoint Area Chart Template
PowerPoint Charts
Premium
-
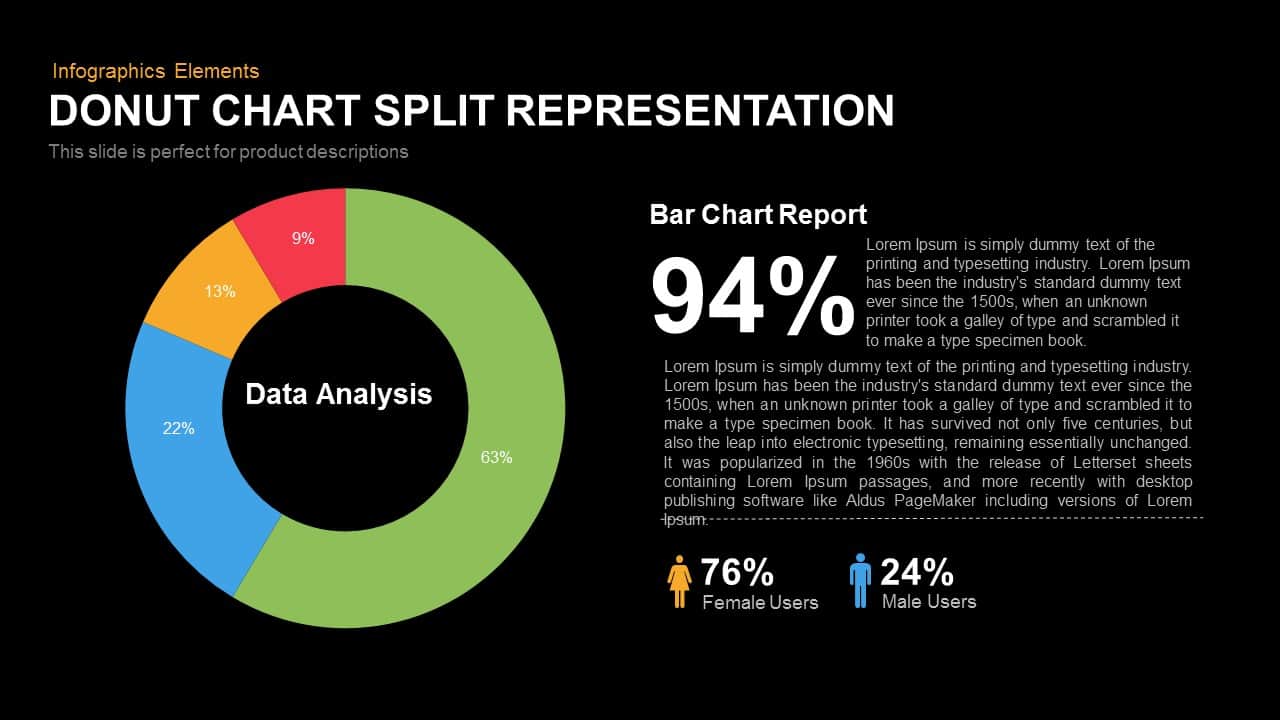
Split Representation Donut Chart Template for PowerPoint and Keynote
Keynote Templates
Premium
-

Finance Consulting PowerPoint Template
PowerPoint Templates
Premium
-
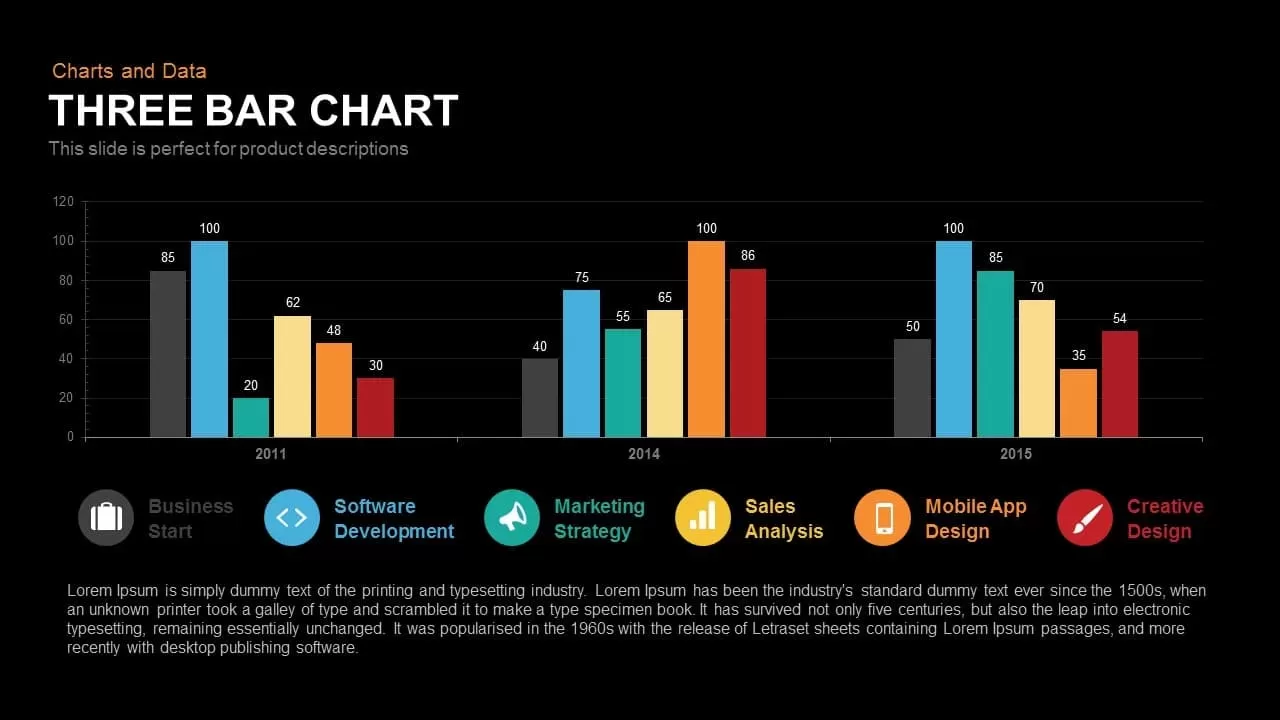
3 Bar Chart PowerPoint Template and Keynote Slide
Column and Bar chart
Premium
-

Pencil Bar Chart PowerPoint Template and Keynote Slide
Column and Bar chart
Premium
-

Multipurpose Business PowerPoint Template
PowerPoint Business Templates
Premium
-
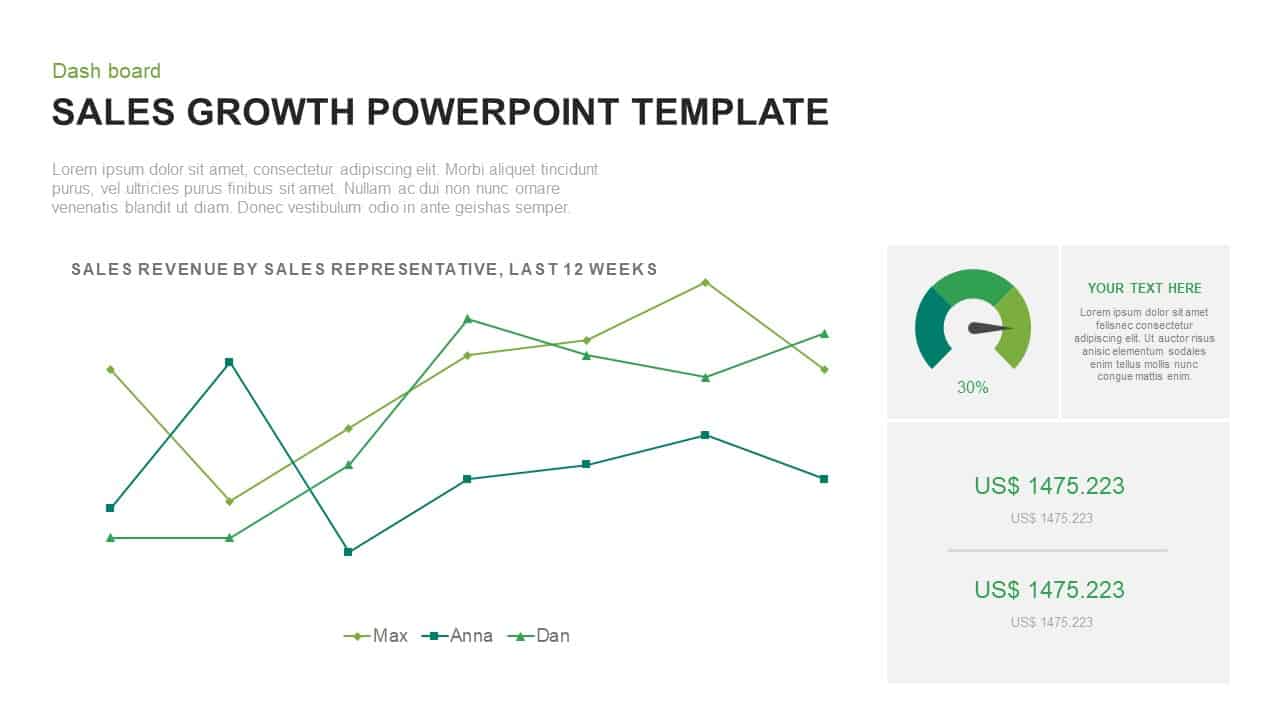
Sales Growth PowerPoint Presentation Template
Curves and Lines
Premium
-
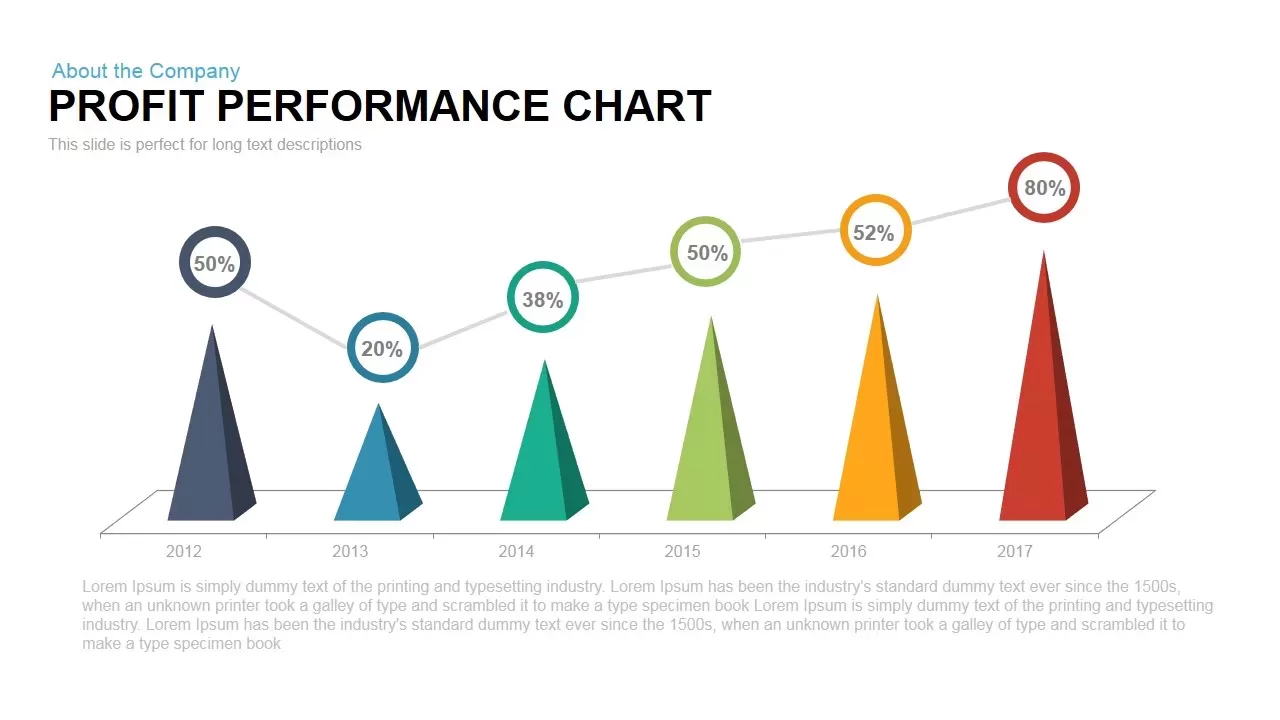
Profit Performance Chart PowerPoint Template
PowerPoint Charts
Premium
-
10 Step Flow Chart Diagram Template for PowerPoint and Keynote
Flow Charts
Premium
-
Business Core Values PowerPoint and Keynote template
Business Models
Premium
-

Animated Clustered Bar Chart PowerPoint Template
PowerPoint Charts
Premium
-
Big Data Infographic Deck For PowerPoint
PowerPoint Business Templates
Premium