This template is part of a deck featuring multiple slides. To check out all slides, click on See All.
See All
Editable data flow diagrams for PowerPoint
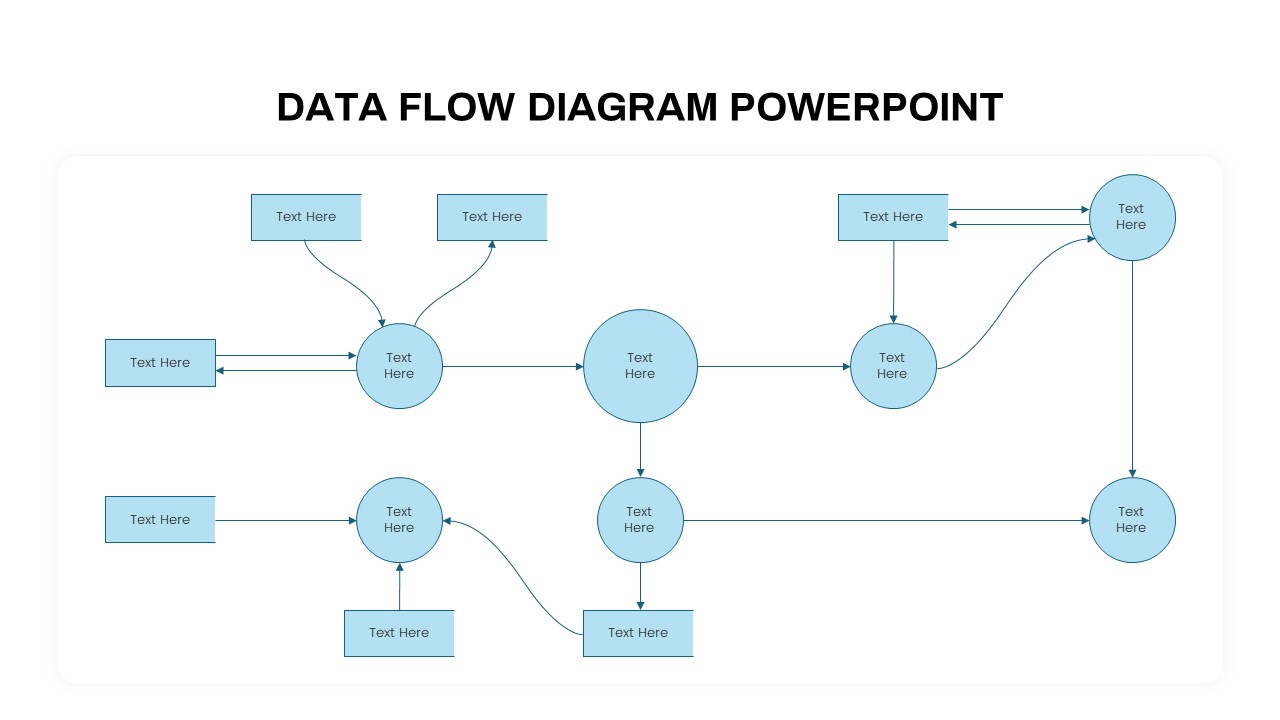
Data flow diagram PowerPoint template depicts a log data capture and workflow process. These designs are often called system flowcharts, process diagrams, workflow diagrams, data flow models, information flow diagrams, and so on. This template offers a professional, user-friendly, and visually appealing platform for illustrating data flows, systems, and processes in an easy-to-understand manner. Whether you're a project manager explaining complex workflows or a data analyst presenting data processing procedures, this template equips you with the resources to communicate with precision and impact, making your presentations effective and engaging.
How do I create a data flow diagram in PowerPoint?
Creating a data flow diagram template is straightforward. Begin by opening a new slide in your PowerPoint presentation. Then, use shapes or draw rectangles to represent the various processes or functions involved in your system. Connect these shapes using labeled arrows or lines to illustrate the flow of data between them. Be sure to label each shape to describe the specific process it represents. Include data stores, such as databases or files, as rectangles, and connect them to the relevant processes. Optionally, add external entities like users or other systems to show their interactions with the processes. To enhance clarity, apply colors and formatting, and maintain consistent labeling and notation. This will result in a professional and easy-to-understand data flow diagram in PowerPoint.
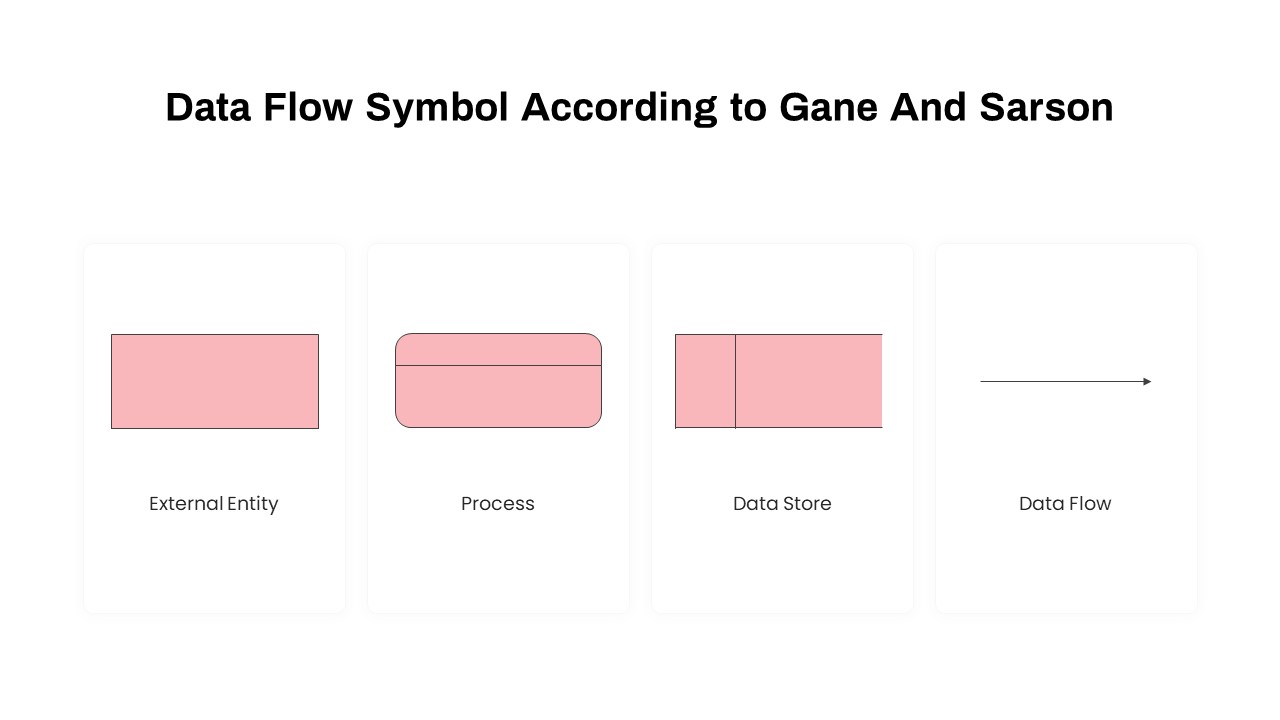
Data flow diagram symbols and meaning
Data Flow Diagrams (DFDs) utilize distinct shapes for specific purposes within a system representation. Rectangles denote processes and their functions, while arrows and lines illustrate the flow of data between system components. Open rectangles represent data stores, indicating where data is stored or retrieved, and squares with lines denote external entities interacting with the system. Labeled arrows or lines identify the type of data being transferred. Dotted lines signify control flow or sequence of operations, while text boxes serve for annotations, providing explanations and enhancing clarity in DFDs.Our Editable Data Flow Diagram for PowerPoint is perfect for a wide range of applications. Whether you need to create presentations for project management, software development, business analysis, or data architecture, this template provides you with the tools to present your data flows, systems, and processes effectively.The data flow diagram template PPT contains three slides. Among these, one is a master slide that shows the complex data flows within a system. Two slides contain flowchart shapes for a distinct presentation. Download and customize flow diagram templates for your next presentation. Also, check out our PowerPoint process diagrams and data flow diagrams.