Data Analytics Chart PowerPoint Template and Keynote Slide
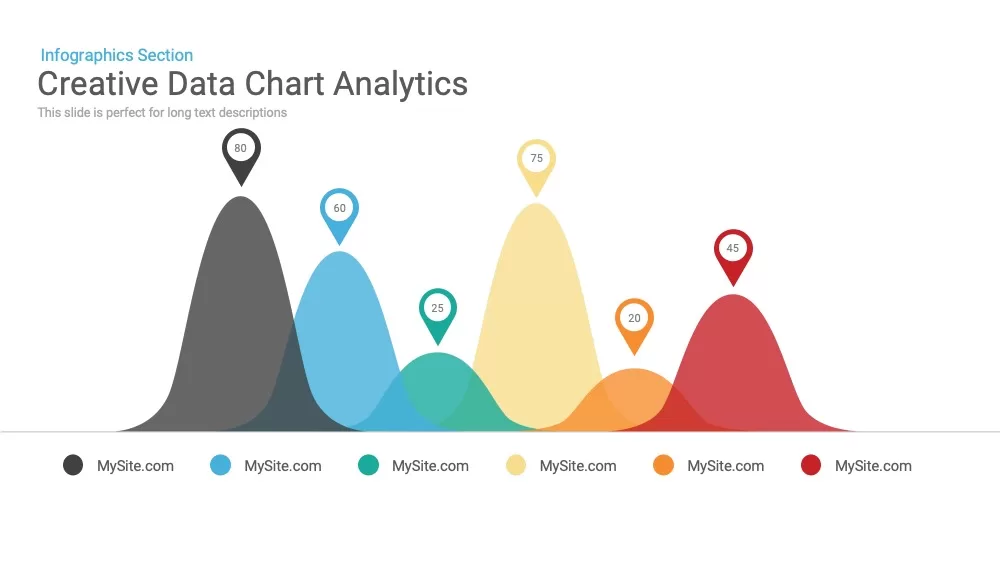
Data analytics chart powerpoint template and keynote slide shows a curved bar chart in nice transparent version. The template is designed in both powerpoint and keynote with 16:9 and 4:3 aspect ratio.
Data analytics chart powerpoint template and keynote slide created for serious presentation with the
wave bar PowerPoint shape template. This is an excellent alternative to the usual bar, pie, line and other type of charts. Its picturization similar to the sound waves gives a memorable and interesting feel to your presentation while upholding simplicity. The design of template enables the audience to focus on a single image. This method helps the viewers to maintain their focus between the figure and the host. It will take them just a few seconds to consider the design and then anticipate a statement from the user. This
PowerPoint template is ideal for presenting business trends such as sales monitoring, stock charts, and market analysis. The waves are created using PowerPoint objects, user can edit the properties. The color codes are configurable, so user can alter the background themes functionality in PowerPoint presentation.
Each bell type curve can be combined with any of our infographic icons or any of our shapes from our numerous
PowerPoint shapes gallery. It is ideal to show the historical movement of a stock and its market returns. The percentage of investor returns and chronology of stocks up and down movements can be illustrated in a precise fashion. Academic presentations are also very applicable to this PowerPoint template. Its engaging design enables easy learn, and help the students to study different mathematical functions. The cosine wave produces image like a sound wave. Hence this chart is perfect to show auditory sensations and the theory of “absolute threshold”. This template is available with two backgrounds and different color combination charts, users can alter the color and background without any distraction on the default design. Charts and data enable quick understanding of the presentation subject. Users can search more charts and data templates with analytical values on
slidebazaar.com.