


Curved Line Graph PowerPoint Template and Keynote Slide


- Version
- Download 222
- File Size 0.00 KB
- File Count 1
- Create Date January 29, 2016
- Last Updated February 15, 2024
Curved Line Graph PowerPoint Template and Keynote Slide
Curved Line Graph PowerPoint Template and Keynote Slide
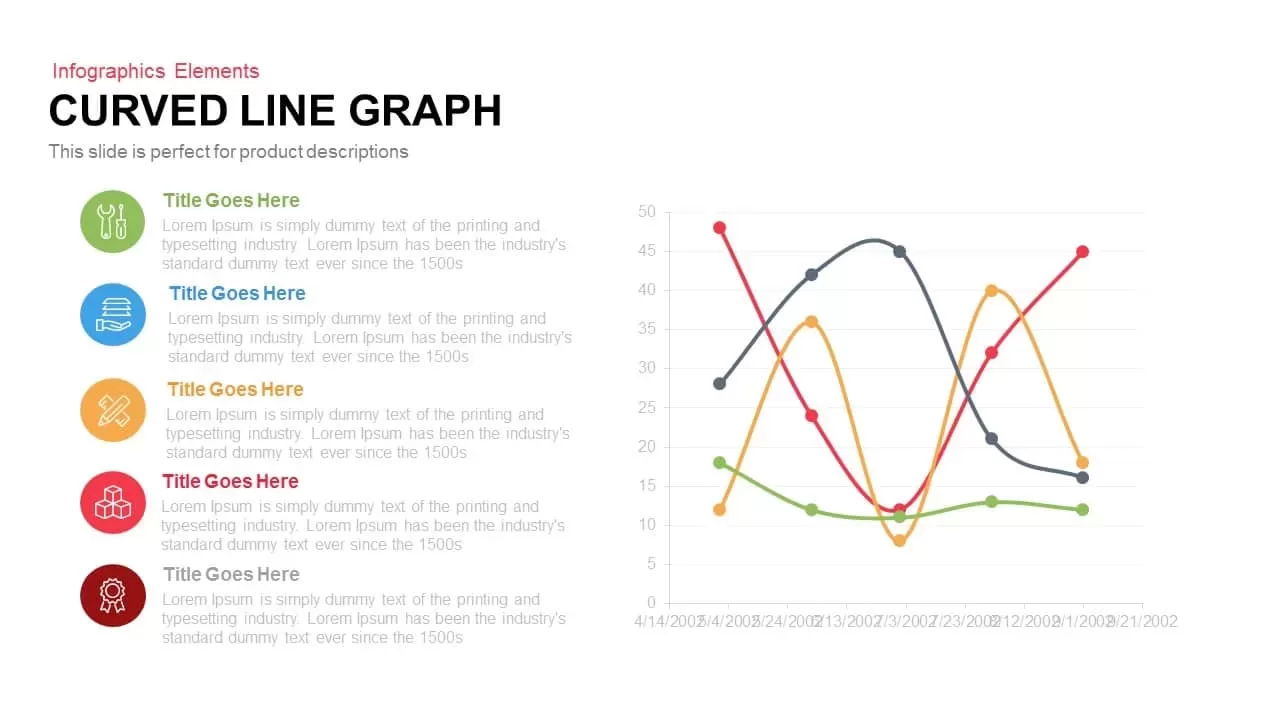
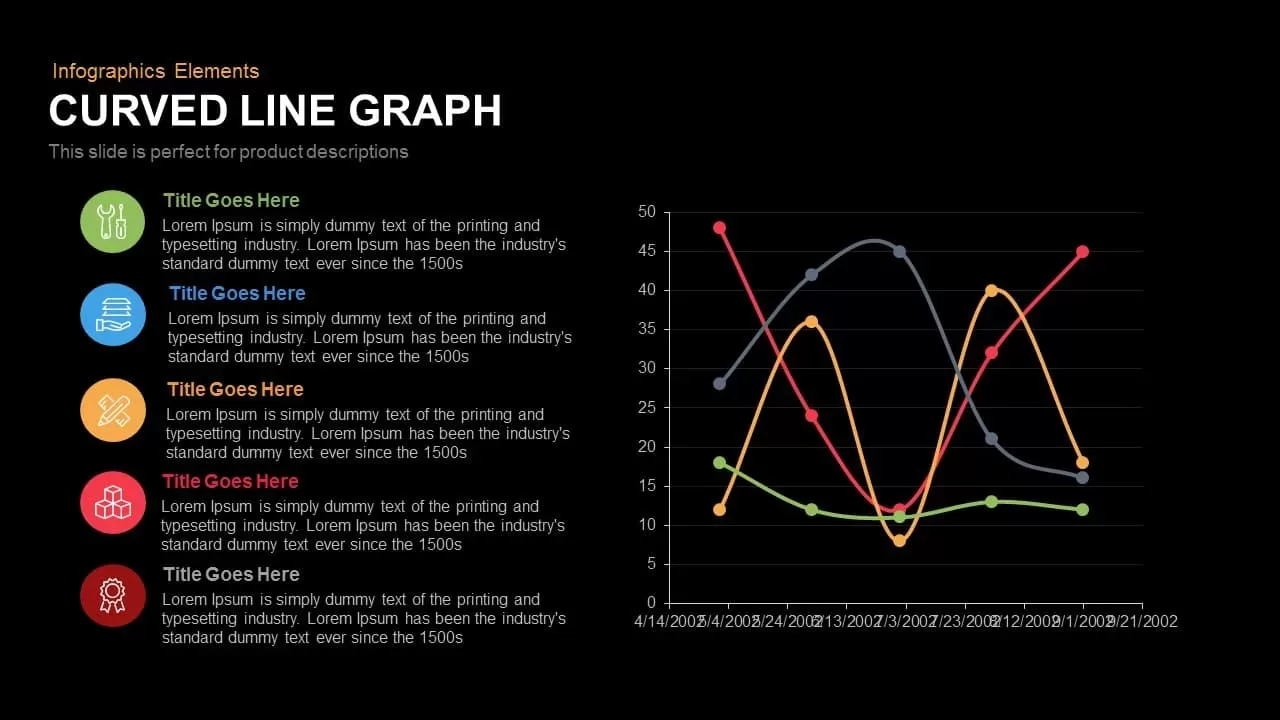
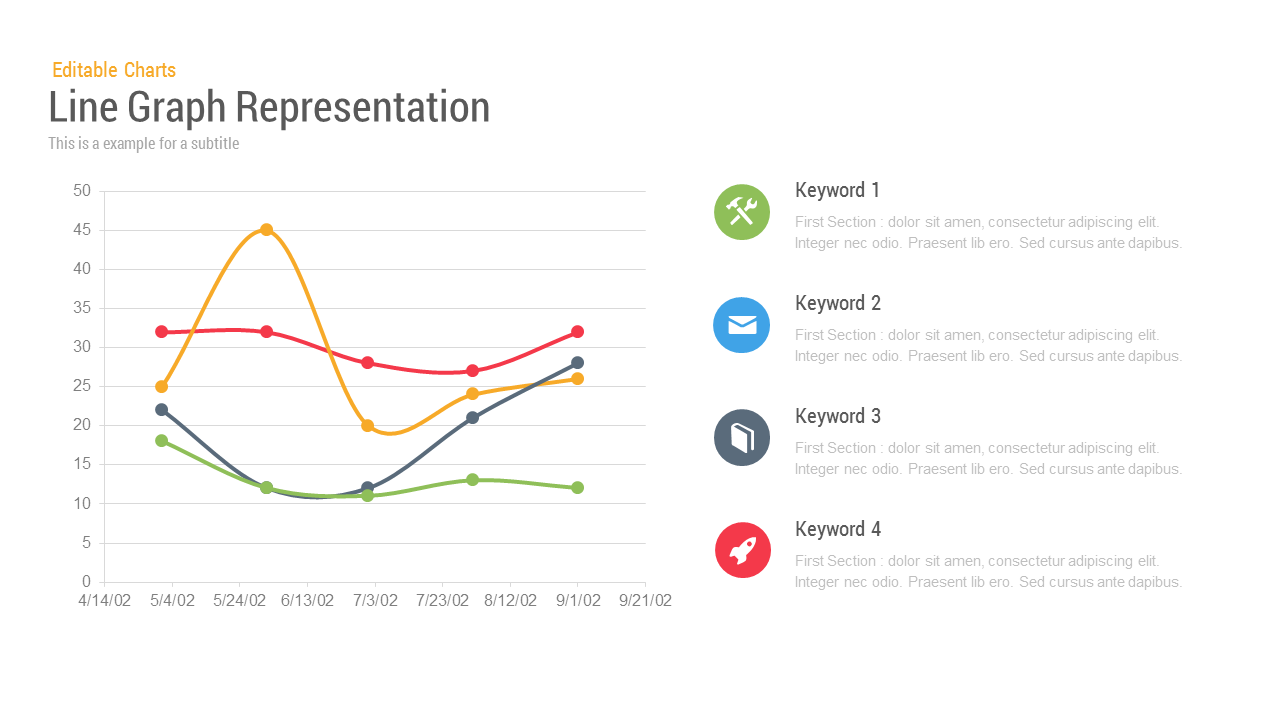
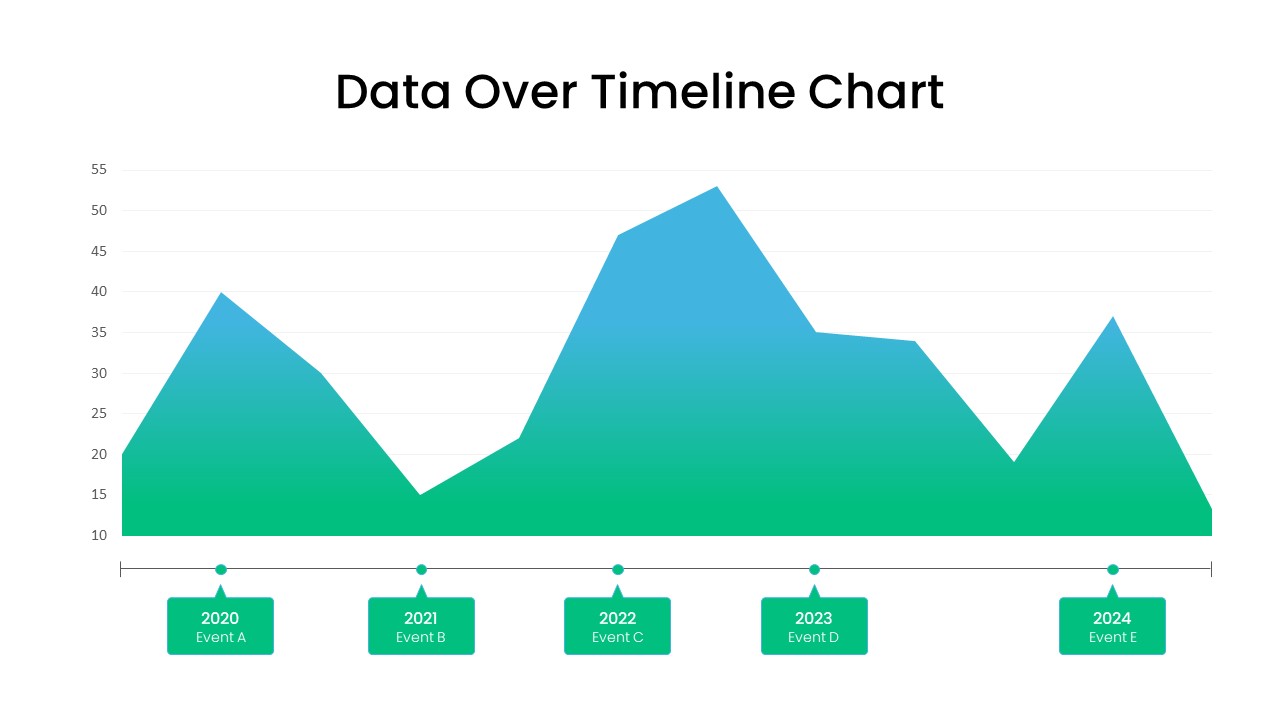
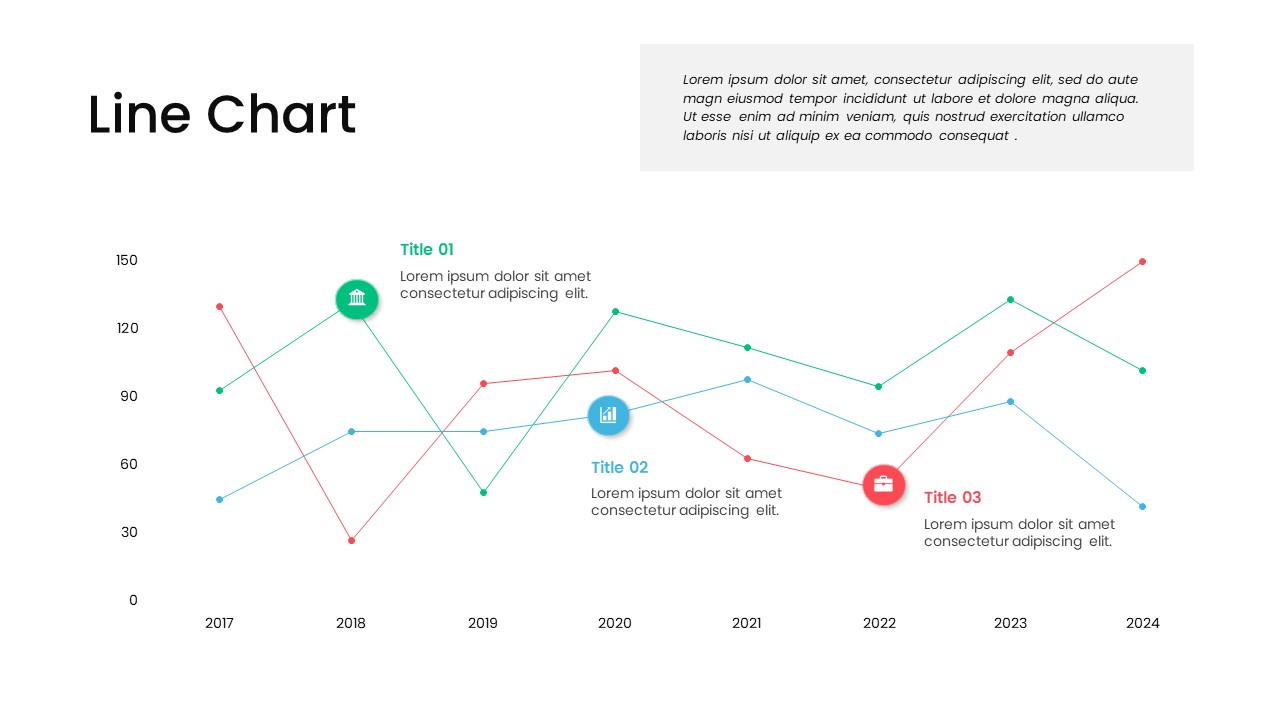
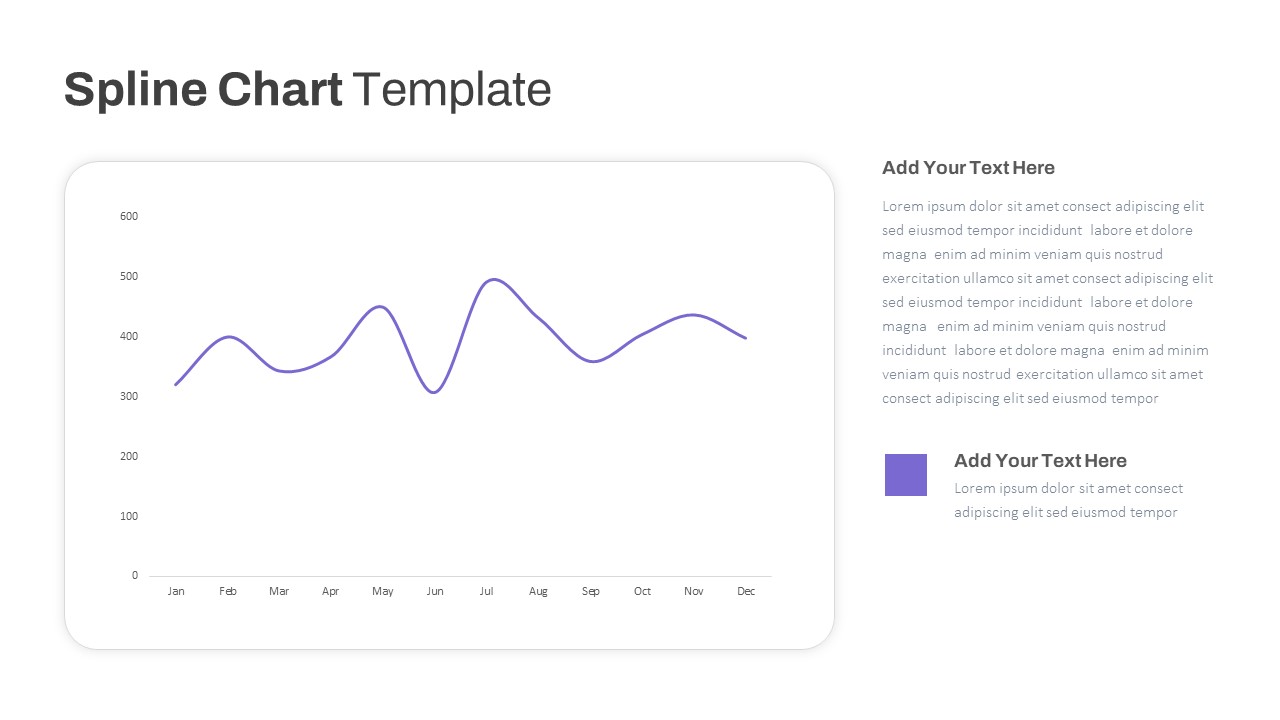
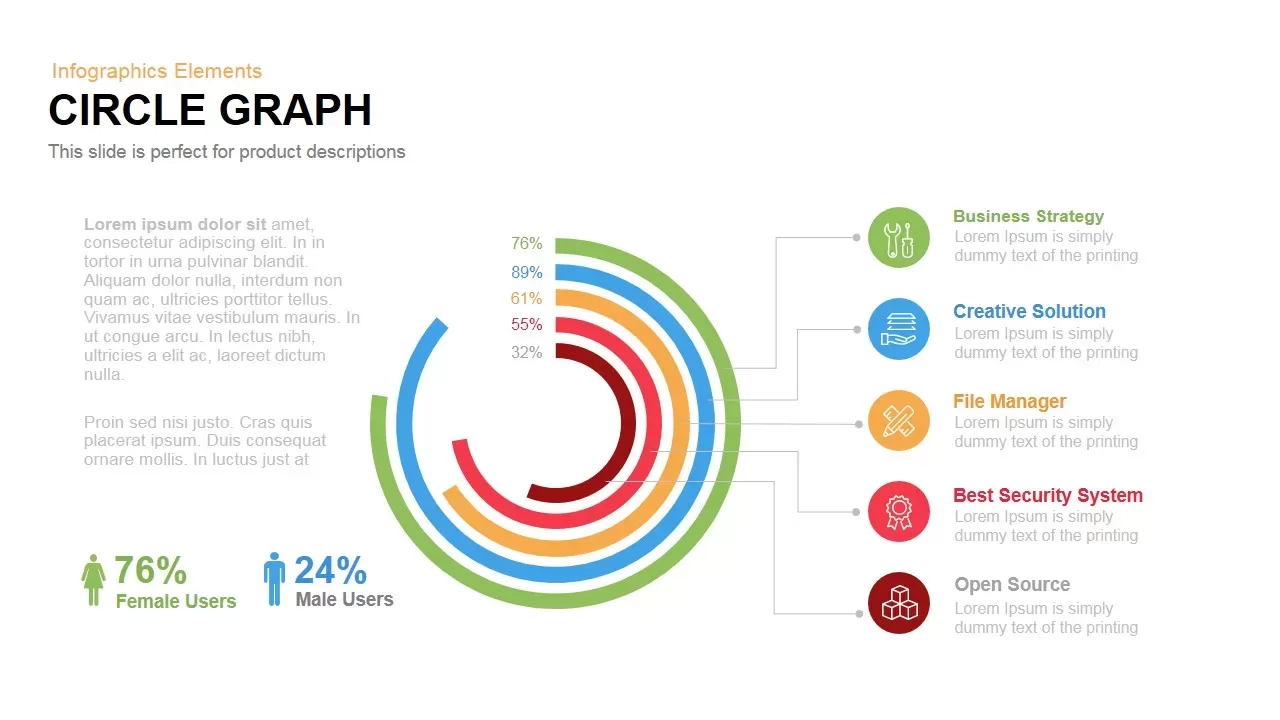
Curved line graph PowerPoint template and keynote slide created with multiple line graphs. Research data is a set of quantitative or qualitative information. Data can be analyzed in many different ways. Line graph PowerPoint template enables you to analyze numerical data using line graphs. Generally, multiple line graphs are used to display trends over time. In the line graph, each data value is being presented by a point in the graph that is linked by a line. In this curved graph template, there are four distinctly colored lines in the graph connecting multiple sets of data points. The independent variable is listed along the parallel, or x, axis and the quantity or value of the data are listed along the vertical, or y, axis. This PowerPoint diagram can be used to monitor sales or revenue over different periods.
The analyzed data can be the monitor on the left side of the multiple graph PowerPoint template. Each text placeholder is represented by infographic icons. This line graph template is ideal for both research purposes and academic purposes. Demographers and economists can download this diagram to show the different value propositions. The amount of population growth and proportion of employment generation can be displayed using the curved line graph.
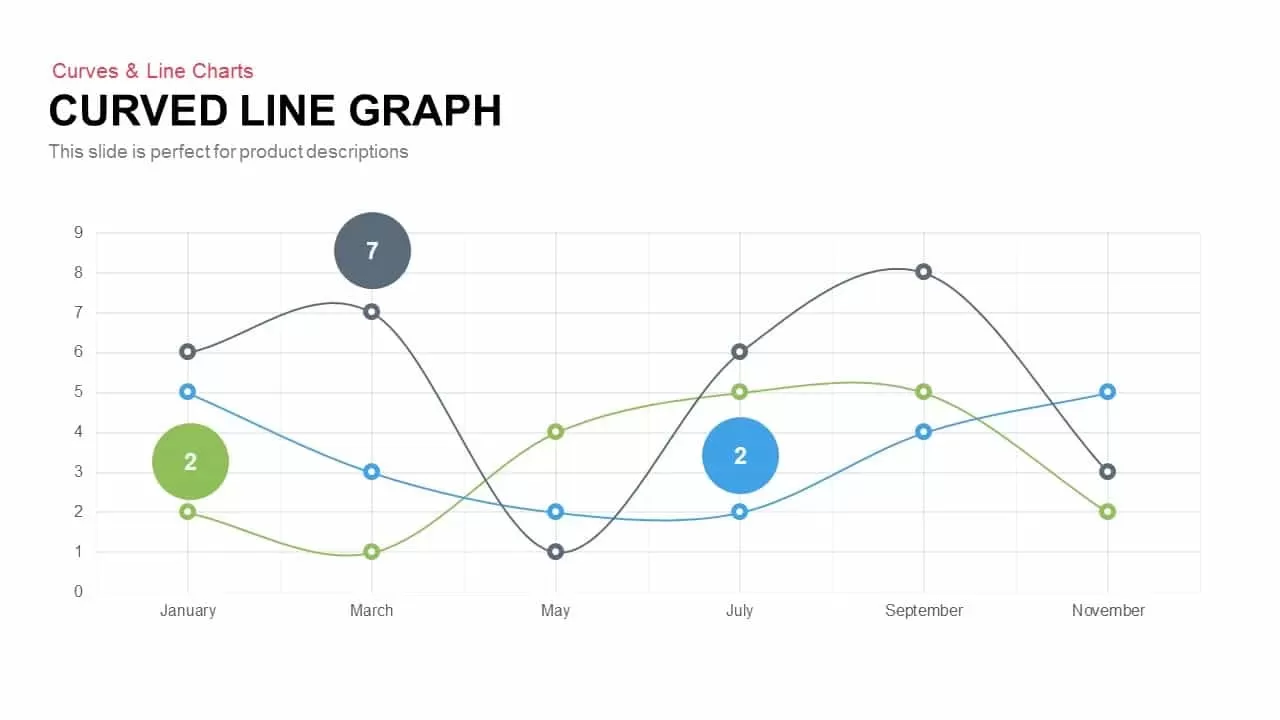
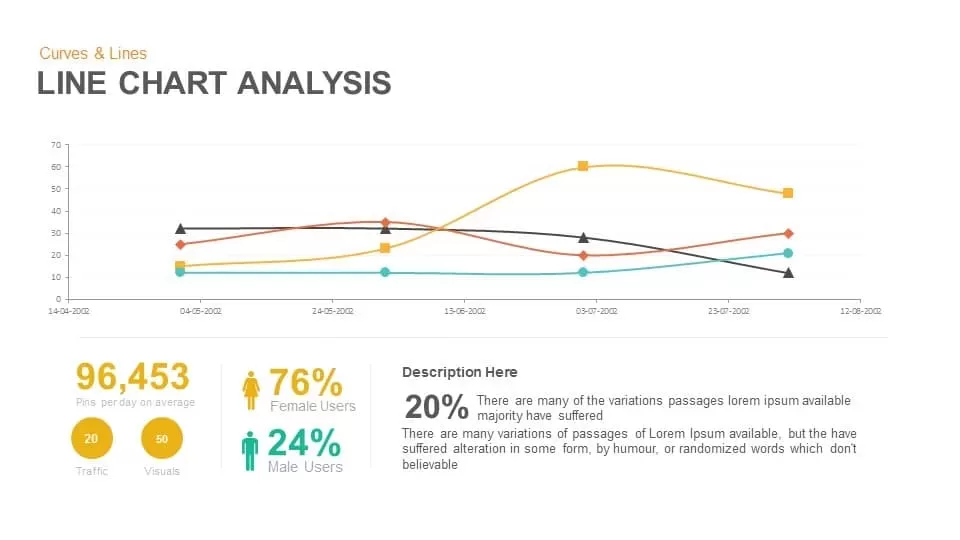
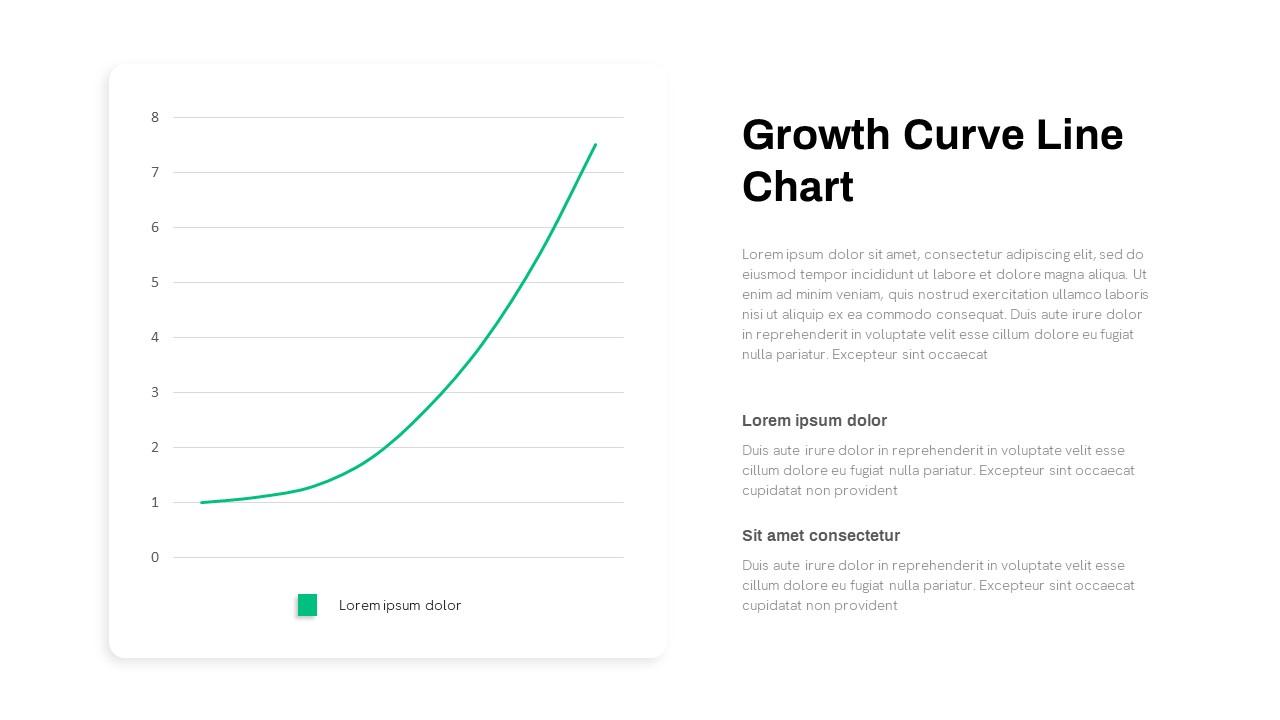
Curved Line Graph PowerPoint template has a sequence of data against a number of elements in a graph and they are joined by a line. Reliant on the data value the line can be curved and appear in various shapes. The Curved Line Graph will have an X and Y axis; the graph takes shape with the data value. It can be used to find out the trend or statistics of your company or business, or customer buying trends, product profit, consumer buying habits, growth of the company, etc. over a period of time. A graph at any point of time adds value to your presentation. Hence, the arched line graph can be a positive supplement to your presentation and will surely gain the attention of the audience. Our researchers and designers are engaged to generate further charts and data diagrams for incredible statistical presentation. The template is designed in both PowerPoint and keynote in both the aspect ratio 4:3(Normal) and 16:9 (widescreen).
Attached Files
| File |
|---|
| https://premiumdownloads.s3.amazonaws.com/SB00165-Curved-Line-Graph.zip |
Login to download this file
Add to favorites
Add to collection
-

Category
-

Item ID
SB00165 -

Related Templates
-

Research Proposal PowerPoint Template
PowerPoint Templates
Premium
-

Free Nursing Capstone PowerPoint Deck
PowerPoint Templates
Free
-

Nature PowerPoint Presentation Template
PowerPoint Business Templates
Premium
-

Sales Deck Free PowerPoint Template
PowerPoint Templates
Free
-

Cab Service PowerPoint Template
PowerPoint Templates
Premium
-

Free Vertical PowerPoint Template
PowerPoint Business Templates
Free
-

VET Clinic PowerPoint Template
PowerPoint Templates
Premium
-

Free Space Minimal Deck Template
PowerPoint Templates
Free
-

Free Physical Education PowerPoint Template Deck
Free PowerPoint Templates
Free
-

Travel Agency PowerPoint Template
PowerPoint Templates
Premium
-

IoT Presentation Template
PowerPoint Templates
Premium
-

Gym PowerPoint Template
PowerPoint Templates
Premium
-

Graph Paper PowerPoint Template Deck
PowerPoint Templates
Premium
-

Effective Communication PowerPoint Template
PowerPoint Templates
Premium
-

PowerPoint Quiz With Timer
PowerPoint Templates
Premium
-
Curved Line Graph PowerPoint Template and Keynote
Curves and Lines
Premium
-

Free Real Estate Listing PowerPoint Template
Free PowerPoint Templates
Free
-
Multiple Line Chart PowerPoint Template
PowerPoint Charts
Premium
-
Line Chart Representation PowerPoint Templates and Keynote Slides
PowerPoint Charts
Premium
-

Free Economics PowerPoint Template
Free PowerPoint Templates
Free
-

Macroeconomics PowerPoint Template
PowerPoint Templates
Premium
-

Free Army PowerPoint Template
PowerPoint Templates
Free
-
Line Chart Analysis PowerPoint Template and Keynote Slide
Curves and Lines
Premium
-

Customer Experience Loyalty PowerPoint Deck Template
PowerPoint Templates
Premium
-

Free Charity PowerPoint Template Deck
PowerPoint Templates
Free
-

Free Aviation PowerPoint Template
Free PowerPoint Templates
Free
-

Free University Presentation PowerPoint Template
PowerPoint Templates
Free
-

Free Cartoon PowerPoint Template
Free PowerPoint Templates
Free
-
Evolution Line Chart PowerPoint Template
PowerPoint Templates
Premium
-

Animated Agriculture PowerPoint Deck Template
PowerPoint Templates
Premium
-

Free Event Planning PowerPoint Template
Free PowerPoint Templates
Free
-

Free Book Review PowerPoint Template
Free PowerPoint Templates
Free
-

Annual Report PowerPoint Template and Keynote
PowerPoint Templates
Premium
-

Global Warming Infographic PowerPoint Template Deck
PowerPoint Templates
Premium
-

Data Science PowerPoint Template
PowerPoint Templates
Premium
-
Data Driven Line Chart Template for PowerPoint & Keynote
Curves and Lines
Premium
-
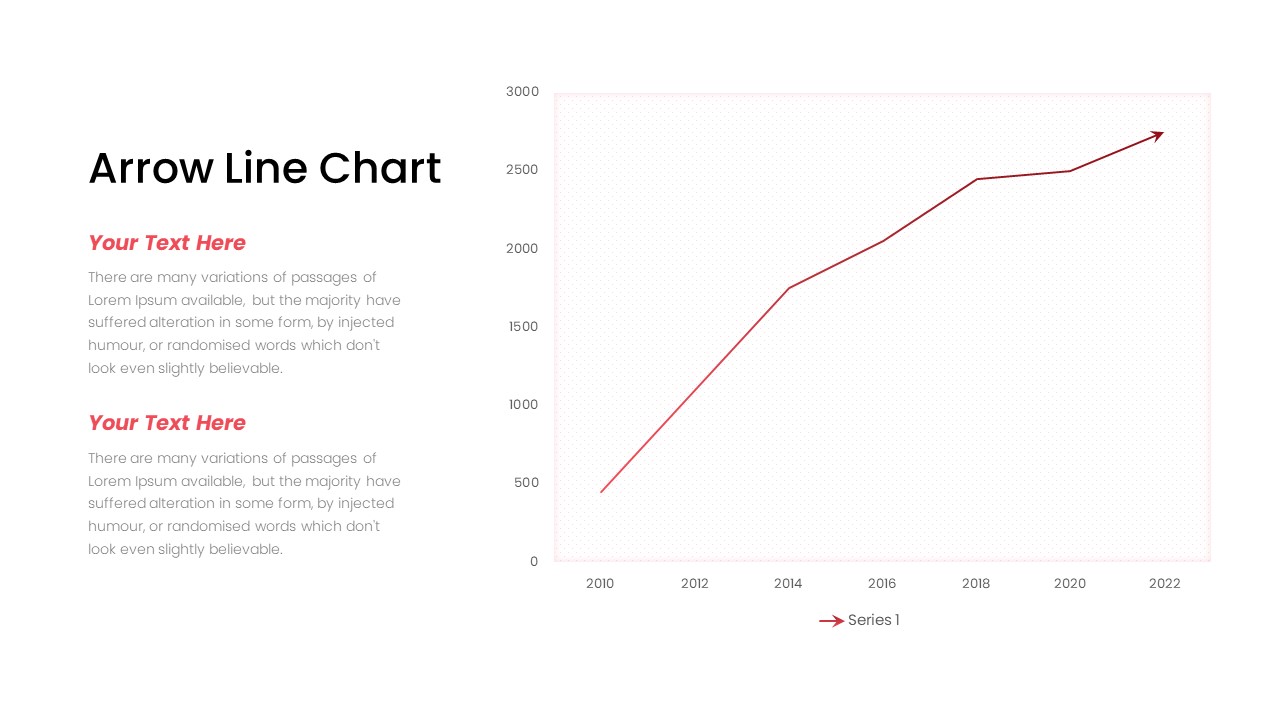
Arrow Line Chart PowerPoint Template
Arrow Diagrams
Premium
-

Free Charts and Graphs PowerPoint Template
PowerPoint Templates
Free
-

Real Estate PowerPoint Theme
PowerPoint Themes
Premium
-

EFQM Model PowerPoint Template
PowerPoint Templates
Premium
-
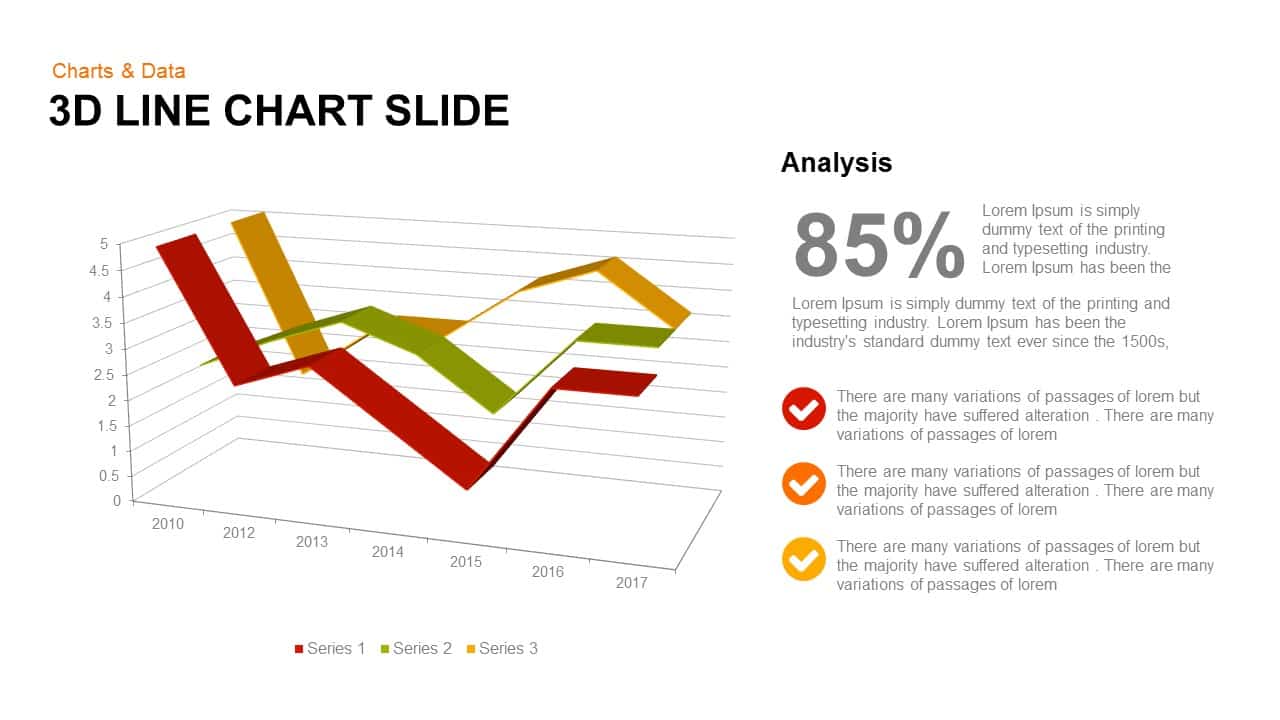
3d Line Chart PowerPoint Template and Keynote Slide
3D Shapes
Premium
-
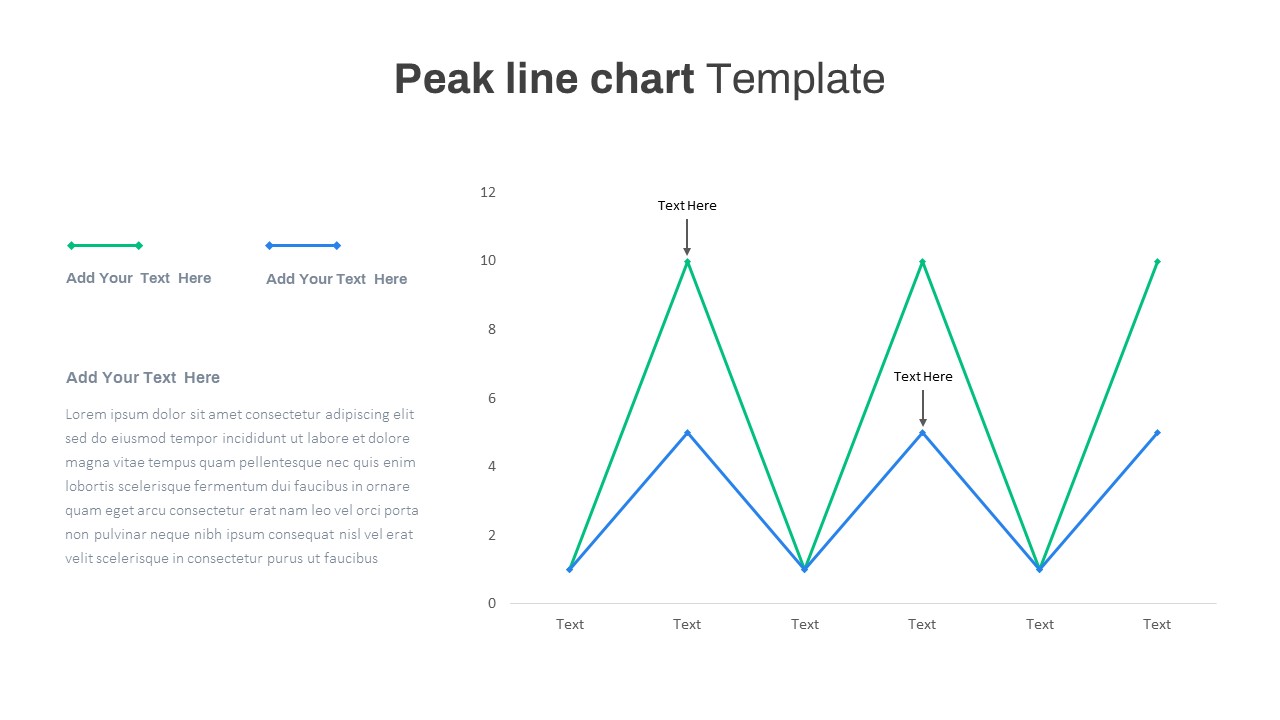
Peak Line Chart PowerPoint Template
PowerPoint Charts
Premium
-
Free Charts & Graphs Deck PowerPoint Template
PowerPoint Templates
Free
-

Free Dunder Mifflin Paper Company Pitch Deck
Free PowerPoint Templates
Free
-
Data Over Time Line Chart PowerPoint Template
PowerPoint Charts
Premium
-
Jump Line Chart PowerPoint Template
Column and Bar chart
Premium
-

Free AI Artificial Intelligence PowerPoint Template
PowerPoint Templates
Free
-

Stakeholder Register PowerPoint Template
PowerPoint Templates
Premium
-
Research Roadmap PowerPoint Template
PowerPoint Templates
Premium
-
Line Chart PowerPoint Template
PowerPoint Charts
Premium
-

Business Process Reengineering Template
PowerPoint Templates
Premium
-

Biotechnology PowerPoint Presentation Template
PowerPoint Templates
Premium
-
Spline Chart PowerPoint Template
PowerPoint Charts
Premium
-

Animated Upcoming Event Poster PowerPoint Template
PowerPoint Templates
Premium
-
Sales Growth PowerPoint Presentation Template
Curves and Lines
Premium
-

Combination Chart PowerPoint Template
PowerPoint Charts
Premium
-

Research PowerPoint Template and Metaphor Keynote Template
Keynote Templates
Premium
-

Open Door Policy PowerPoint Template
PowerPoint Templates
Premium
-

Research Presentation PowerPoint Template Free
PowerPoint Templates
Free
-
CAPM Model Template
Curves and Lines
Premium
-
3D Printing Deck PowerPoint Template
PowerPoint Templates
Premium
-
Circle Graph PowerPoint Template and Keynote Slide
Business Models
Premium
-

Multipurpose Business PowerPoint Template
PowerPoint Business Templates
Premium
-

Pencil Bar Chart PowerPoint Template and Keynote Slide
Column and Bar chart
Premium
-
3d Bar Graph PowerPoint Template and Keynote Slide
Diagrams
Premium
-
Growth Curve Line Chart PowerPoint Template
Curves and Lines
Premium
-
Market Research PowerPoint Template Free
PowerPoint Templates
Free
-
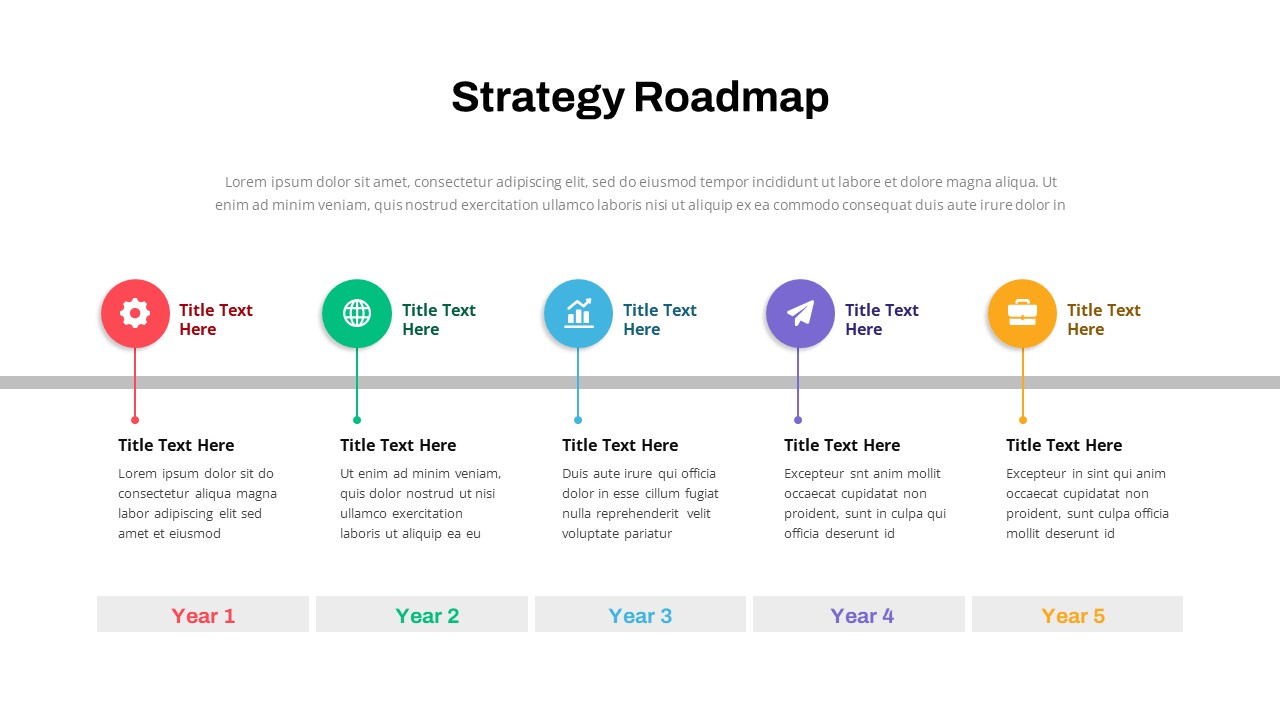
Data Strategy Roadmap PowerPoint Template
PowerPoint Templates
Premium
-

Power Analogy Metaphor PowerPoint Template
Metaphor, Simile & Analogy
Premium
-
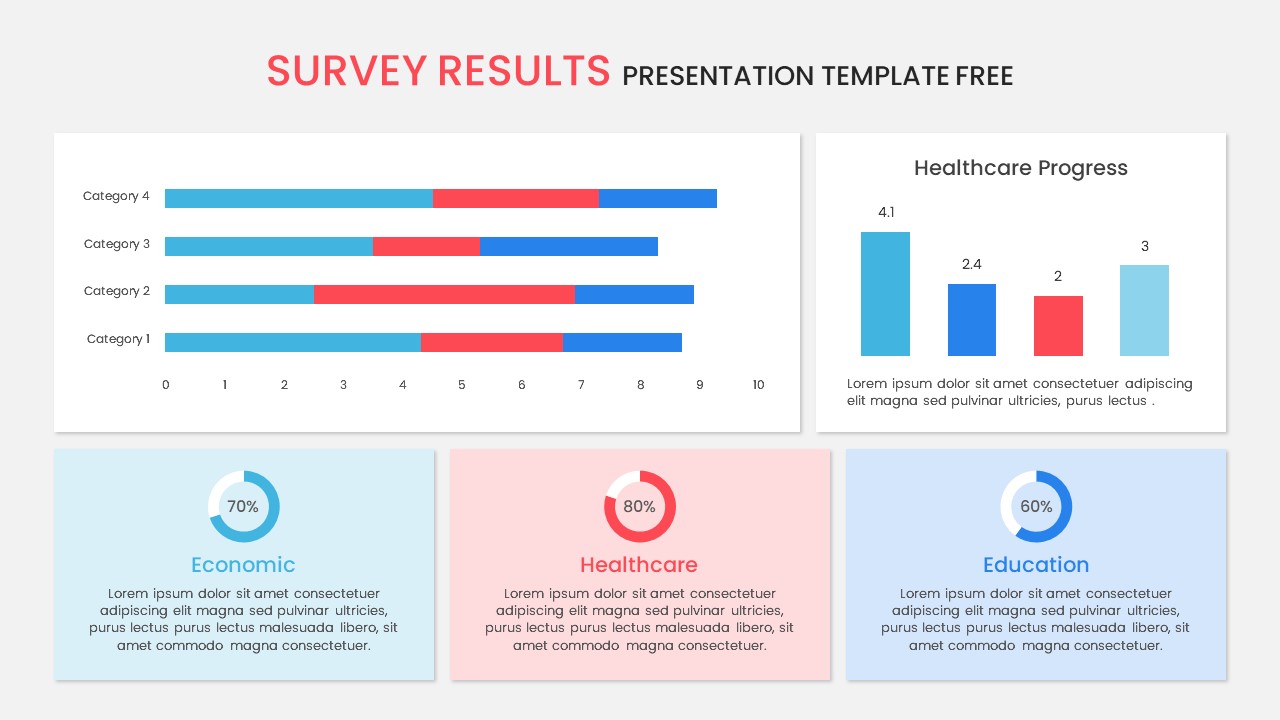
Survey Results PowerPoint Template Free
Free PowerPoint Templates
Free
-
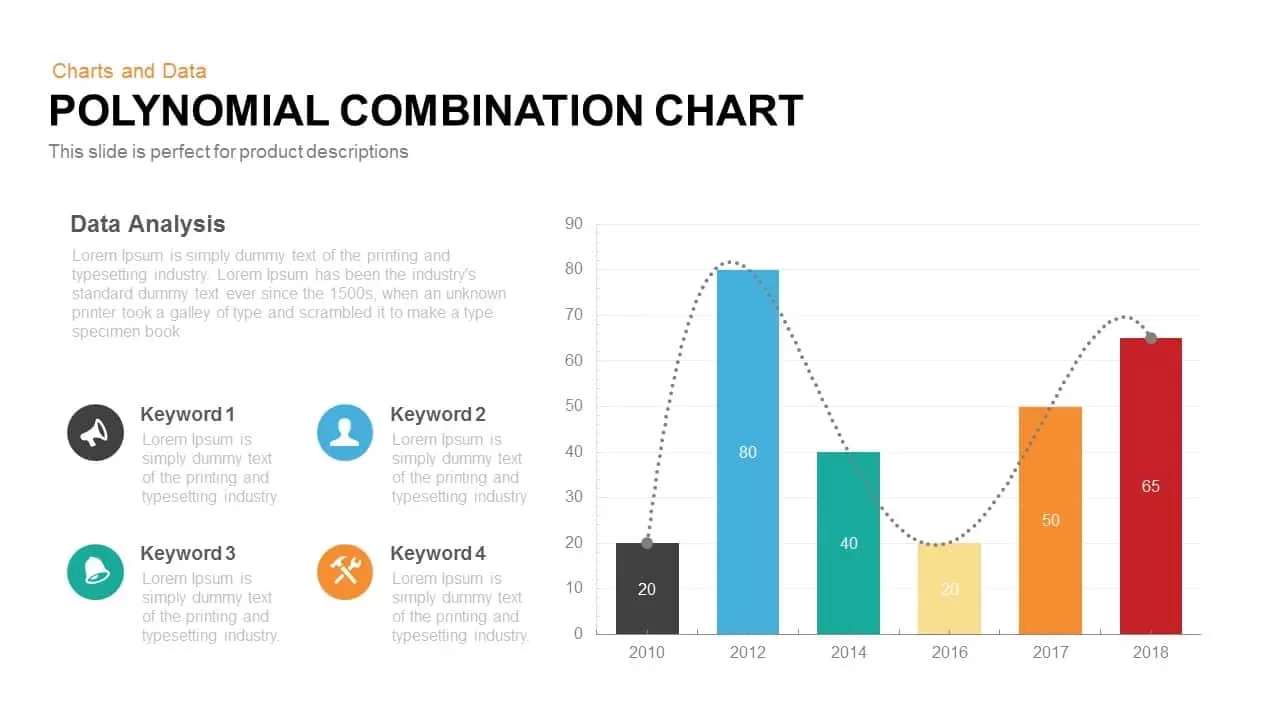
Polynomial Combination Chart PowerPoint Template and Keynote Slide
Column and Bar chart
Premium
-
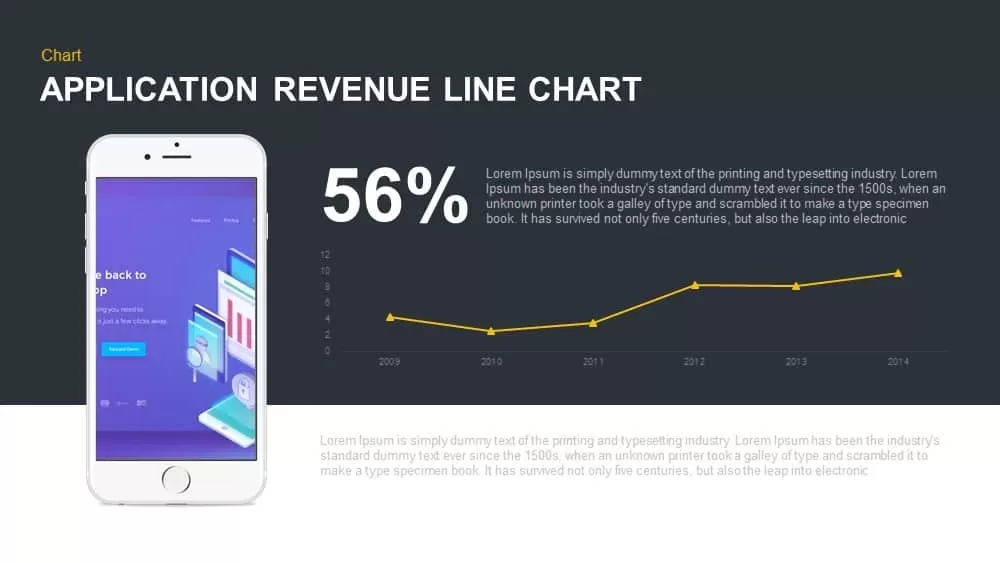
Application Revenue Line Chart PowerPoint Template and Keynote
Keynote Templates
Premium
-
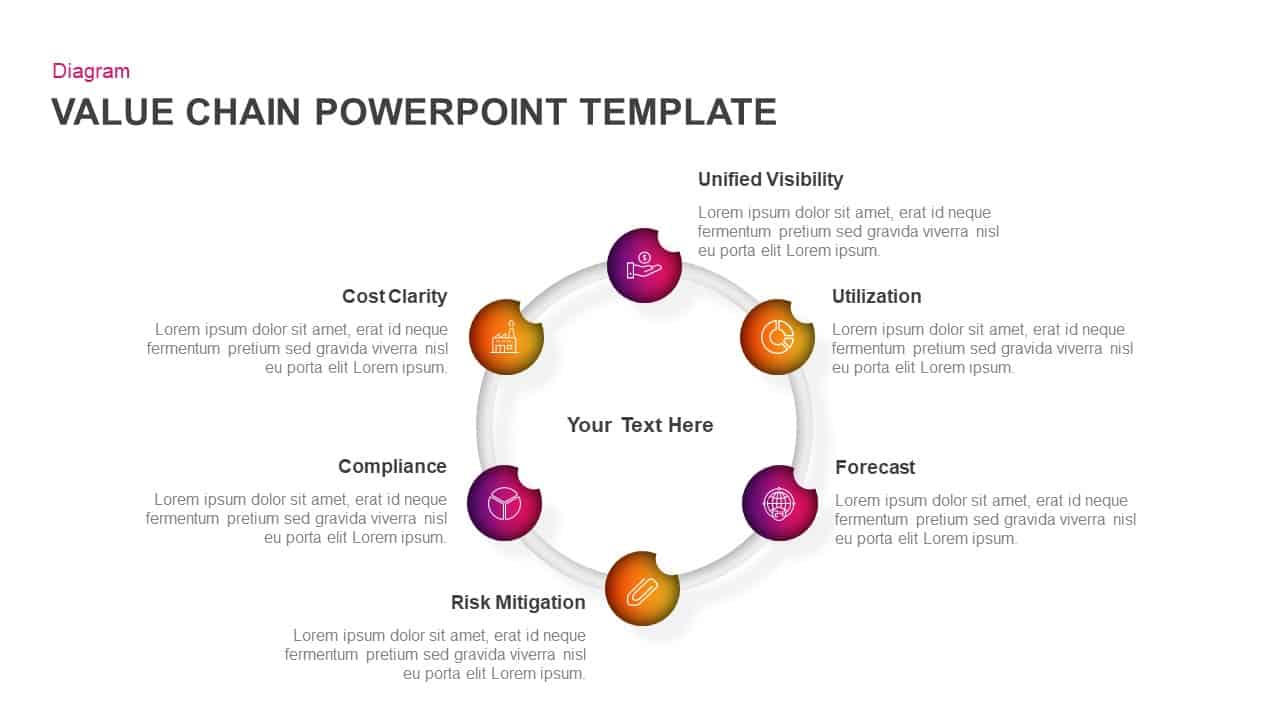
Value Chain Ppt Template for PowerPoint & Keynote
Circular Diagrams
Premium
-
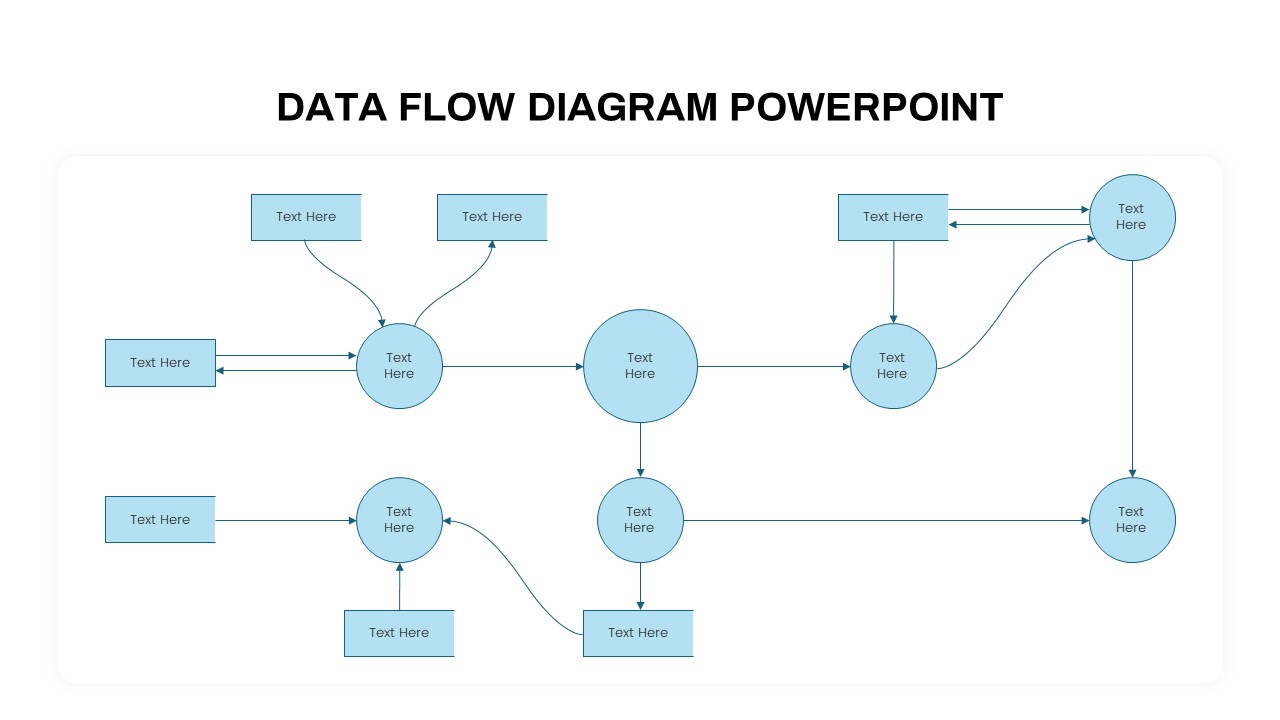
Data Flow PowerPoint Presentation Template
PowerPoint Templates
Premium
-
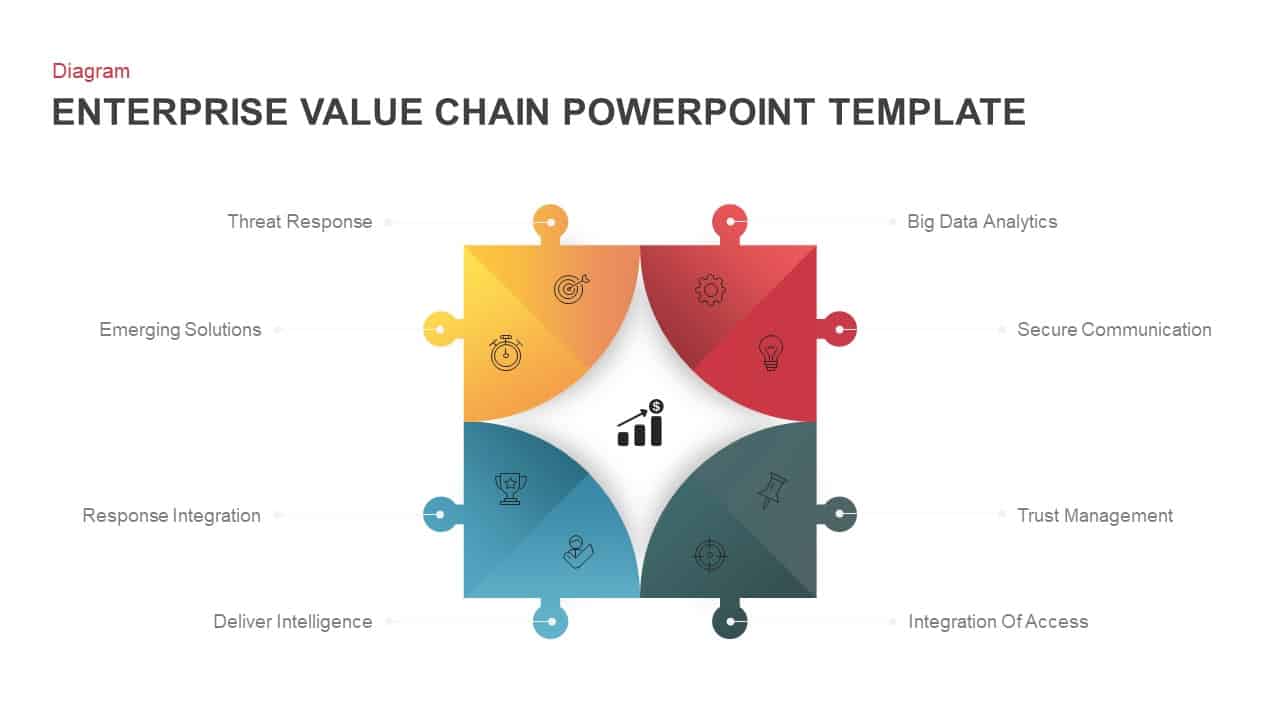
Enterprise Value Chain PowerPoint Template & Keynote
Business Models
Premium
-
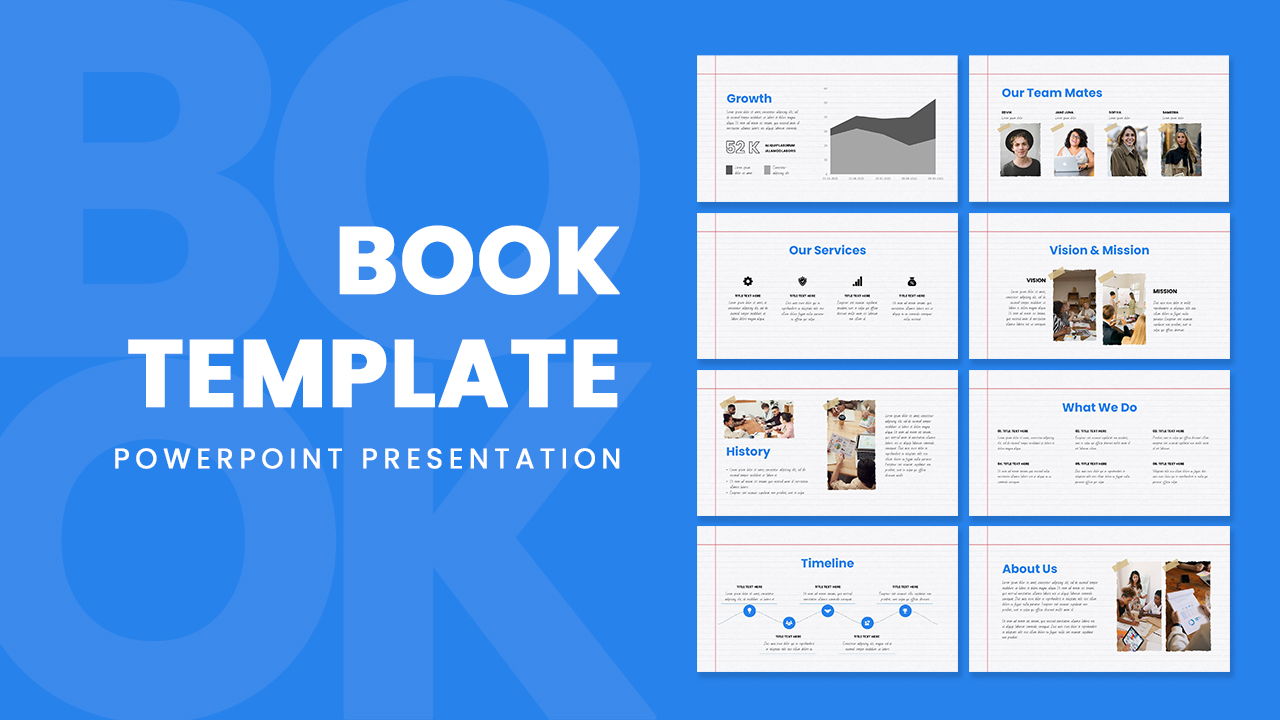
Free PowerPoint Book Template
Free slides
Free
-
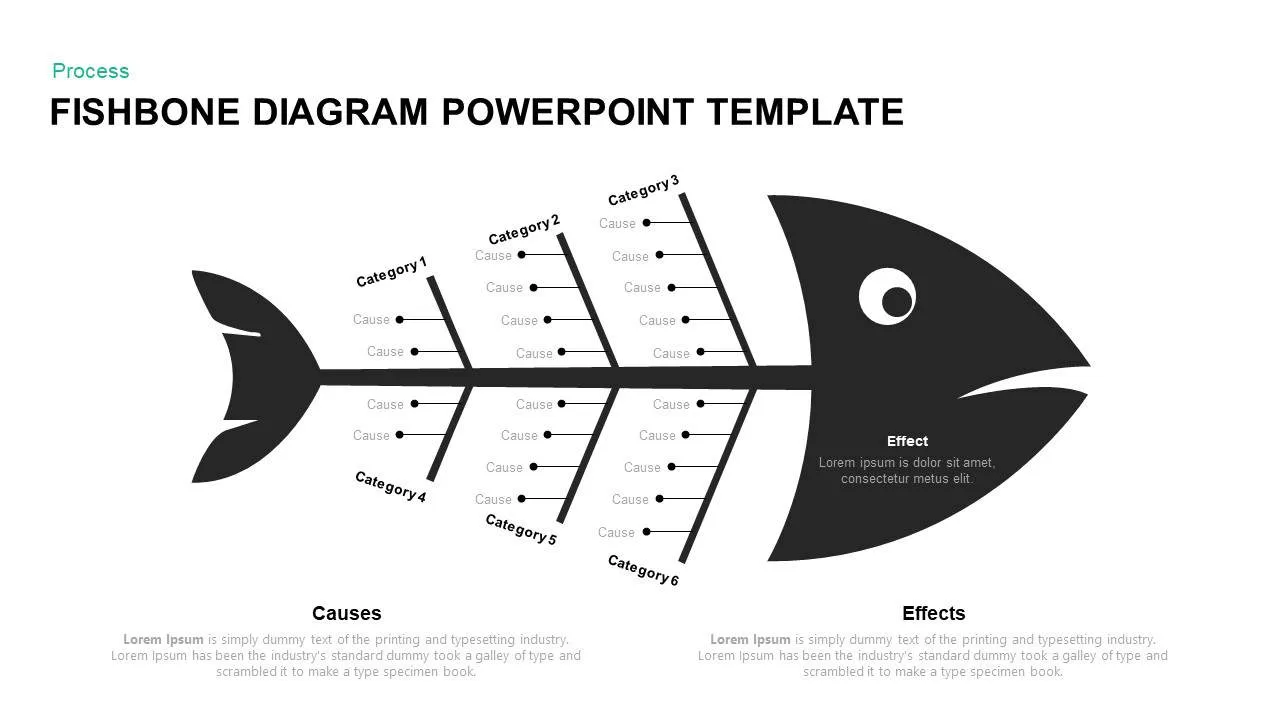
Fishbone Diagram Template PowerPoint and Keynote
Fishbone PowerPoint Templates
Premium
-

Case Study PowerPoint and Keynote Template
PowerPoint Templates
Premium
-

Finance Consulting PowerPoint Template
PowerPoint Templates
Premium
-
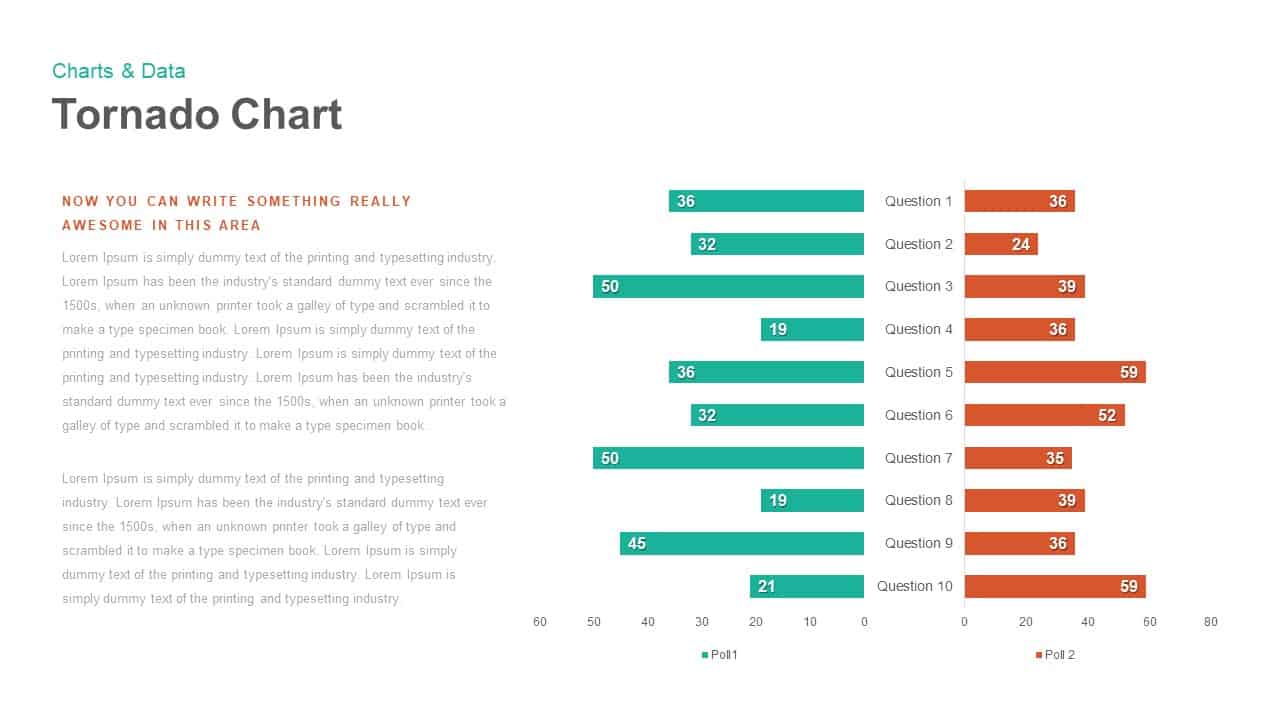
Tornado Chart PowerPoint template and keynote Slide
Diagrams
Premium
-
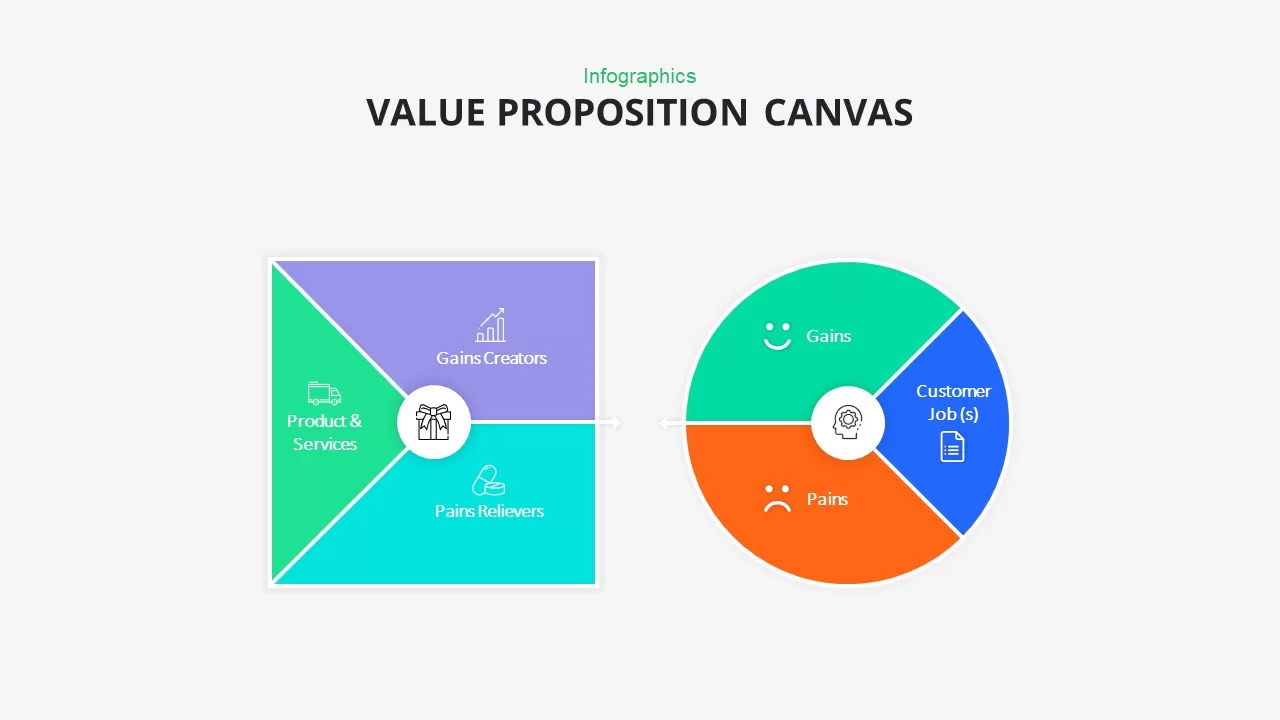
Value Proposition Canvas PowerPoint Template
Diagrams
Premium
-
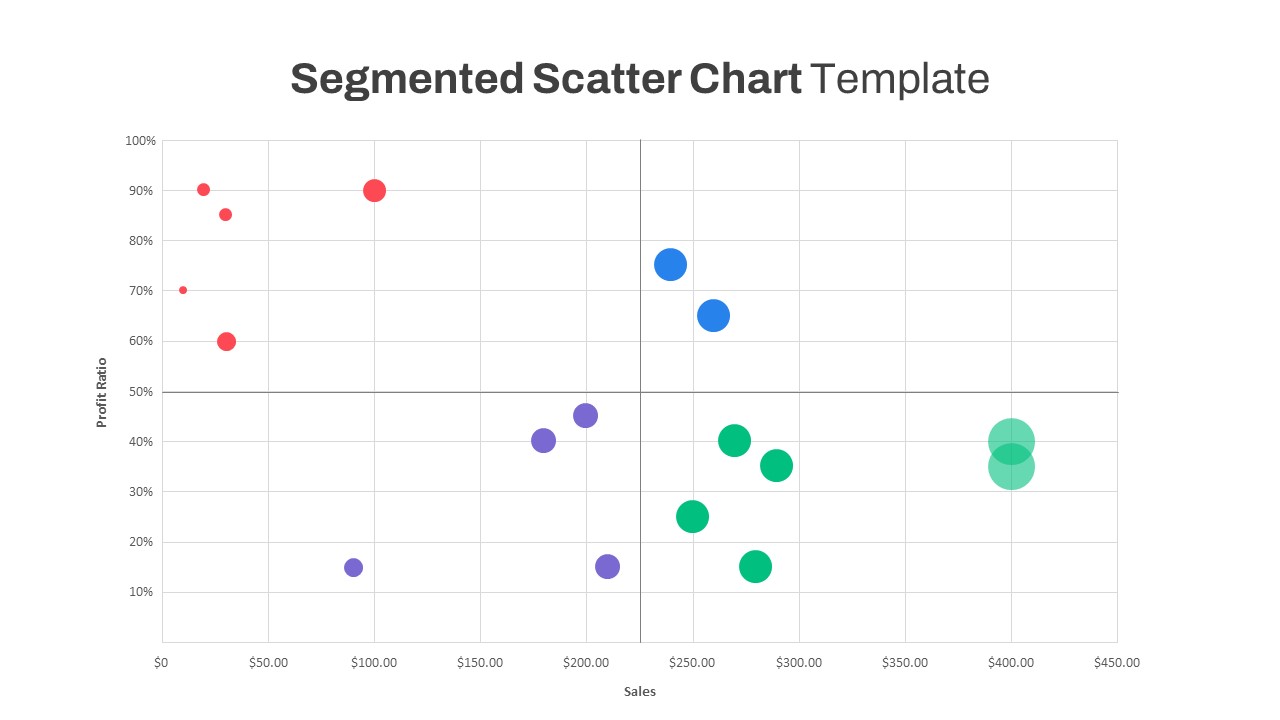
Segmented Scatter Chart PowerPoint Template
PowerPoint Charts
Premium
-

Cyber Monday PowerPoint Template
PowerPoint Business Templates
Premium
-
Value Based Management Template
PowerPoint Templates
Premium
-

Creative Studio PowerPoint Template
PowerPoint Business Templates
Premium
-

Clustered Column Chart PowerPoint Template
PowerPoint Charts
Premium
-
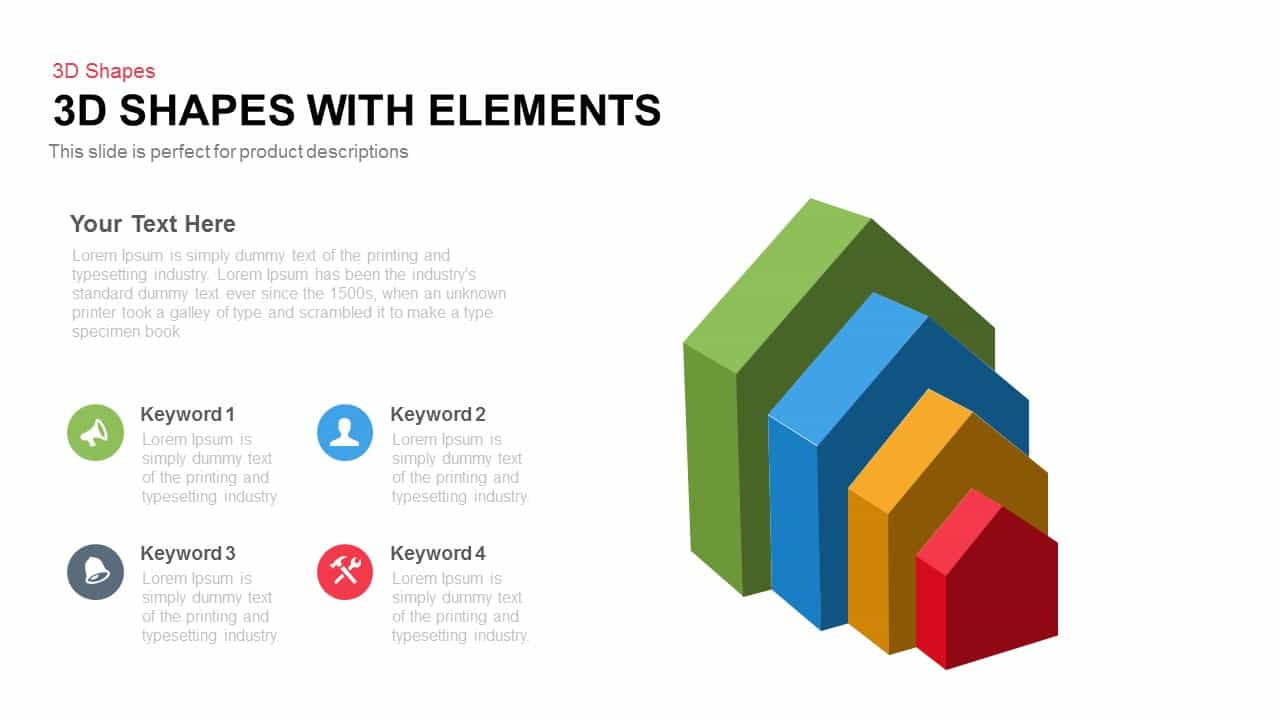
4 Pointer Slide with 3D graph element
3D Shapes
Premium
-
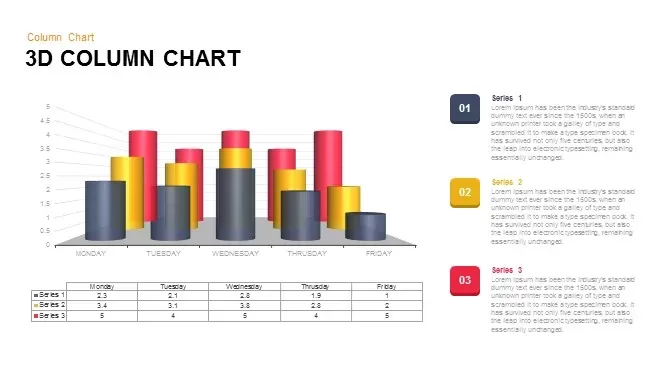
3D Column Chart for PowerPoint and Keynote Presentation
PowerPoint Charts
Premium
-

Proportional Area Chart PowerPoint Template
PowerPoint Templates
Premium
-

Dashboard Template for PowerPoint Presentation
PowerPoint Charts
Premium
-
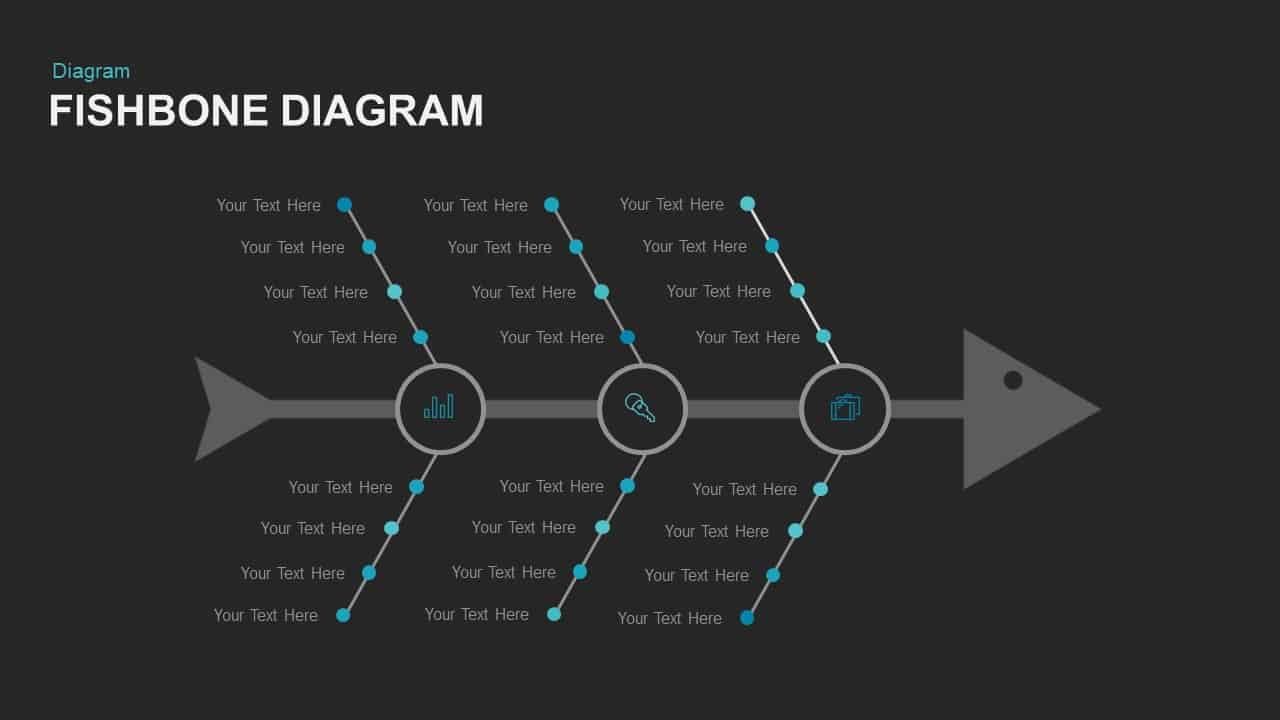
Fishbone Diagram Template for PowerPoint and Keynote Slide
Fishbone PowerPoint Templates
Premium
-
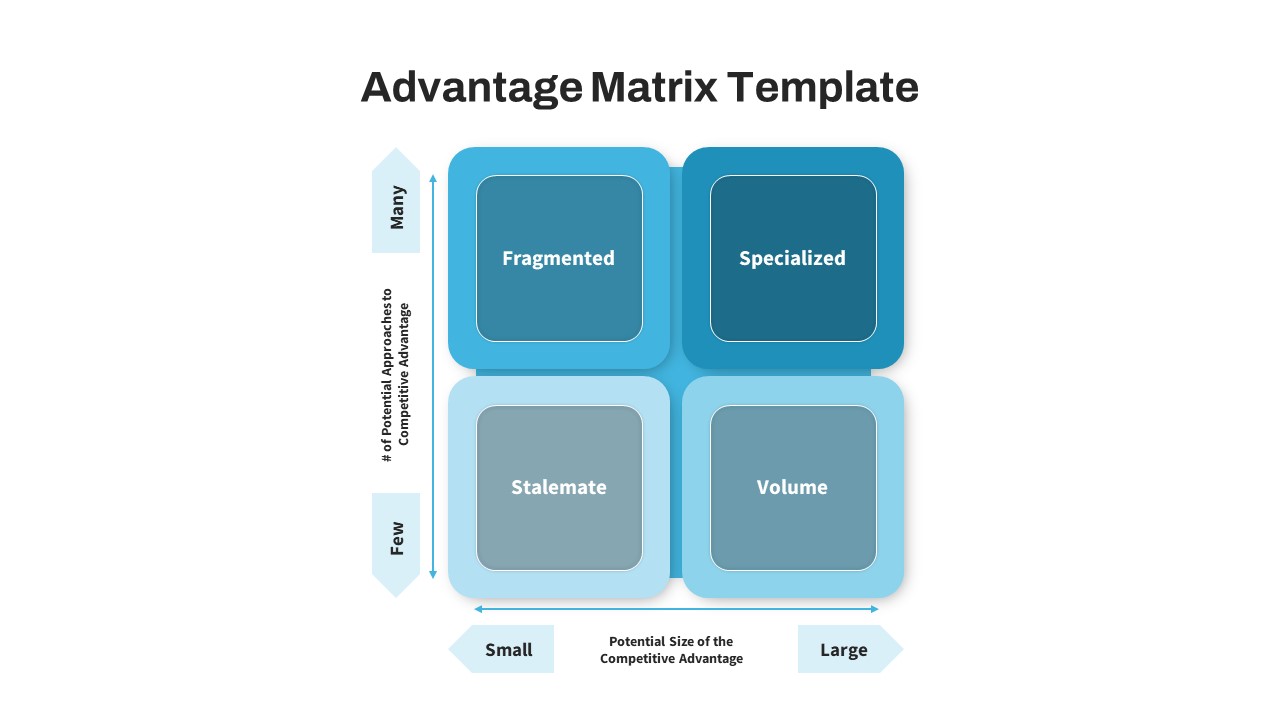
Advantage Matrix PowerPoint Template
PowerPoint Business Templates
Premium
-
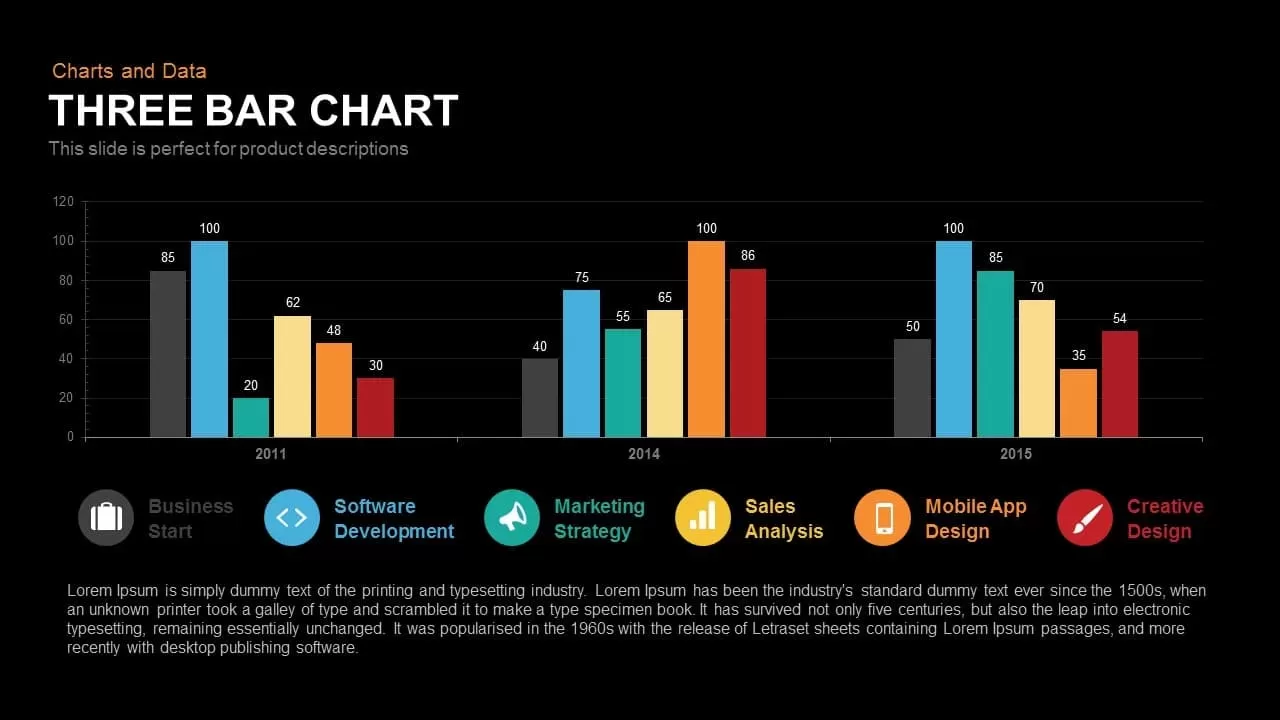
3 Bar Chart PowerPoint Template and Keynote Slide
Column and Bar chart
Premium
-
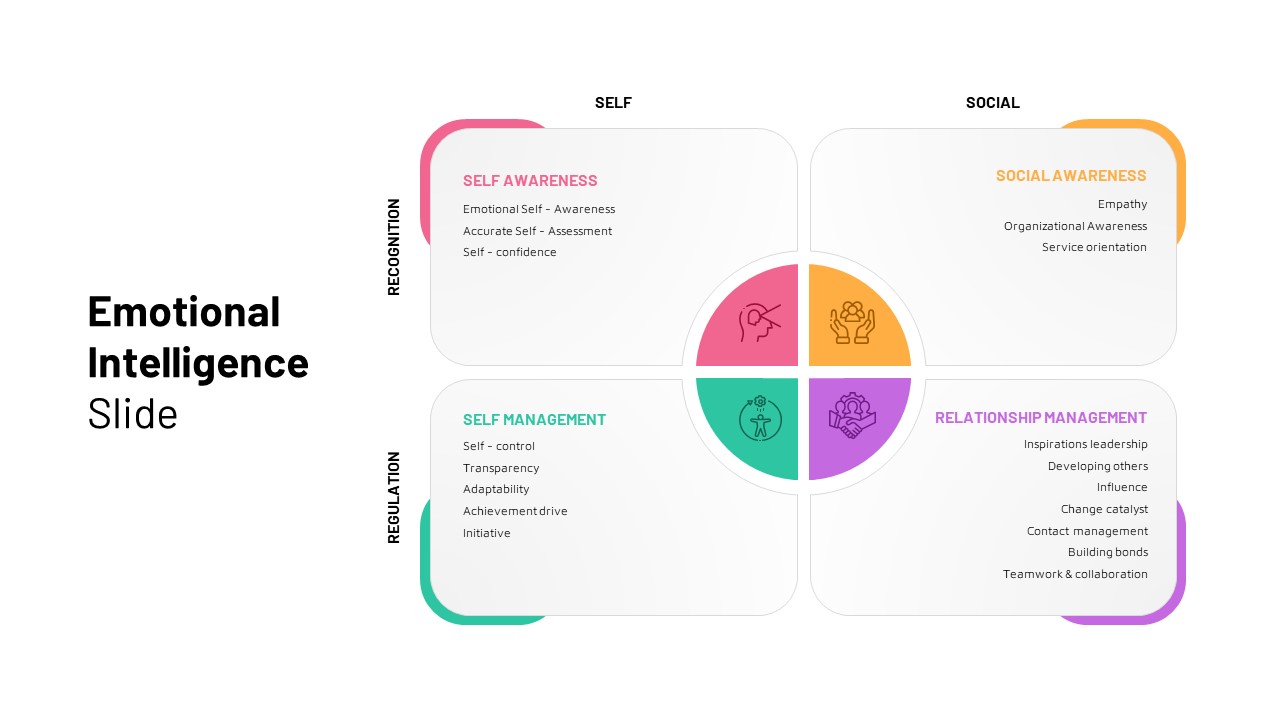
Emotional Intelligence Slide
PowerPoint Templates
Premium
-
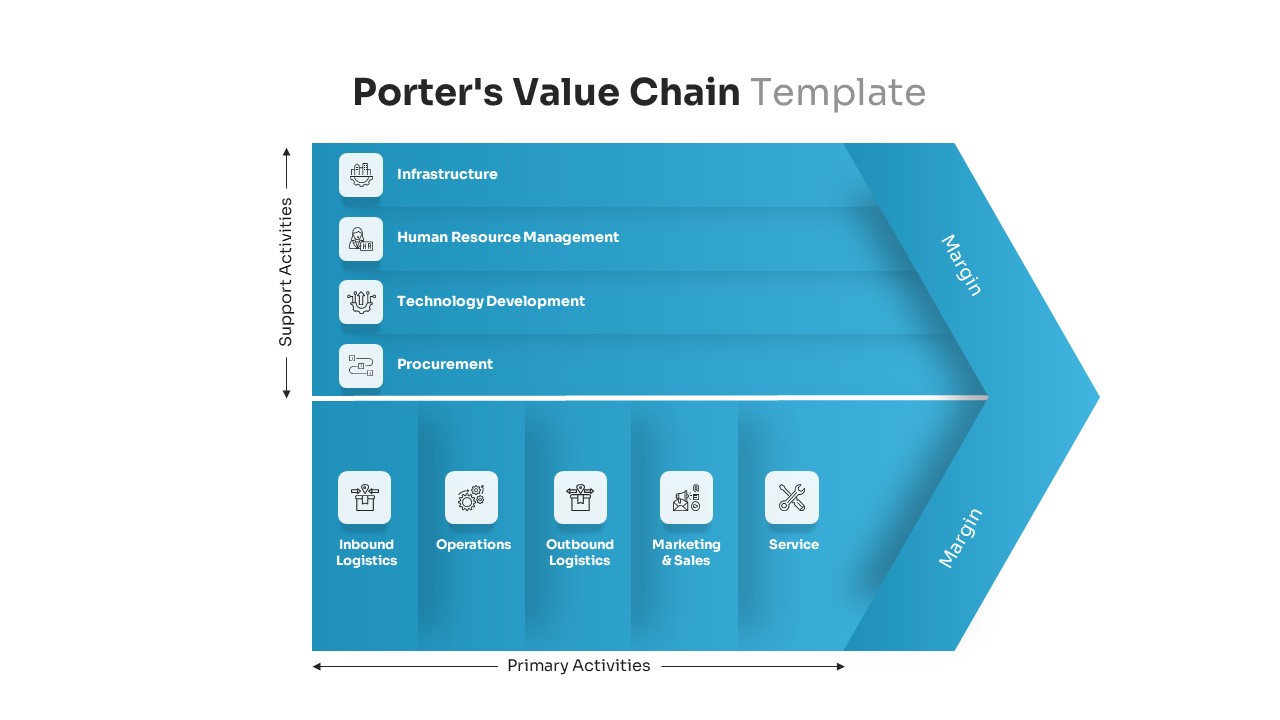
Porter’s Value Chain Template for PowerPoint & Keynote
Diagrams
Premium
-

Medical Experimenting Measuring PowerPoint Template
Business Models
Premium
-
Big Data Infographic Deck For PowerPoint
PowerPoint Business Templates
Premium
-

Area Chart PowerPoint Template
PowerPoint Charts
Premium
-
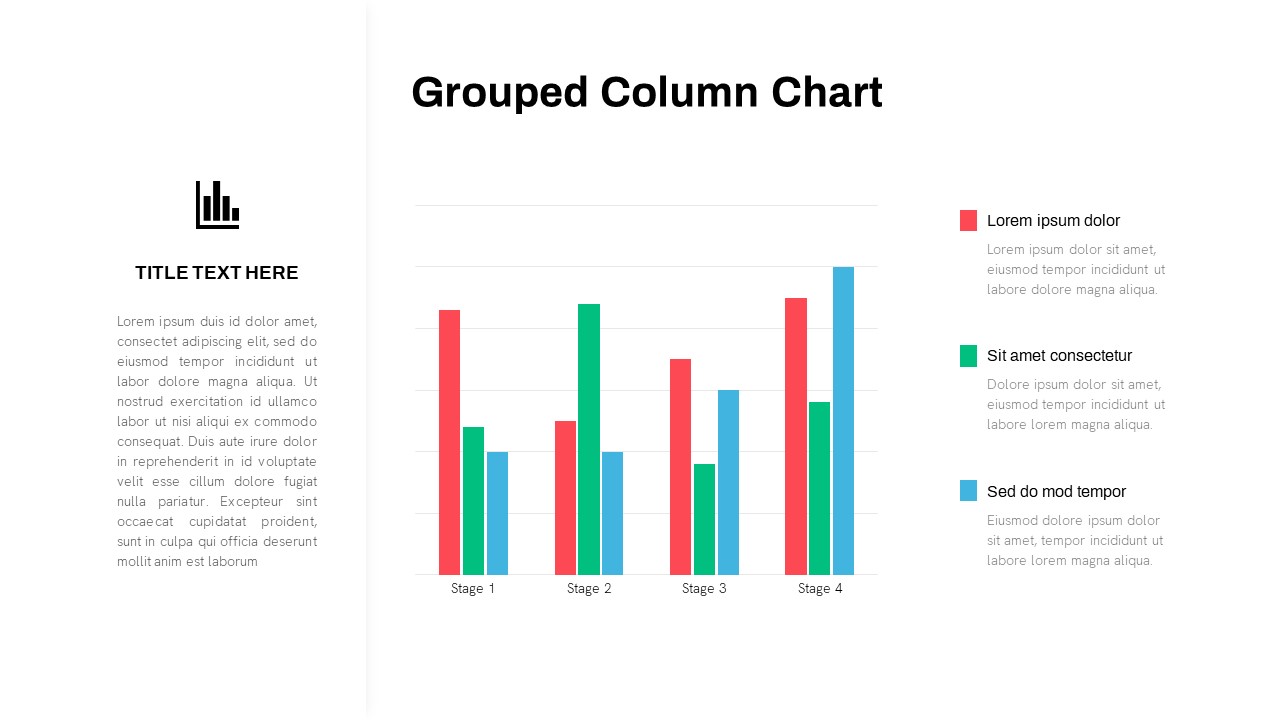
Grouped Column Chart PowerPoint Template
Column and Bar chart
Premium
-

Disaster Management Template
PowerPoint Templates
Premium