


Cross Functional Flow Chart PowerPoint Template


- Version
- Download 30
- File Size 0.00 KB
- File Count 1
- Create Date November 5, 2023
- Last Updated November 6, 2023
Cross Functional Flow Chart PowerPoint Template
Flowchart Template for PowerPoint
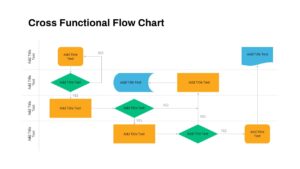
The cross functional flowchart PowerPoint Template is a handy flowchart to show relationships. This PowerPoint template can stand alone as a powerful presentation tool or complement our range of other dynamic PowerPoint charts. Process flowcharts are invaluable assets in the realm of effective business process management. They play a pivotal role in simplifying intricate procedures, particularly within workforce operations, where numerous settings and options can lead to potential conflicts and intricate decision-making processes.
What is cross cross-functional flowchart?
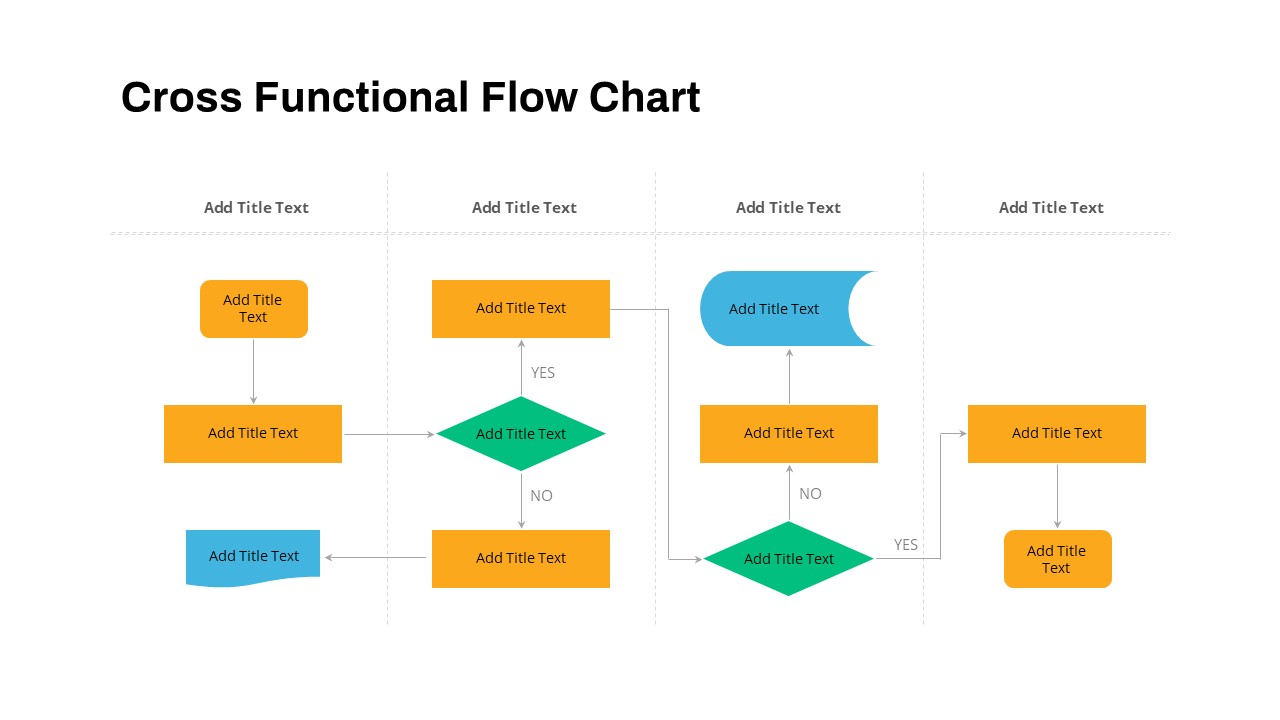
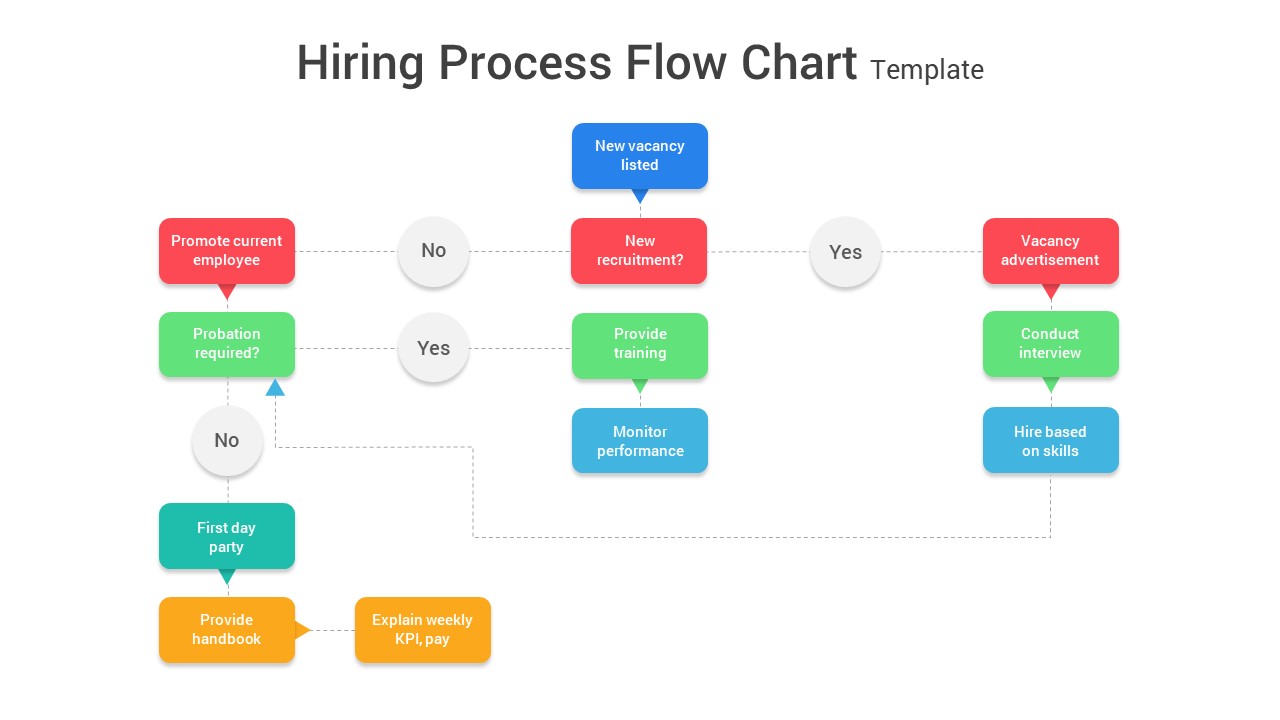
A cross-functional flowchart, also known as a swimlane diagram, is a visual representation used in business and project management to illustrate complex processes involving multiple individuals or departments. It organizes activities into distinct "swimlanes" or columns, each representing a different function, department, or participant involved in the process. Arrows and symbols are used to indicate the flow of tasks and information between these lanes, providing a clear and structured overview of how a particular workflow or procedure operates. Cross-functional flowchart templates help showcase improving transparency, identifying bottlenecks, and streamlining processes in various industries, enabling teams to collaborate effectively and enhance overall efficiency.
This is a process mapping chart that easily enables workflow visualization. Whether you're a business professional, project manager, or educator, our template simplifies the process of illustrating cross-functional workflows, making your presentations more impactful and informative. You can easily map out and visualize complex processes within your organization or project. it helps create quality control flowcharts to improve product or service quality.
Business professionals can use this flowchart template for PowerPoint to streamline processes and enhance decision-making. Similarly, project managers, quality assurance teams, students and consultants can utilize the possibilities of flowcharts for various presentations.
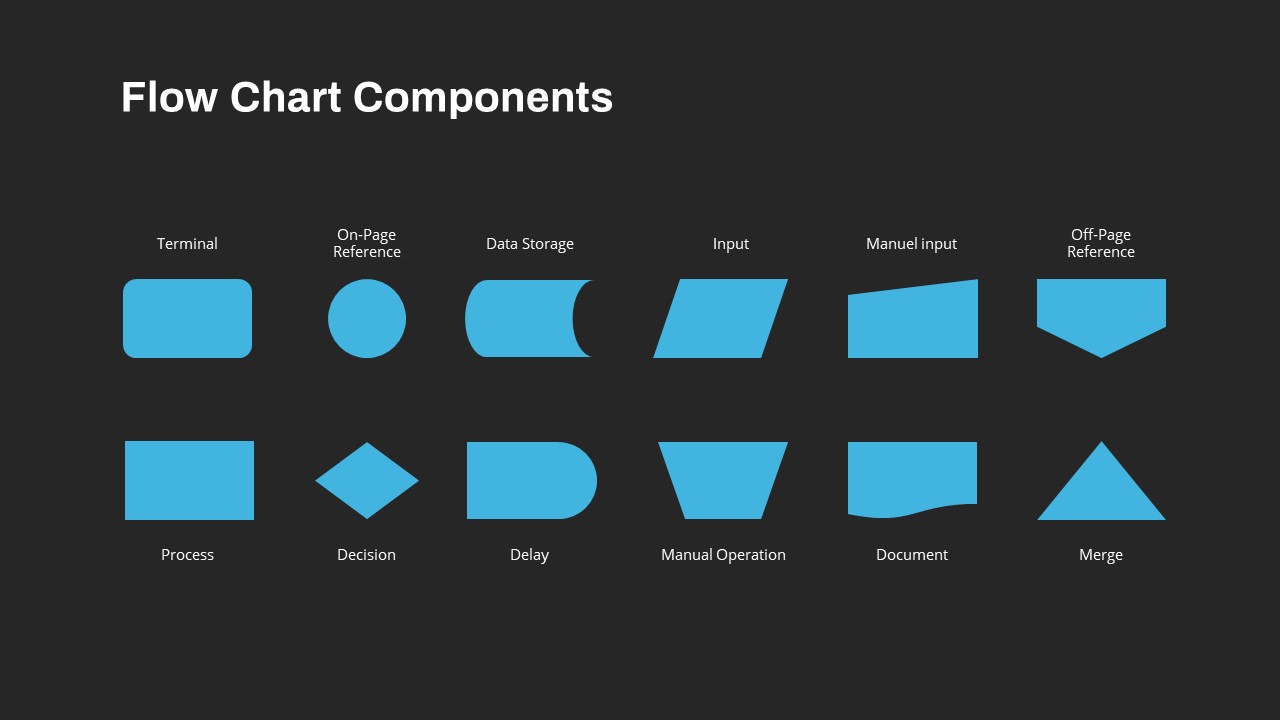
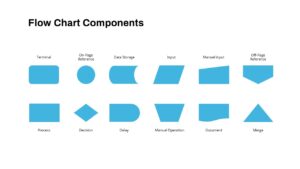
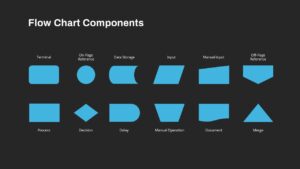
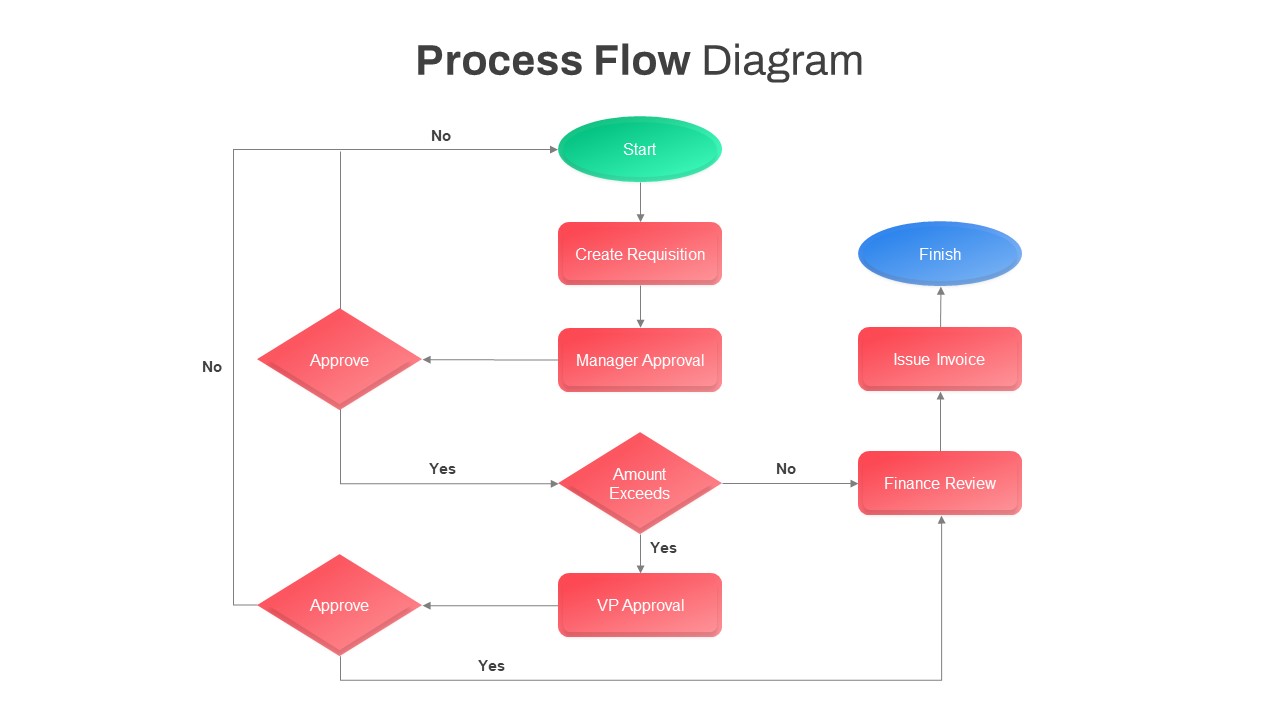
Our flowchart infographic contains a flowchart diagram and symbols of a flowchart for separate uses. Each symbol in a flowchart has its own meaning. For example, a rectangle shape represents a specific task or action within the process. The diamond shape is used to indicate a branching point in the process where a decision is made. Typically, two or more arrows are coming out of a decision symbol, each leading to different paths based on the decision's outcome.
This PowerPoint flowchart template is fully editable, allowing users to customize its appearance to their preferences while maintaining high-quality visuals. Additionally, explore our gallery for a variety of other flowchart diagrams.
Attached Files
| File | Action |
|---|---|
| https://premiumdownloads.s3.amazonaws.com/SB03807-Cross Functional Flow Chart PowerPoint Template.ZIP | Download |
Login to download this file
Add to favorites
Add to collection
-

Item ID
SB03807 -

Related Templates
-
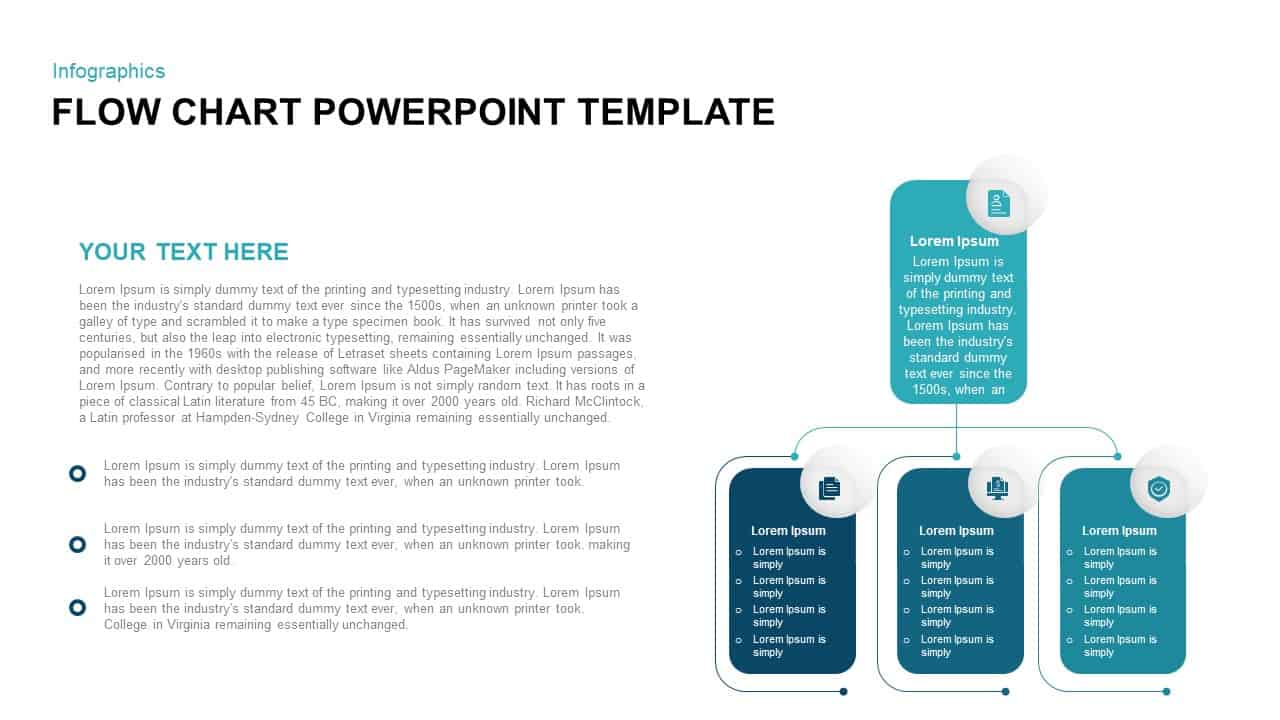
Flow Chart PowerPoint Template and Keynote Presentation
Flow Charts
Premium
-
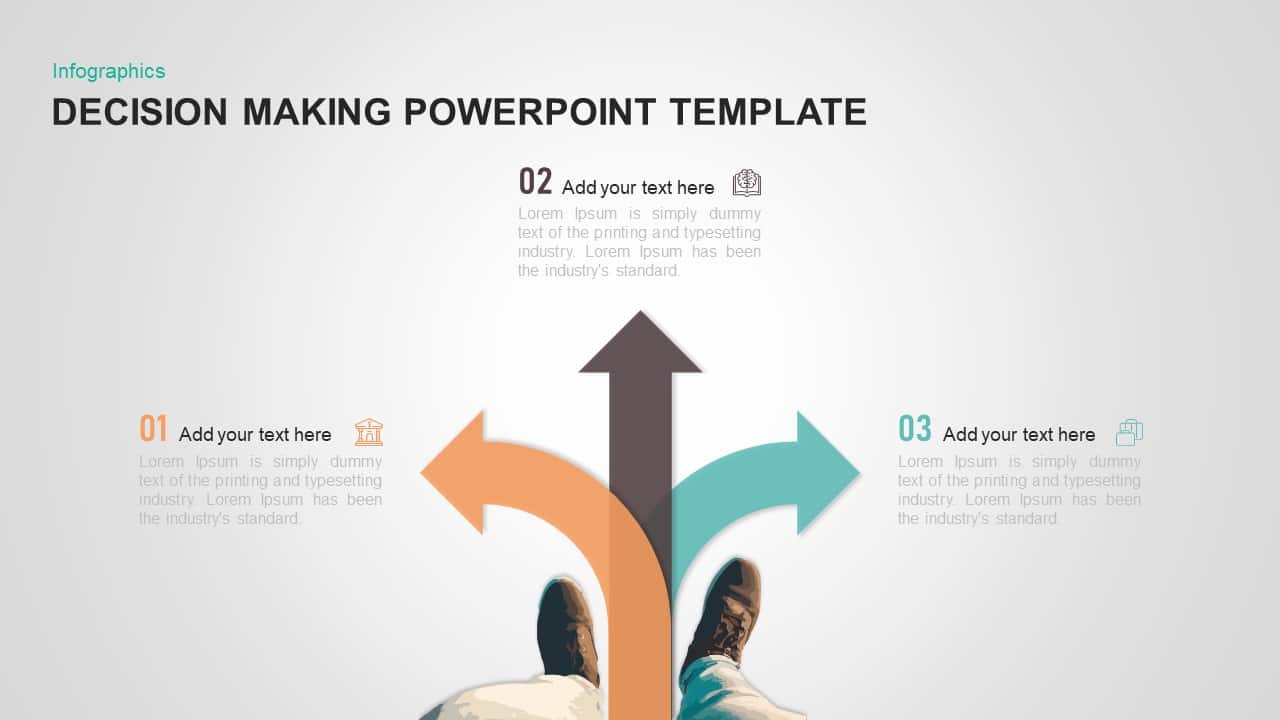
Decision Making PowerPoint Template for Business Presentation
Business Models
Premium
-
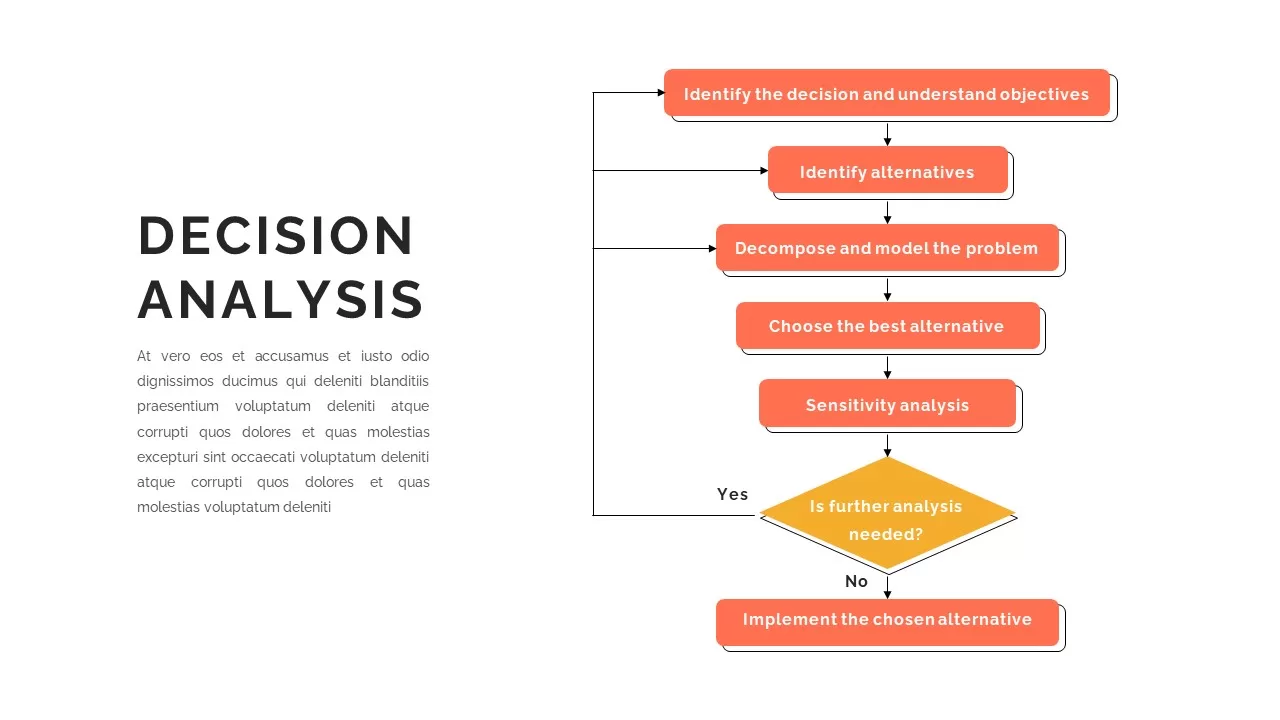
Decision Analysis Template
Flow Charts
Premium
-
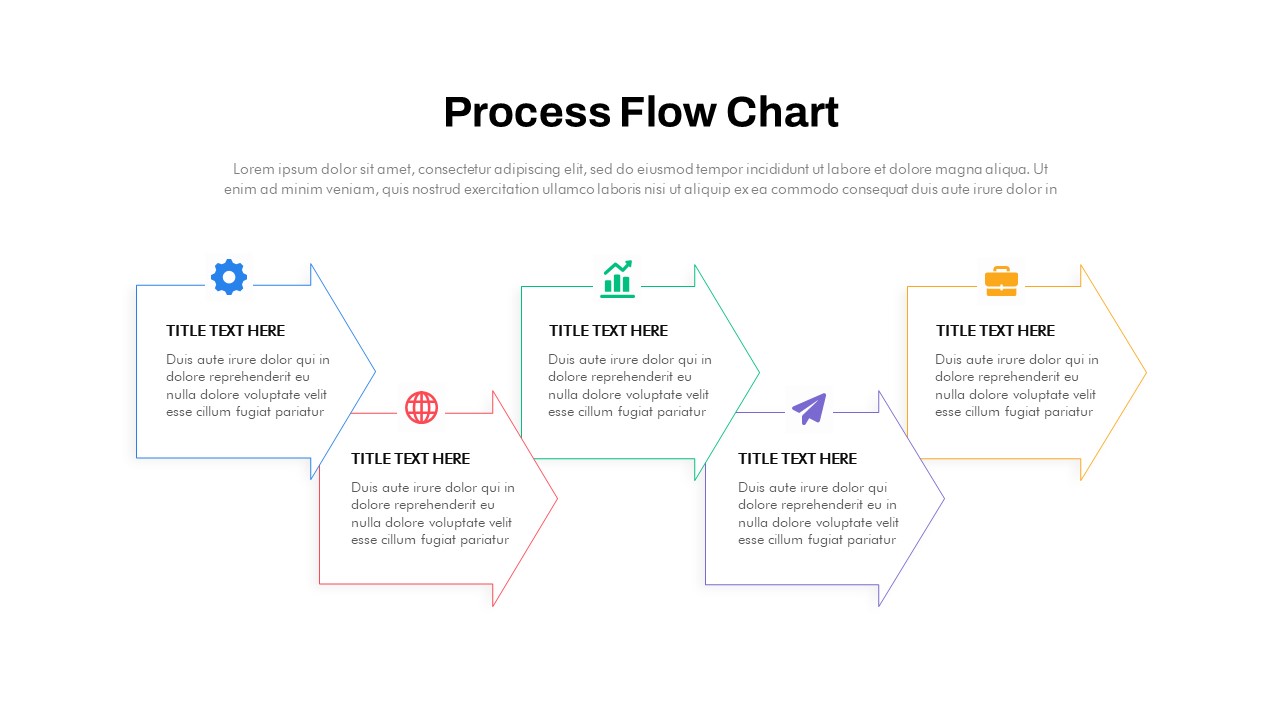
Animated Process Flow Chart PowerPoint template
Flow Charts
Premium
-

RAPID Framework Template
Text and Table
Premium
-
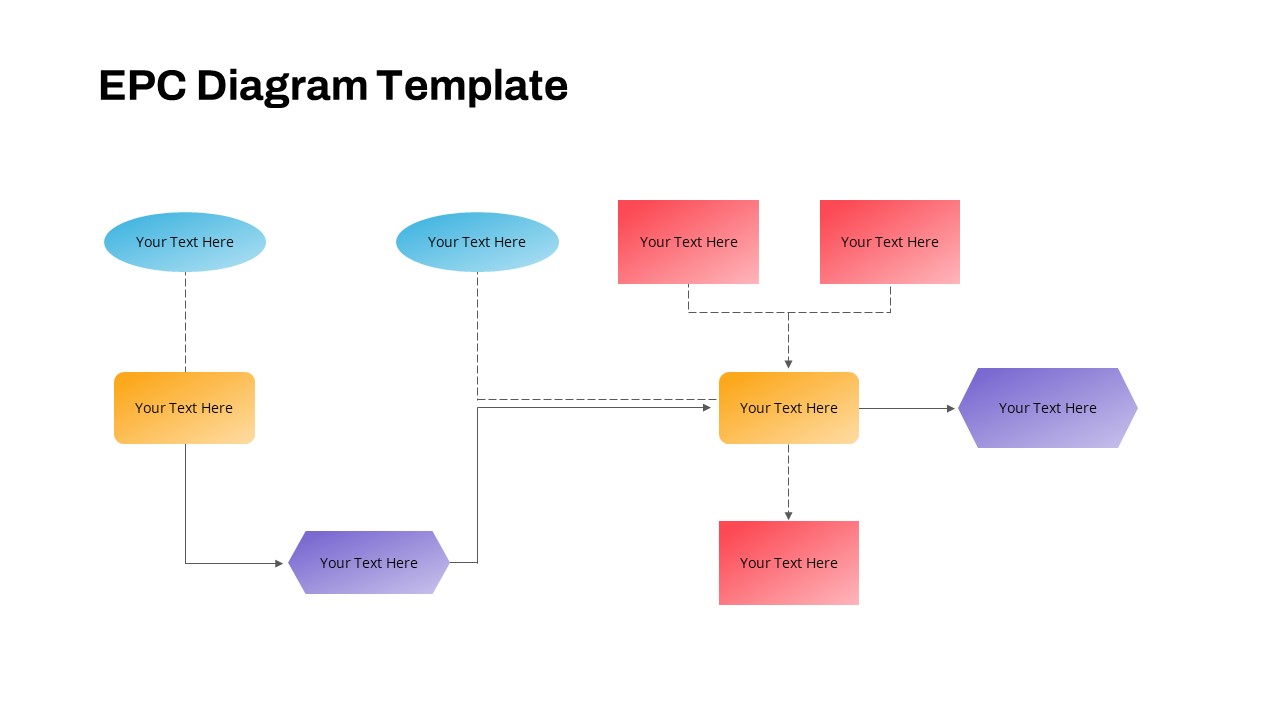
EPC Diagram PowerPoint Template
PowerPoint Templates
Premium
-
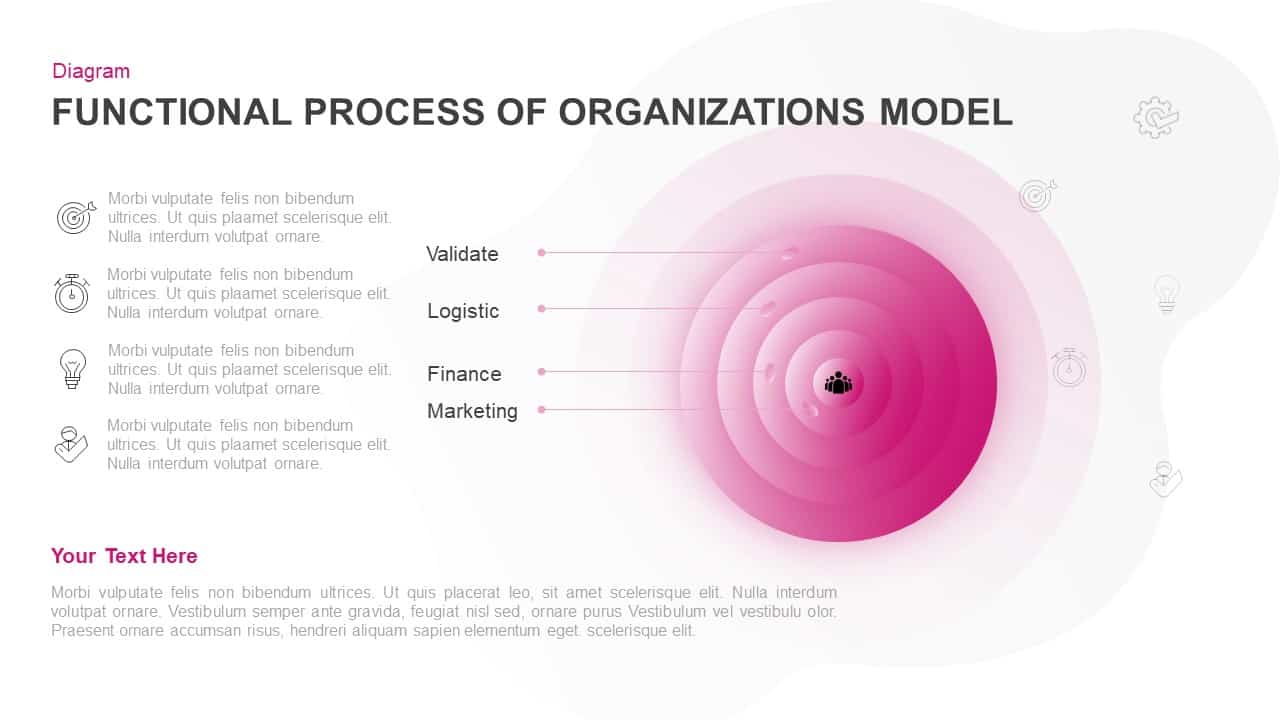
Functional Process of Organizations Model Template
Business Models
Premium
-
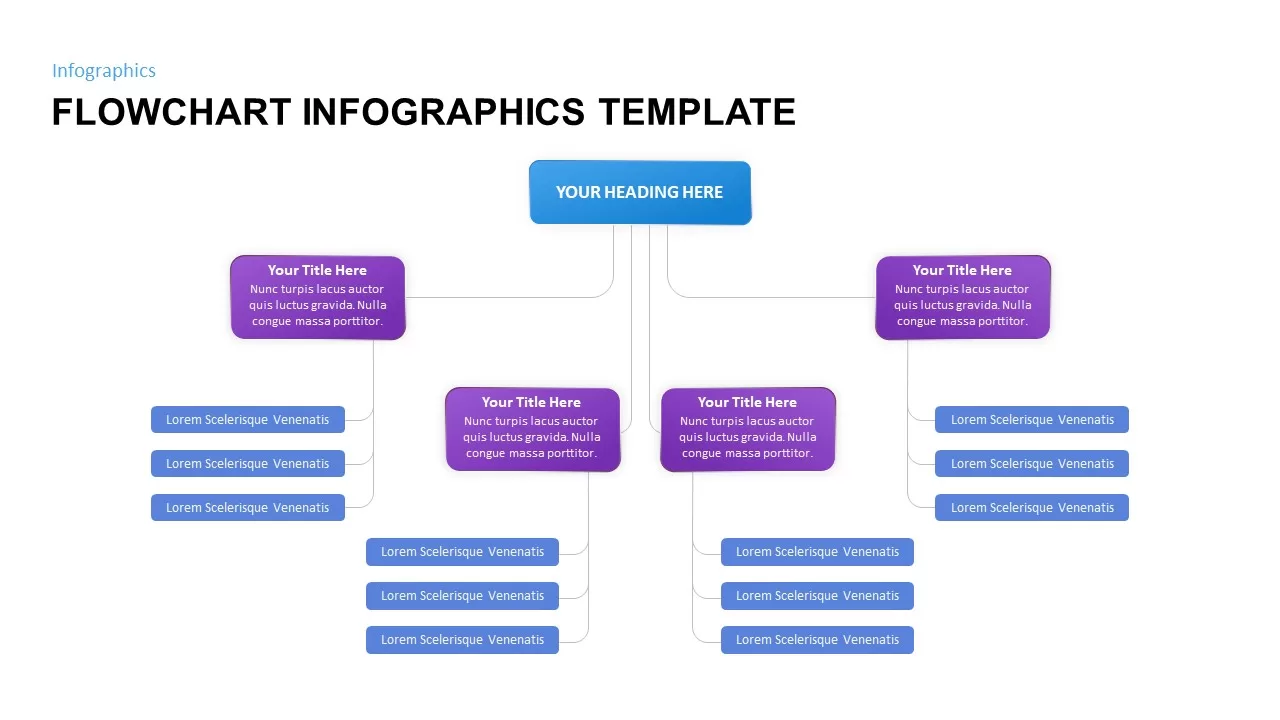
Flowchart Infographic Template
Flow Charts
Premium
-
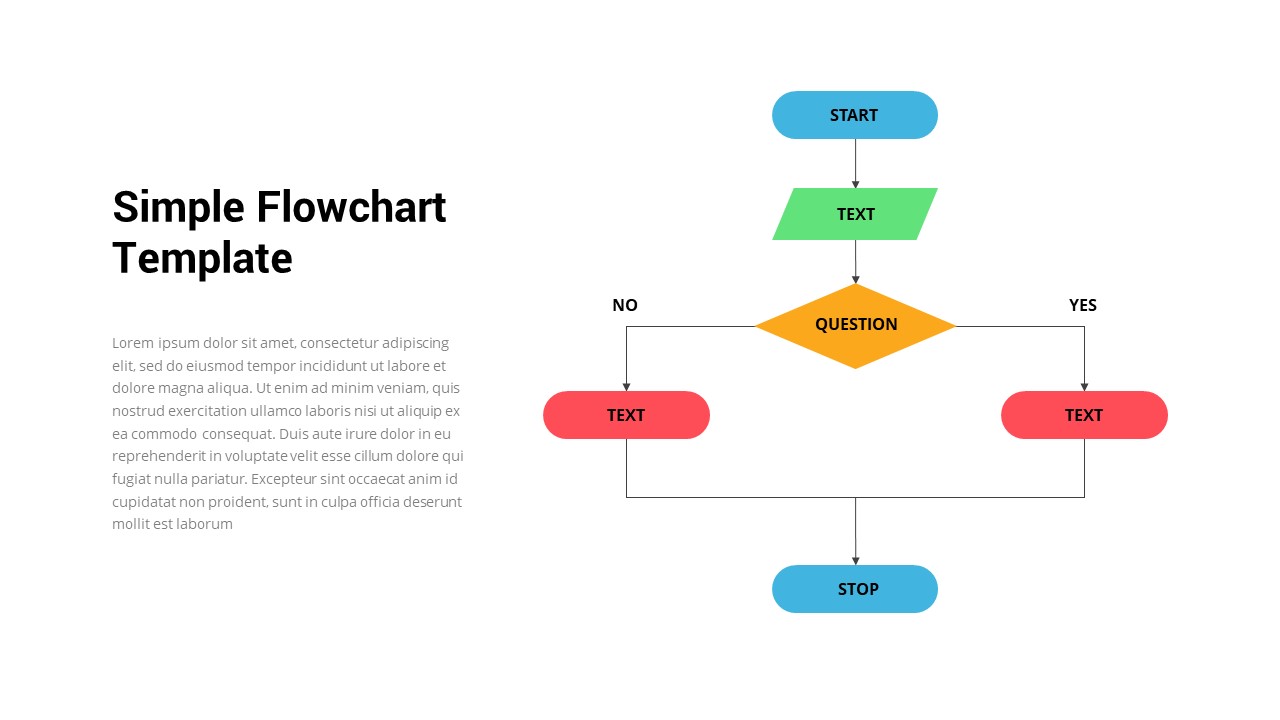
Simple Flowchart PowerPoint Template
Flow Charts
Premium
-
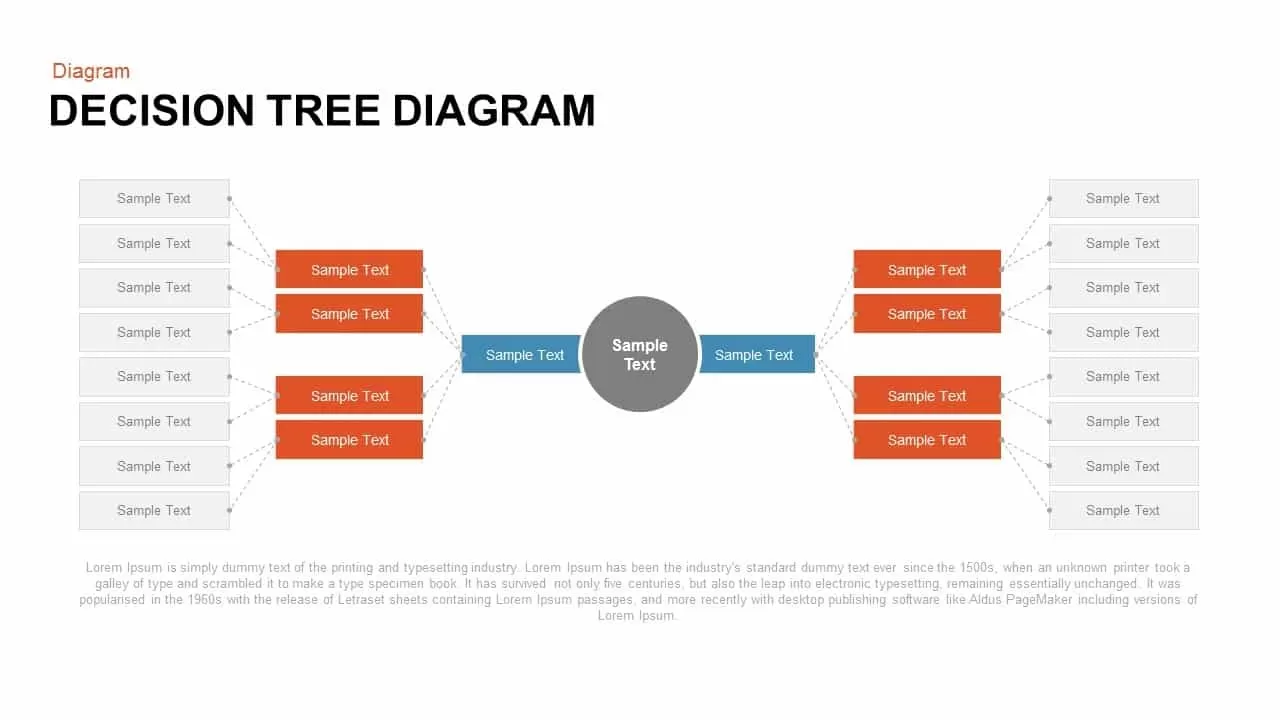
Decision Tree PowerPoint Template and Keynote Diagram
Diagrams
Premium
-
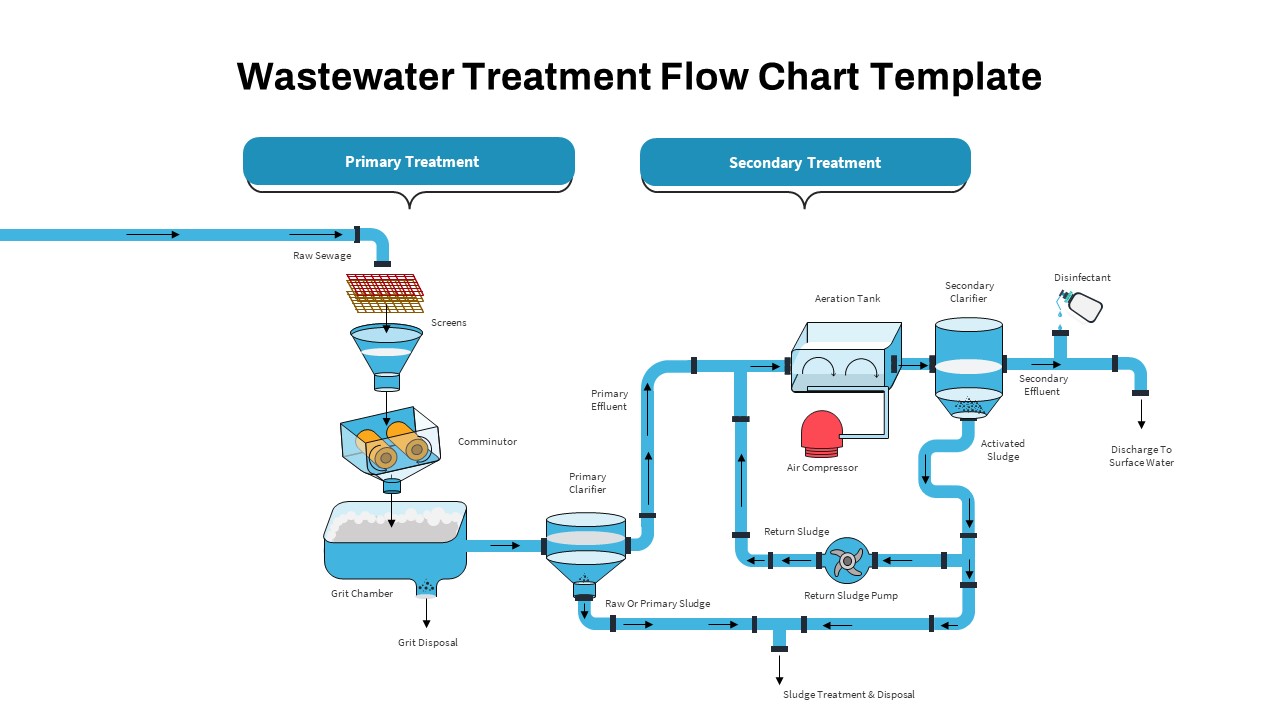
Waste Water Treatment Flow Chart PowerPoint Template
PowerPoint Templates
Premium
-
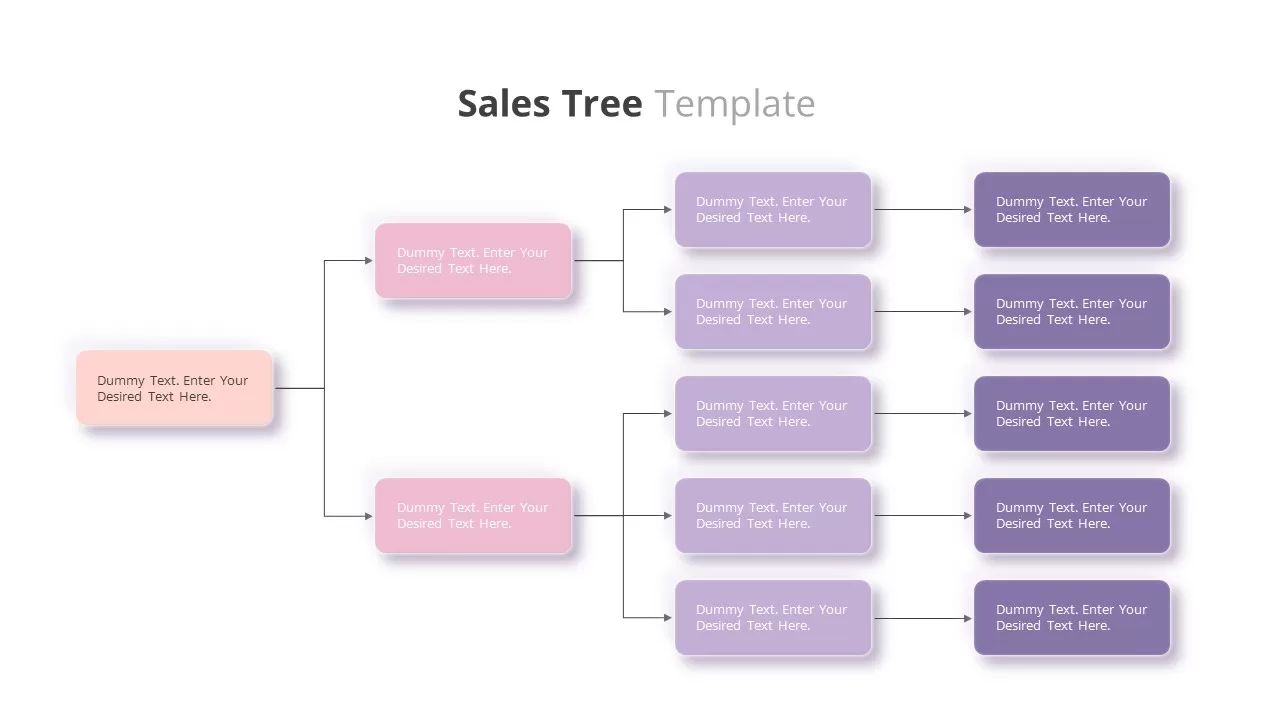
Sales Tree Template
Tree Diagrams
Premium
-
Decision Making PowerPoint Template & Keynote Diagram
Business Models
Premium
-
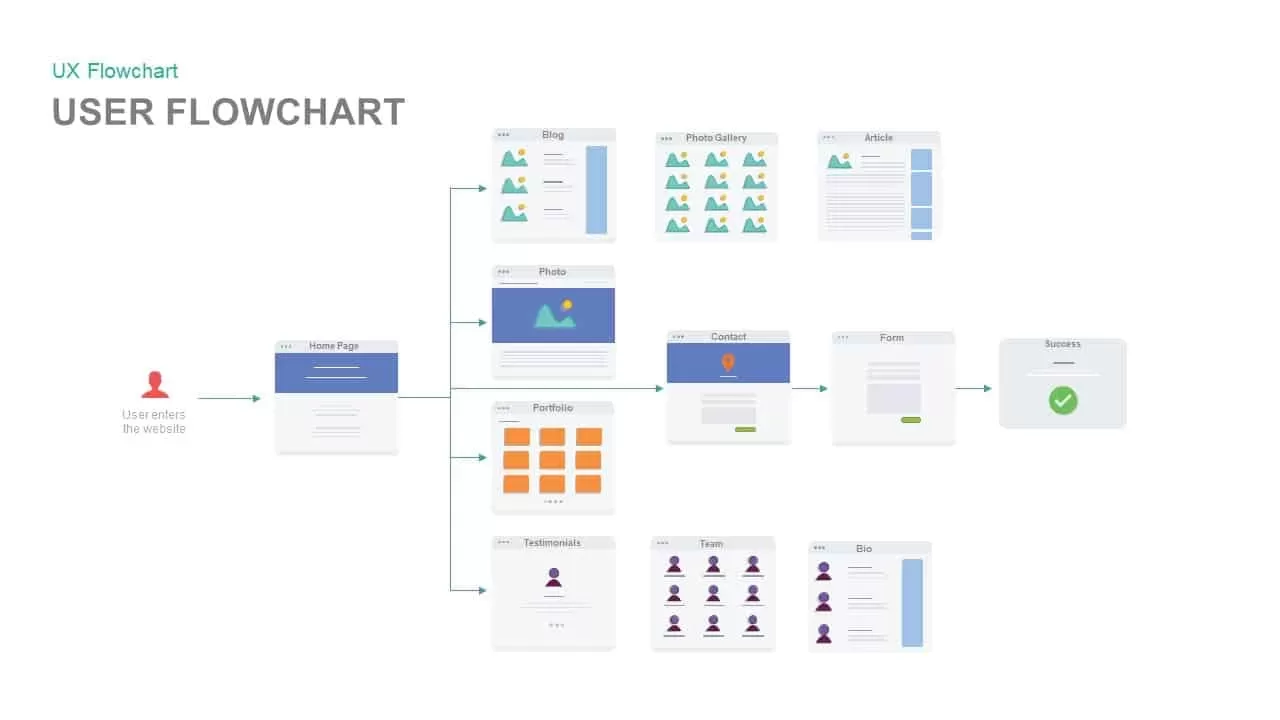
UX Flow Chart PowerPoint Template and Keynote
Diagrams
Premium
-
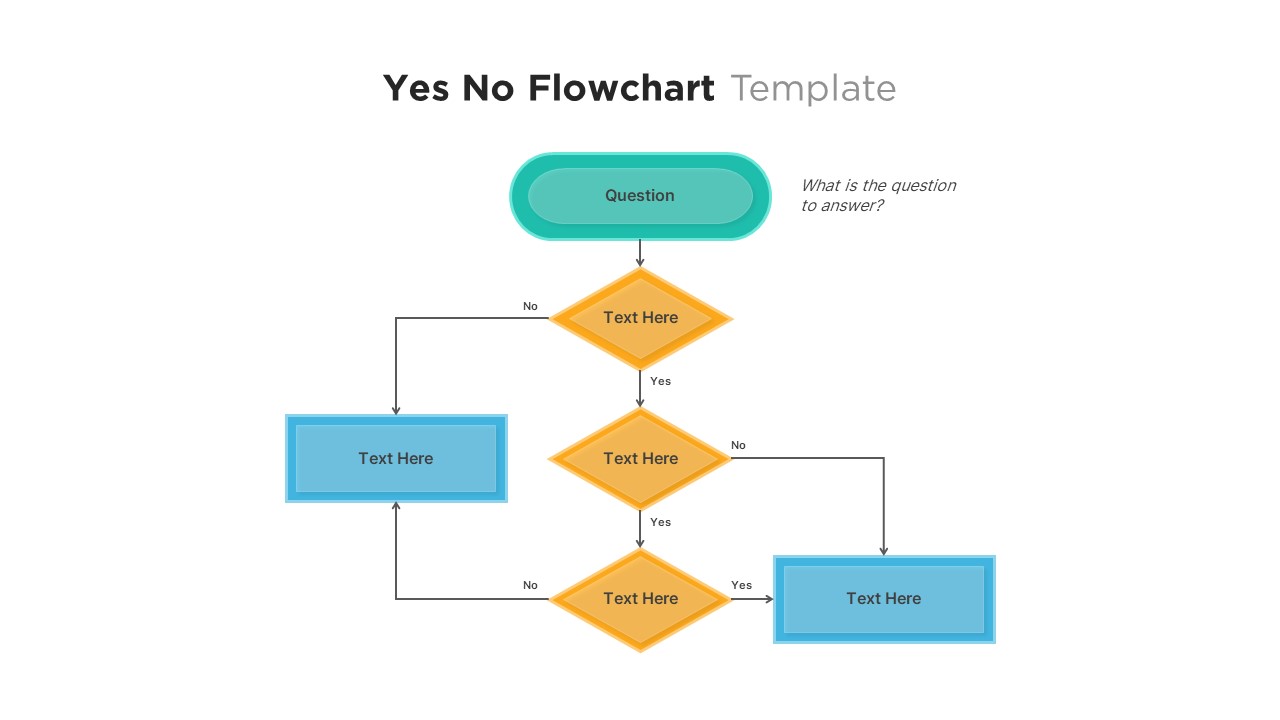
Yes No Flowchart PowerPoint Template
PowerPoint Templates
Premium
-
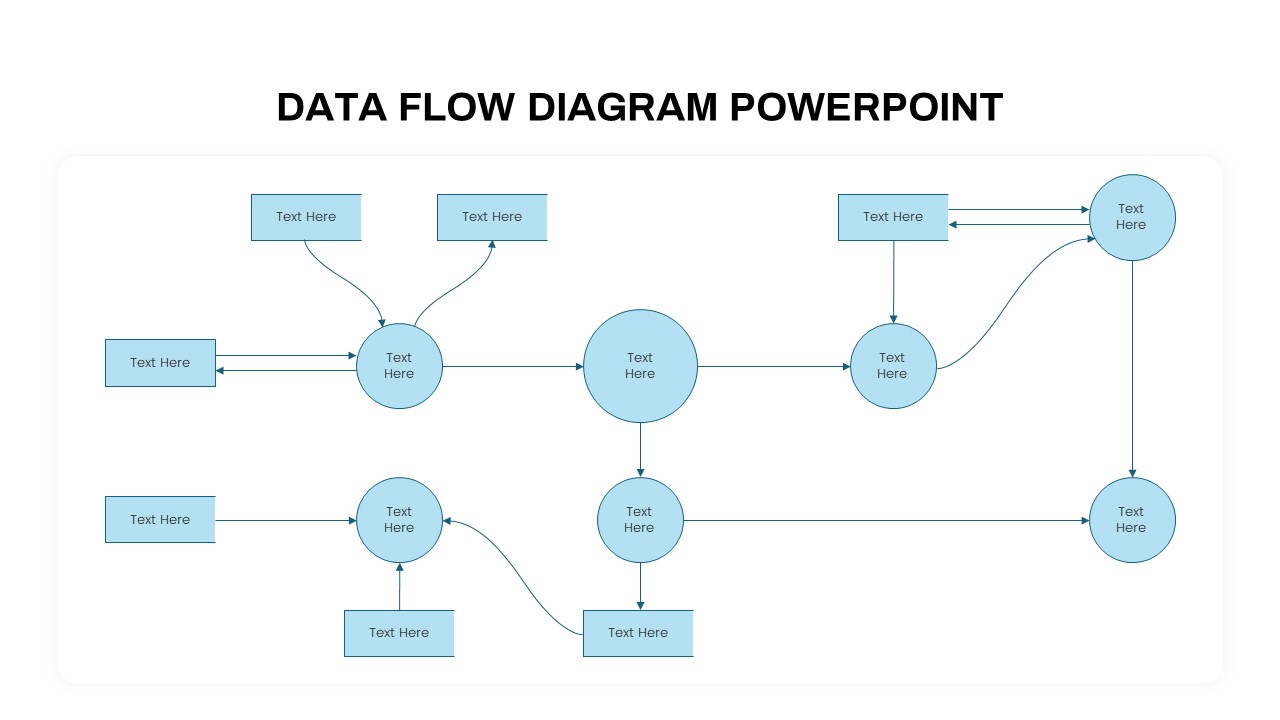
Data Flow PowerPoint Presentation Template
PowerPoint Templates
Premium
-
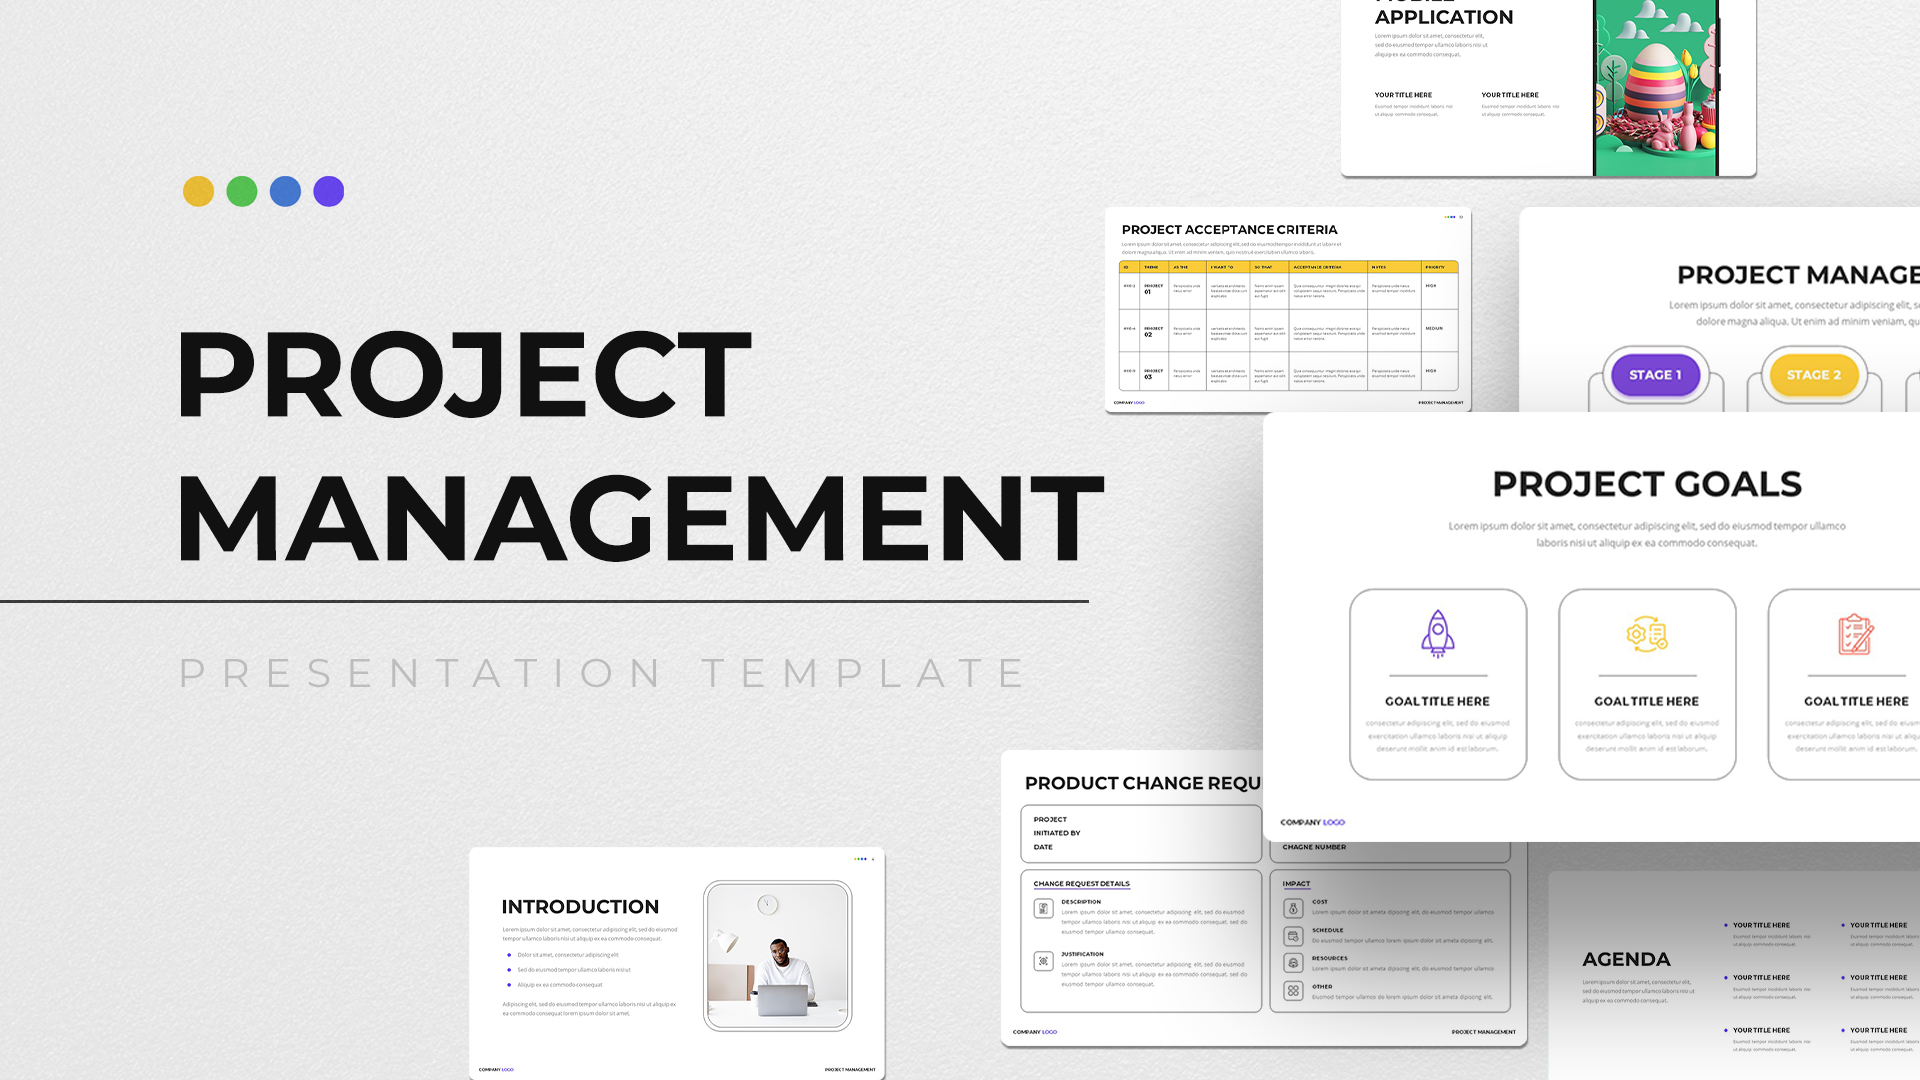
Project Management Presentation Template
PowerPoint Business Templates
Premium
-
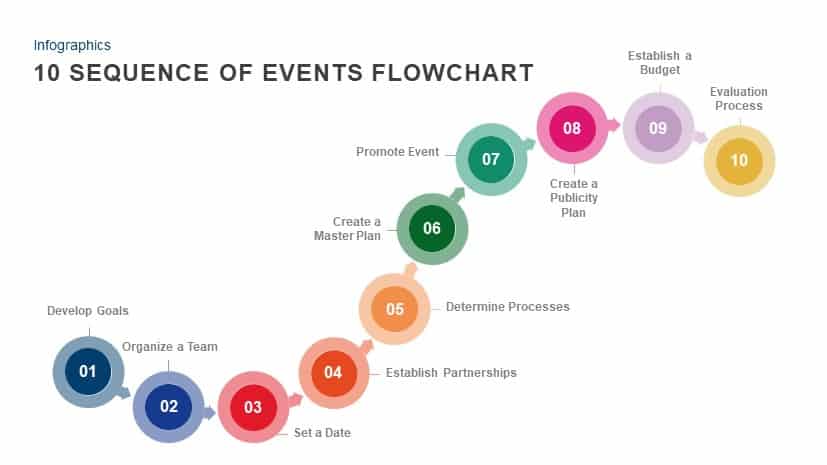
10 Sequence of Events Flow chart Template for PowerPoint and Keynote
Process Flow Diagrams
Premium
-
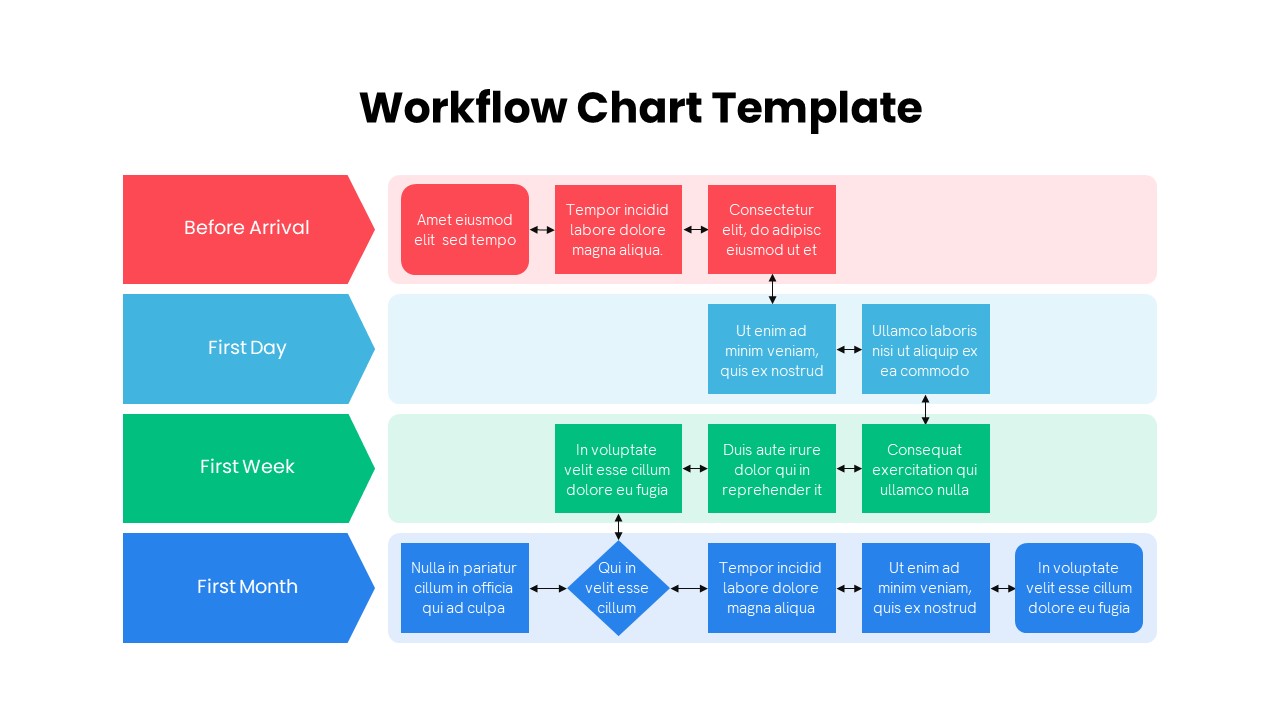
Workflow Chart PowerPoint Template
Flow Charts
Premium
-

Metaphor Business Decision Making PowerPoint template and Keynote template
Metaphor, Simile & Analogy
Premium
-
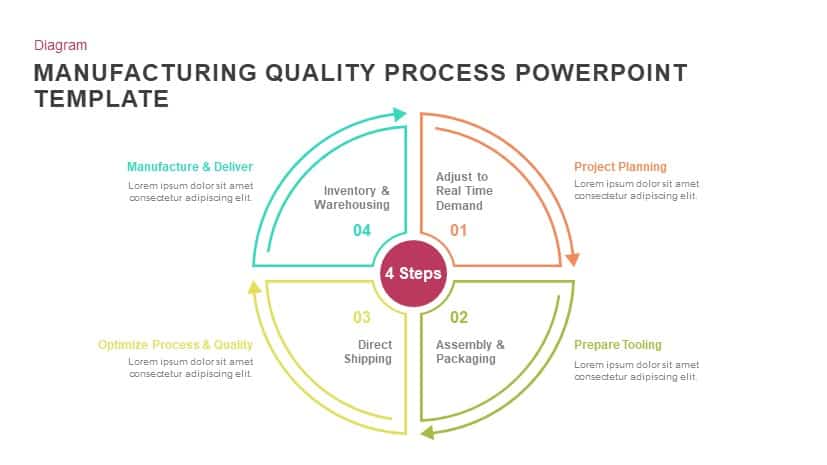
Manufacturing Quality Process PowerPoint Template and Keynote
Diagrams
Premium
-
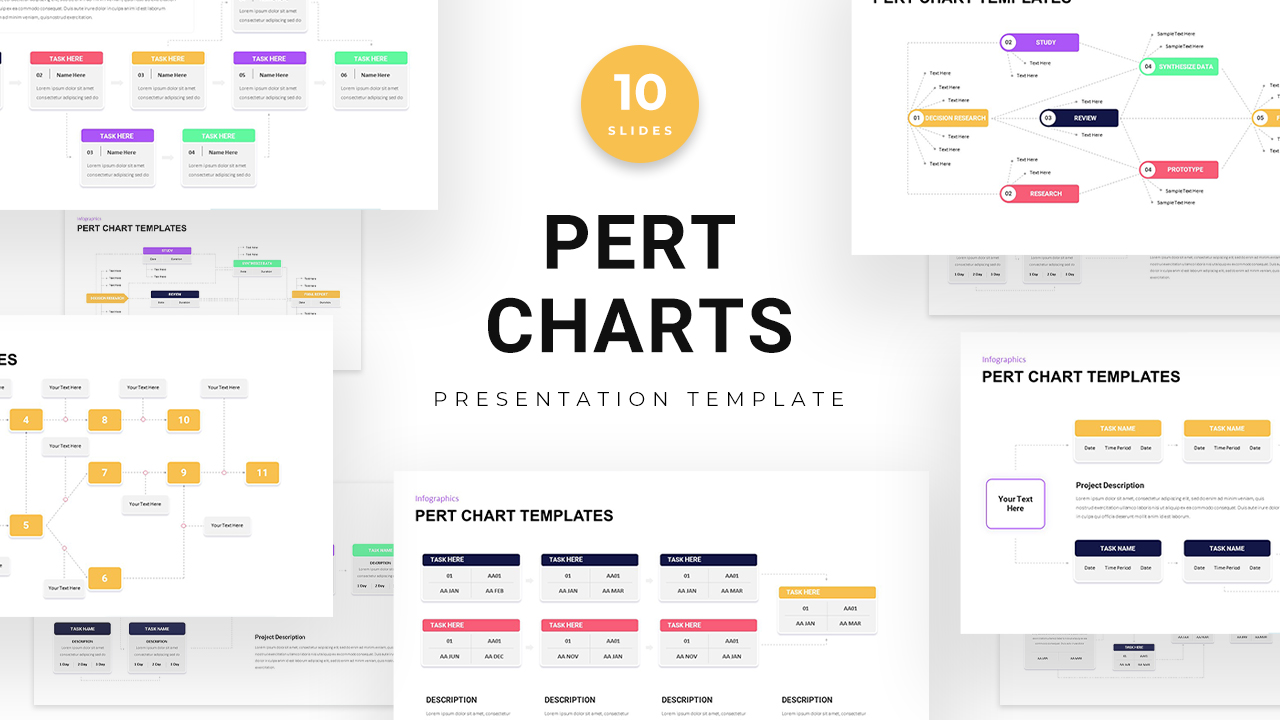
Pert Chart PowerPoint Templates
Diagrams
Premium
-
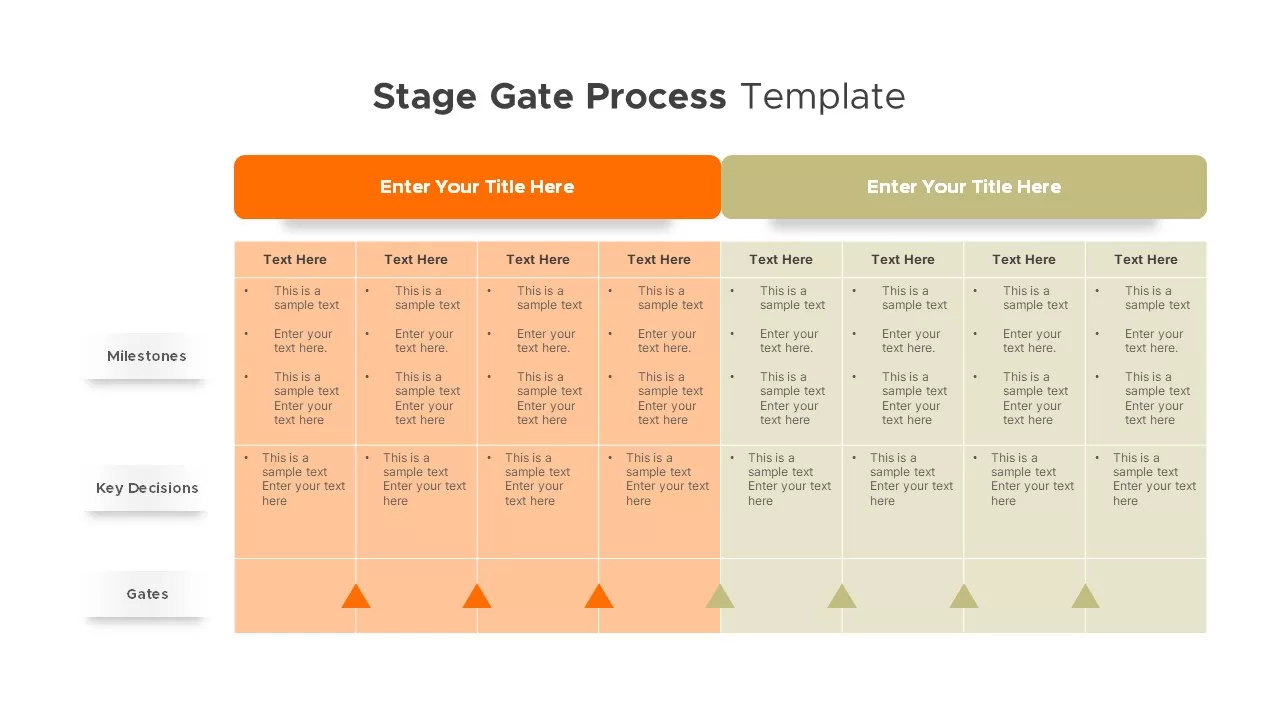
Stage Gate Process Template
PowerPoint Templates
Premium
-
Process Flow Diagram PowerPoint Template
Flow Charts
Premium
-
Hiring Recruitment Process Flow Chart PowerPoint
PowerPoint Templates
Premium
-
Flow Chart PowerPoint Template
Flow Charts
Premium
-
Quality Assurance PowerPoint Deck Template
PowerPoint Business Templates
Premium
-
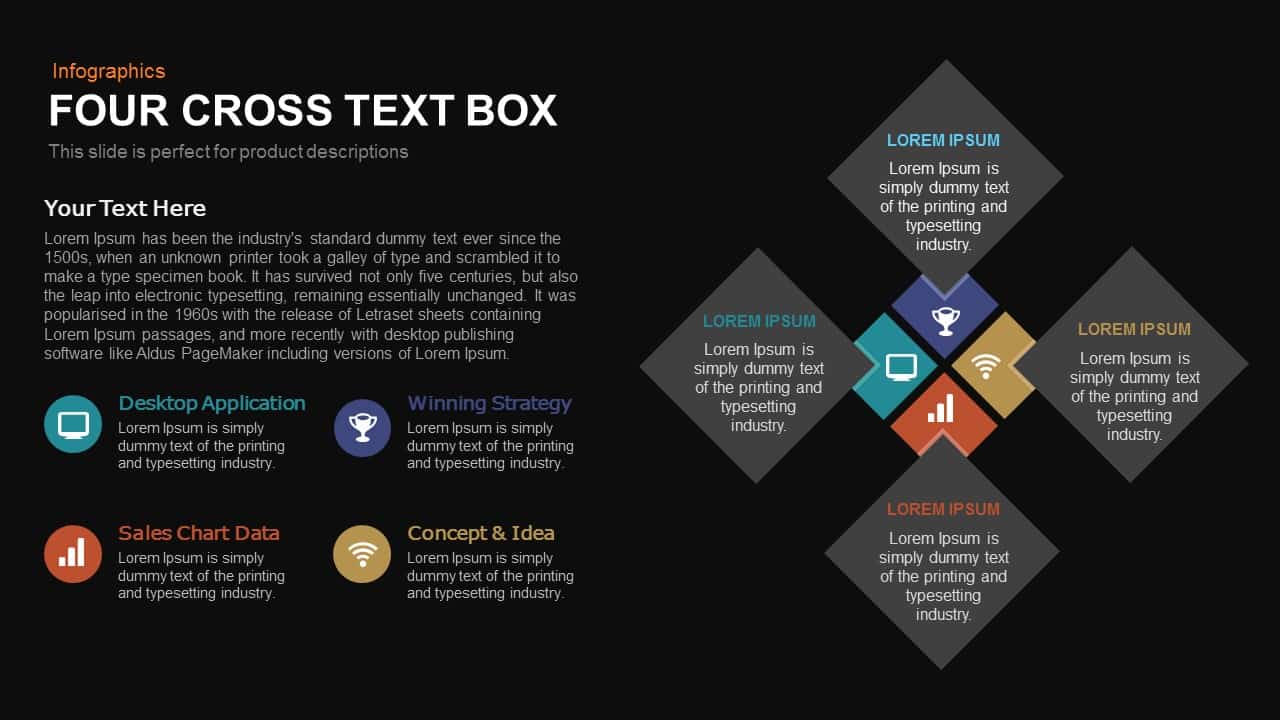
4 Cross Text Box PowerPoint Template and Keynote
Business Models
Premium
-
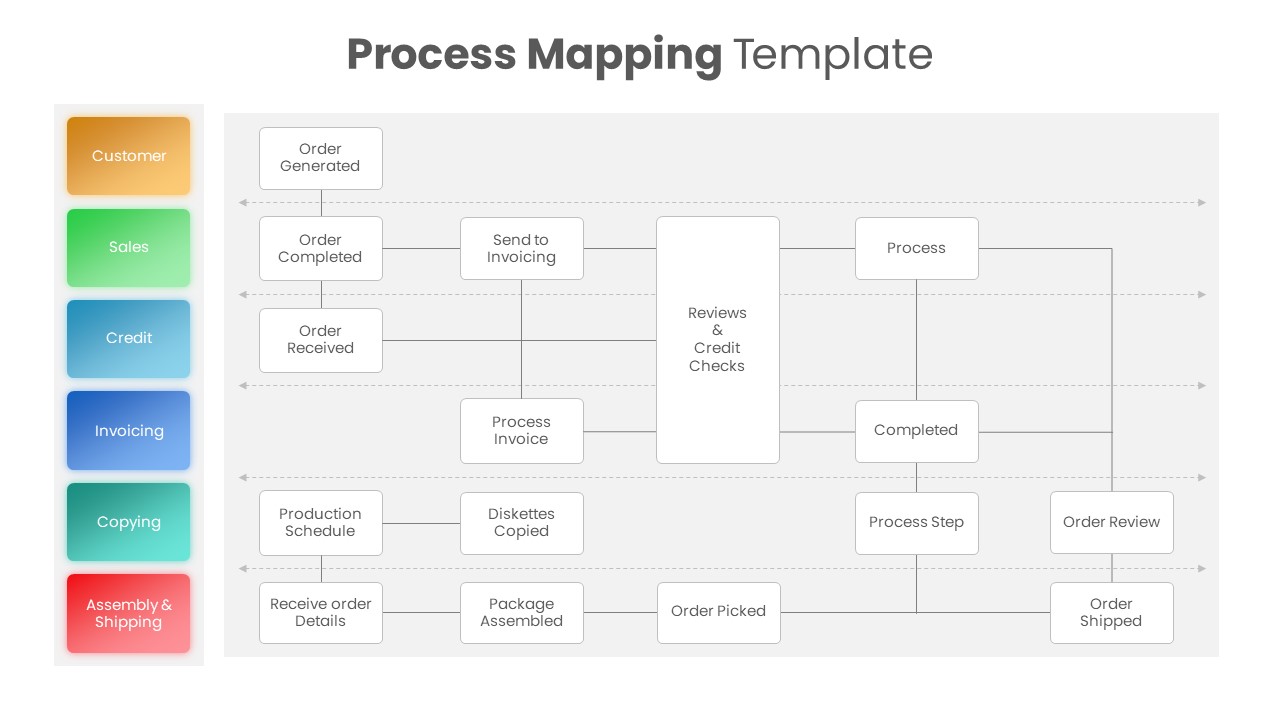
Process Mapping PowerPoint Template
Process Flow Diagrams
Premium
-
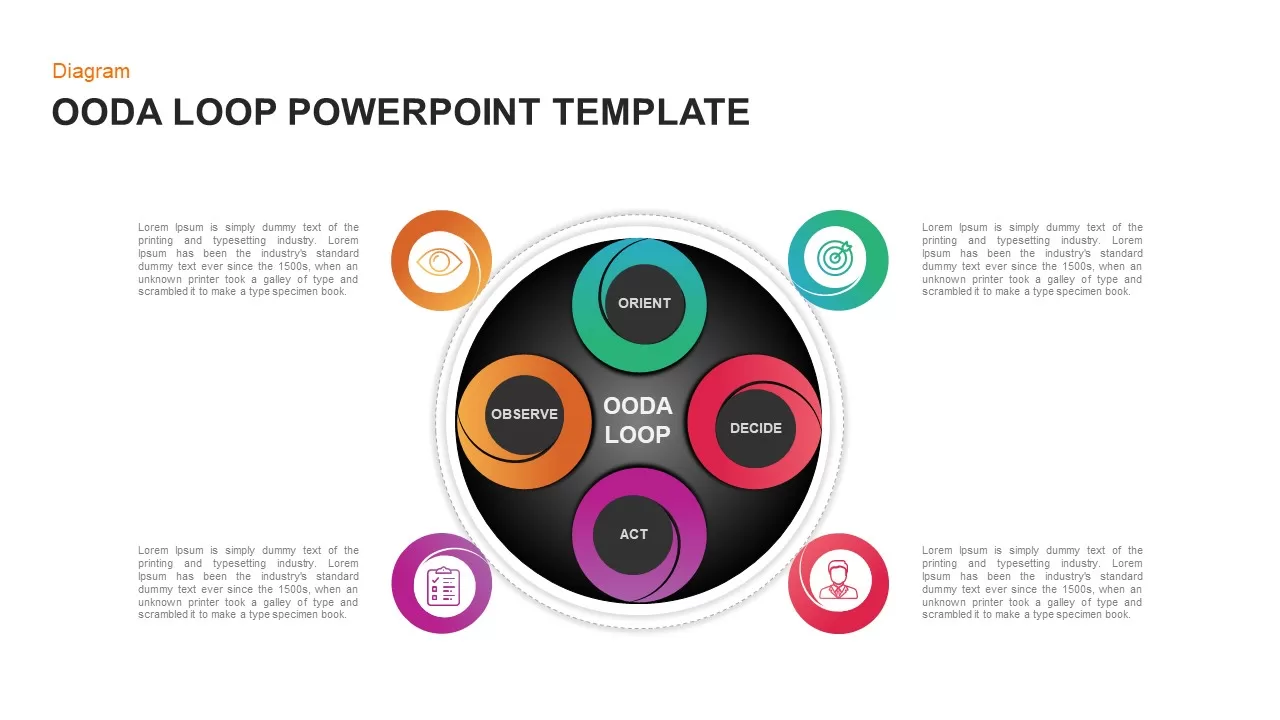
OODA Loop PowerPoint Template
Business Models
Premium
-
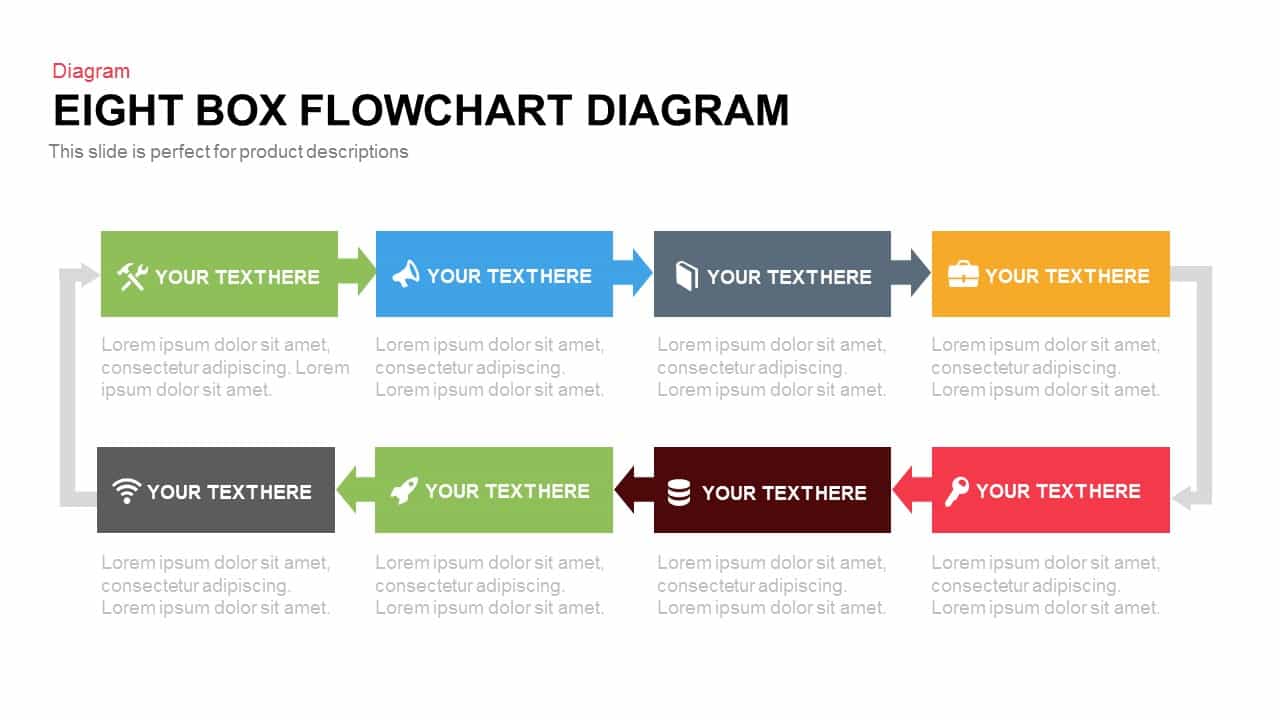
Eight Box Flow Chart Diagram Template for PowerPoint and Keynote
Diagrams
Premium
-
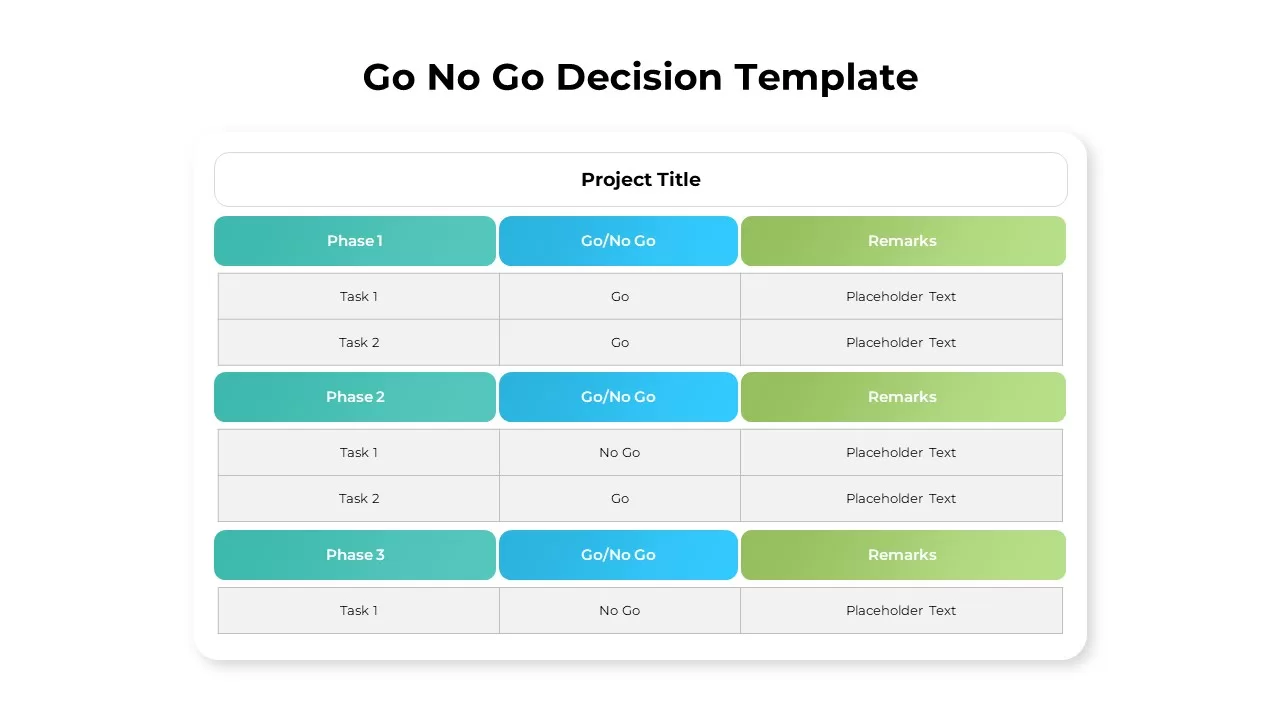
Go No Go Decision Template
Metaphor, Simile & Analogy
Premium
-
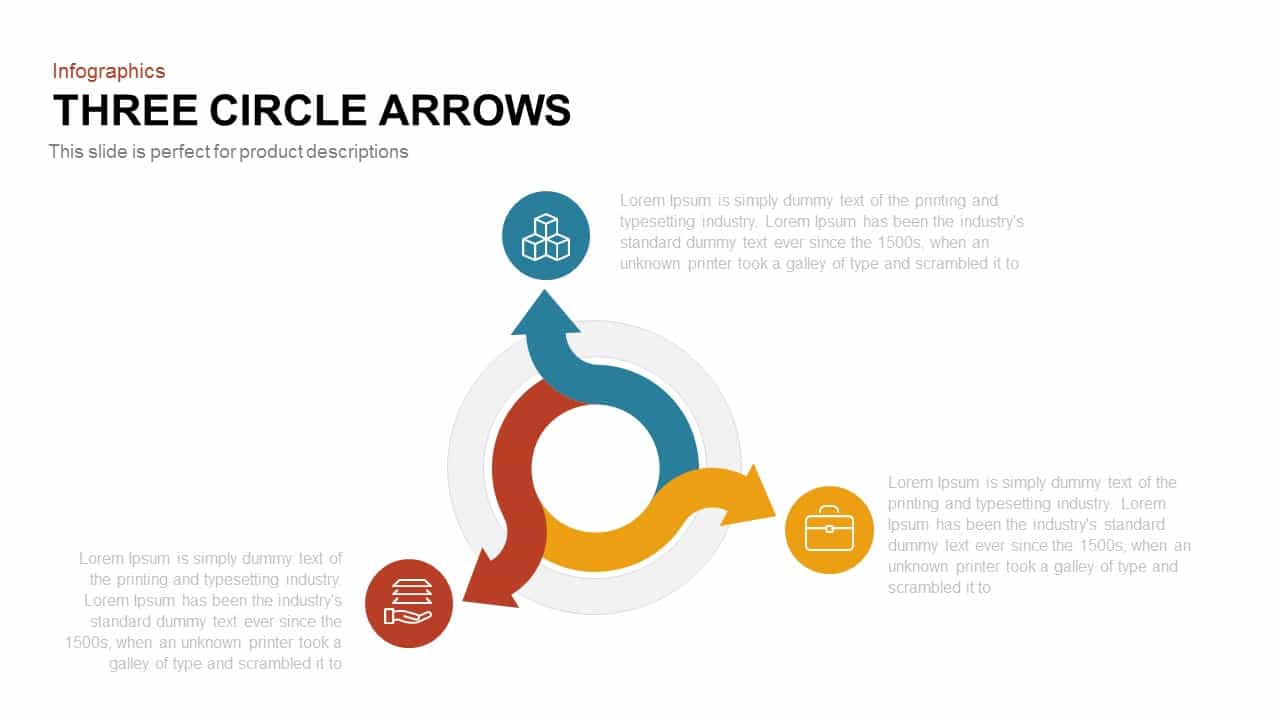
3 Arrows Circle PowerPoint Template and Keynote Slide
Arrow Diagrams
Premium
-
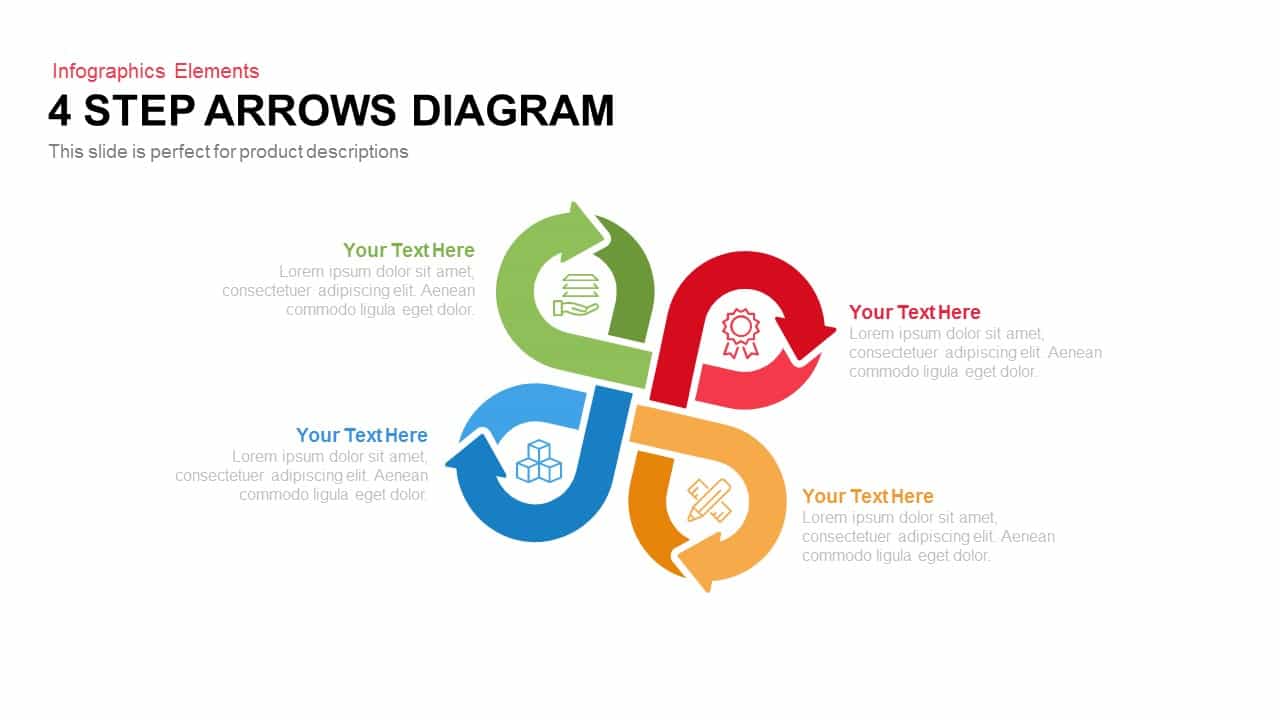
4 Step Arrows Diagram Template for PowerPoint and Keynote
Arrow Diagrams
Premium
-
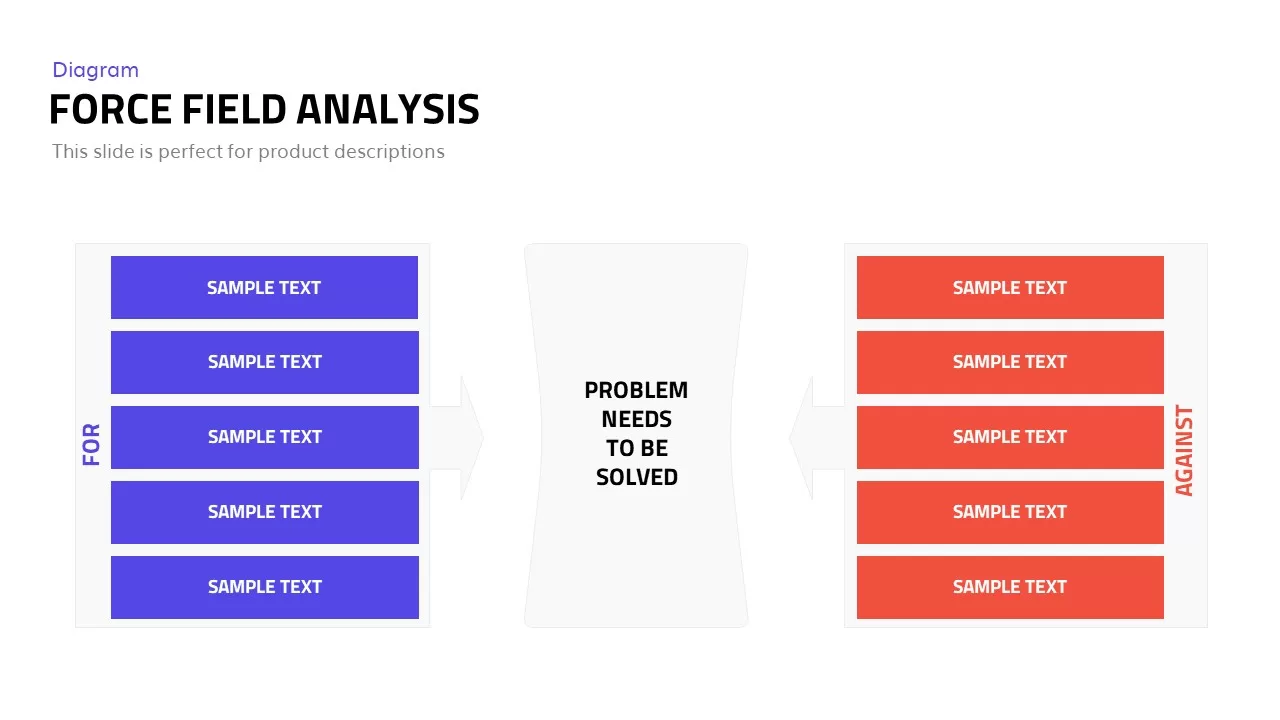
Force Field Analysis PowerPoint Template & Keynote Diagram
Business Models
Premium
-
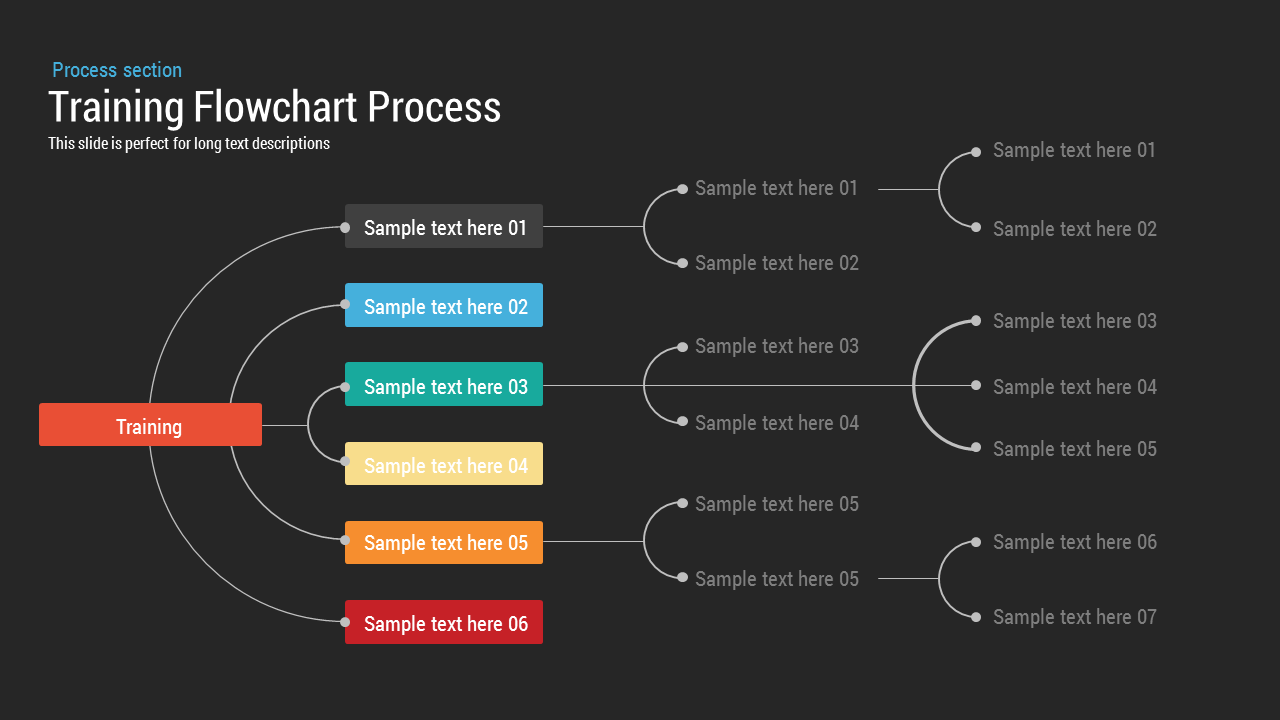
Training Process Flowchart PowerPoint Template and Keynote Slide
Flow Charts
Premium
-
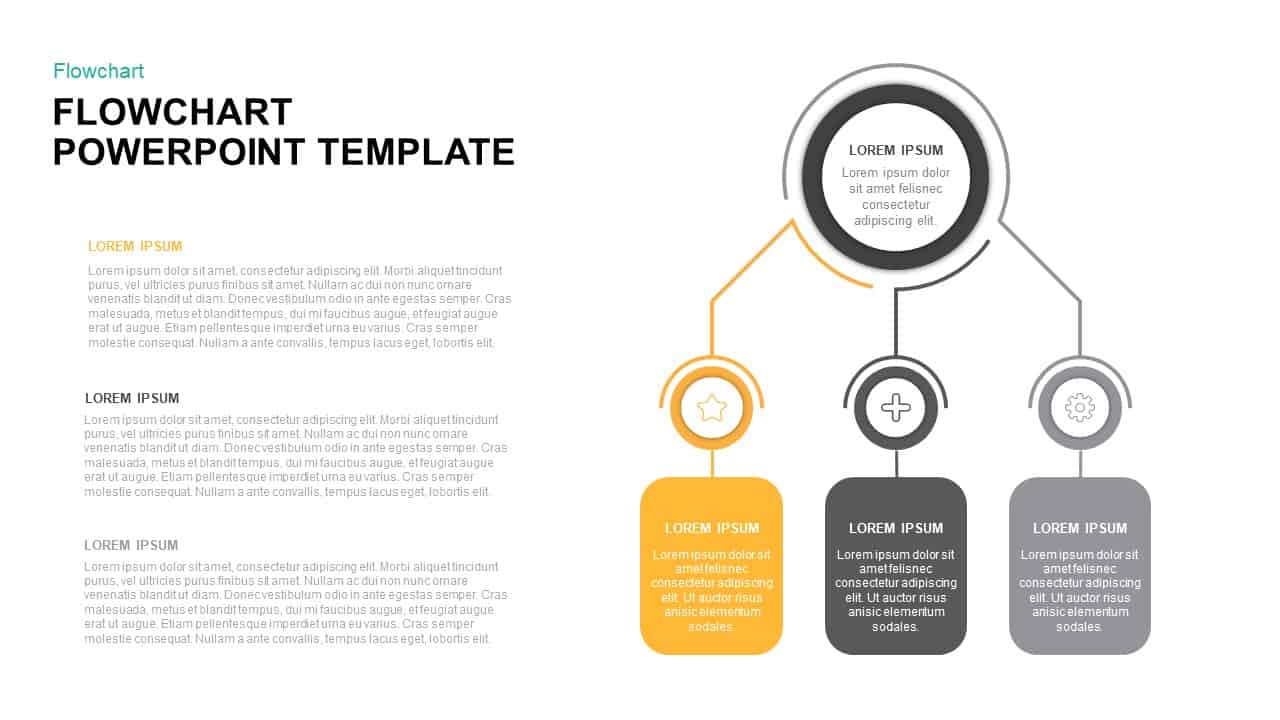
Flow Chart Template For PowerPoint & Keynote Presentations
Flow Charts
Premium
-
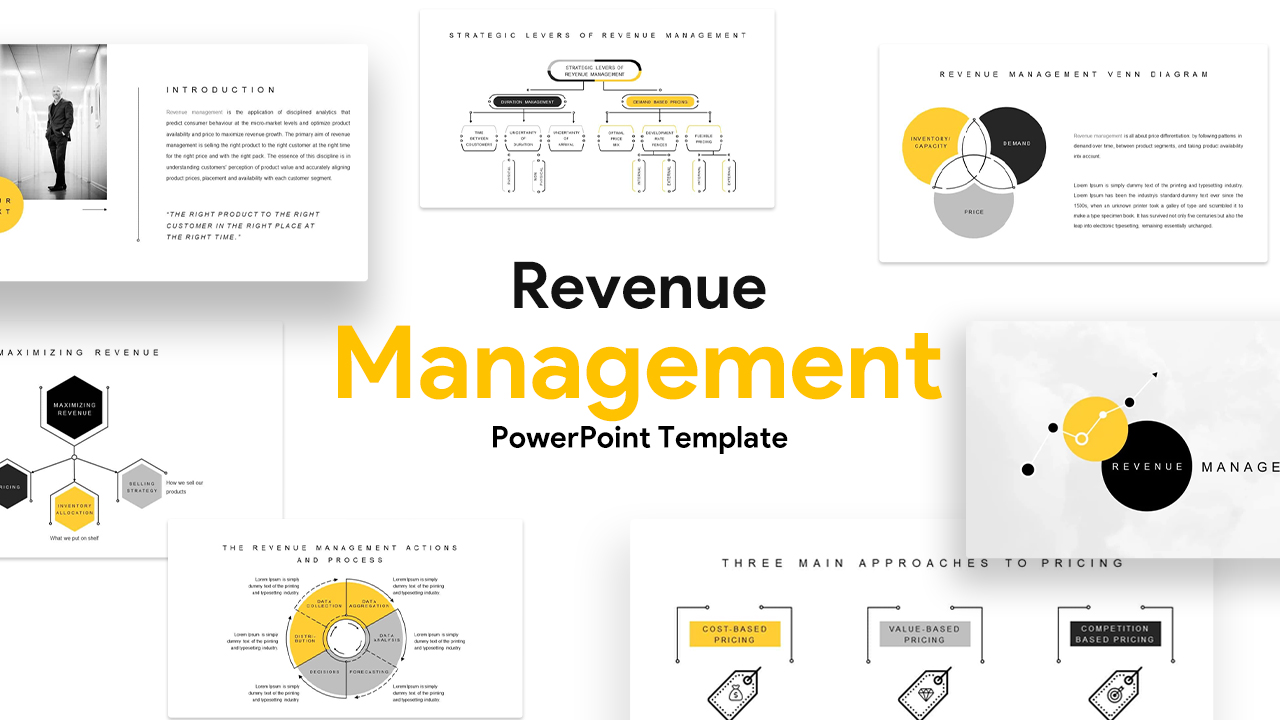
Revenue Management Templates for PowerPoint & Keynote
Business Models
Premium
-
Process Arrows PowerPoint Templates and Keynote template
Arrow Diagrams
Premium
-
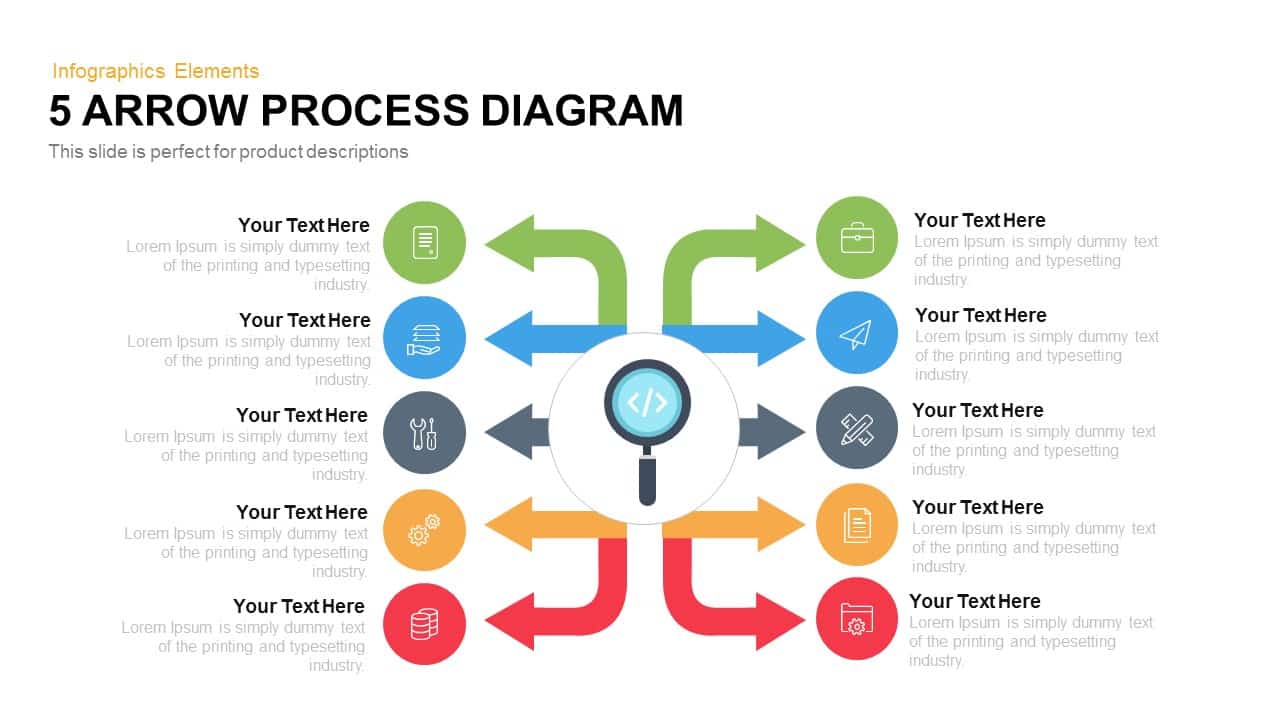
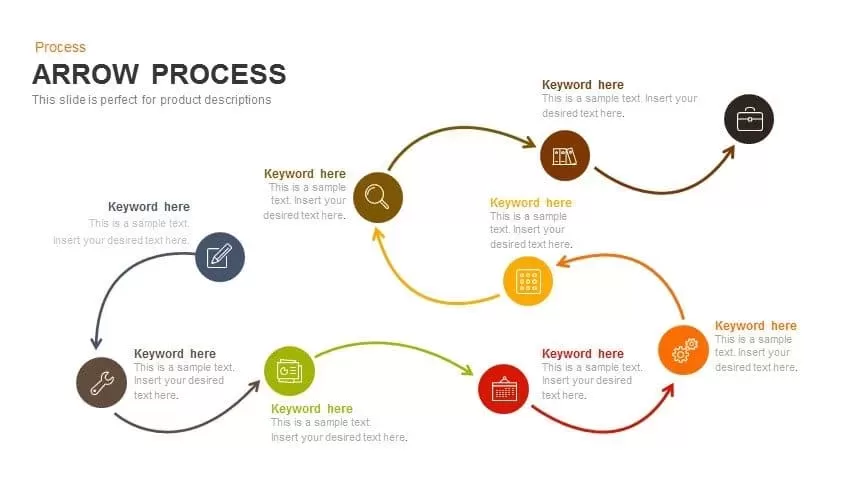
Arrow Process Diagram Template for PowerPoint and Keynote
Arrow Diagrams
Premium
-
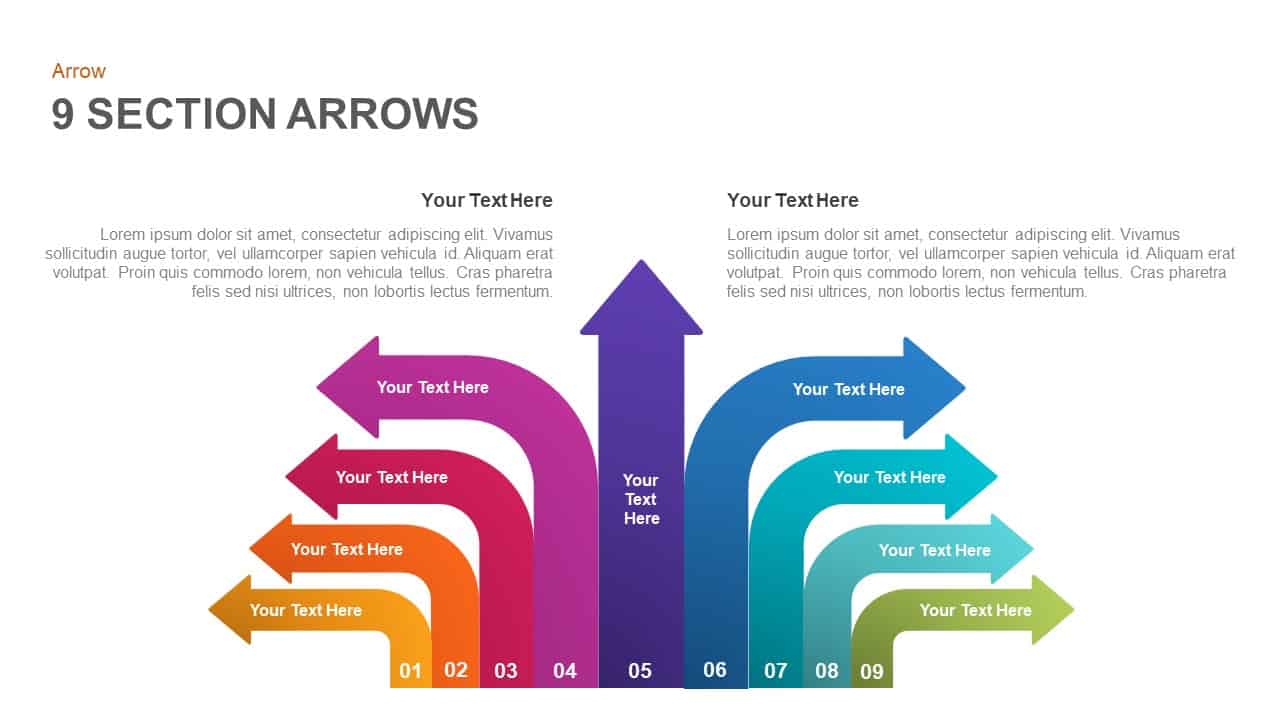
9 Section Arrows PowerPoint Template and Keynote Slide
Arrow Diagrams
Premium
-
Supply Chain Management PowerPoint Template and Logistics
Infographic
Premium
-
Free Management Deck Template
PowerPoint Templates
Free
-
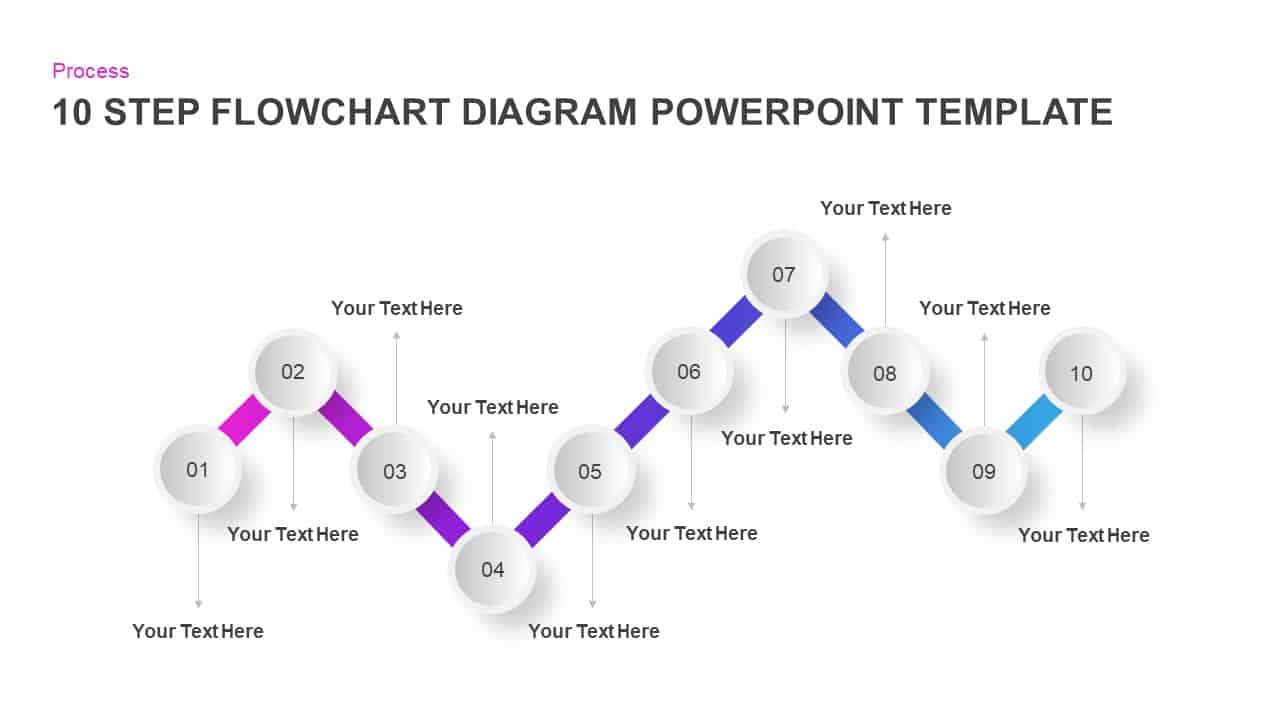
10 Step Flow Chart Diagram Template for PowerPoint and Keynote
Flow Charts
Premium
-
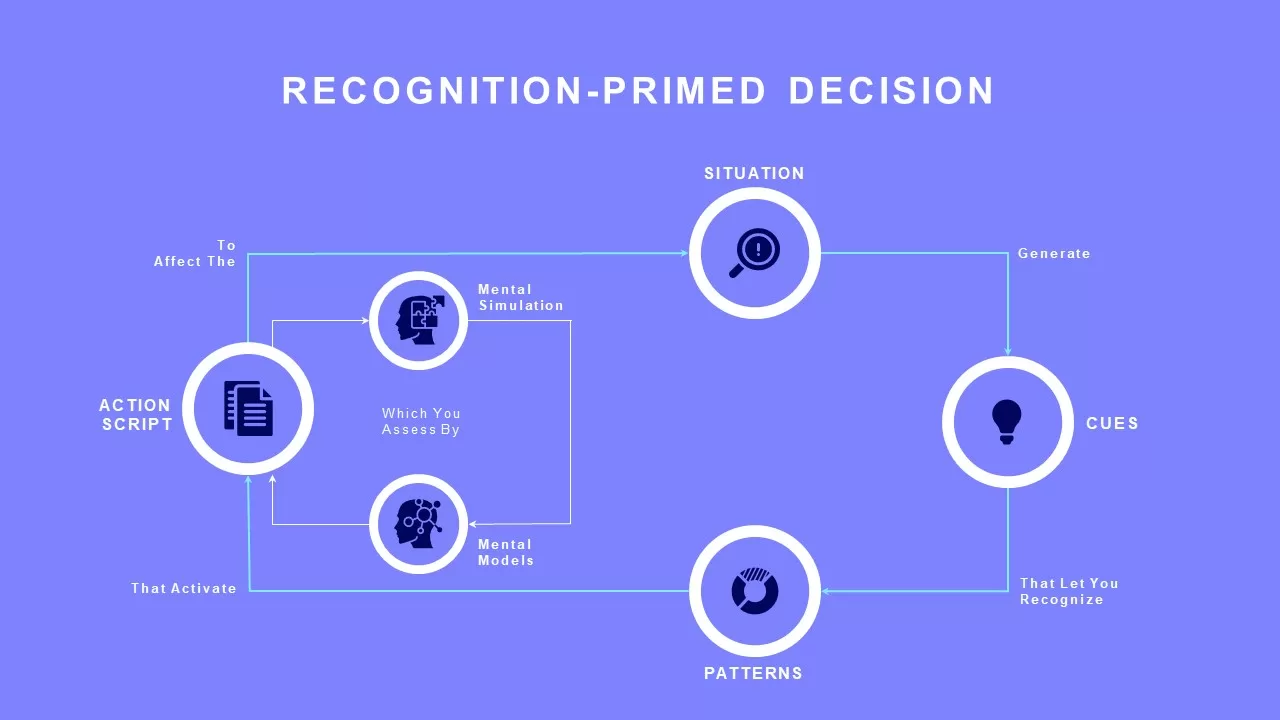
RPD Model Template
Flow Charts
Premium
-
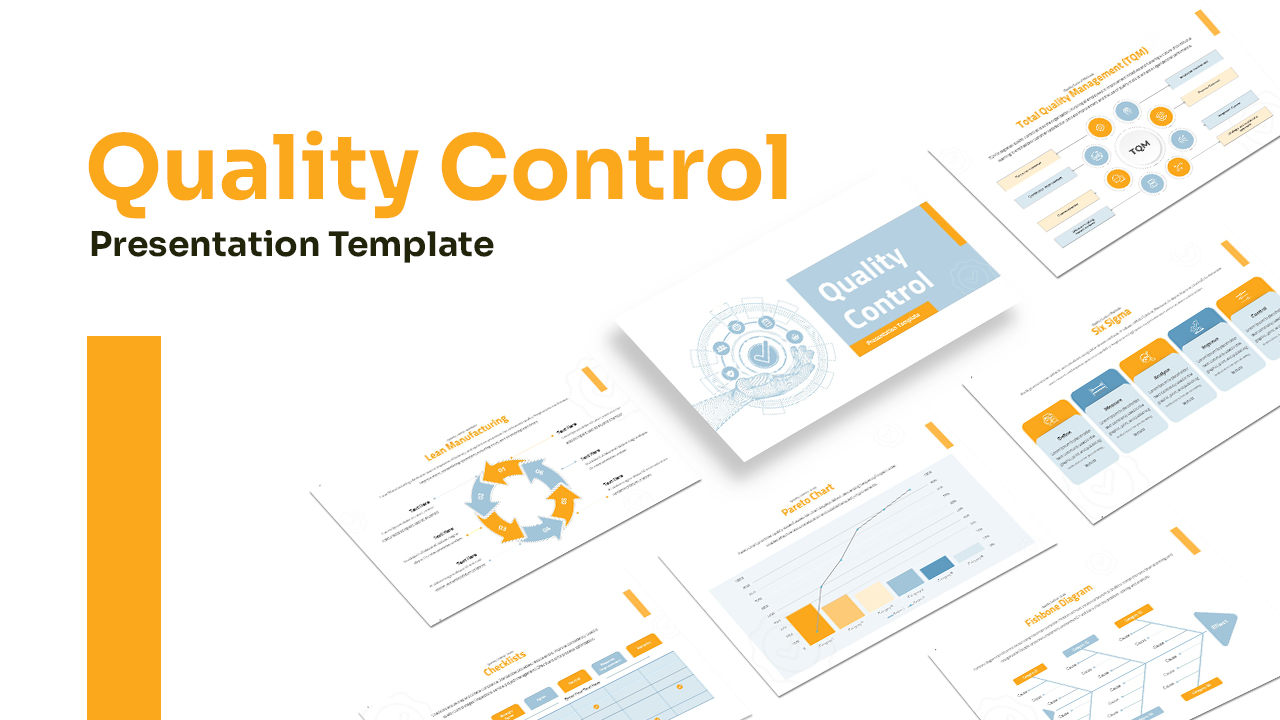
Quality Control Presentation Template
PowerPoint Templates
Premium
-
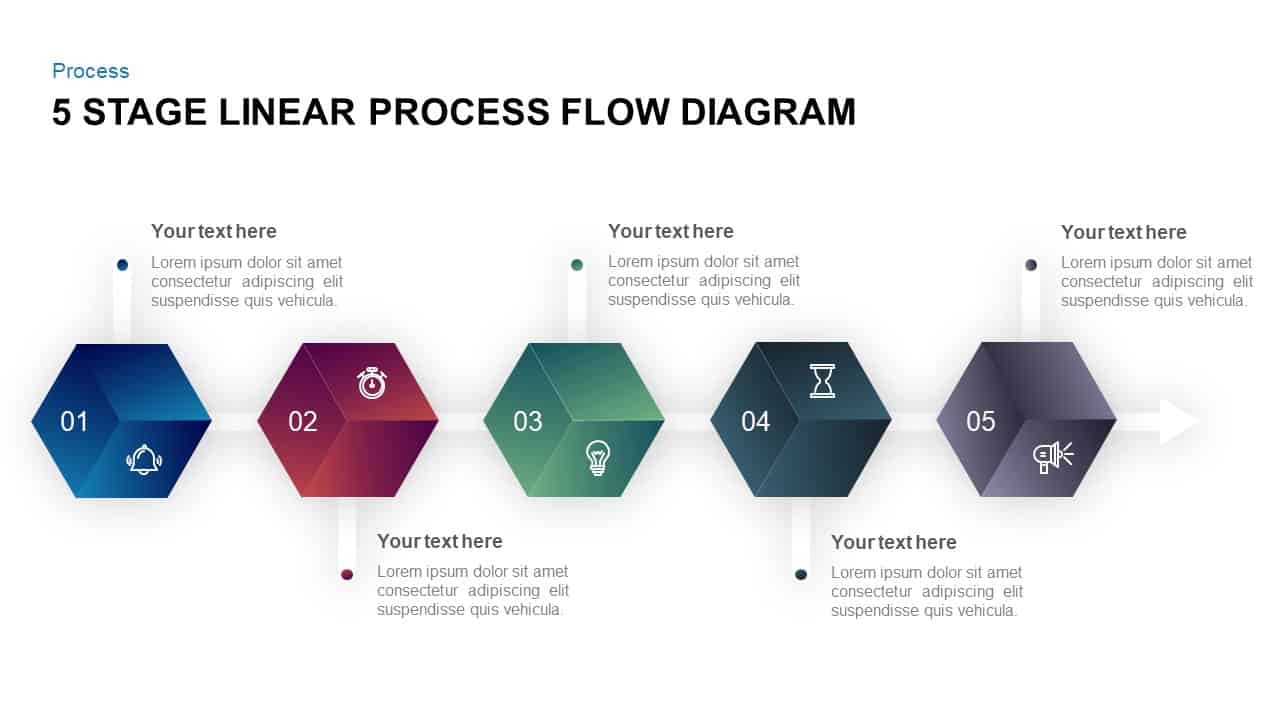
5 Stage Linear Process Flow Diagram PowerPoint Template and Keynote Slide
Process Flow Diagrams
Premium
-
FlowChart PowerPoint Template
Flow Charts
Premium
-
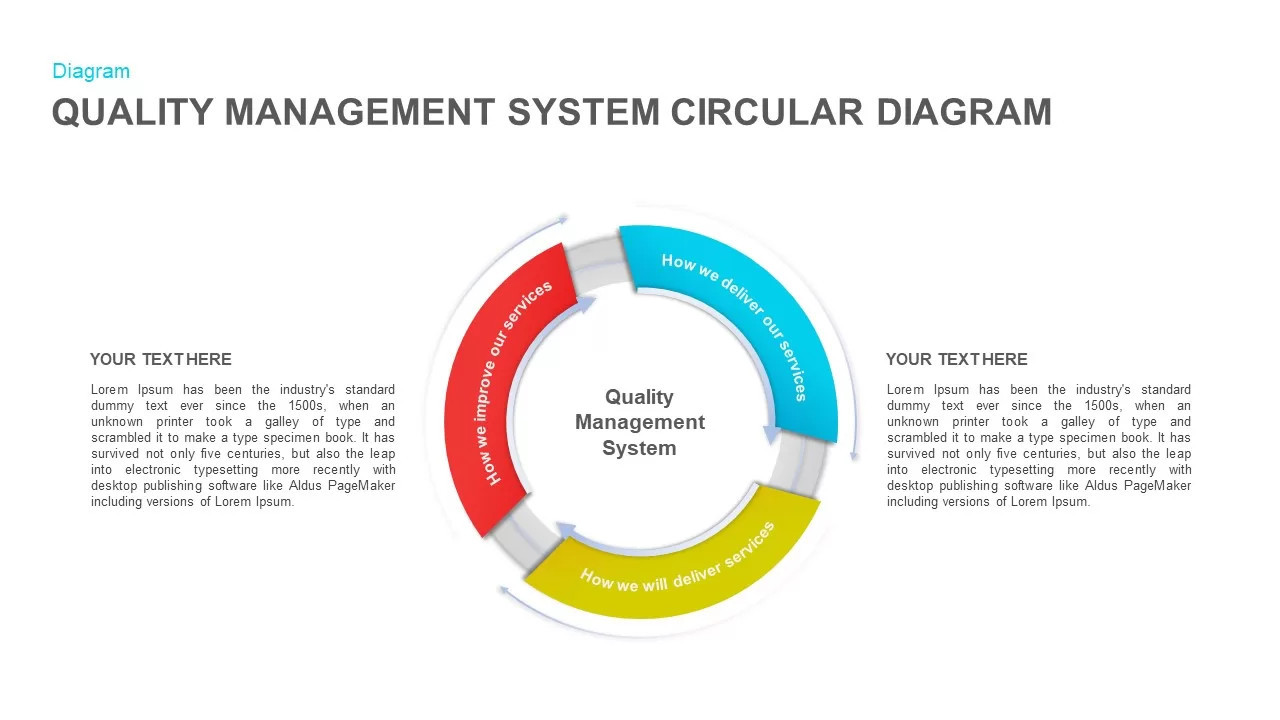
Quality Management System Circular Diagram for PowerPoint
Circular Diagrams
Premium
-
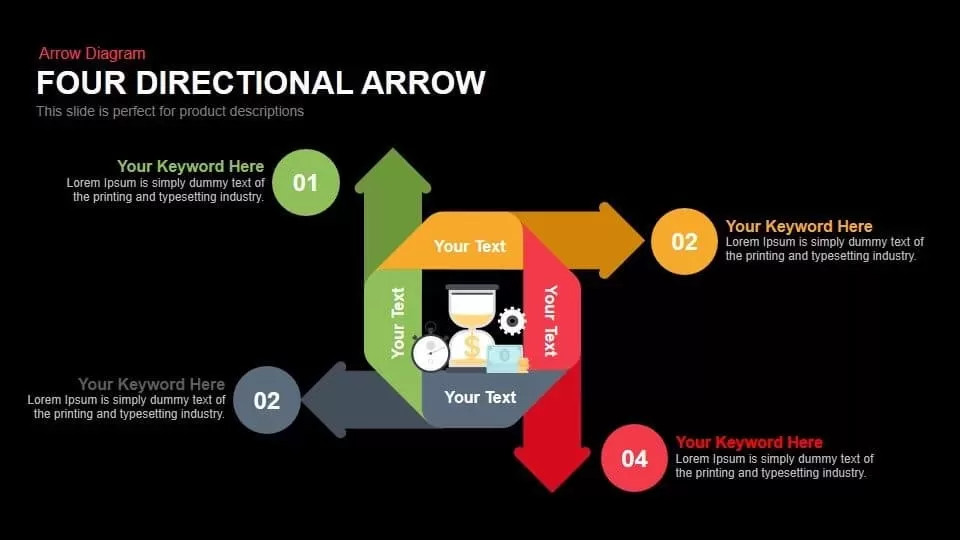
Four Directional Arrows PowerPoint Templates and Keynote
Arrow Diagrams
Premium
-

HR Workflow Process Management PPT Template
Diagrams
Premium
-
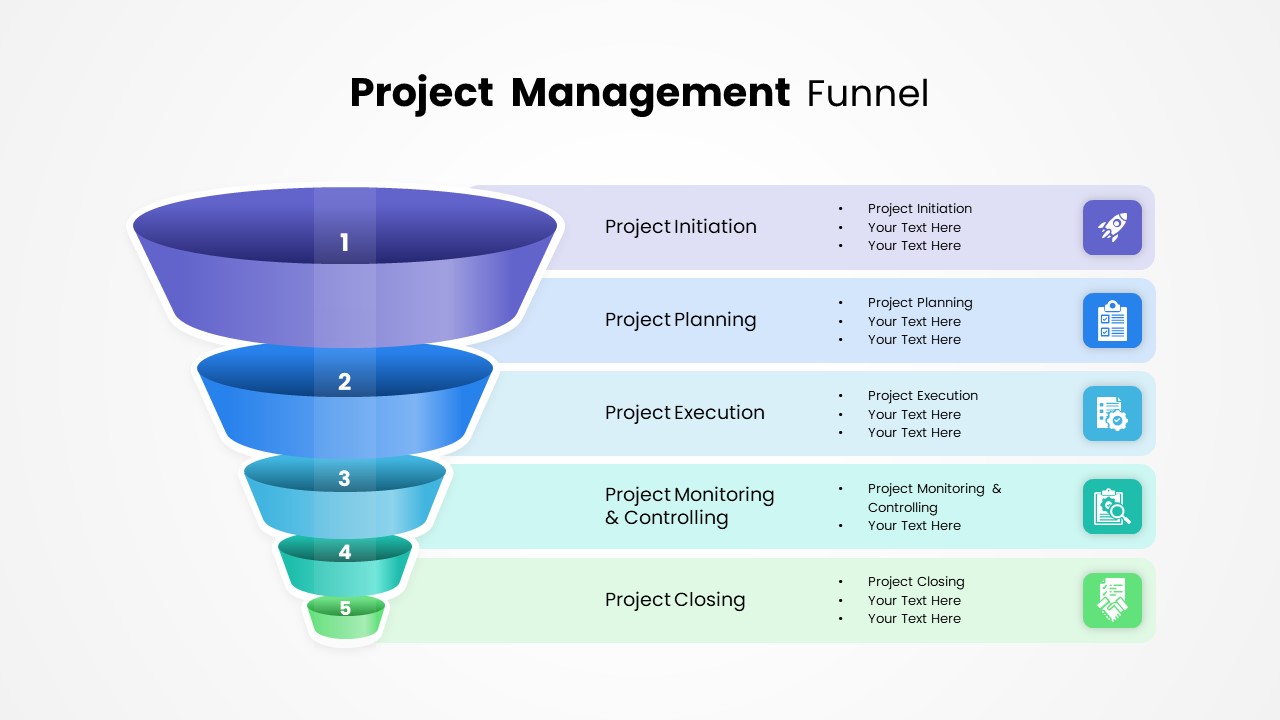
Project Management Funnel Template PowerPoint
Funnel Diagrams
Premium
-
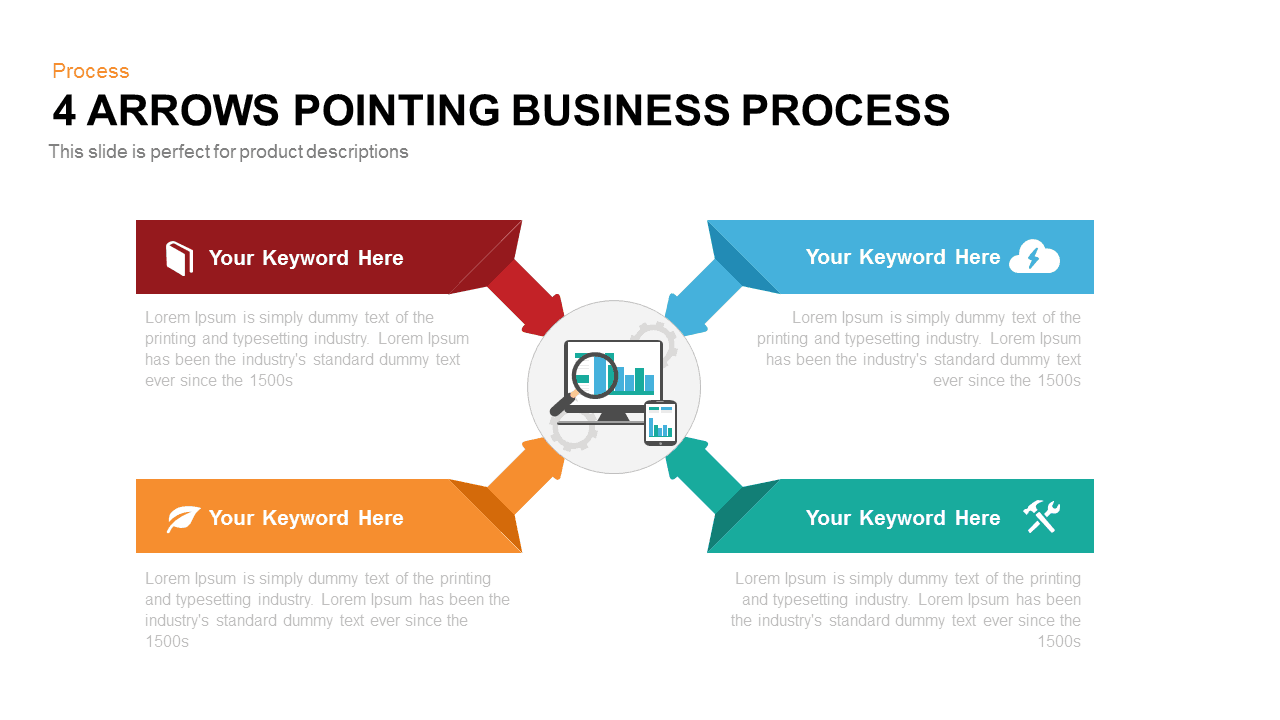
4 Arrows Pointing Business Process PowerPoint and Keynote
Diagrams
Premium
-
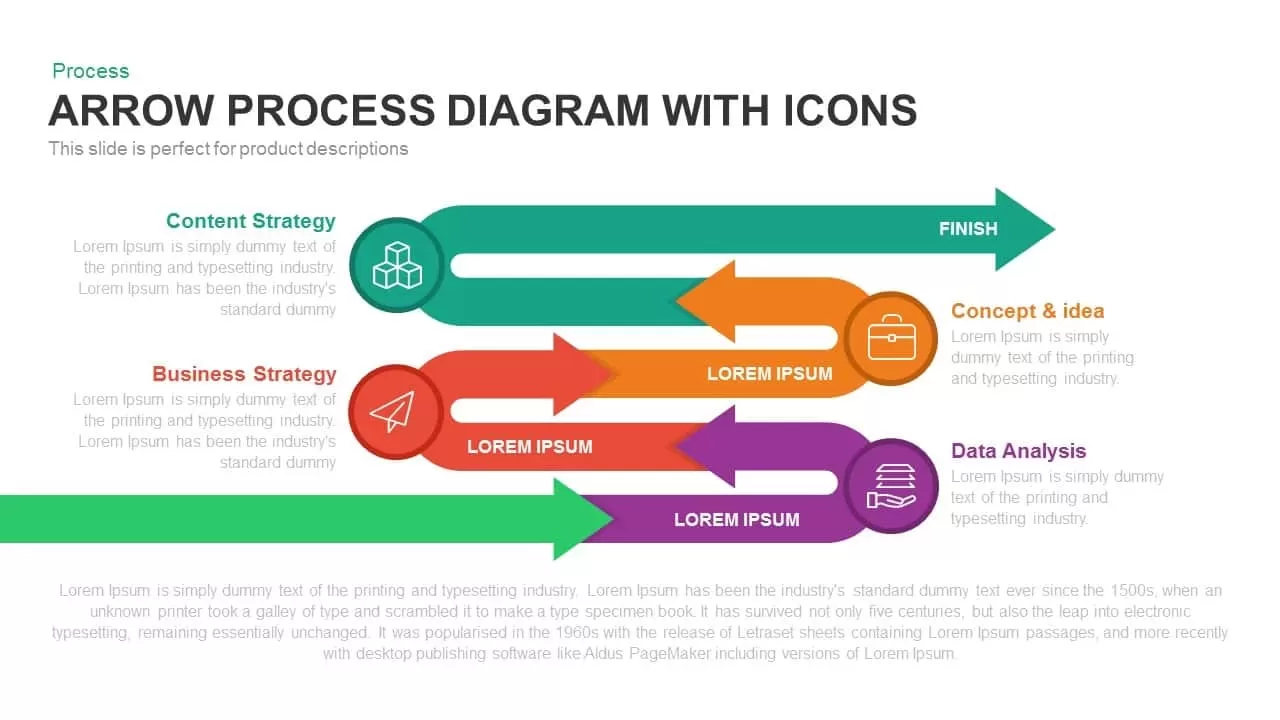
Arrow Process Diagram with Icons
Arrow Diagrams
Premium
-
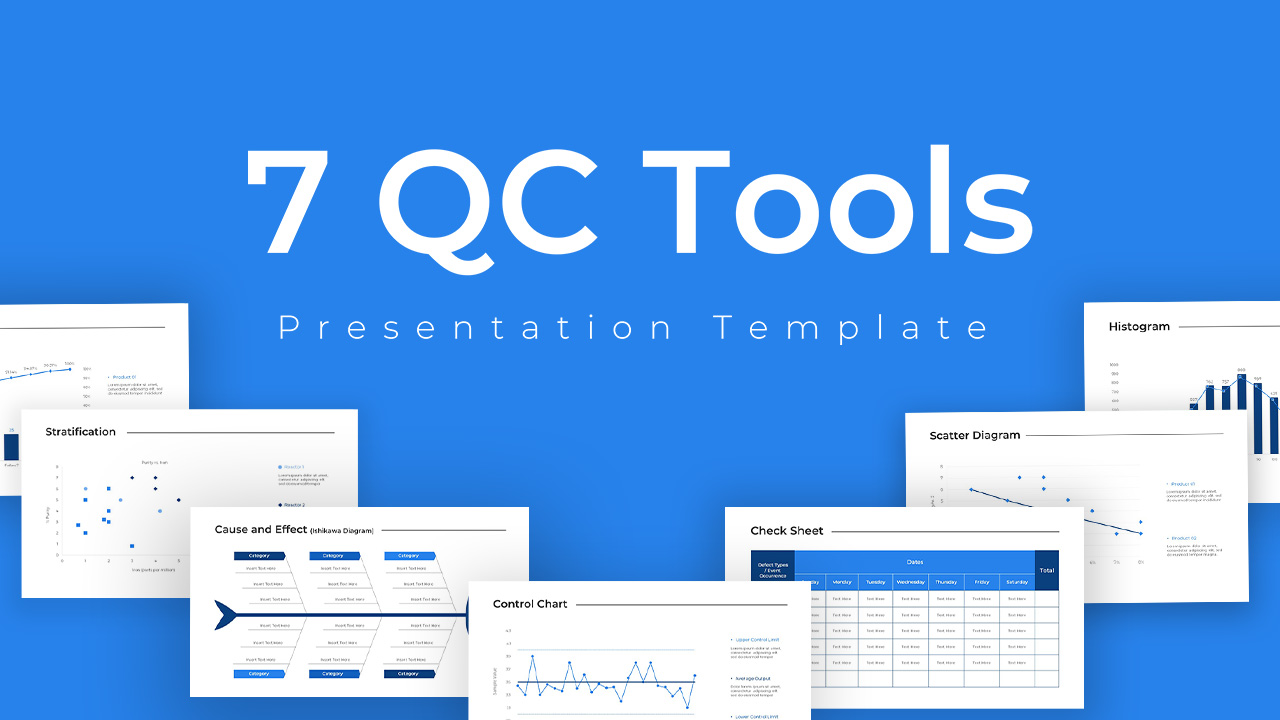
QC Tools PowerPoint Template
Infographic
Premium
-
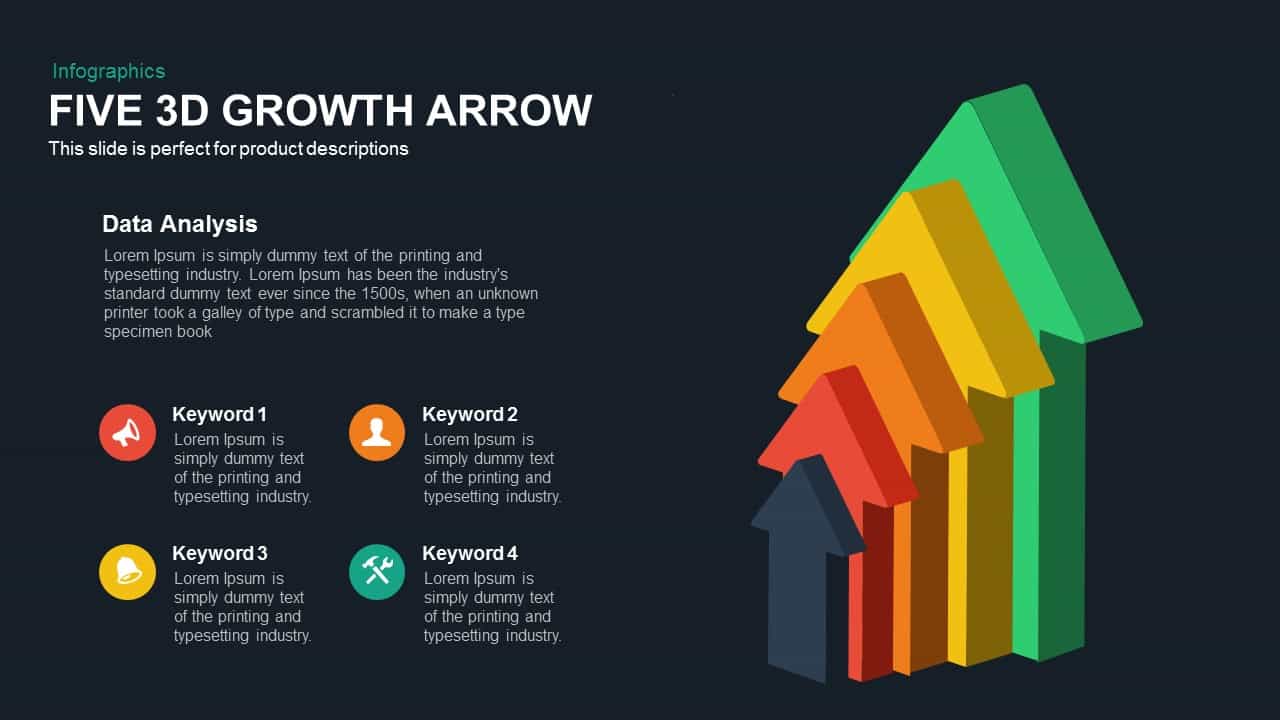
Five 3d Growth Arrows Template for PowerPoint and Keynote
Arrow Diagrams
Premium
-
Distribution Channel PowerPoint Template
Flow Charts
Premium
-
3D Infographics Arrow PowerPoint Template and Keynote Slide
3D Shapes
Premium
-
Free Organizational Chart PowerPoint Template
PowerPoint Templates
Free
-
Free Project Charter PowerPoint Template
Free PowerPoint Templates
Free
-
5 Staged Process Diagram PowerPoint Template and Keynote Slide
Diagrams
Premium
-
4 Arrows PowerPoint Infographics Slide and Keynote Template
Arrow Diagrams
Premium
-
Cyclical Process For Business Process Improvement PowerPoint and Keynote Presentation
Process Flow Diagrams
Premium
-
Decision making unit PowerPoint template
PowerPoint Templates
Premium
-
MEDDPICC PowerPoint Template
PowerPoint Templates
Premium
-
Sunk Cost Fallacy PowerPoint Template
PowerPoint Templates
Premium
-
5 Section Hemisphere Diagram Template for PowerPoint and Keynote
Infographic
Premium
-
Puzzle PowerPoint Template Diagram and Keynote Slide
Puzzle
Premium
-
Approaches to Management Development PowerPoint Template and Keynote
Diagrams
Premium
-
Kinship Diagram PowerPoint Template
PowerPoint Templates
Premium
-
Consumer Decision Journey PowerPoint Template
PowerPoint Templates
Premium
-
Project Management Dashboard PowerPoint Template and Keynote Template
PowerPoint Templates
Premium
-
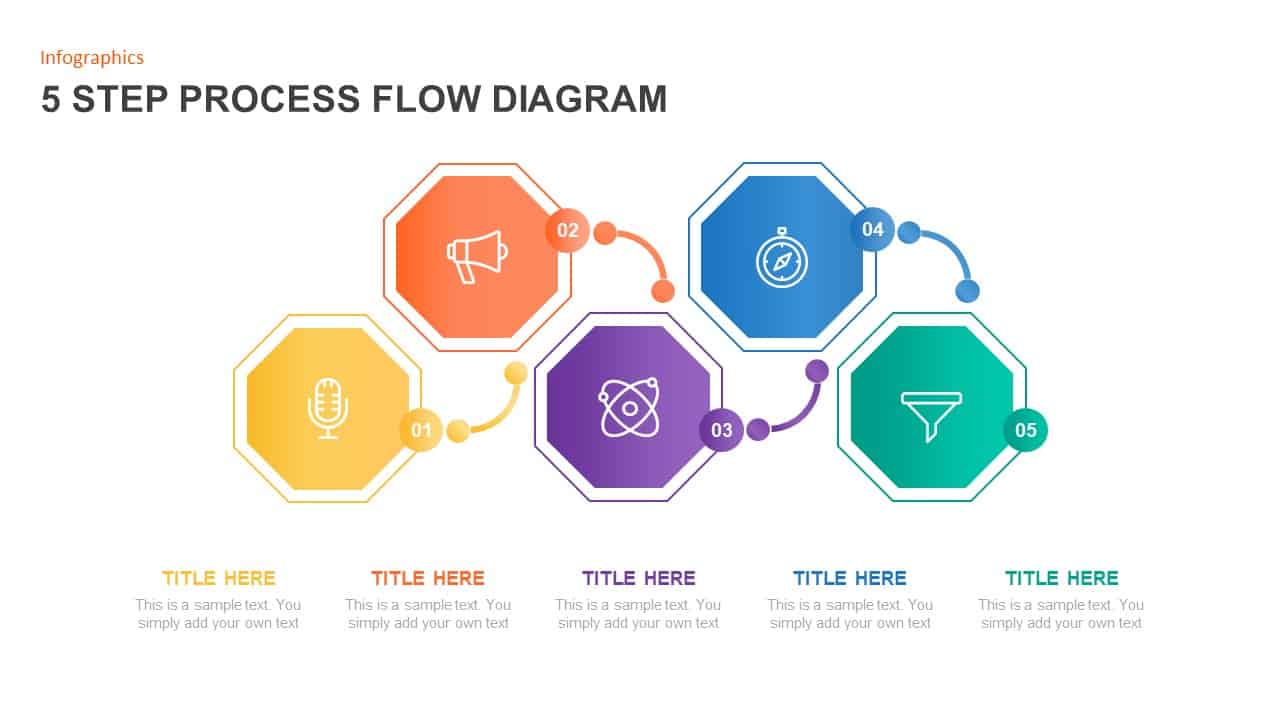
5 Step Process Flow Diagram Template
Process Flow Diagrams
Premium
-
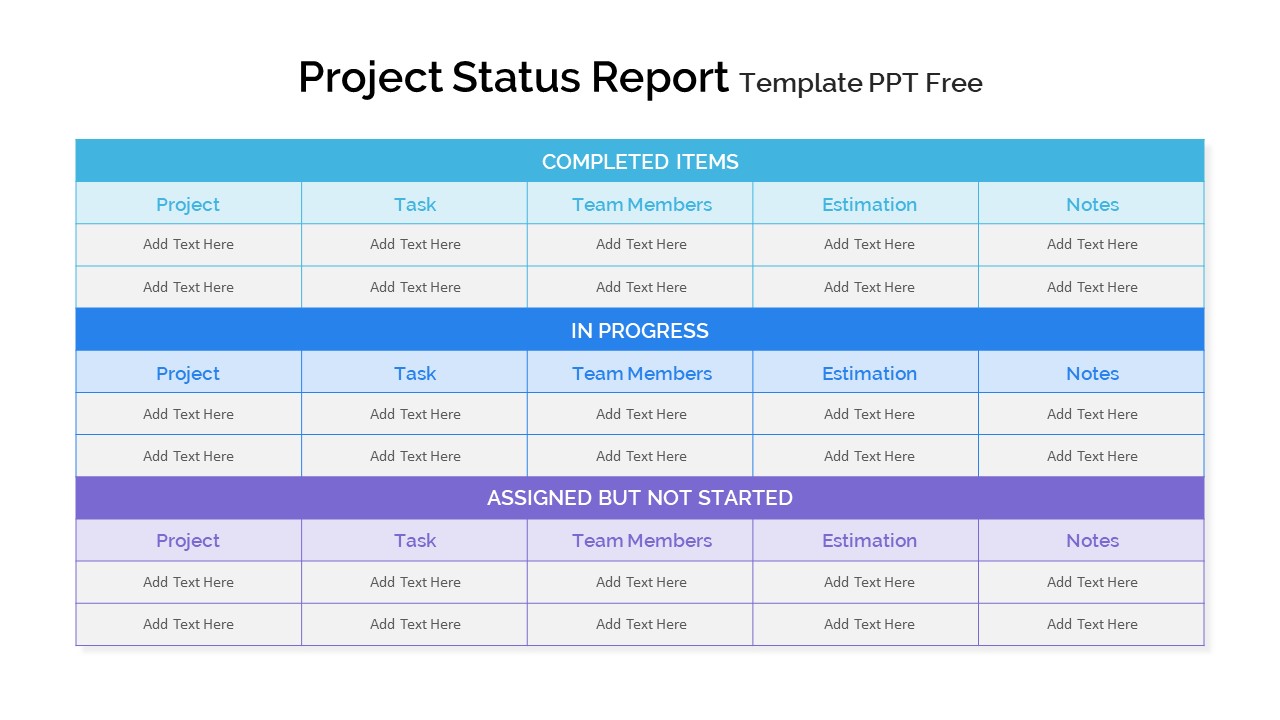
Project Status Report PowerPoint Template Free
PowerPoint Templates
Free
-
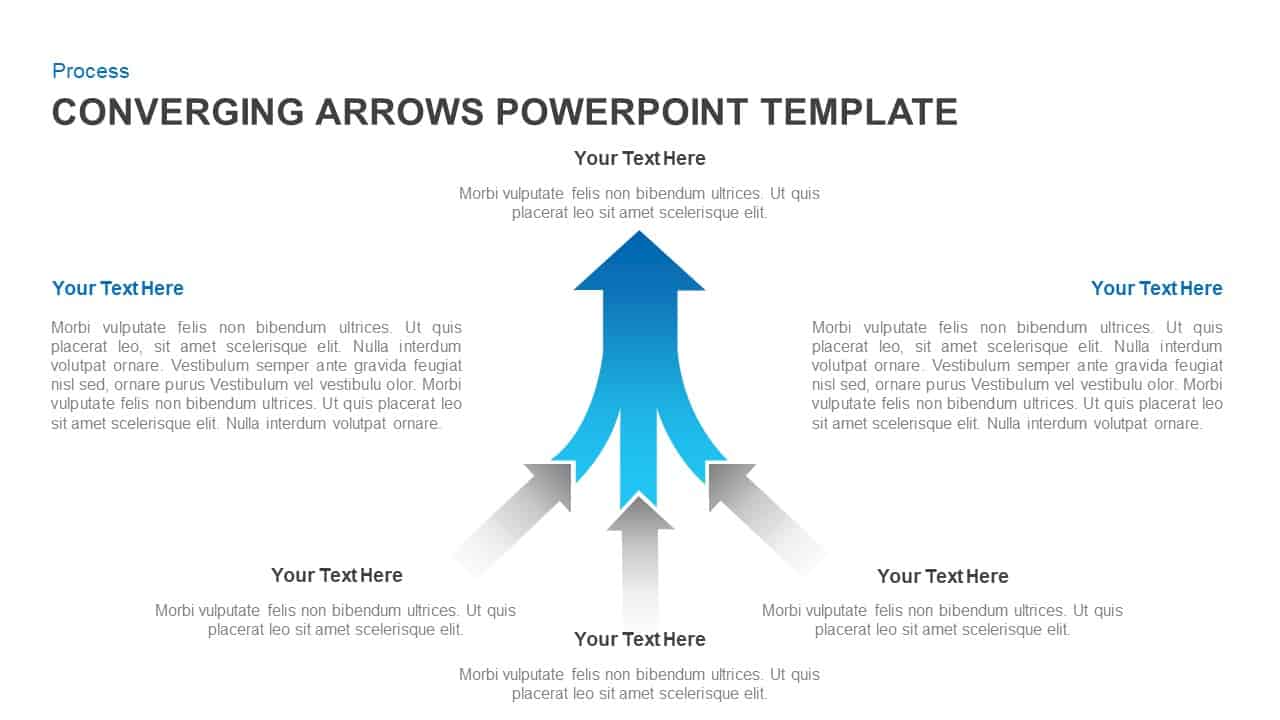
Converging Arrows Template for PowerPoint & Keynote
Arrow Diagrams
Premium
-
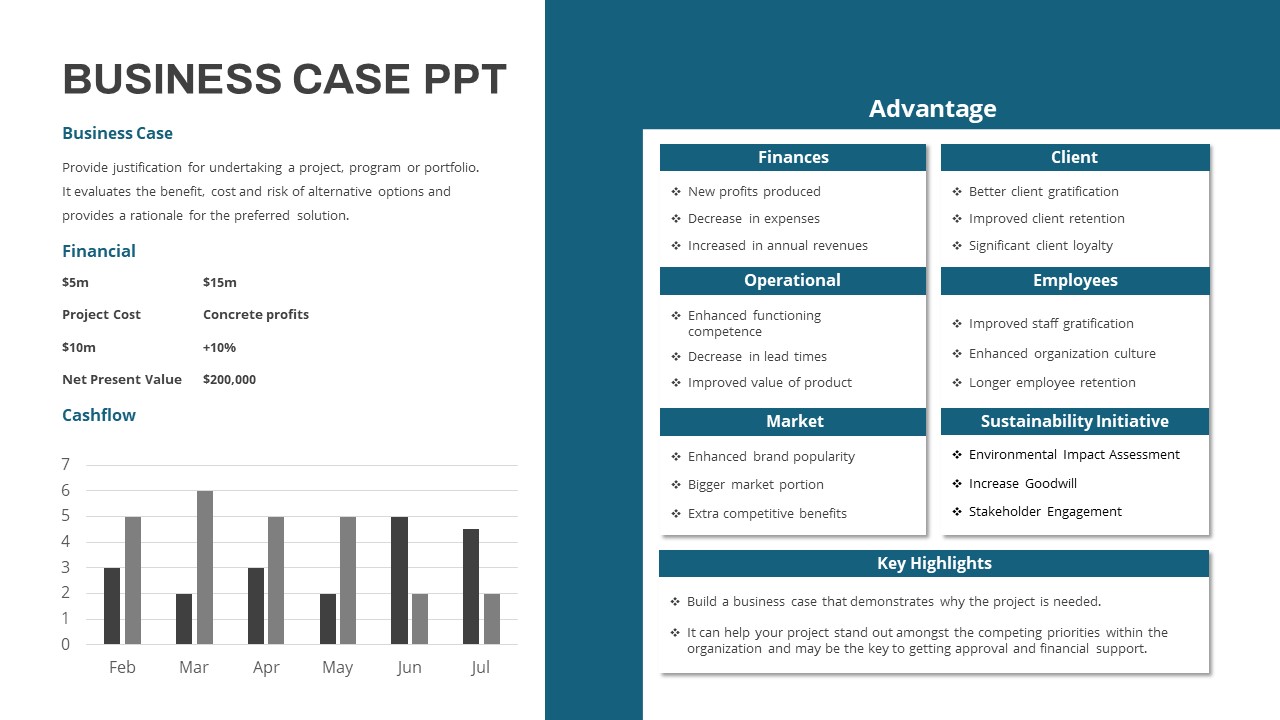
Business Case PowerPoint Template
Keynote Templates
Premium
-
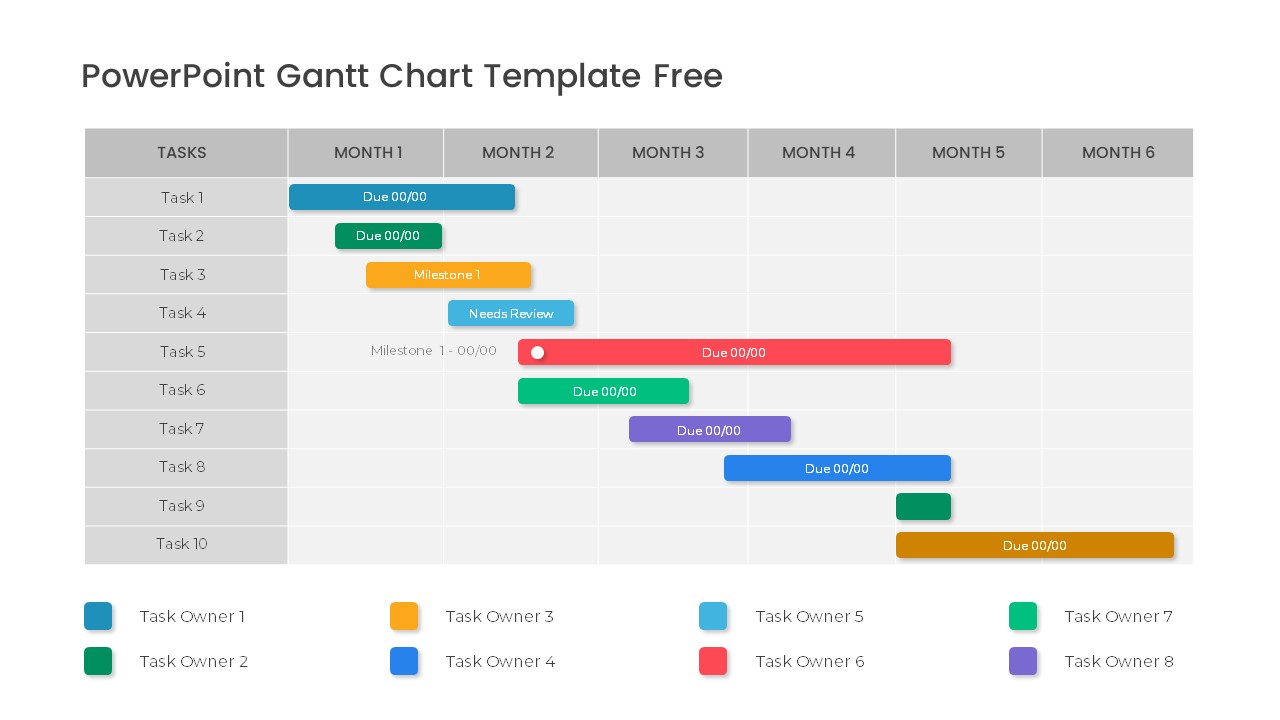
Free PowerPoint Gantt Chart Template
PowerPoint Charts
Free
-
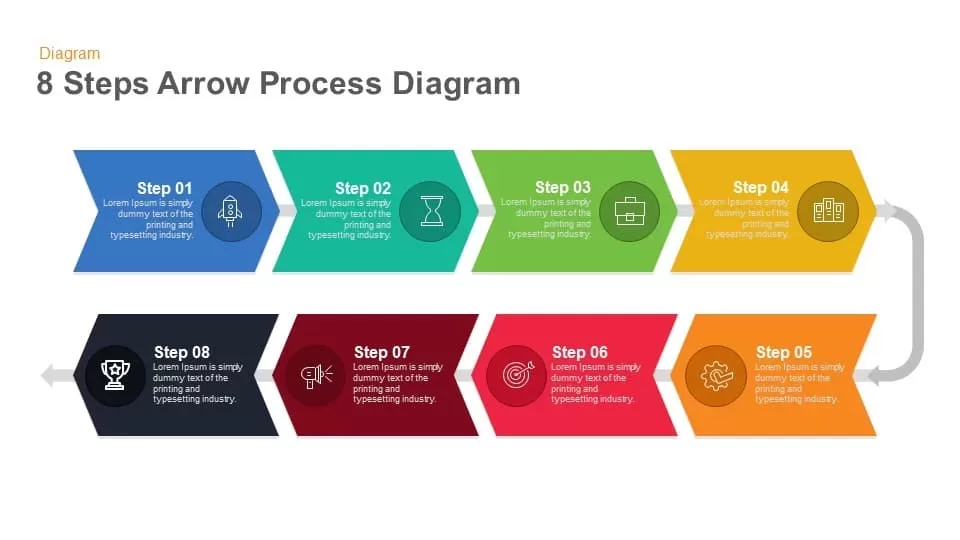
8 Steps Arrow Process Diagram PowerPoint Template and Keynote
Process Flow Diagrams
Premium
-
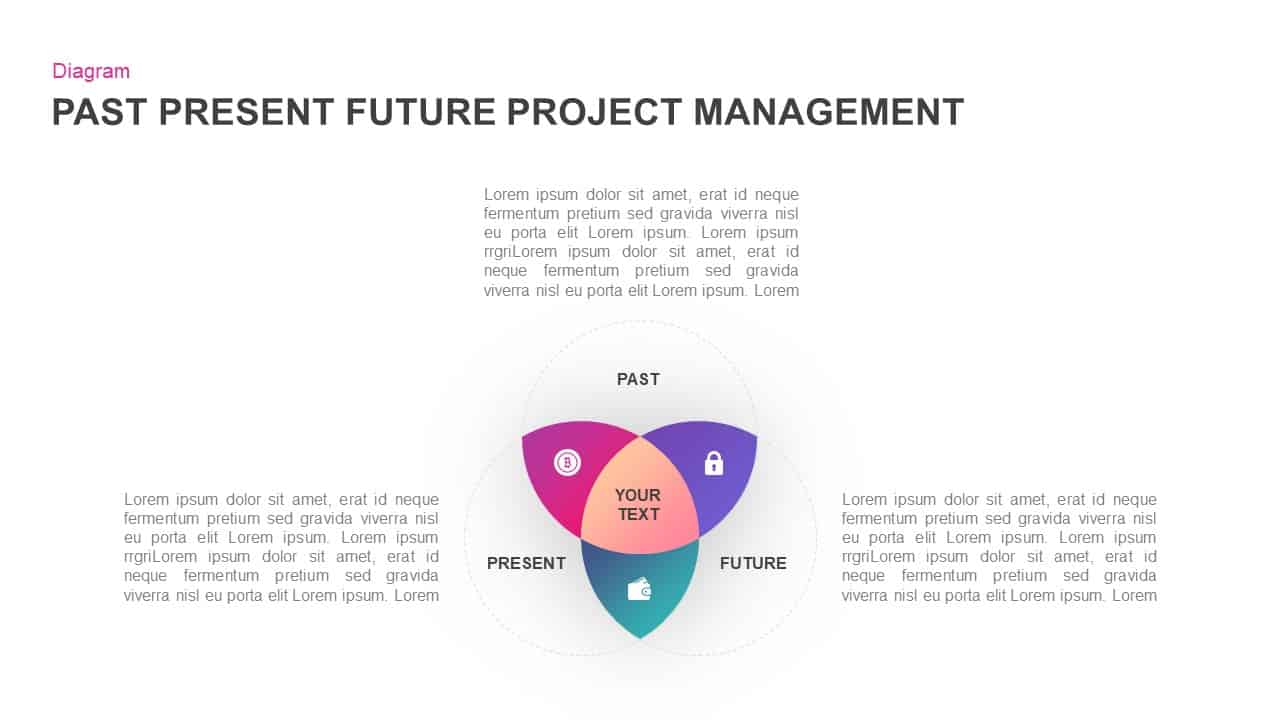
Past Present Future Project Management Template for PowerPoint & Keynote
Business Models
Premium
-
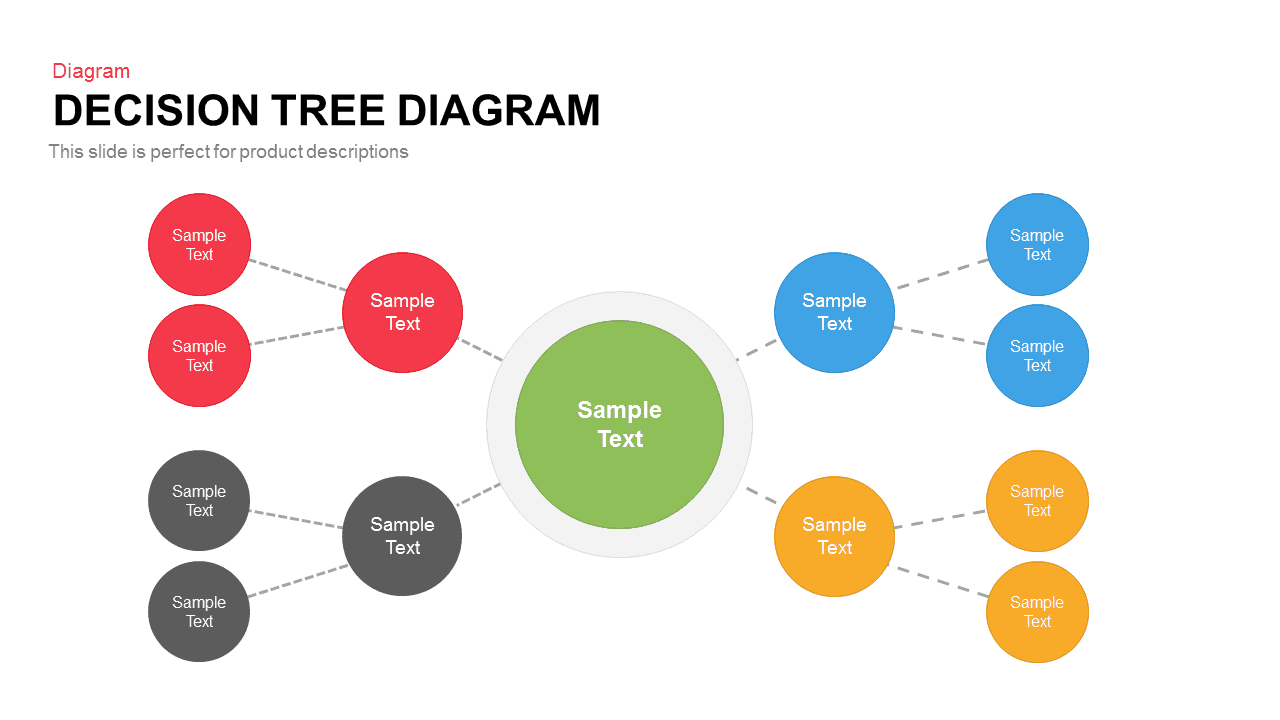
Decision Tree Diagram Template for PowerPoint and Keynote Presentation
Diagrams
Premium
-
Four Way Diagram PowerPoint Template & Keynote
Diagrams
Premium
-
Diverging Arrows Template for PowerPoint & Keynote
Arrow Diagrams
Premium
-
Six Directional Arrows PowerPoint Templates and Keynote
Arrow Diagrams
Premium
-
Genogram Template PowerPoint
Flow Charts
Premium
-
Magnifying Glass PowerPoint Template With Arrows Infographics
Arrow Diagrams
Premium
-
10 Staged Business Circle Process Diagram Template for PowerPoint and Keynote
Process Flow Diagrams
Premium
-
Business Process Improvement PowerPoint Template and Keynote
Diagrams
Premium
-
4 Options Cross Infographic PowerPoint Diagram
Business Models
Premium
-
Project Stage Gate Template
PowerPoint Templates
Premium
-
Sales Cycle Steps PowerPoint Template and Keynote Template
Circular Diagrams
Premium
-
6 Step Process Flow Diagram Template
Process Flow Diagrams
Premium
-
Six Circle Process Diagram Template
PowerPoint Templates
Premium
-
Project Roadmap PowerPoint Template
PowerPoint Templates
Premium
-
Project Life Cycle Diagram Template
Business Models
Premium
-
Flow Infographic
Flow Charts
Premium
-
Organizational Structure Keynote and Powerpoint Template
Org Charts
Premium
-
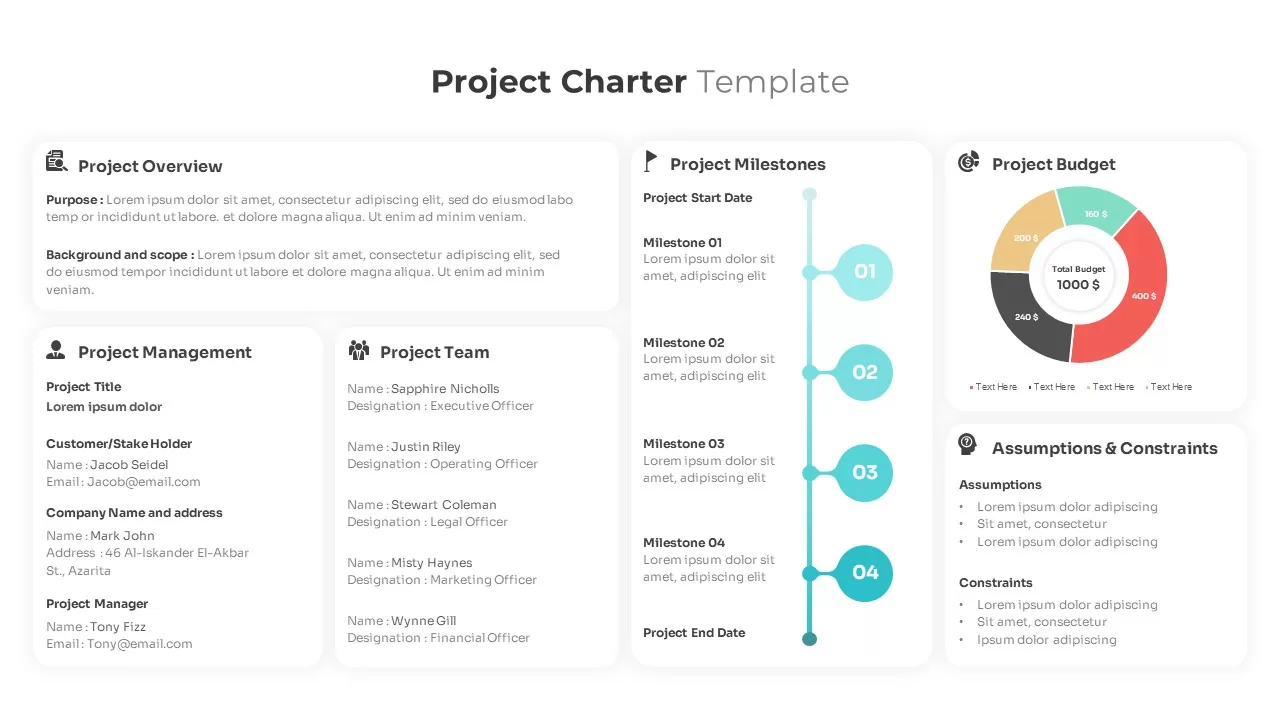
Project Charter Template
Text and Table
Premium
-

Management Strategy PowerPoint Deck Template
PowerPoint Templates
Premium
-
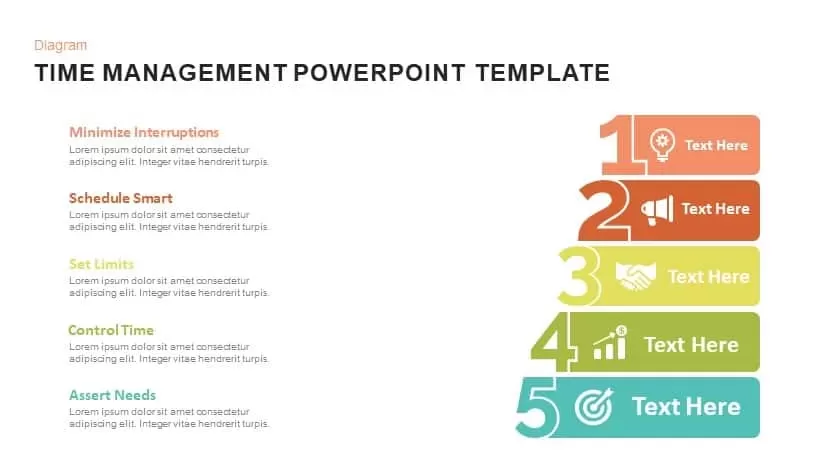
Time Management PowerPoint Template and Keynote Slide
Diagrams
Premium
-
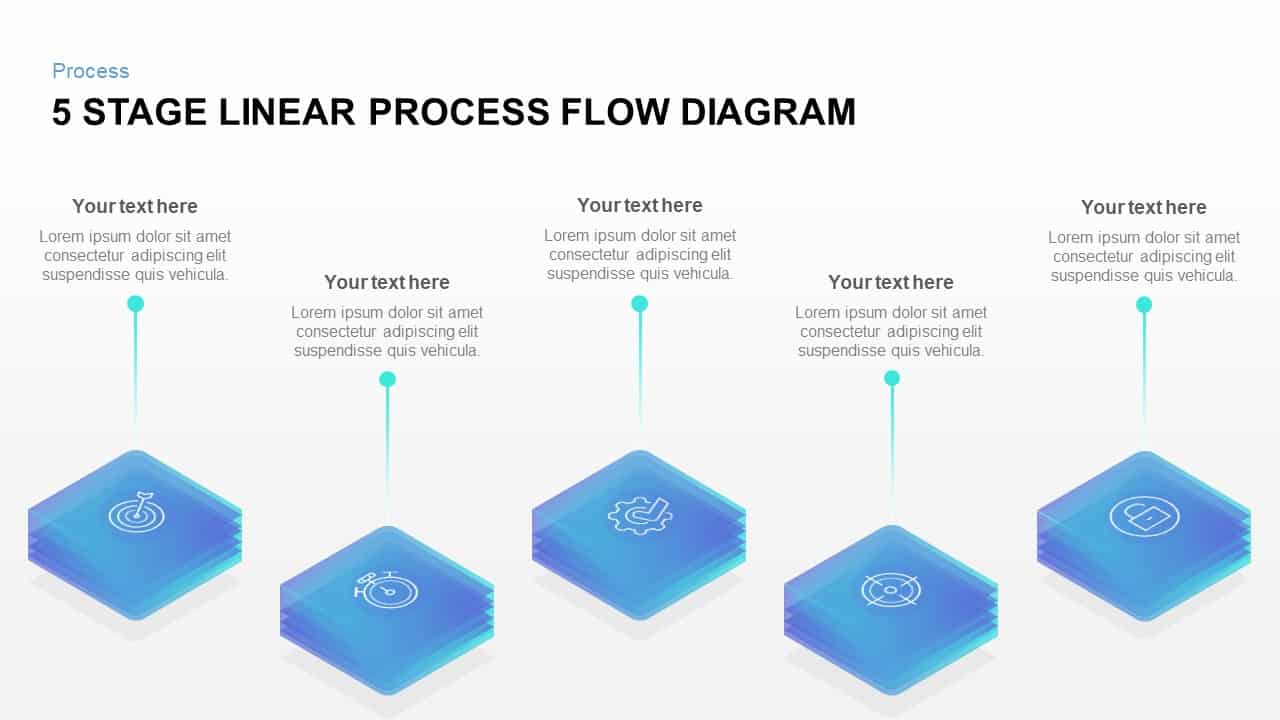
5 Stage Linear Process Flow Diagram Template
Process Flow Diagrams
Premium