


Creative Diagram Infographic Template


- Version
- Download 18
- File Size 0.00 KB
- File Count 1
- Create Date January 6, 2022
- Last Updated February 6, 2023
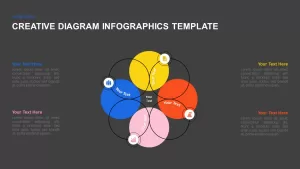
Creative Diagram Infographic Template
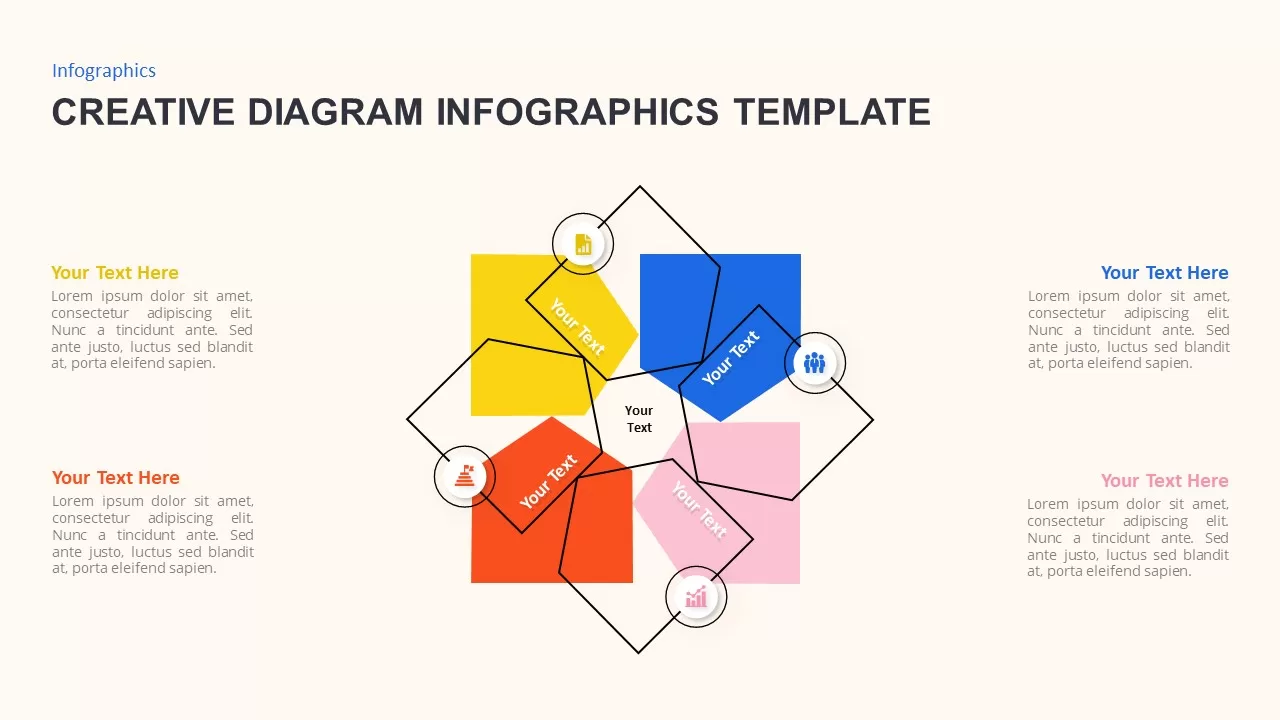
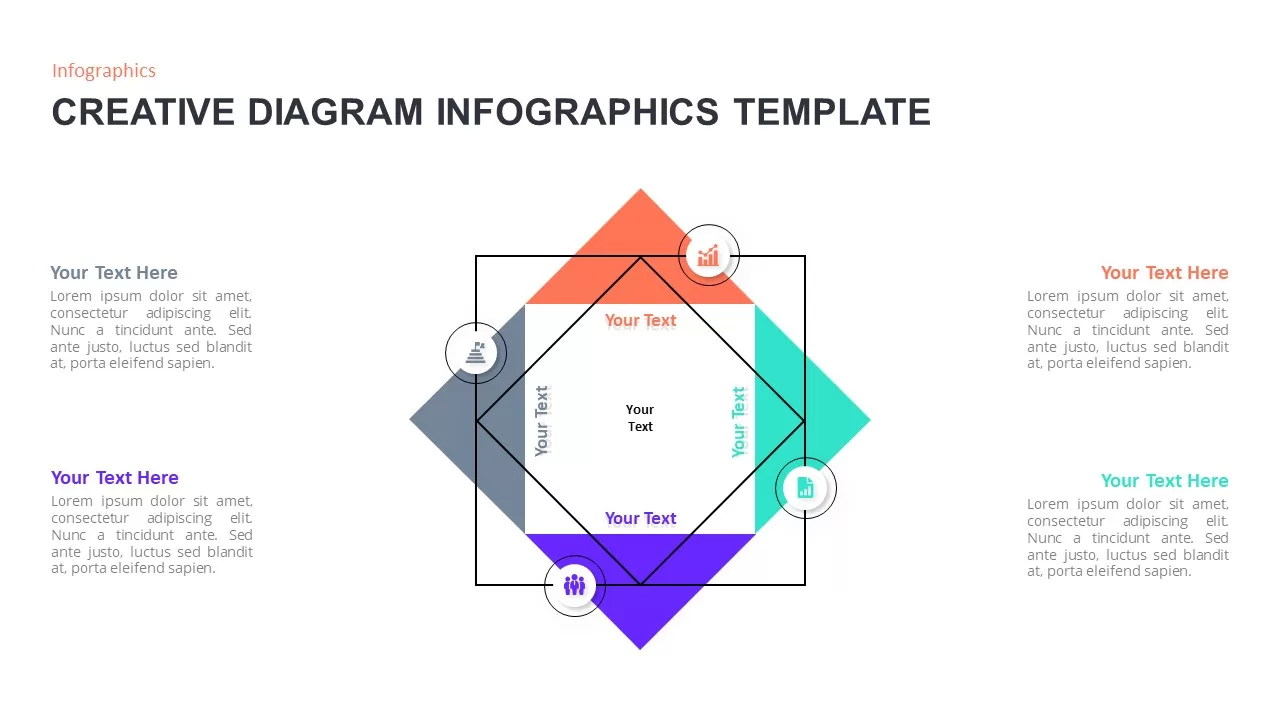
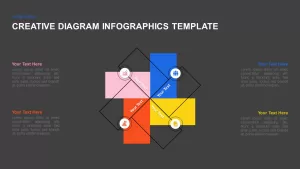
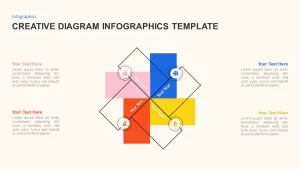
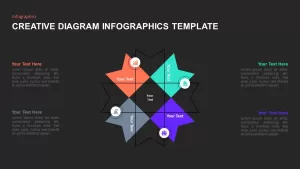
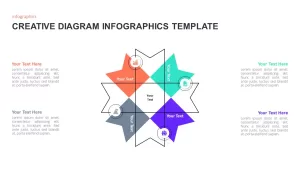
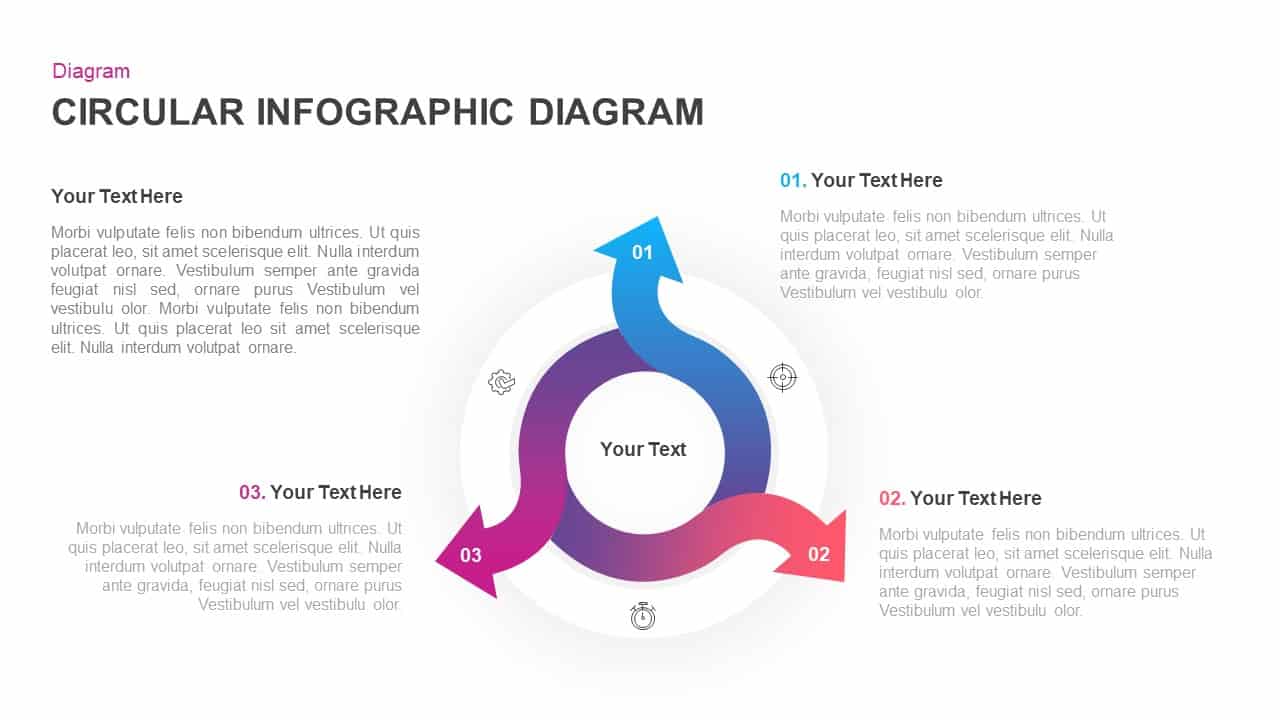
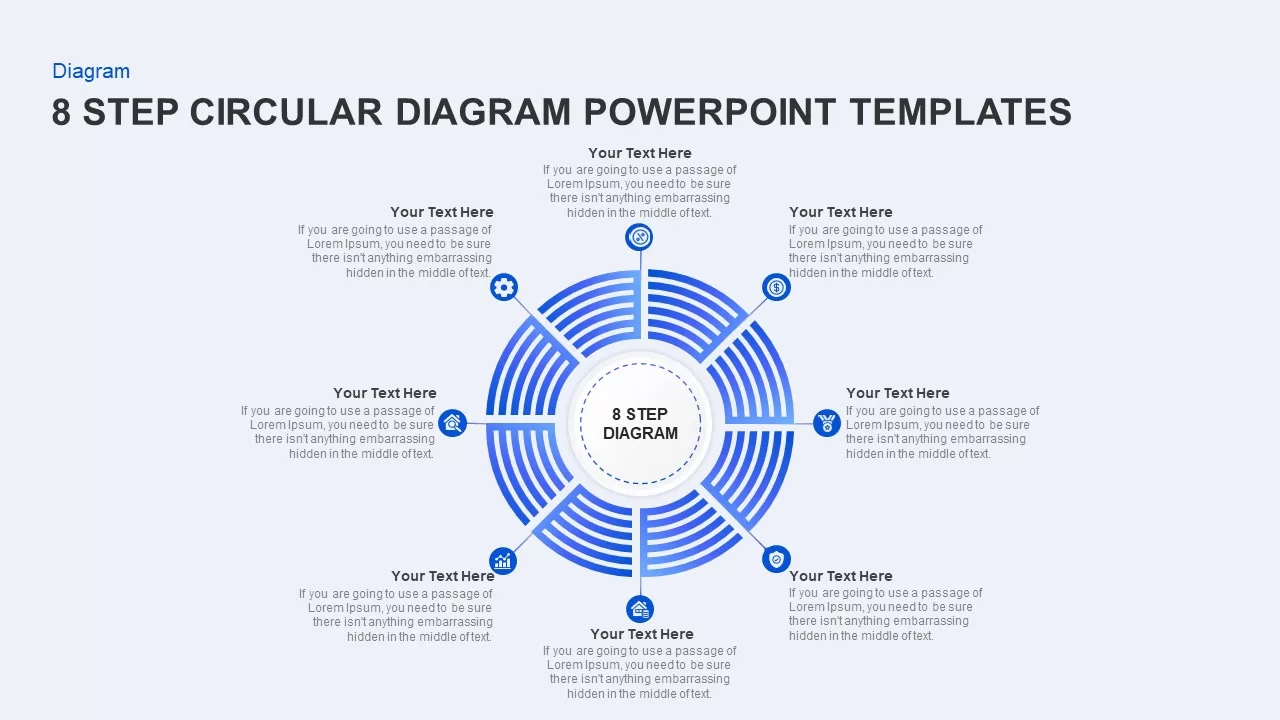
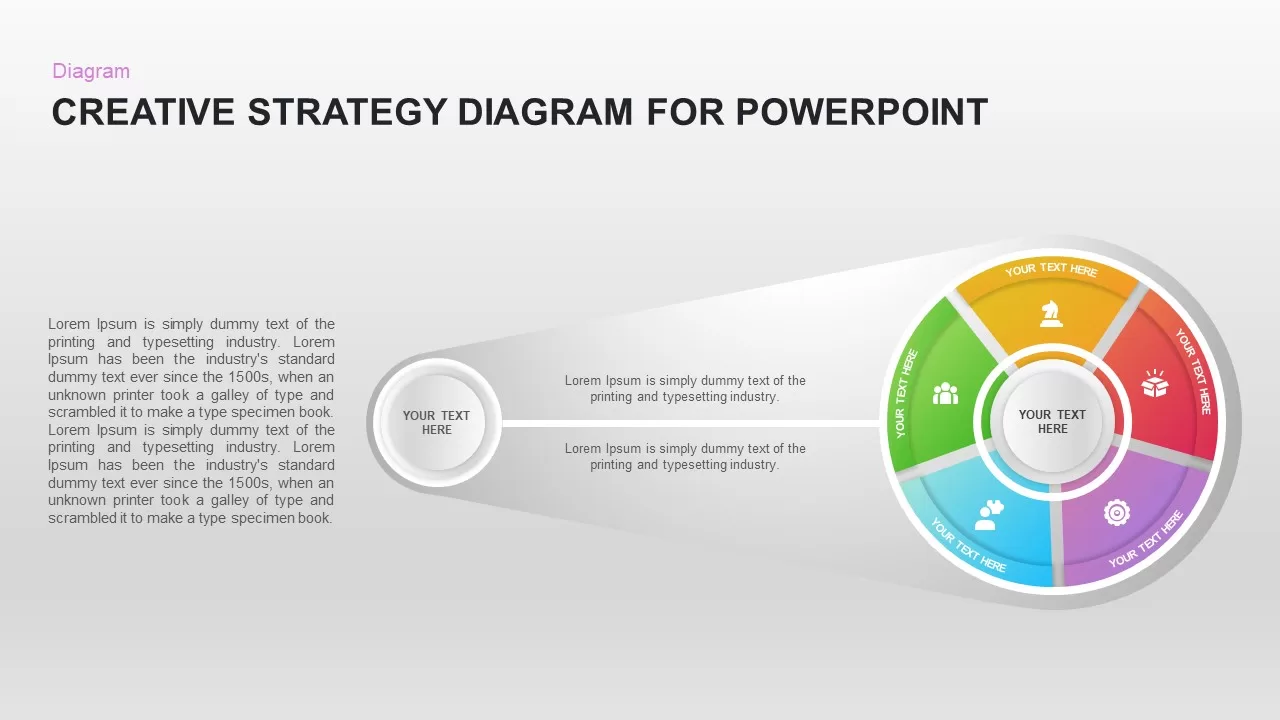
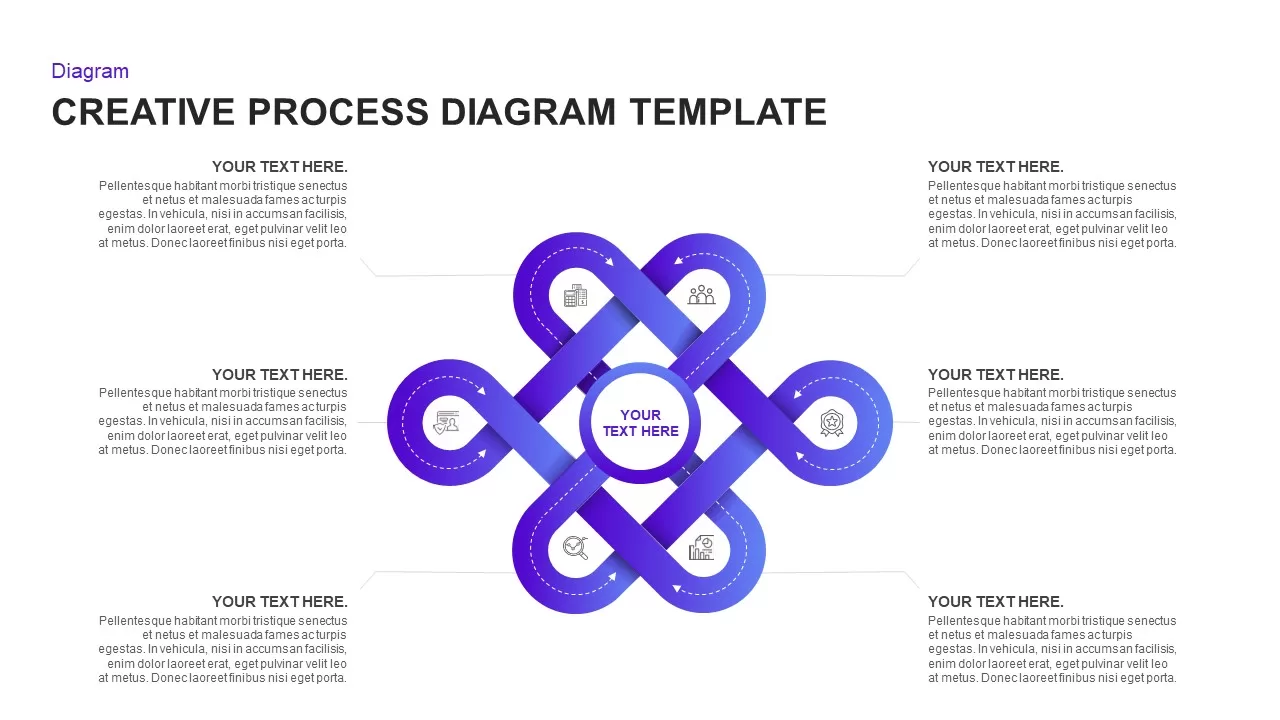
Creative diagram infographic template contains different shapes and outlines to highlight your topic colorfully. All the shapes have an outer drawing of the same mode creating an interesting to see the loop and the intersection. Square, circle, pentagon, rectangle, and the pencil top hexagonal prism are the major shapes used to create this generic PowerPoint infographic. The flat 2-dimensional shape objects will protect the value of your idea to transmit messages to the audience. All the regular polygons are normally used in PowerPoint designs to deliver your topics with their textual themes. So, a creative diagram for a PowerPoint presentation is a simple yet attractive design that will keep your audience in a silent mode when they are hearing your subject.
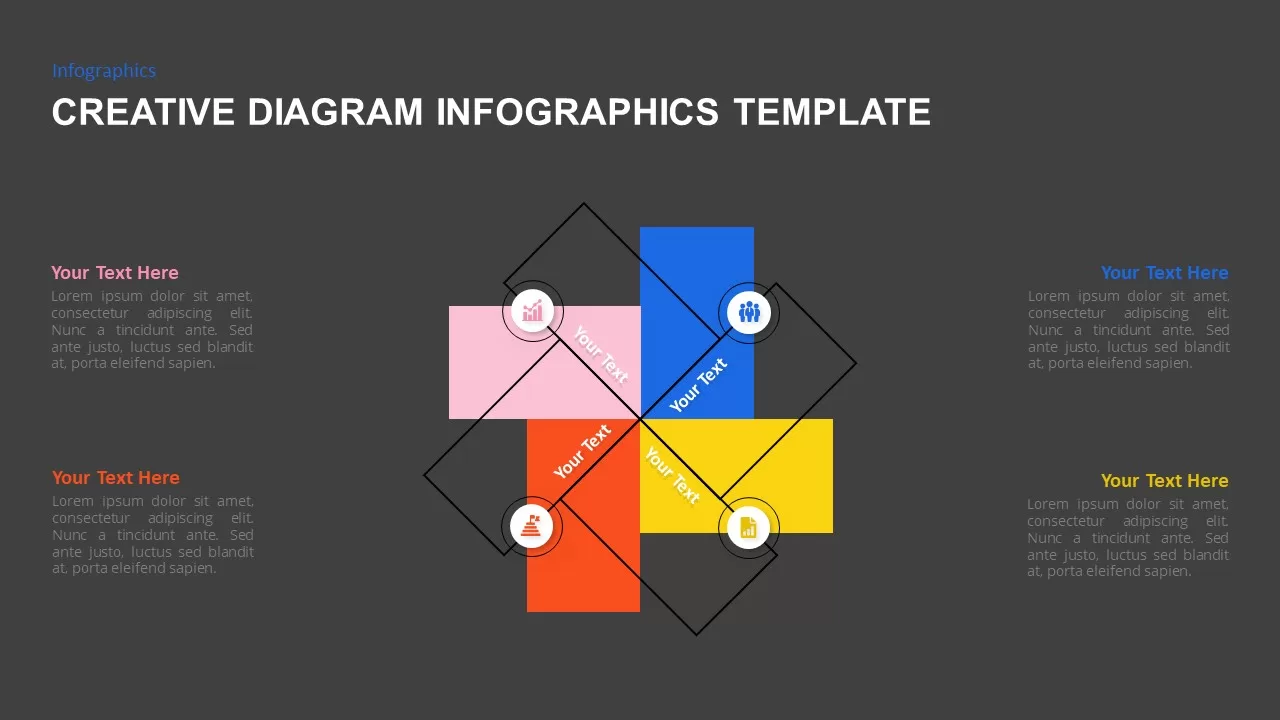
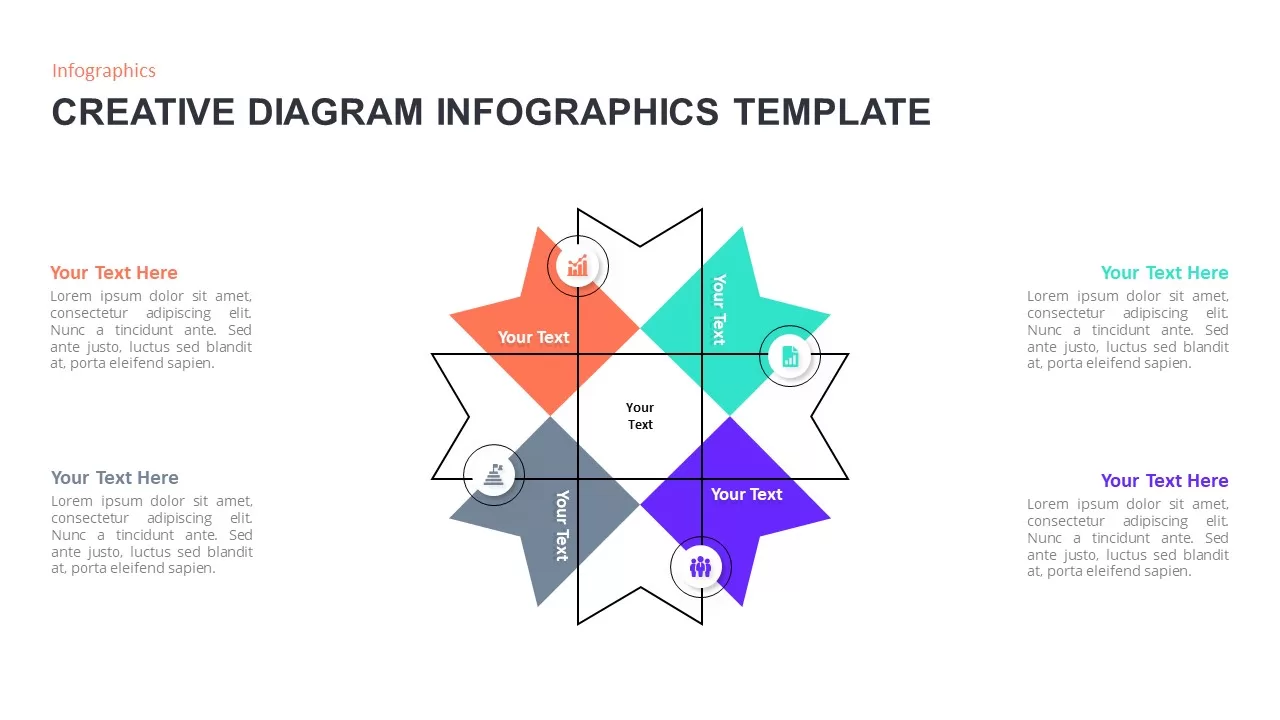
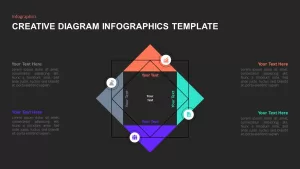
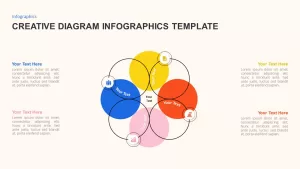
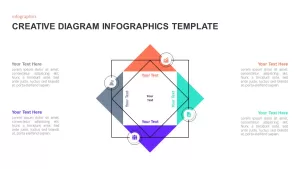
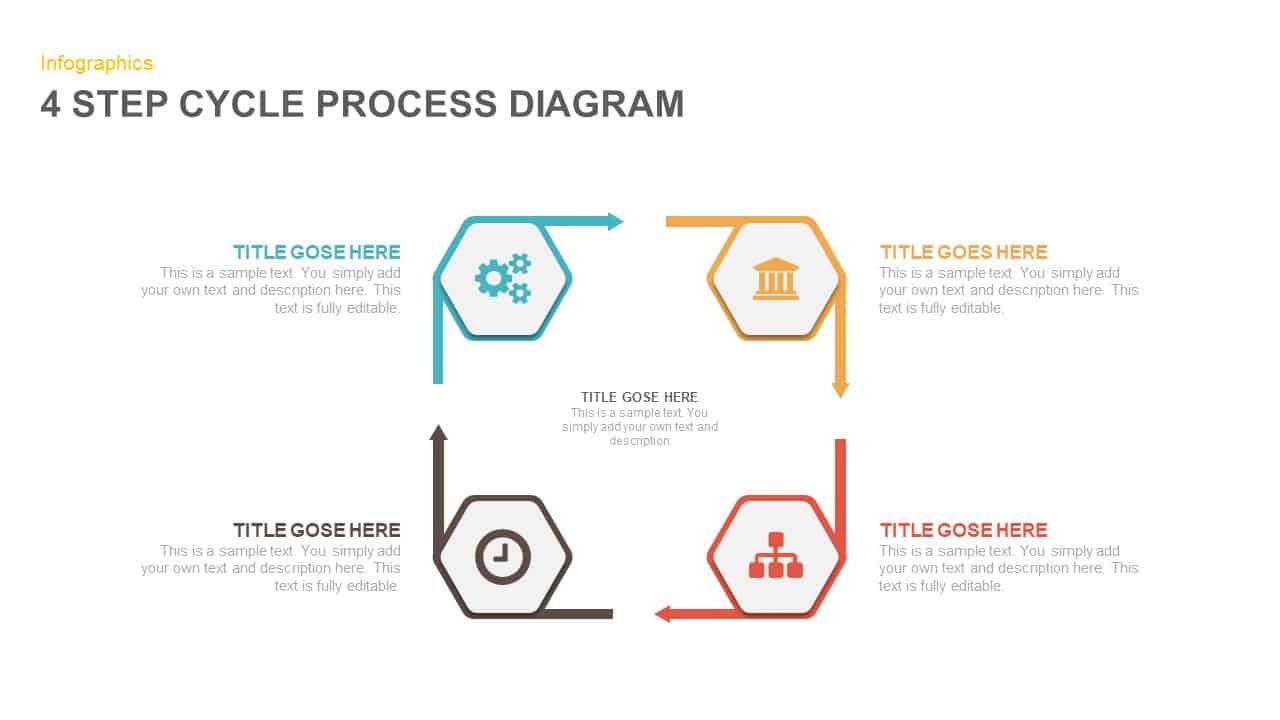
Creative diagram PowerPoint infographic is a multi-functional presentation design. The presenters can adjust any display fit to the creative infographics and shapes. It is best for presenting recurring elements that come in iteration. For example, a business cycle presentation would be matched with the conditions and designs that show the rotation irrespective of the shapes. Usually, circular PowerPoint diagrams are used to project cyclic evolutions, but you can use any polygon that shows the iteration by overlapping intersections. Hence, the unconventional diagrams and PowerPoint designs ensure innovation as a presentation revolution.
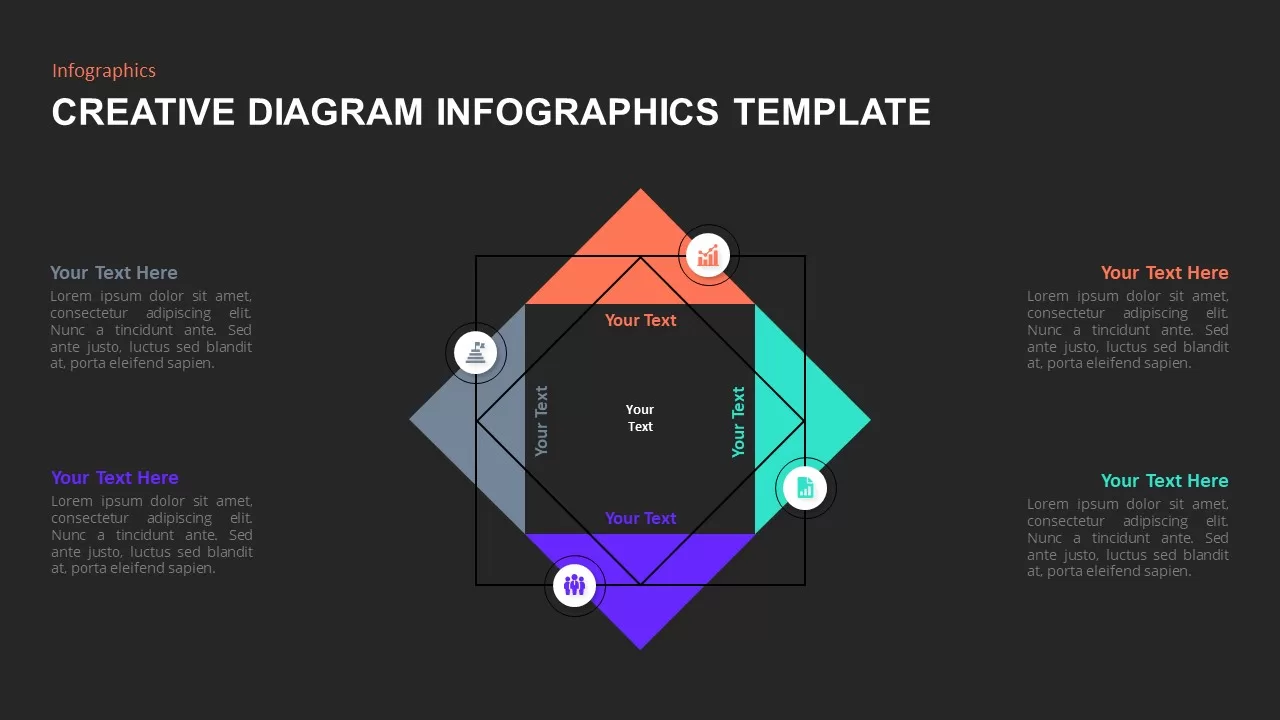
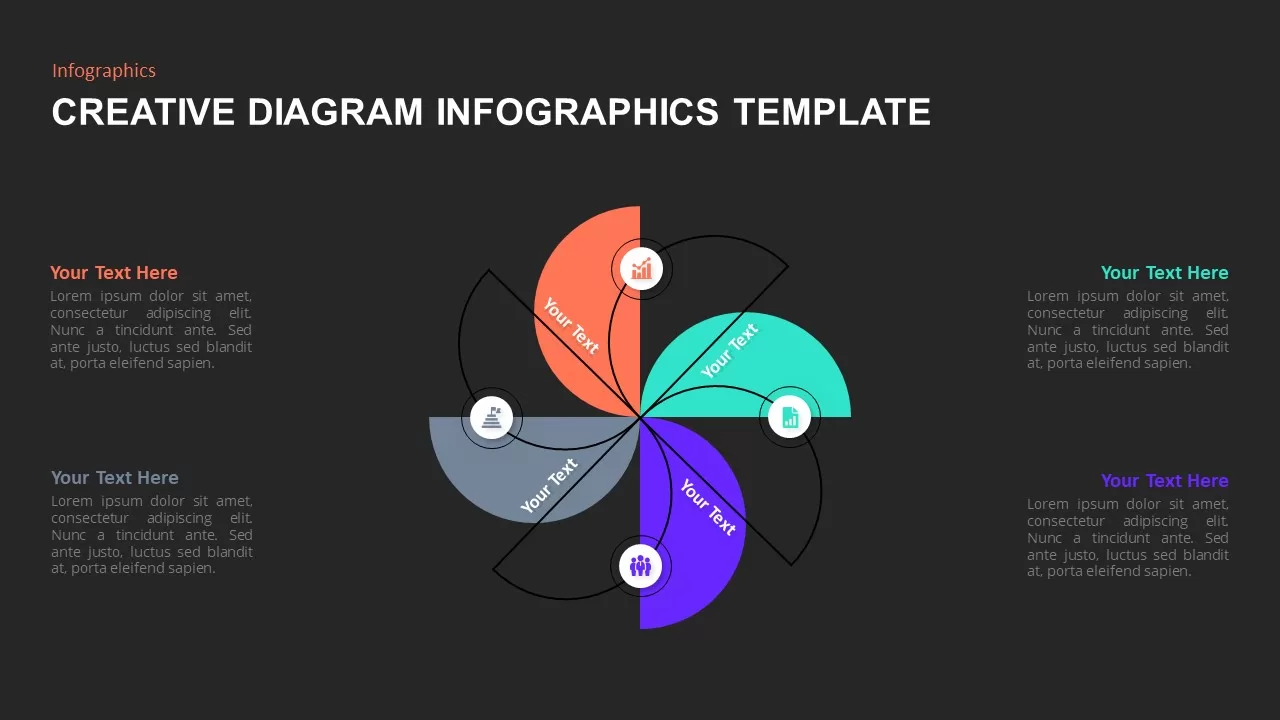
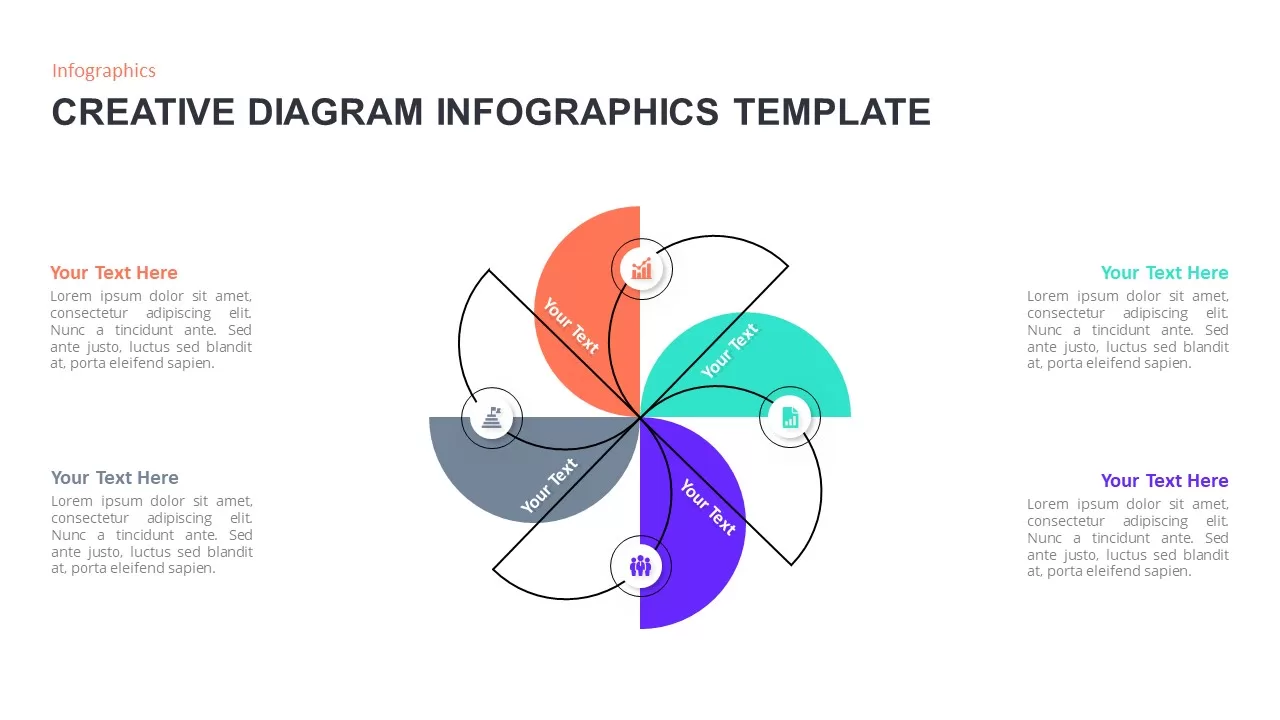
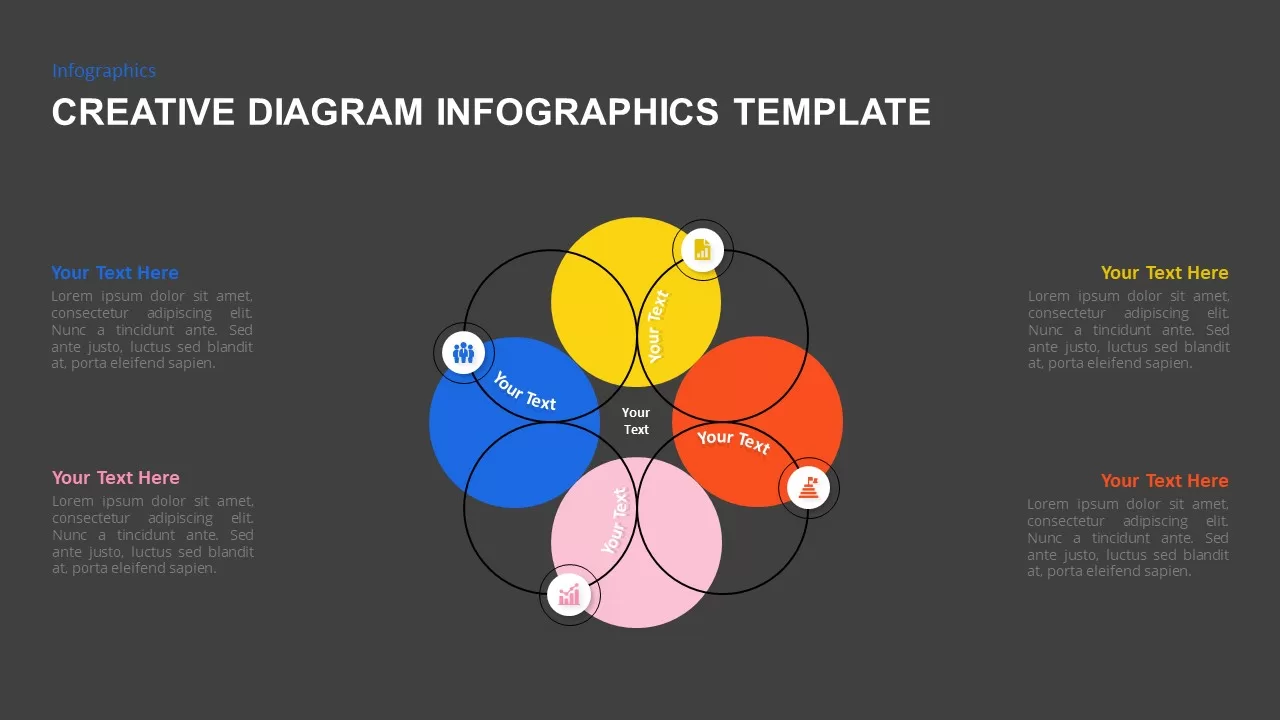
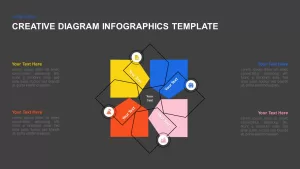
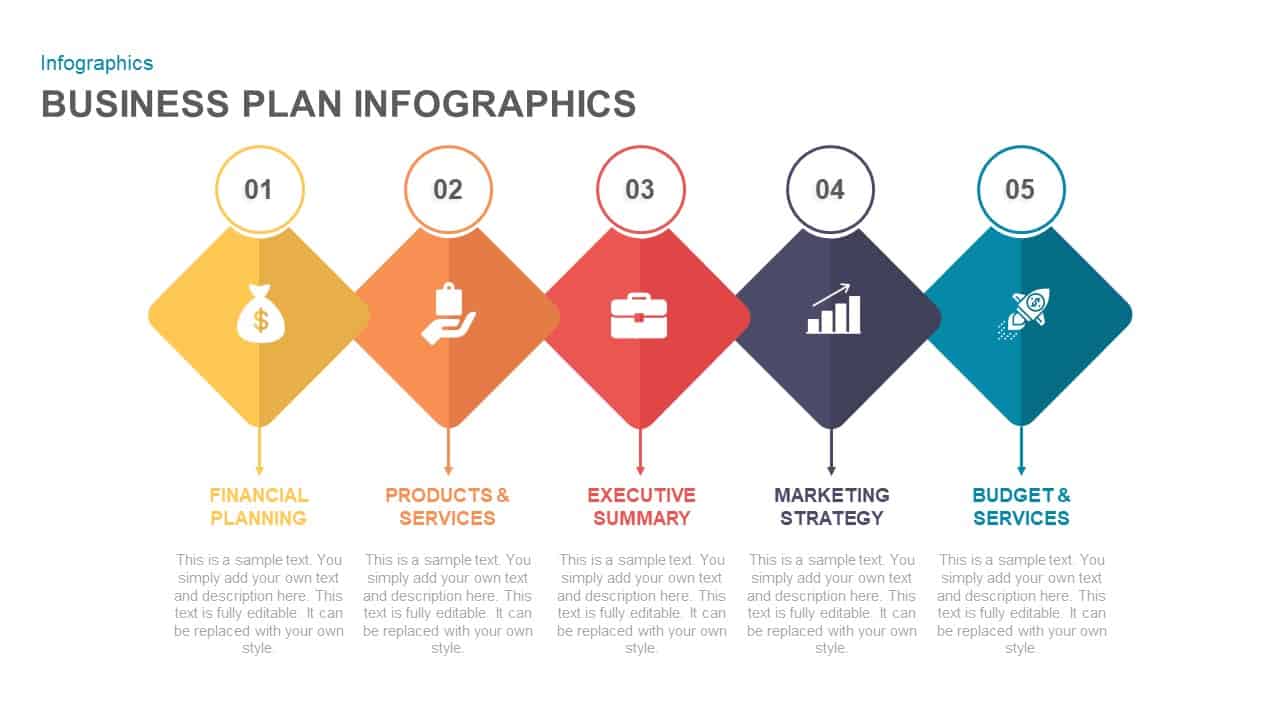
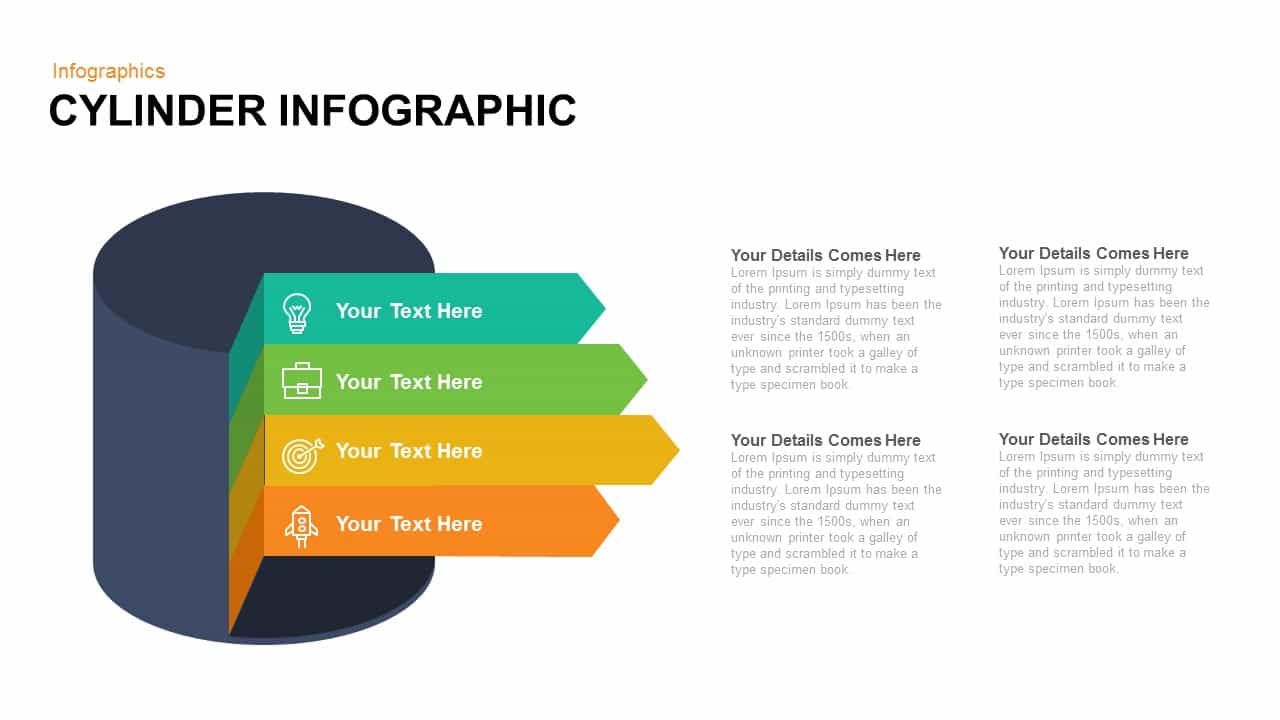
Creative diagram infographic template is compatible with your academic presentation, especially on mathematical concerns. As it is a customizable template, you can make changes if you have something new to add on. Otherwise, you can maintain the default shapes and themes without making notable changes. The diagram allows the presentation of sequential relationships between the variables and may explain the interconnections with these different shapes and figures. The presenters can duplicate creative PowerPoint diagrams on the light or dark background of the main presentation. Find more top and best PowerPoint templates of Slide Bazaar premium directory of the business diagram.
Attached Files
| File |
|---|
| https://premiumdownloads.s3.amazonaws.com/SB02026-Creative Diagram Infographics Template.zip |
Login to download this file
Add to favorites
Add to collection
-

Item ID
SB02026 -

Related Templates
-
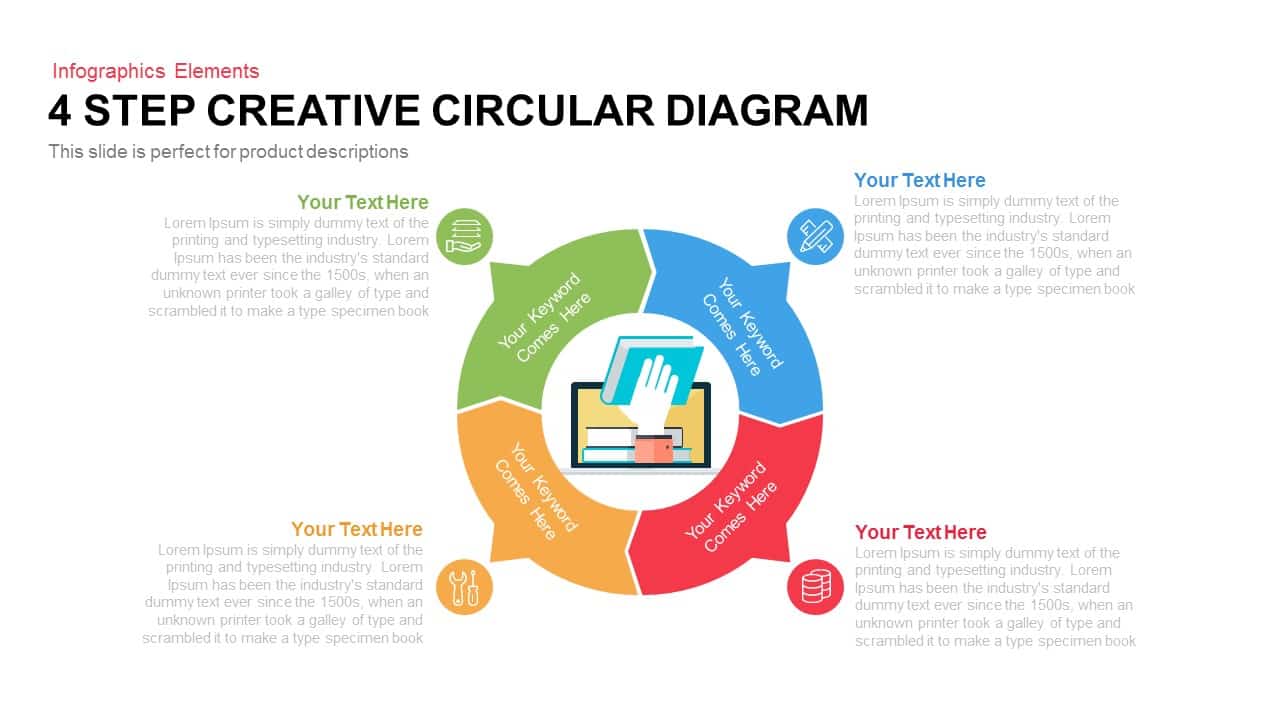
4 Step Creative Circular Diagram PowerPoint Template and Keynote Slide
Business Models
Premium
-
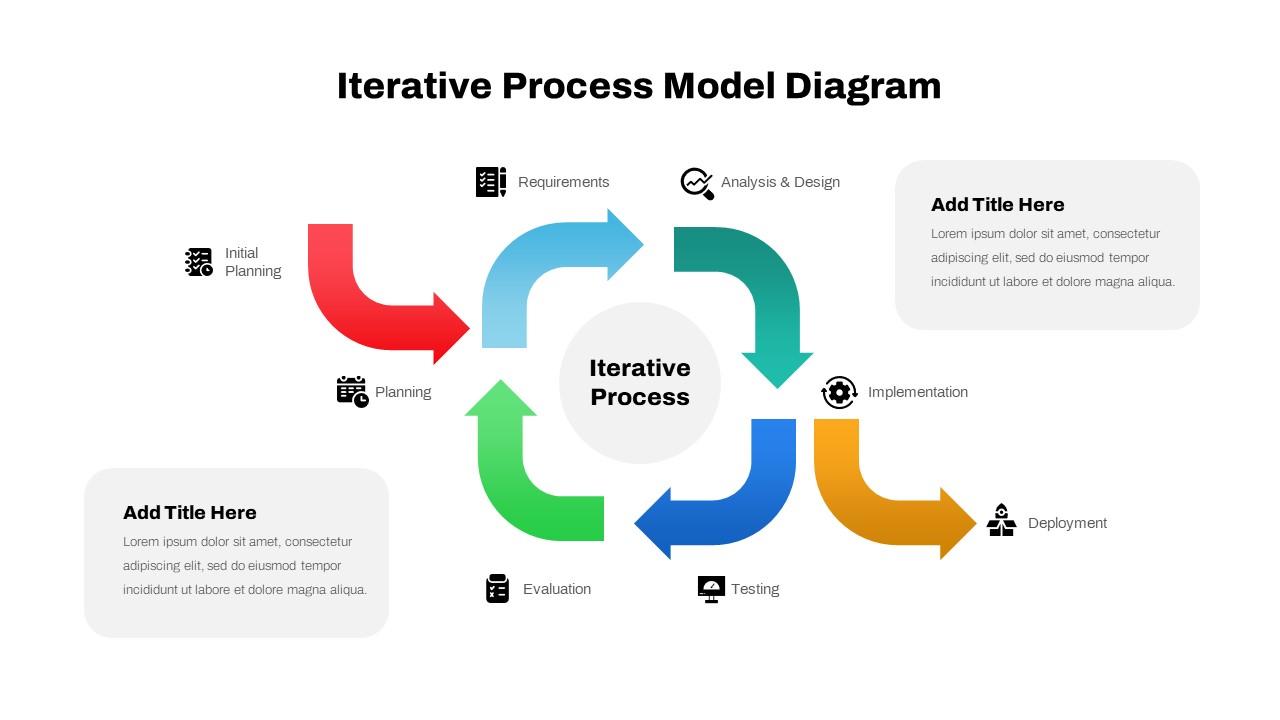
Iterative Process Model Diagram for PowerPoint & Keynote
Circular Diagrams
Premium
-
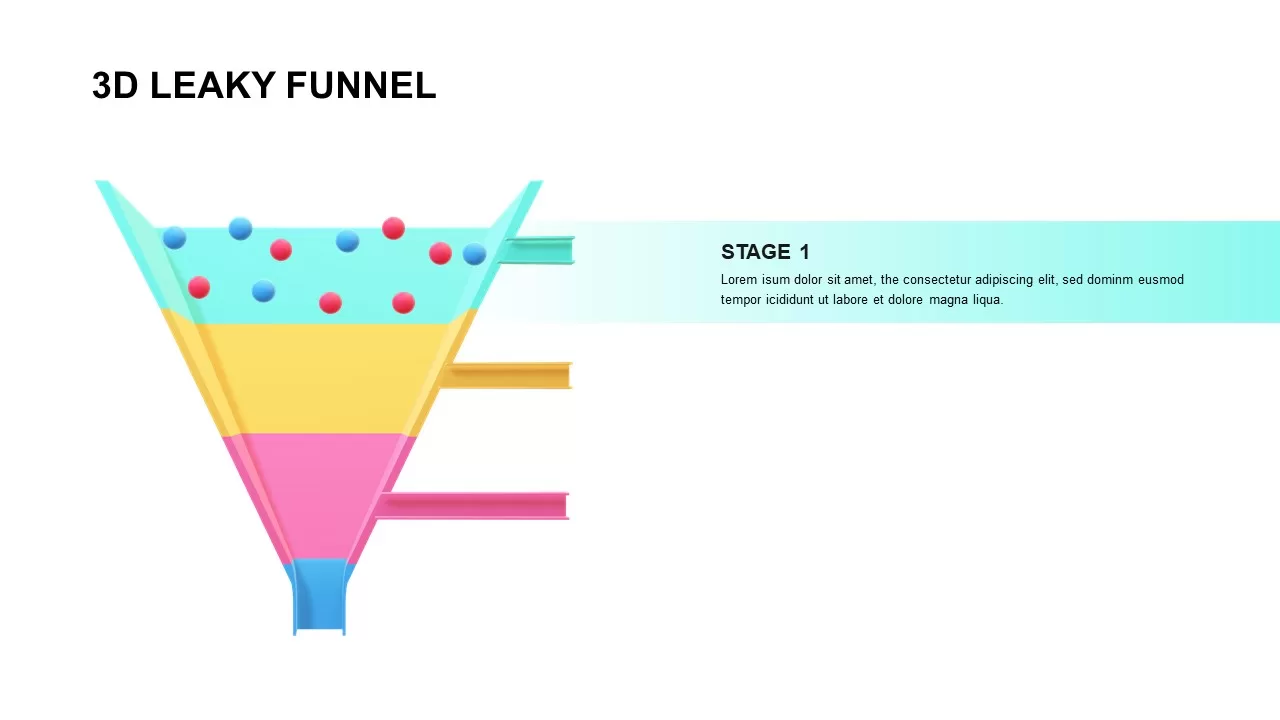
3 D Funnel Template
Funnel Diagrams
Premium
-
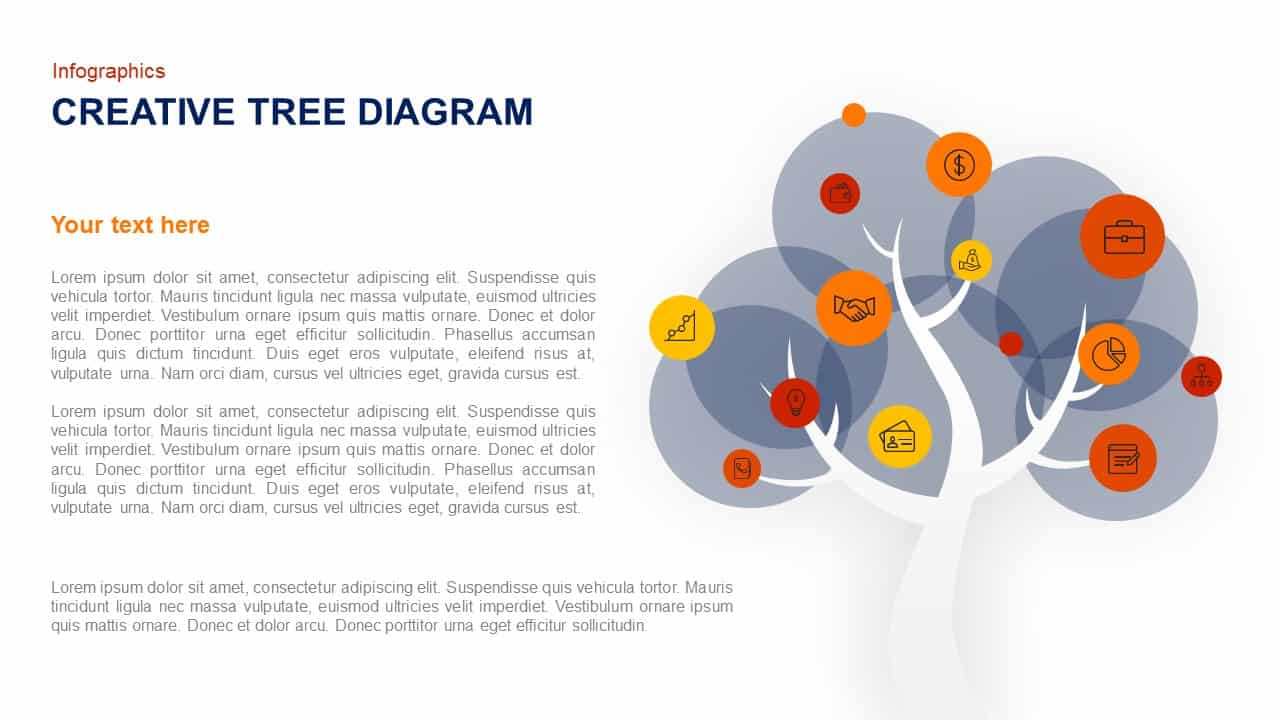
Creative Tree Diagram Template for PowerPoint and Keynote
Tree Diagrams
Premium
-
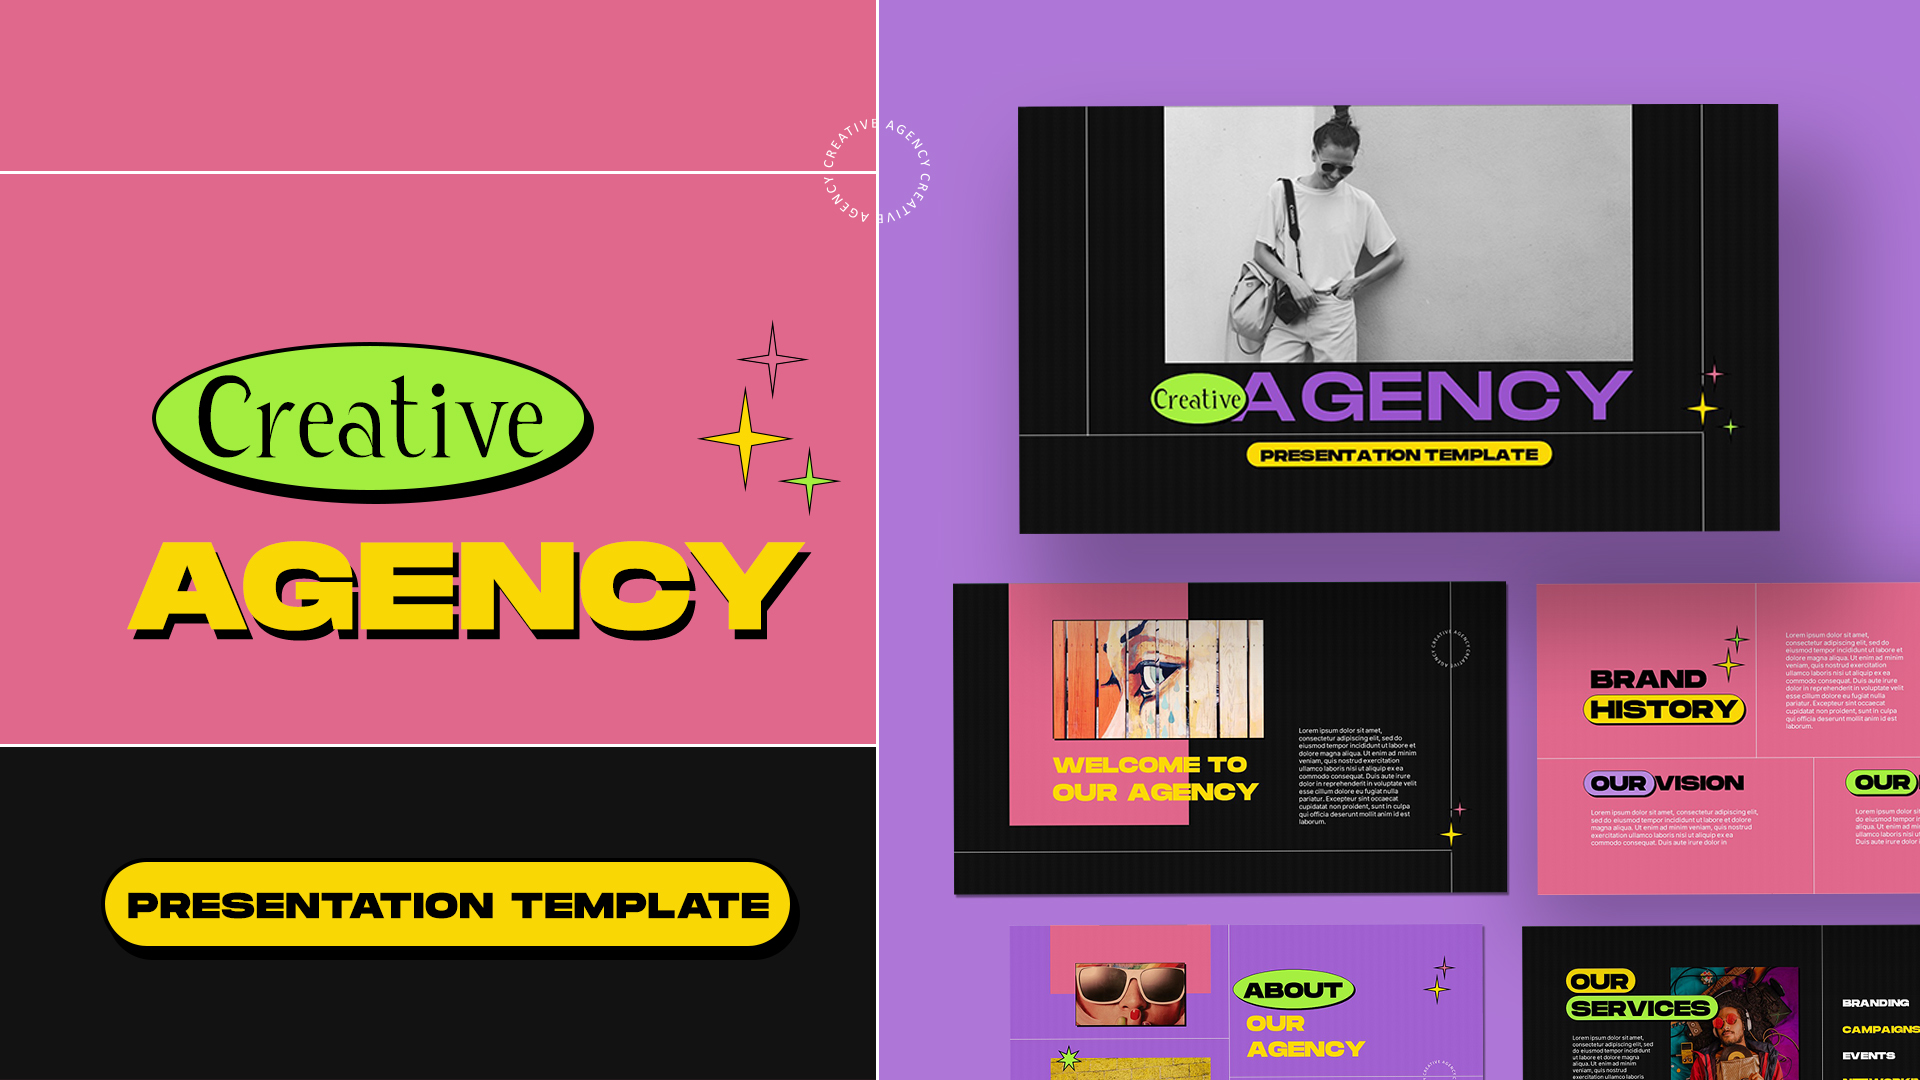
Creative Agency Presentation Template
PowerPoint Templates
Premium
-
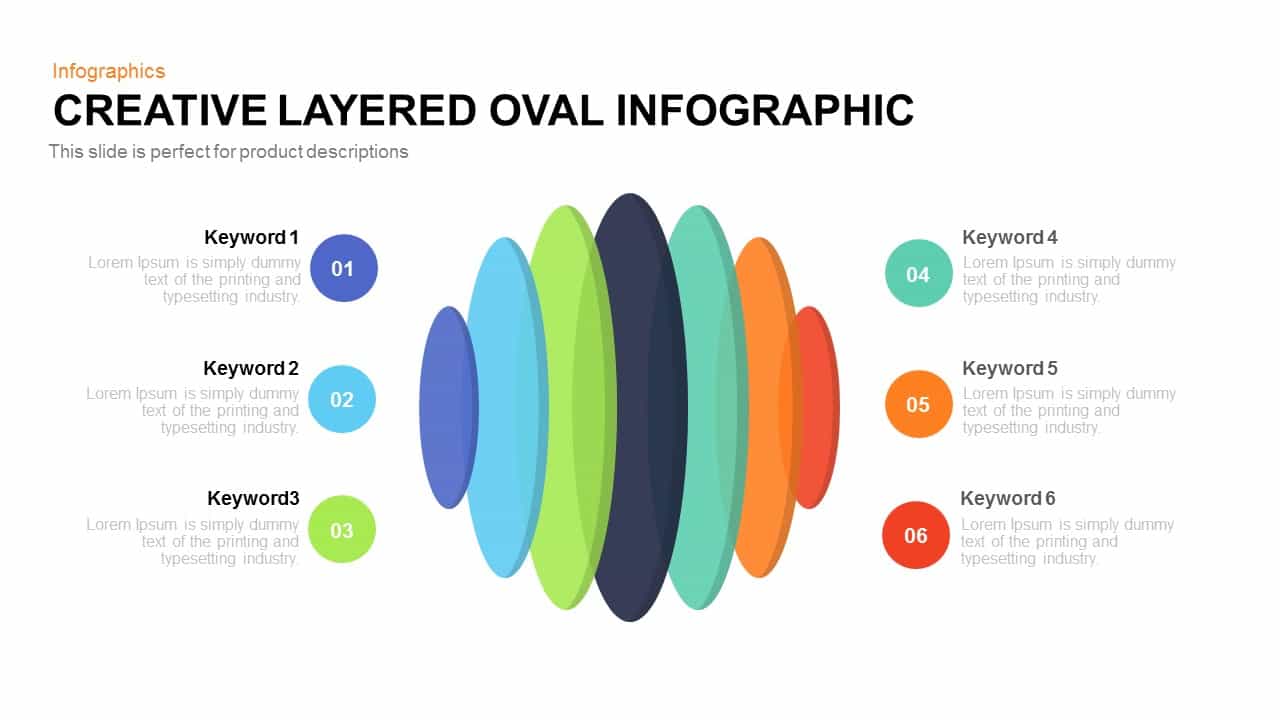
Creative Layered Oval Infographic Template for PowerPoint
Circular Diagrams
Premium
-

Creative Stage Infographic PowerPoint and Keynote Template
Stage Diagrams
Premium
-
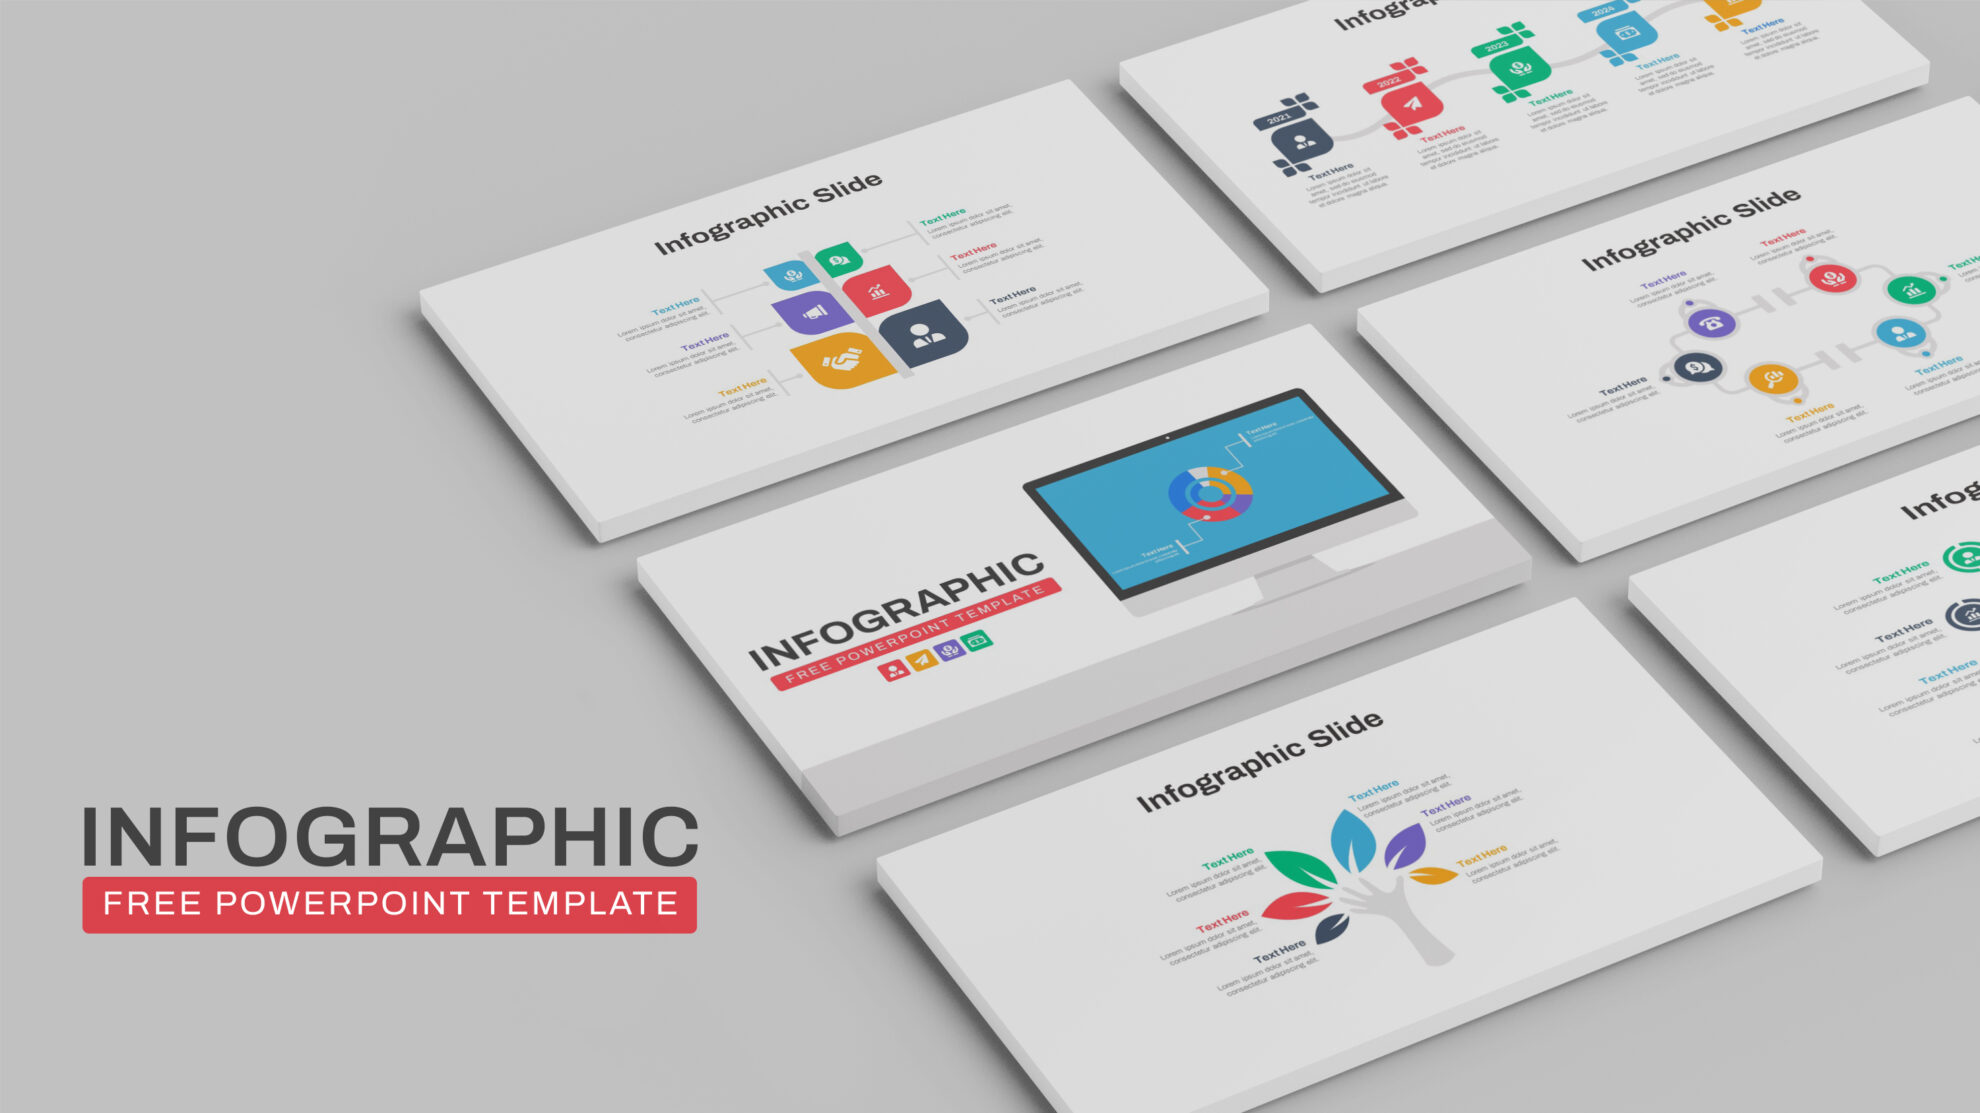
Free Infographic Deck PowerPoint Template
PowerPoint Templates
Free
-
4 Step Process Gear PowerPoint & Keynote Diagram
Gear
Premium
-
Creative Venn Diagram Template for PowerPoint & Keynote
Circular Diagrams
Premium
-
8 Circle Creative Diagram Free PowerPoint Template and Keynote Slide
Free PowerPoint Templates
Free
-
Creative Business Strategy Diagram for PowerPoint and Keynote Template
Business Models
Premium
-

Company Profile Pitch Deck Template for PowerPoint
Business Models
Premium
-
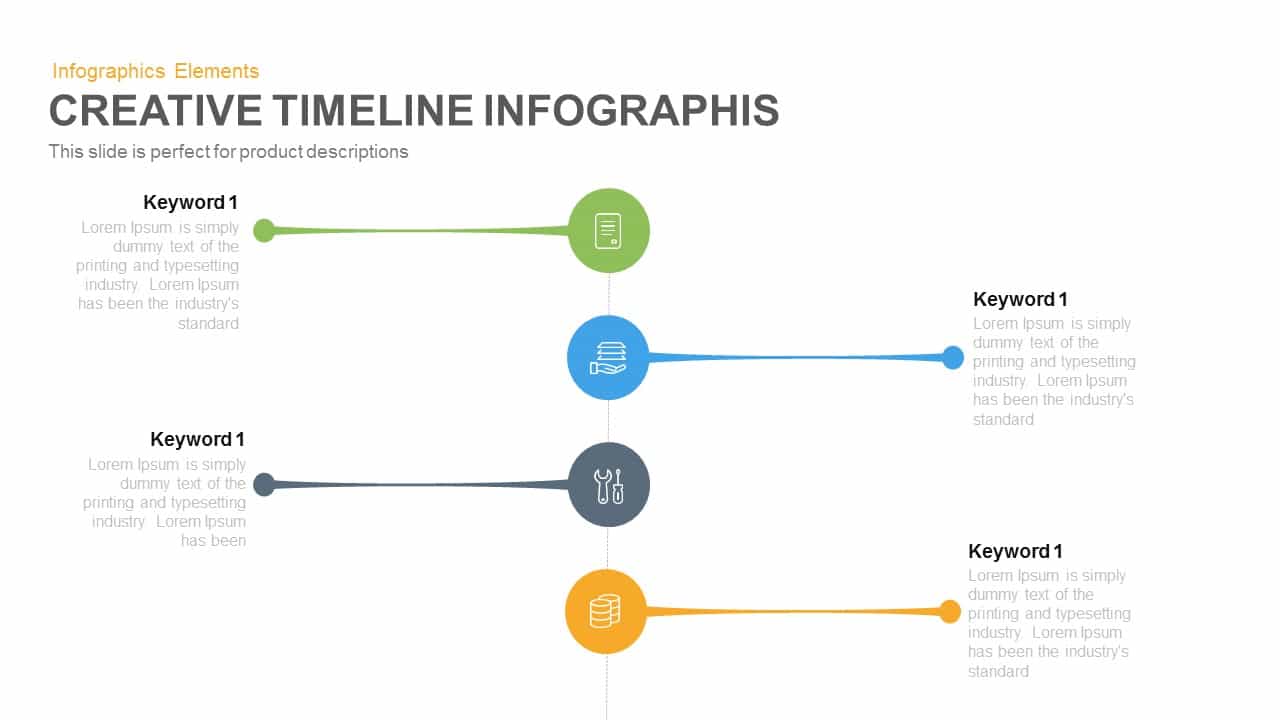
Creative Timeline Infographic PowerPoint and Keynote template
Keynote Templates
Premium
-
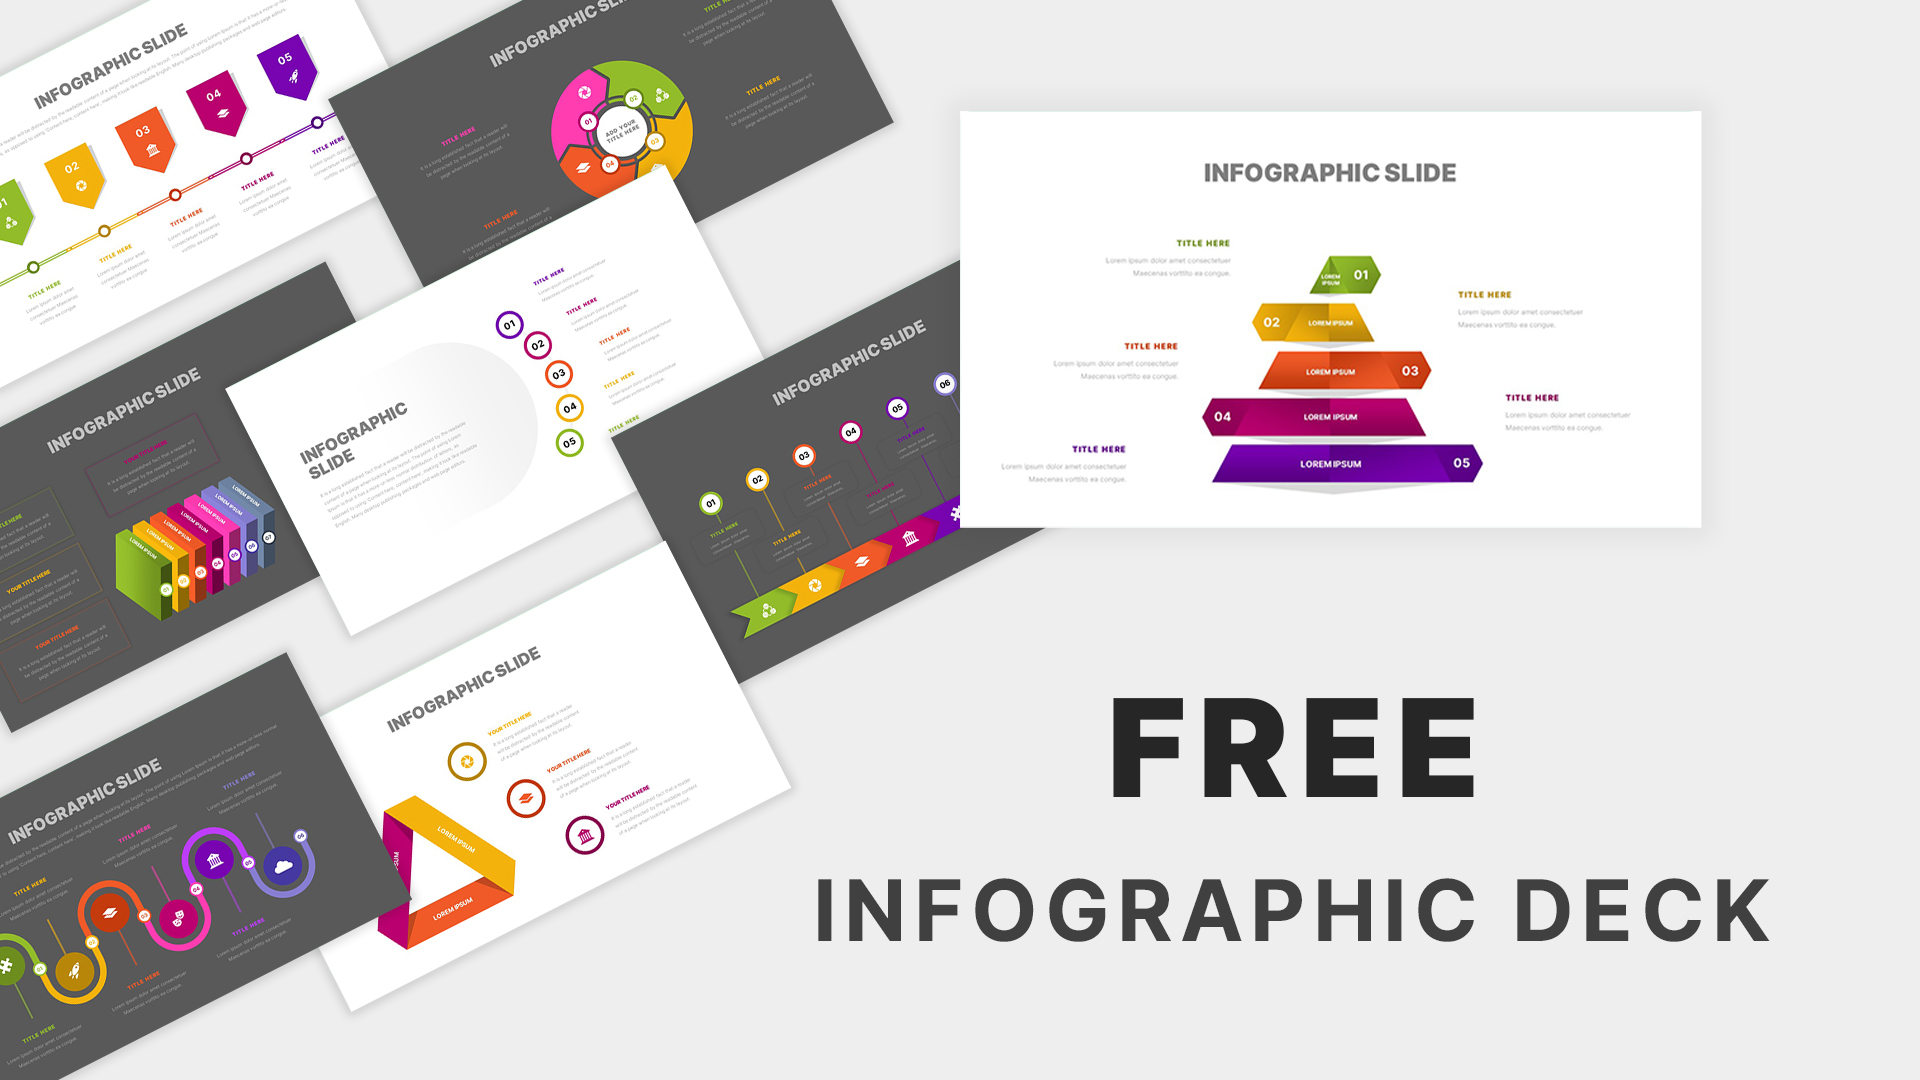
Free Infographic Deck Presentation Template
Free PowerPoint Templates
Free
-
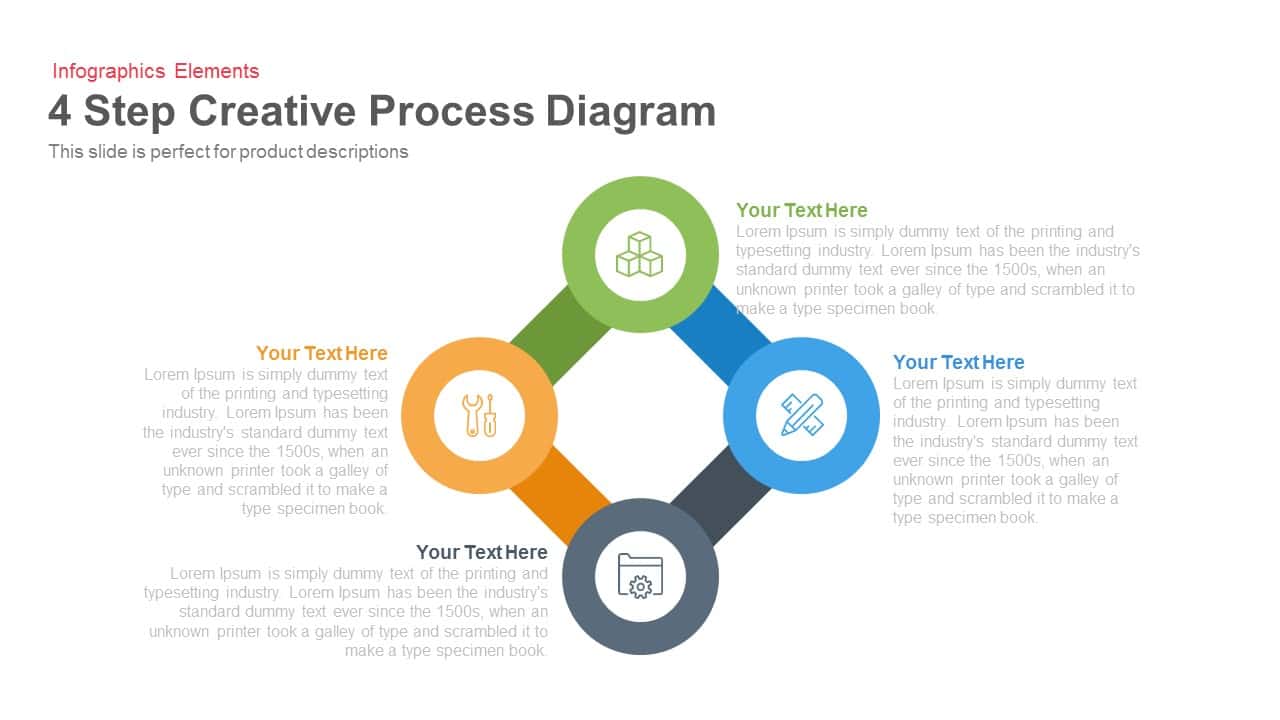
4 Step Creative Process Diagram PowerPoint Template and Keynote Slide
Business Models
Premium
-
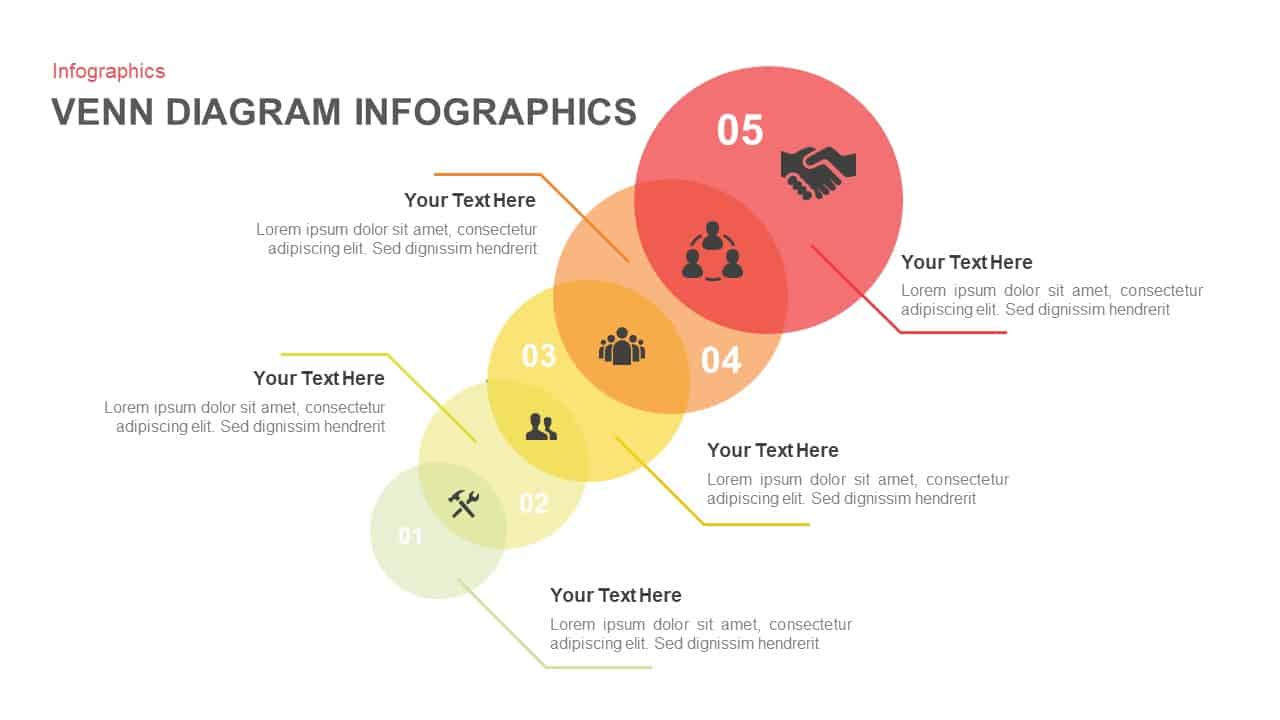
Venn Diagram infographic PowerPoint Template
Business Models
Premium
-
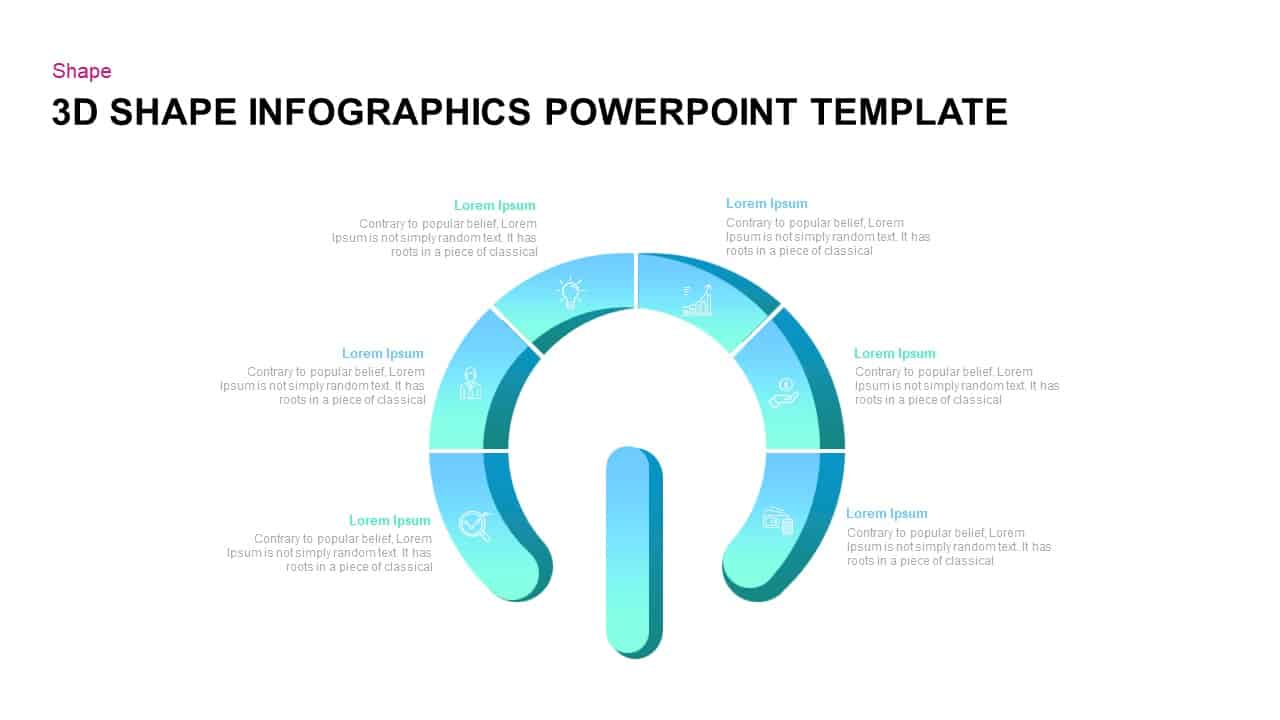
3D Keyhole Shape Infographic PowerPoint Template
3D Shapes
Premium
-
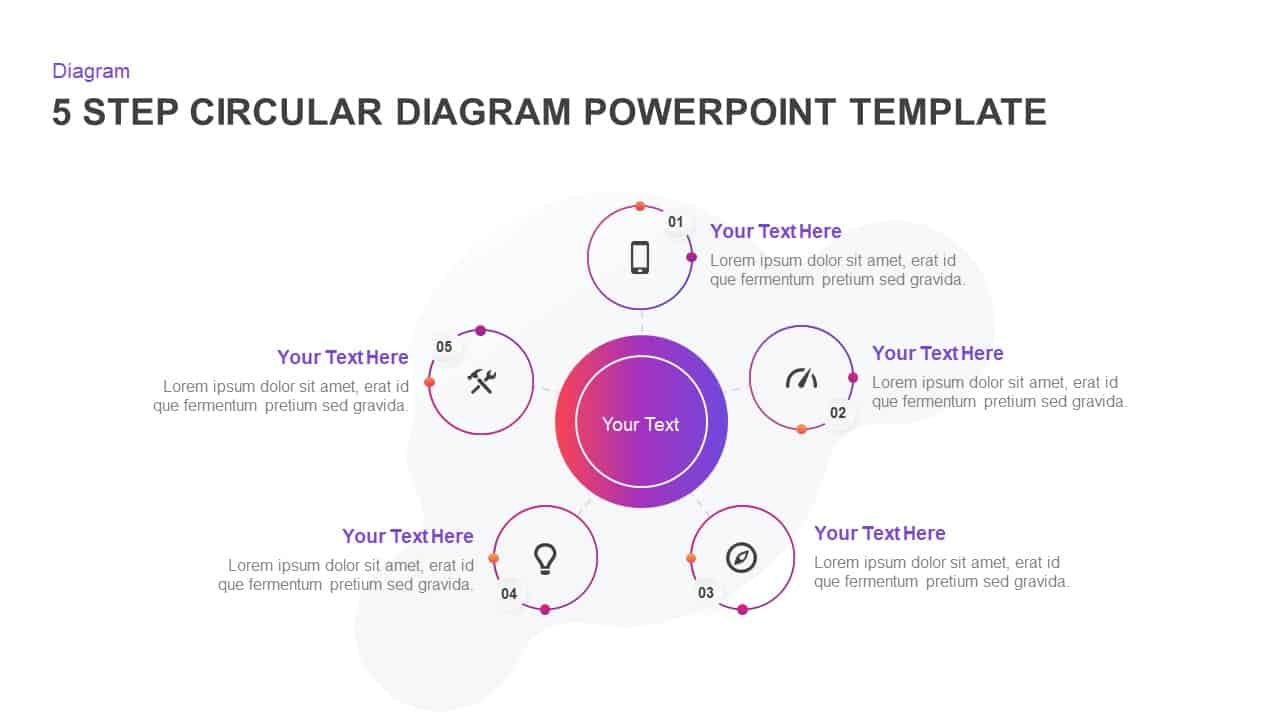
5 Step Creative Circular Diagram Design for PowerPoint & Keynote
Circular Diagrams
Premium
-
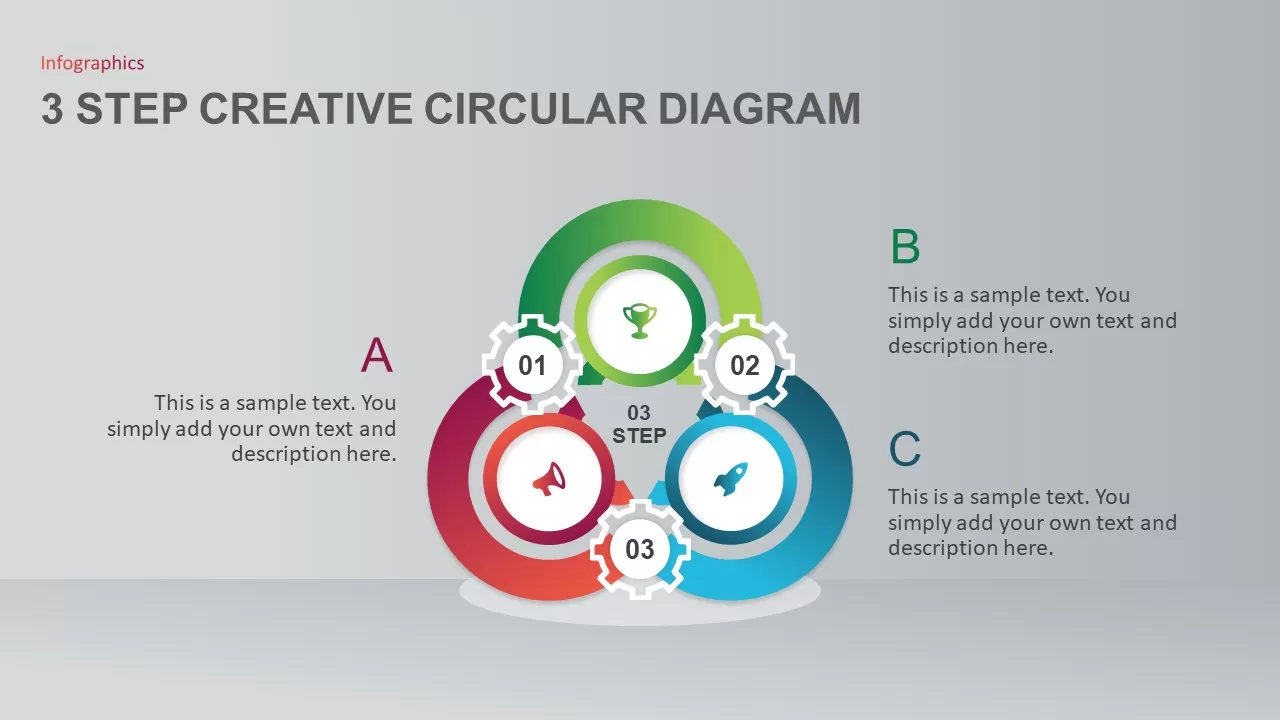
3 Step Creative Circle PowerPoint Template
Circular Diagrams
Premium
-
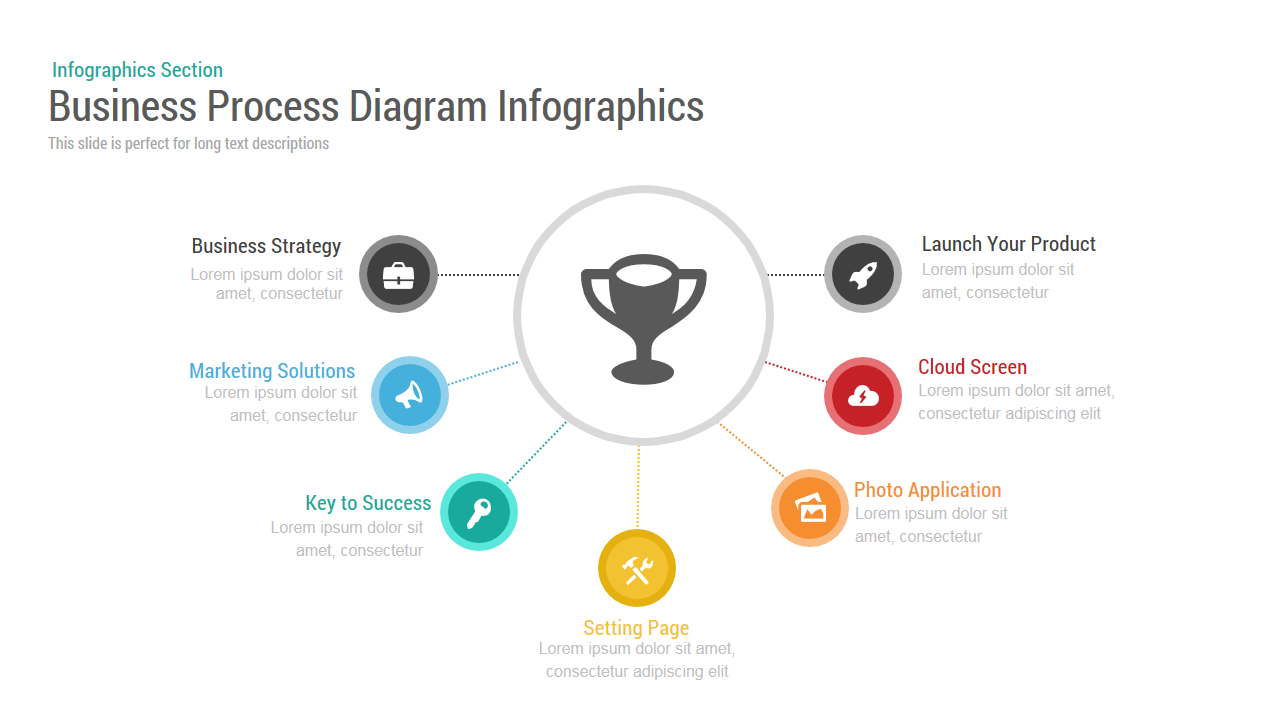
Business Process Diagram Infographic Template for PowerPoint and Keynote
Process Flow Diagrams
Premium
-
Infographic Circular Diagram for PowerPoint & Keynote
Circular Diagrams
Premium
-

Newspaper Template
PowerPoint Templates
Premium
-
Freight Infographic PowerPoint Template
PowerPoint Templates
Premium
-
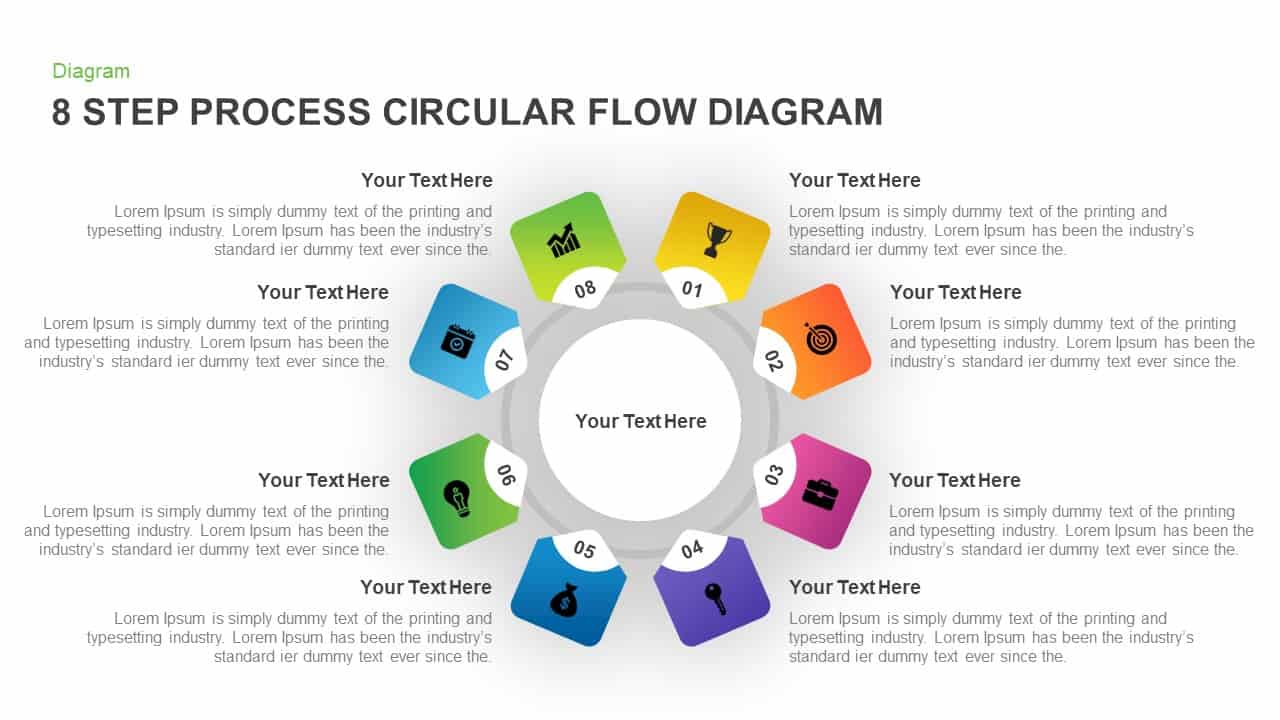
8 Step Circular Process Flow Diagram Template for PowerPoint & Keynote
Circular Diagrams
Premium
-
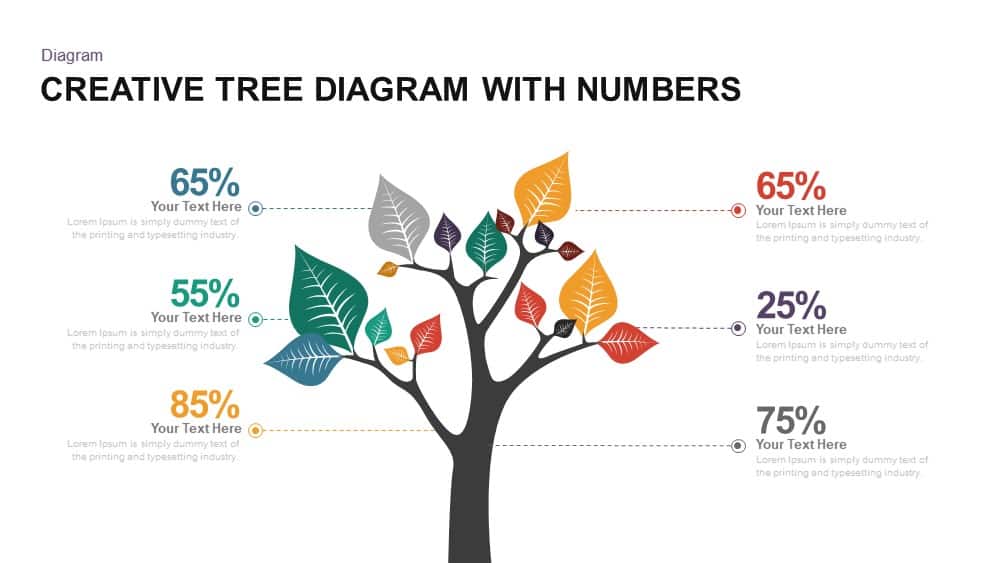
Creative Tree Diagram PowerPoint Template and Keynote with Numbers
Diagrams
Premium
-
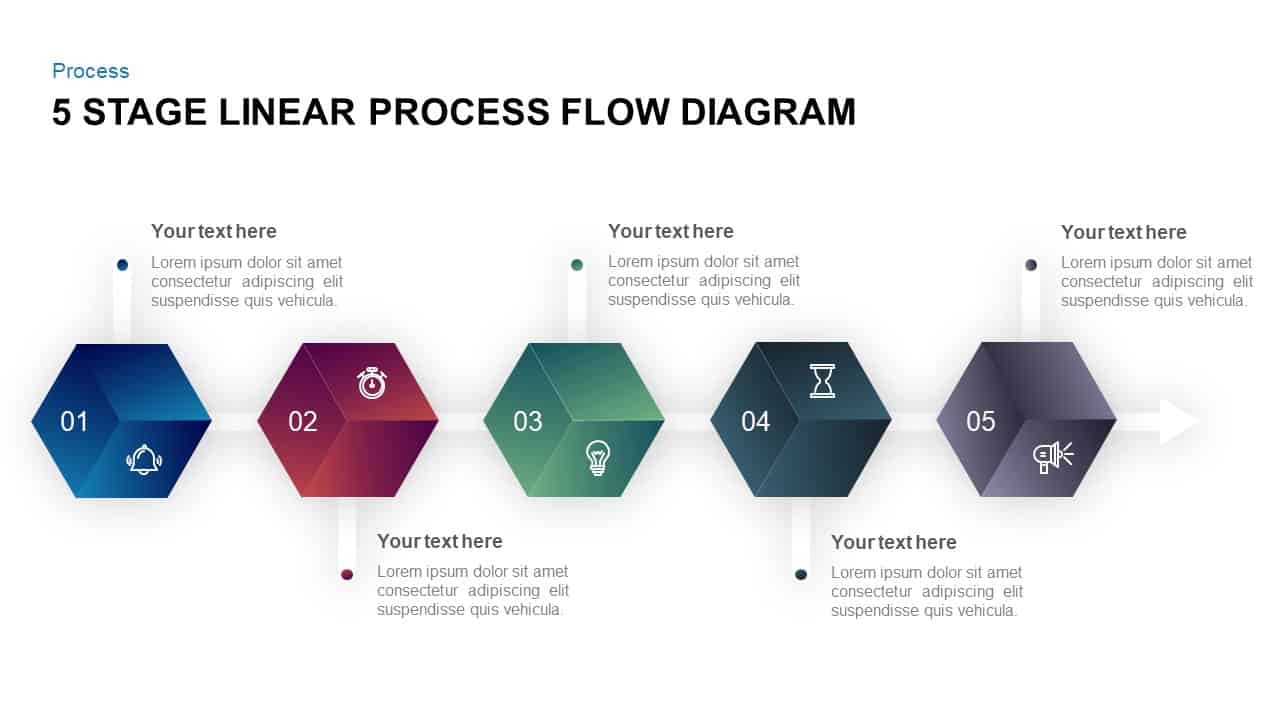
5 Stage Linear Process Flow Diagram PowerPoint Template and Keynote Slide
Process Flow Diagrams
Premium
-
Creative Studio PowerPoint Template
PowerPoint Business Templates
Premium
-
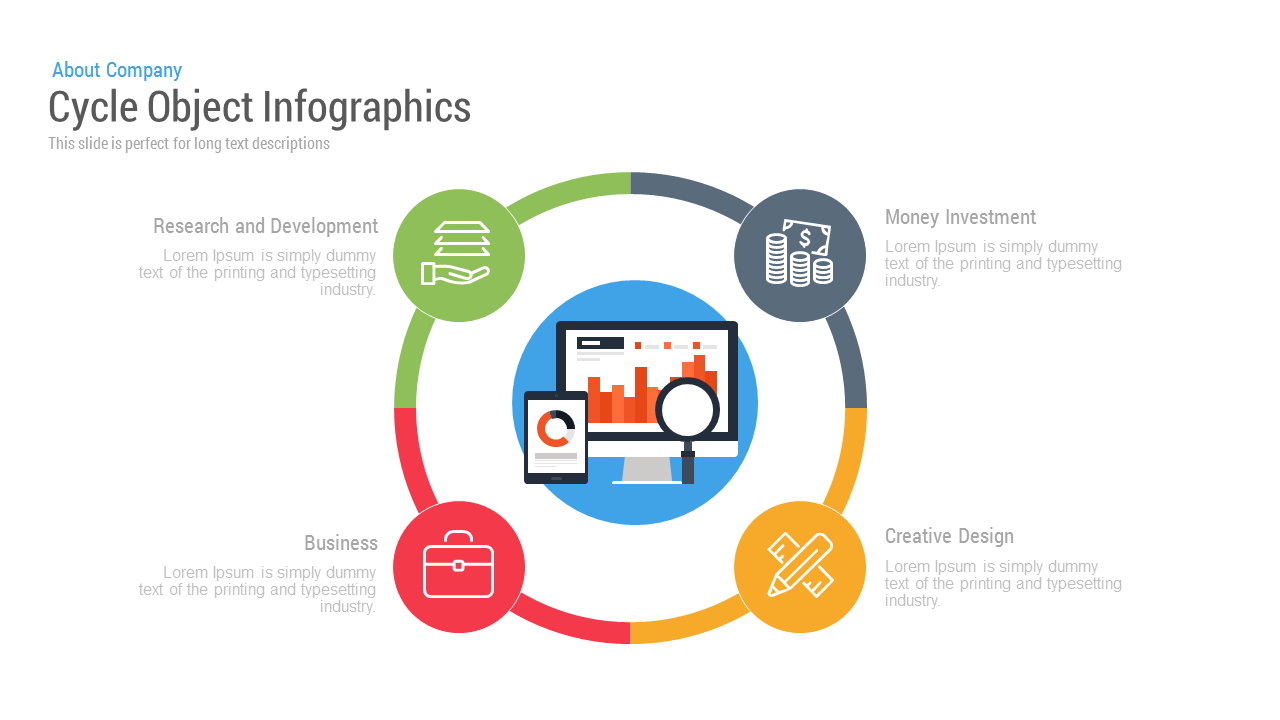
Cycle Object Infographic Free PowerPoint Template and Keynote Slide
Circular Diagrams
Free
-
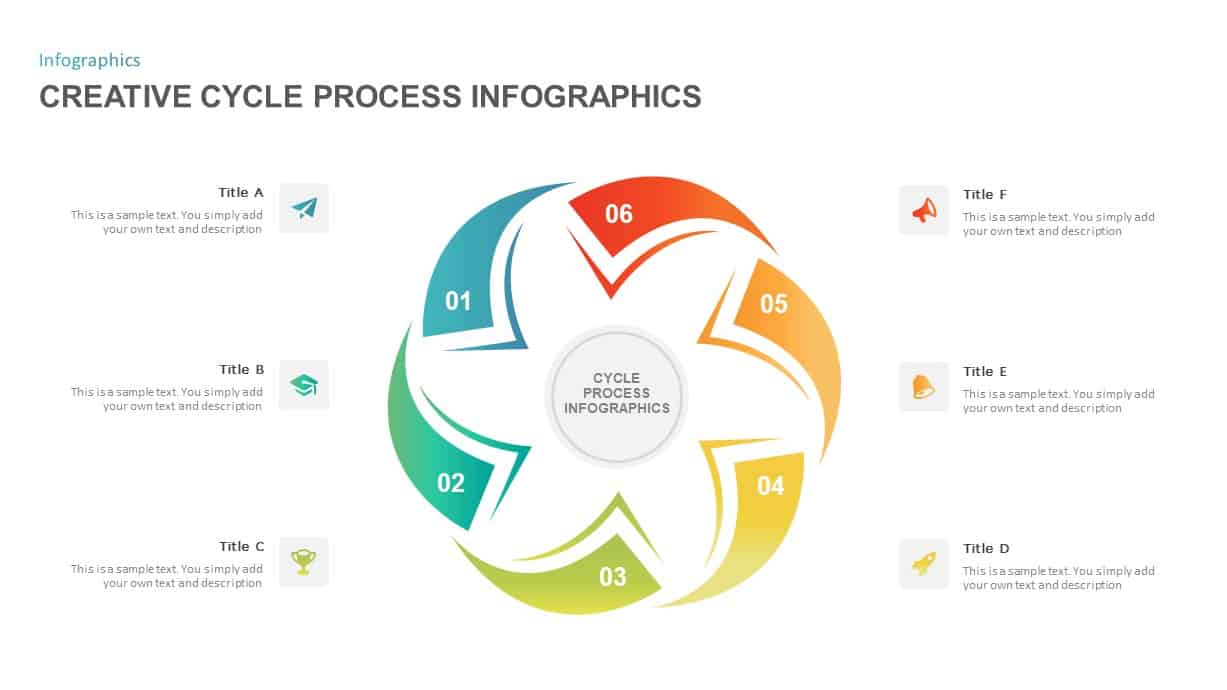
Creative Process Cycle Infographic Template
Circular Diagrams
Premium
-
3D Shapes PowerPoint Template
3D Shapes
Premium
-

Free Luxury PowerPoint Template
PowerPoint Templates
Free
-
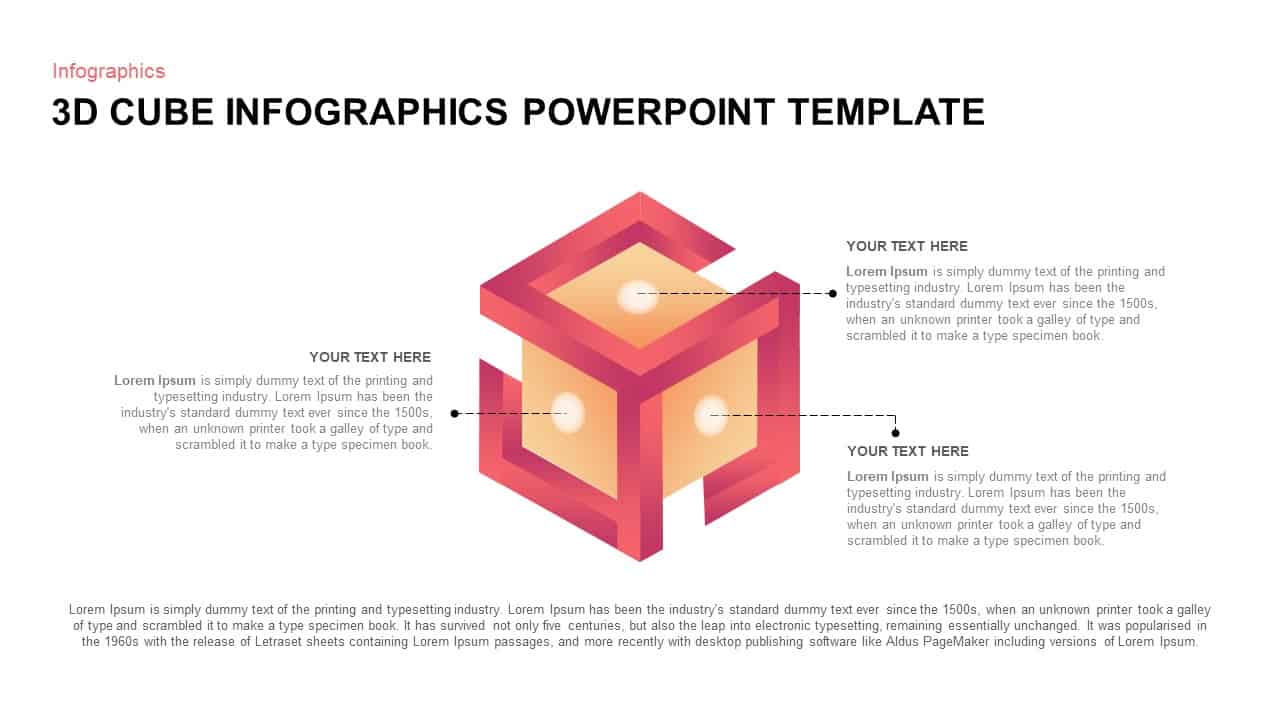
3D Cube PowerPoint Template
3D Shapes
Premium
-
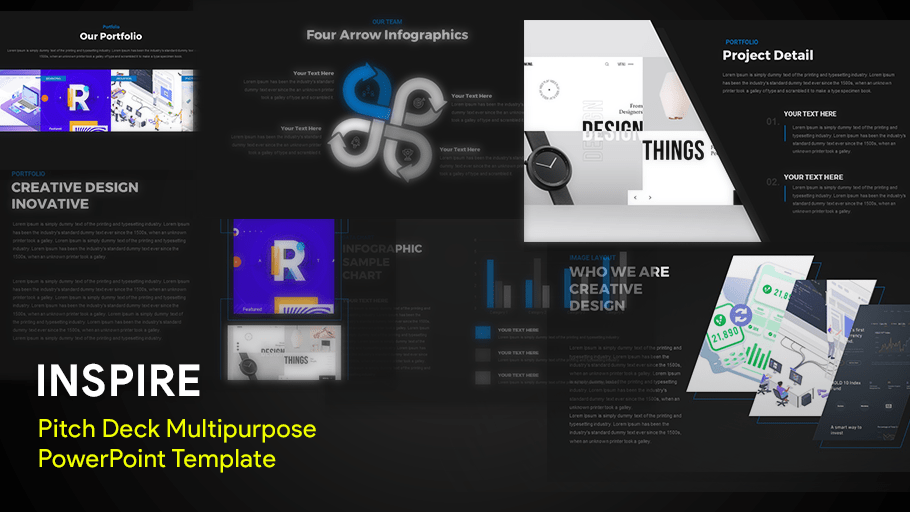
INSPIRE – Multipurpose Creative Deck Template
PowerPoint Business Templates
Premium
-

Alphabet Slides Presentation Template
PowerPoint Templates
Premium
-
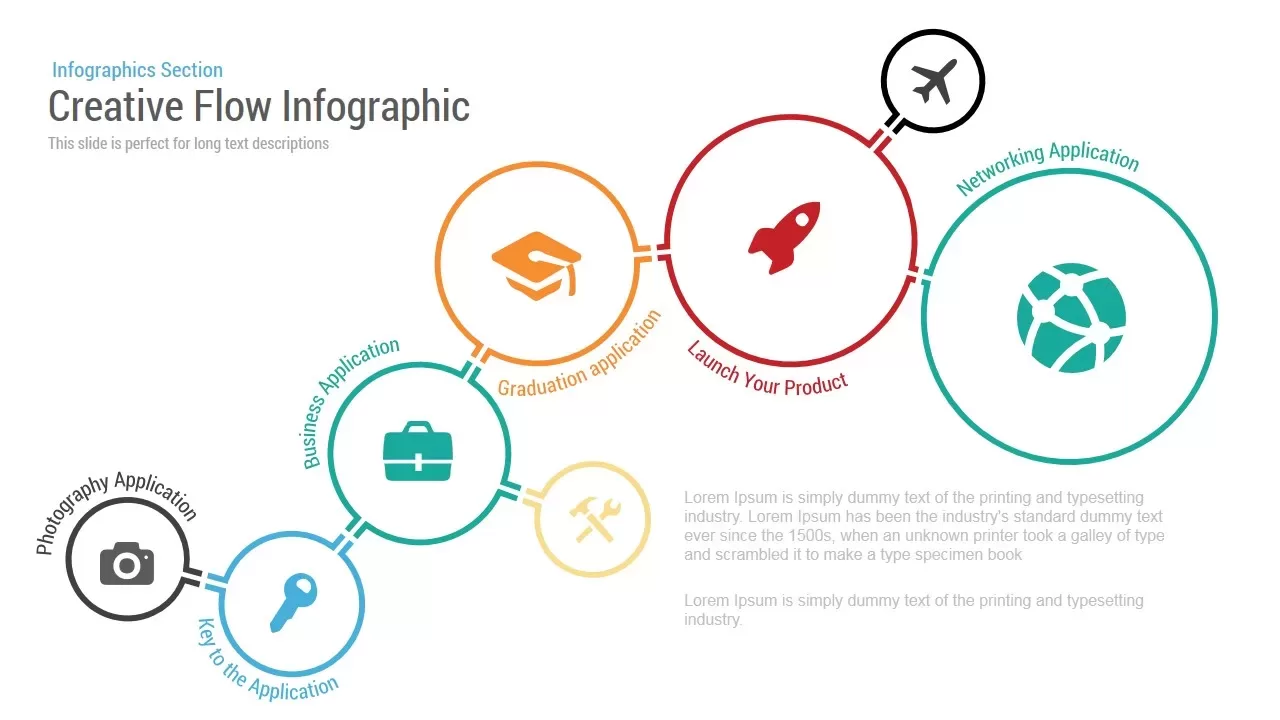
Creative Flow Infographic PowerPoint Template
Diagrams
Premium
-
8 Step Circular Diagram for PowerPoint Presentation
Circular Diagrams
Premium
-
4 Step Cycle Process Diagram
Business Models
Premium
-
Infographic Arrow PowerPoint Template and Keynote Slide
Arrow Diagrams
Premium
-
5 Step Creative Circular Diagram Design for PowerPoint and Keynote
Circular Diagrams
Premium
-
Creative Strategy Diagram for PowerPoint
Business Models
Premium
-
Creative Process Diagram PowerPoint Template
Process Flow Diagrams
Premium
-
Business Plan Infographic Template for PowerPoint Presentation
Business Models
Premium
-

Pixels | Free Creative Presentation Templates for PowerPoint & Keynote
Keynote Templates
Free
-
Infographic Cylinder PowerPoint Template and Keynote
Infographic
Premium
-
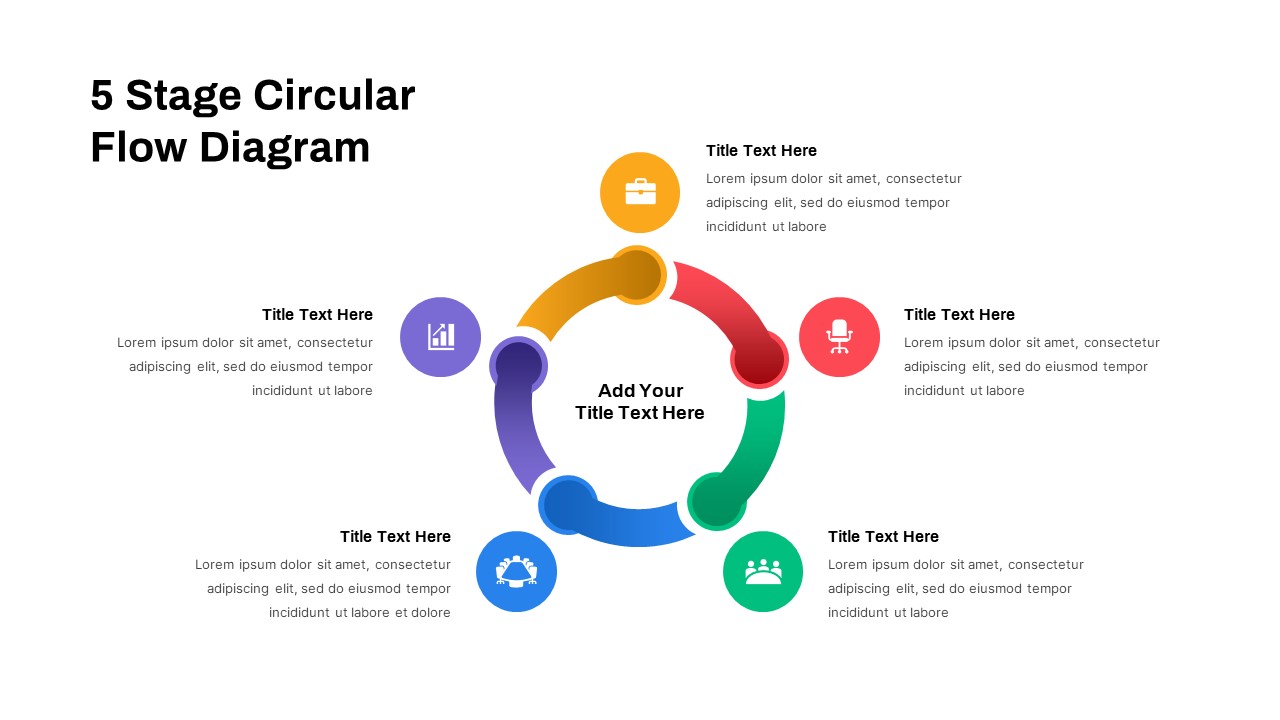
5 Stage Circular Flow Diagram Template for PowerPoint & Keynote
Circular Diagrams
Premium
-
Galerio Business Presentation PowerPoint Template
PowerPoint Business Templates
Premium
-
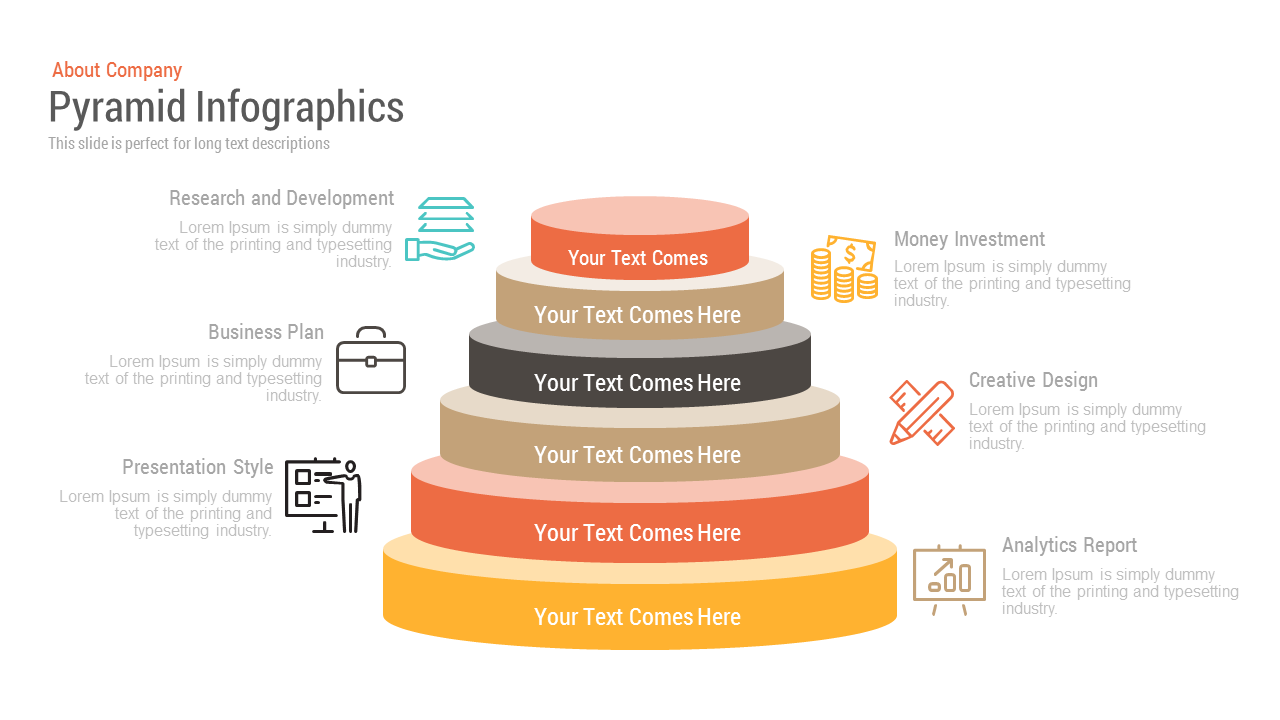
Pyramid Infographic Free PowerPoint and Keynote template
Pyramid
Free
-
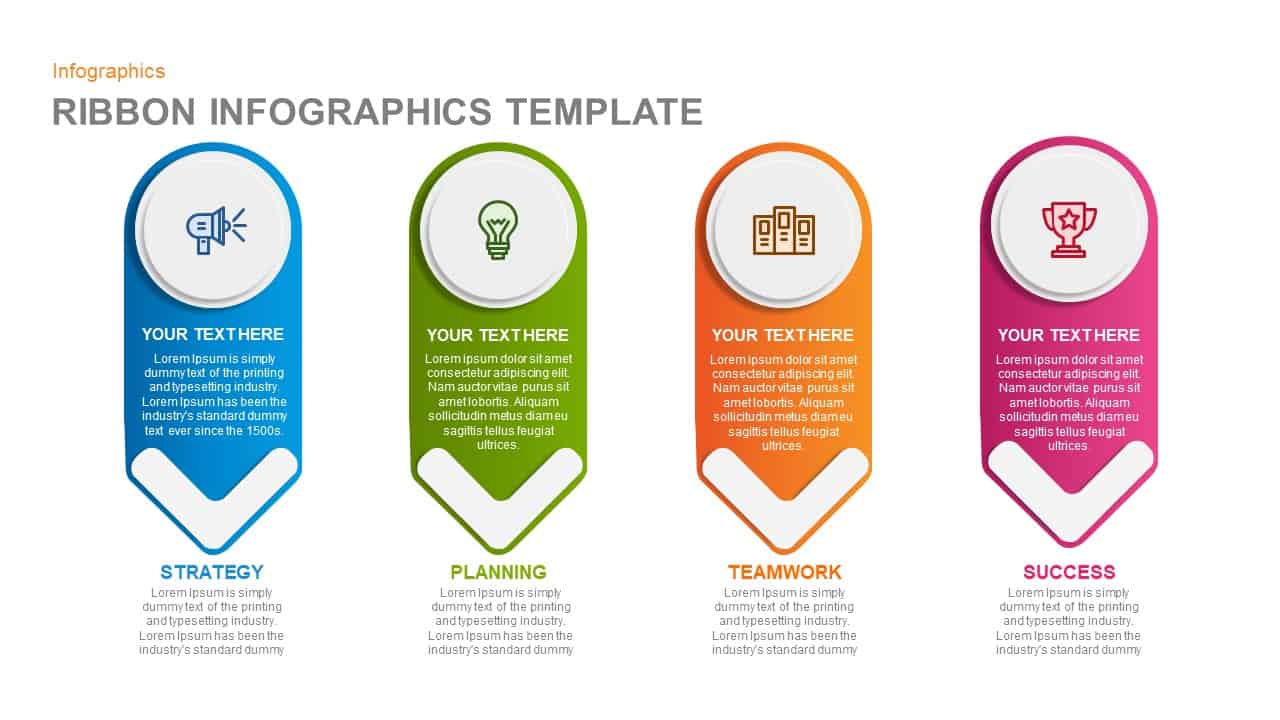
Infographics Ribbon PowerPoint template and Keynote
Infographic
Premium
-
SWOT Infographic Template
Business Models
Premium
-
Affinity Diagram PowerPoint Templates
Diagrams
Premium
-
6 Step Creative Circular Diagram for PowerPoint & Keynote
Business Models
Premium
-
Abstract 3D Hexagonal Infographic Template
Business Models
Premium
-
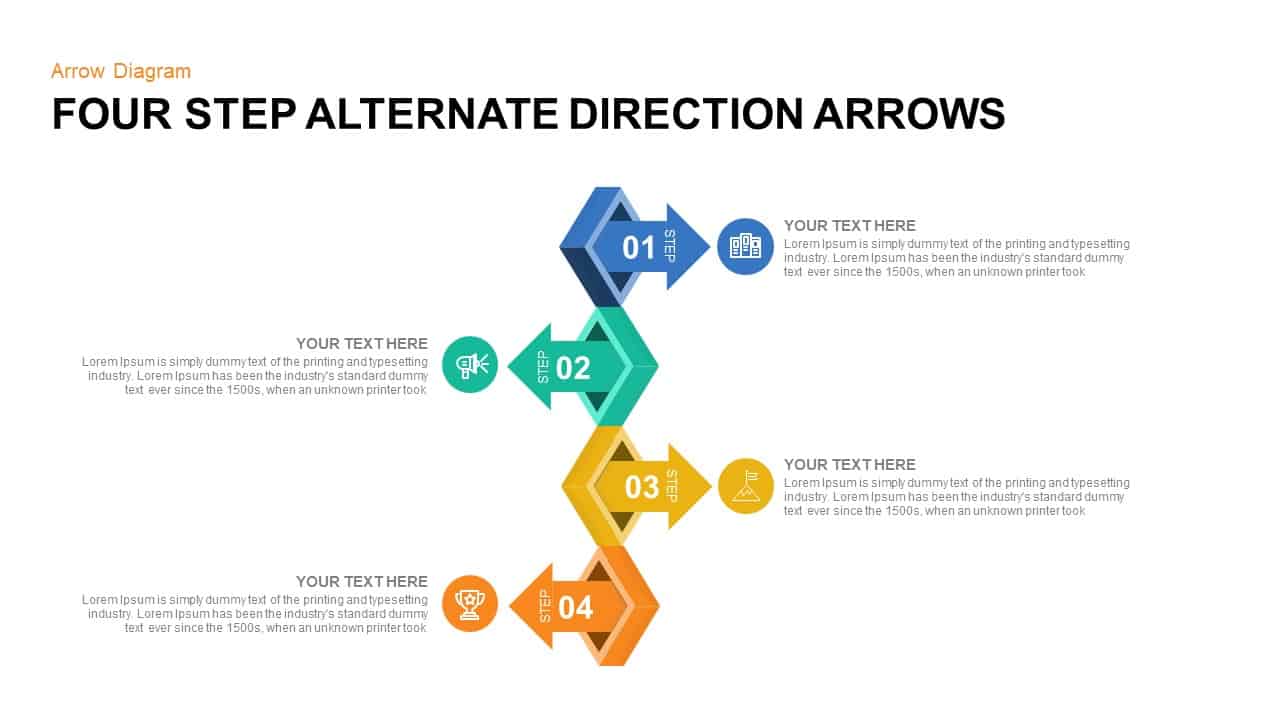
4 Points Alternate Direction Arrows PowerPoint Template & Keynote
Arrow Diagrams
Premium
-

Creative PowerPoint Templates for Download
PowerPoint Templates
Premium
-
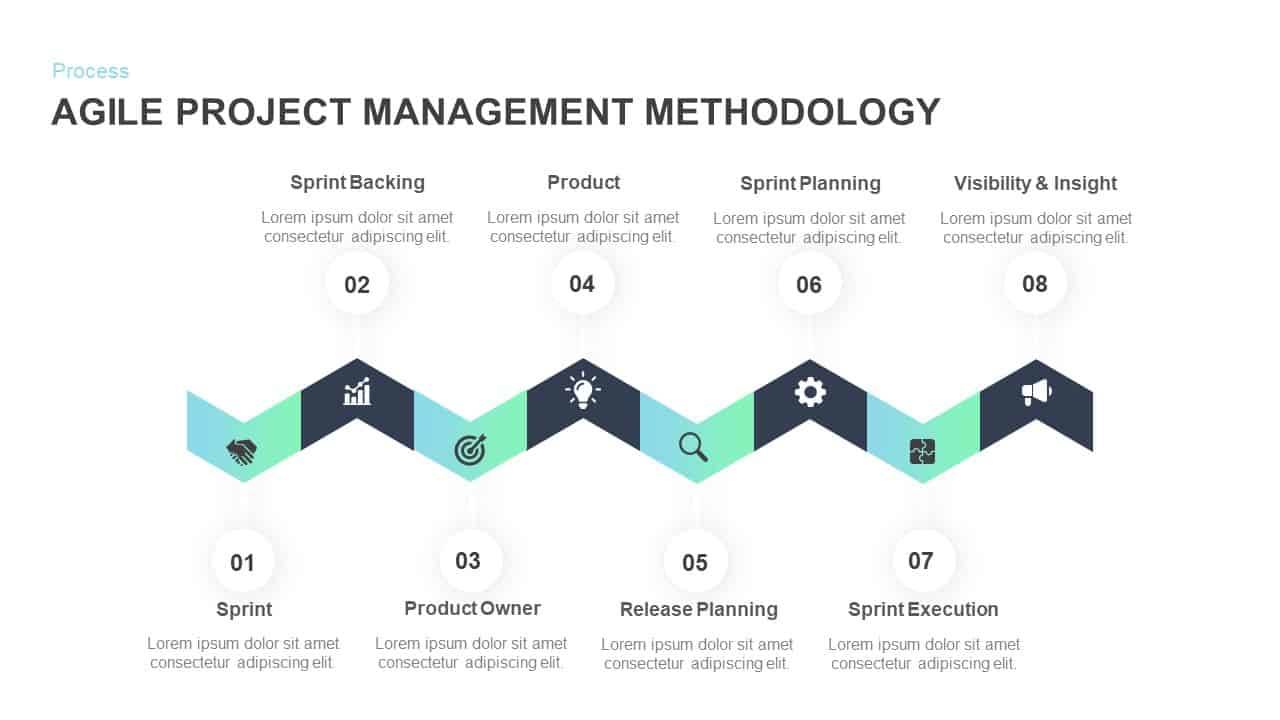
Agile Project Management Methodology PowerPoint Template and Keynote Slide
Process Flow Diagrams
Premium
-

Creative Portfolio Presentation Template
PowerPoint Templates
Premium
-
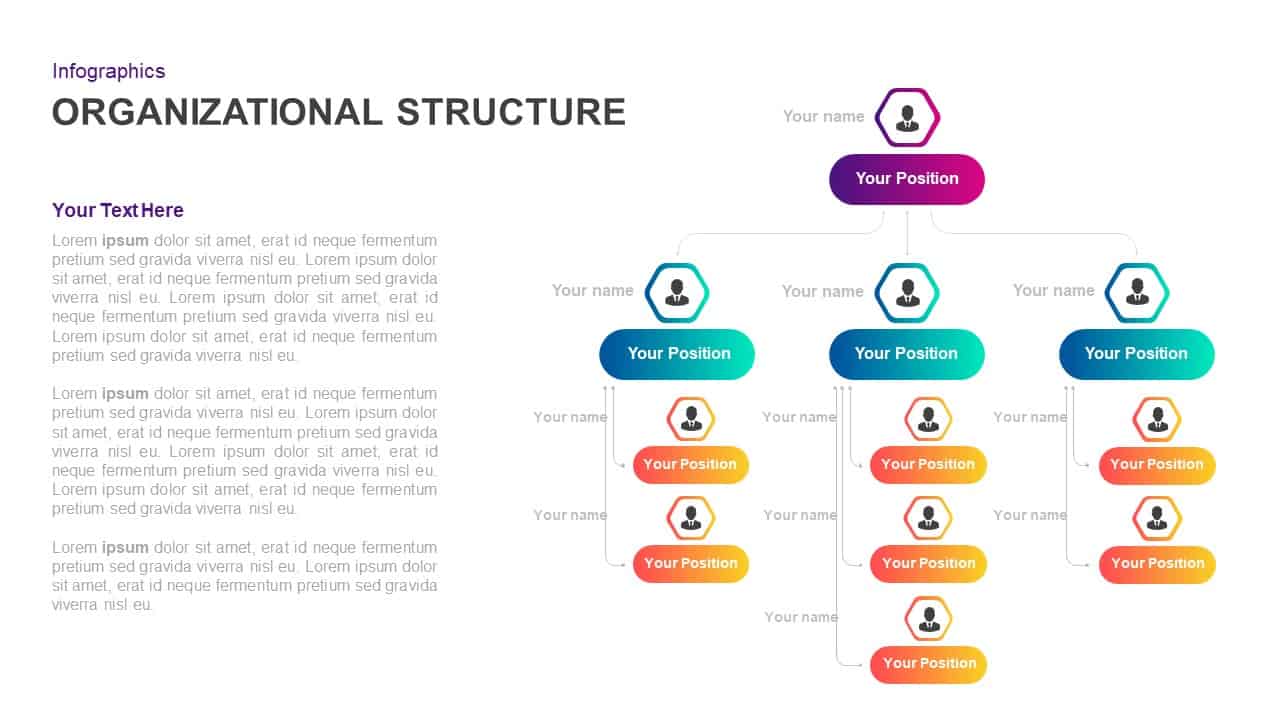
Organizational Structure Template for PowerPoint & Keynote
PowerPoint Charts
Premium
-

Metaphor Reach on Top PowerPoint Template and Keynote Slide
Keynote Templates
Premium
-
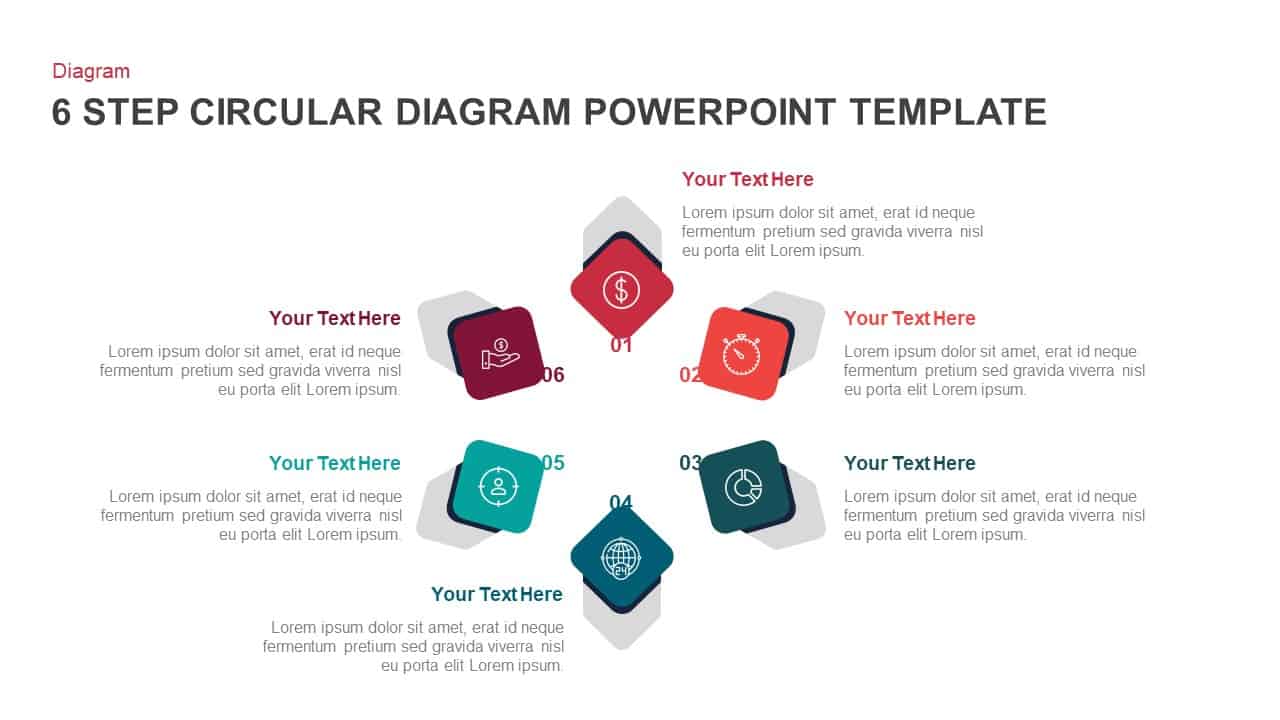
6 Step Circular Diagram Template for PowerPoint & Keynote
Circular Diagrams
Premium
-
3D Spheres Section Diagram PowerPoint Template and Keynote
3D Shapes
Premium
-
6 Step Business Process Flow Diagram Template for PowerPoint & Keynote
Process Flow Diagrams
Premium
-
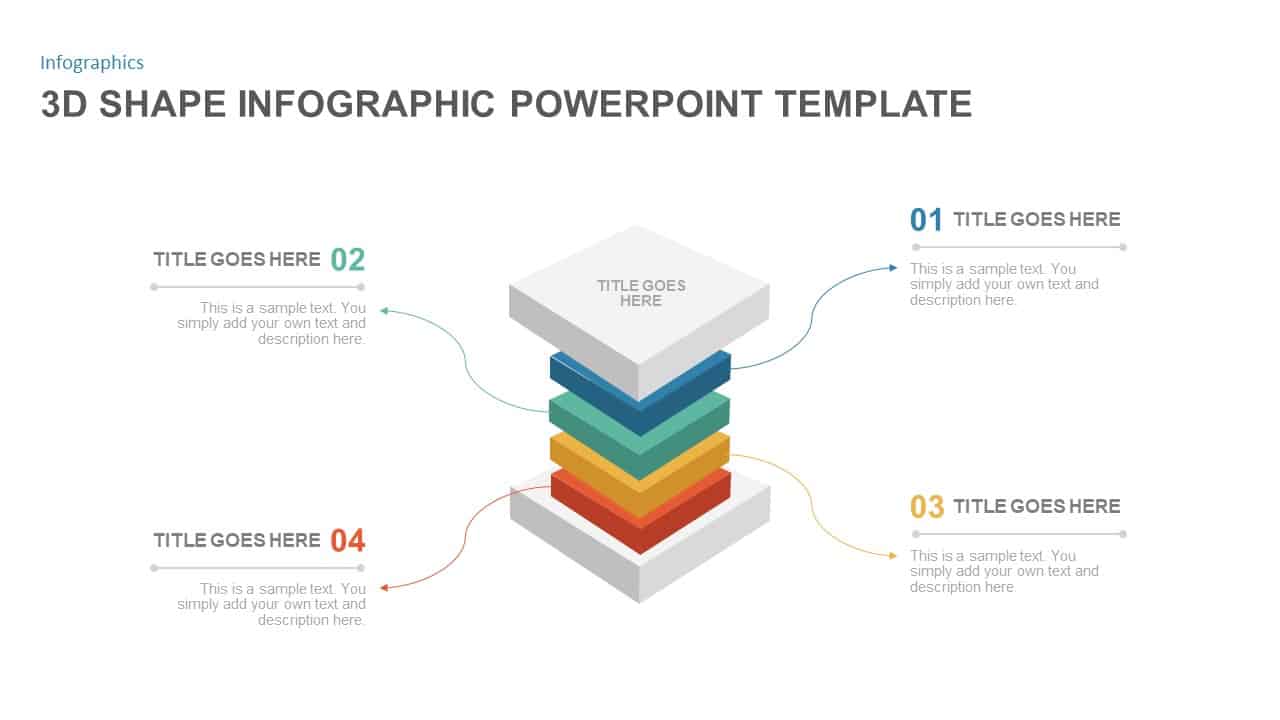
3d Shape Infographic PowerPoint Presentation Template
3D Shapes
Premium
-
Gear Process Diagram PowerPoint Template and Keynote
Diagrams
Premium
-
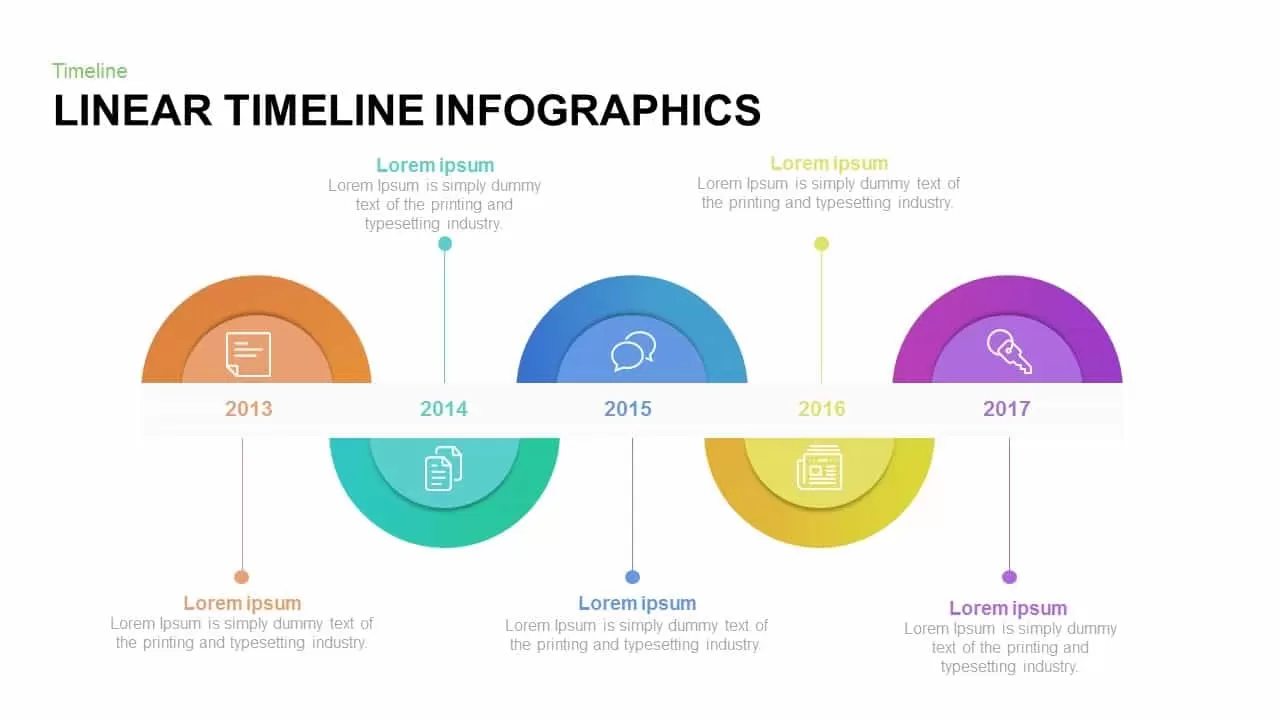
Linear Timeline Infographic Template for PowerPoint and Keynote
Timeline PowerPoint Template
Premium
-
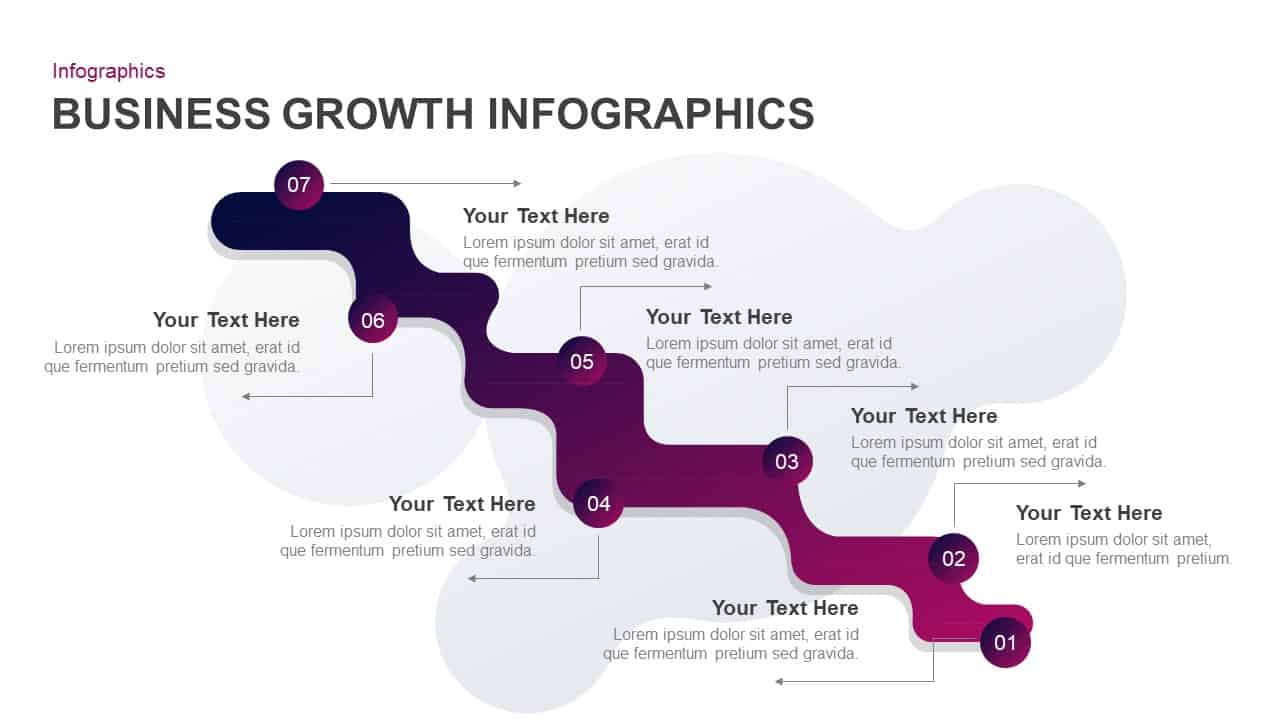
Business Growth Infographic Template for PowerPoint & Keynote
PowerPoint Business Templates
Premium
-
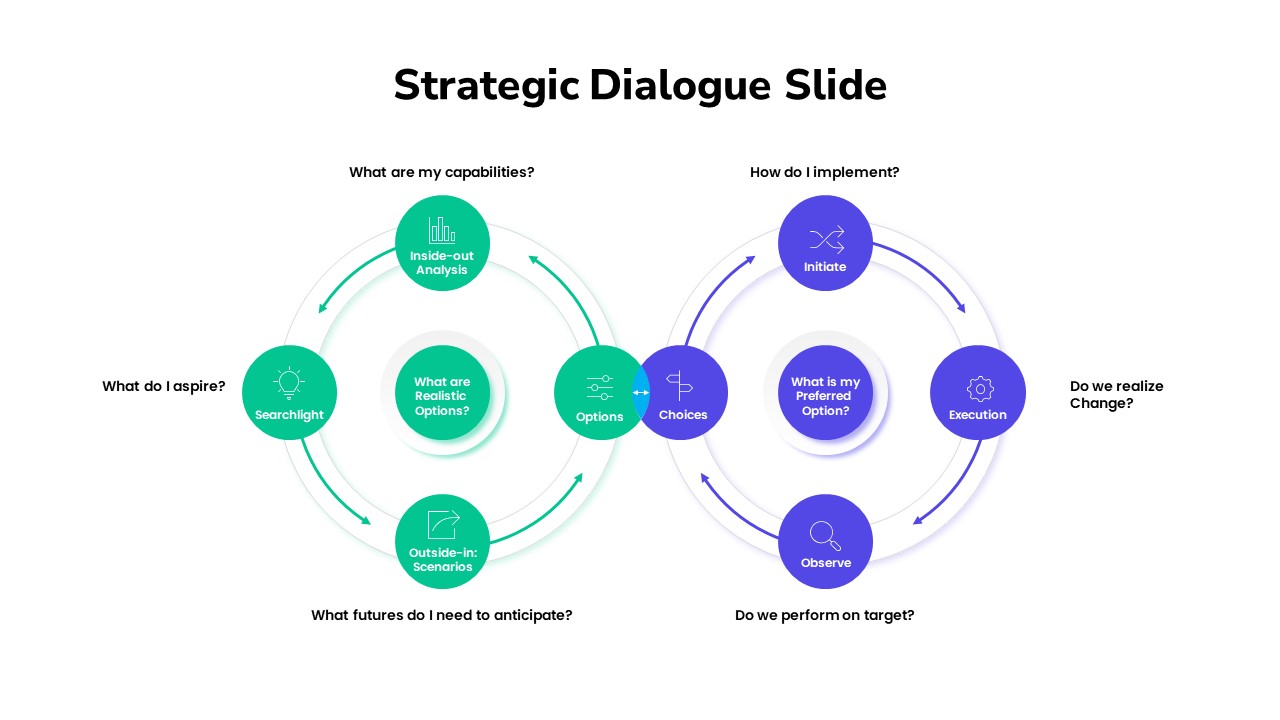
Strategic Dialogue PowerPoint Slide
Diagrams
Premium
-
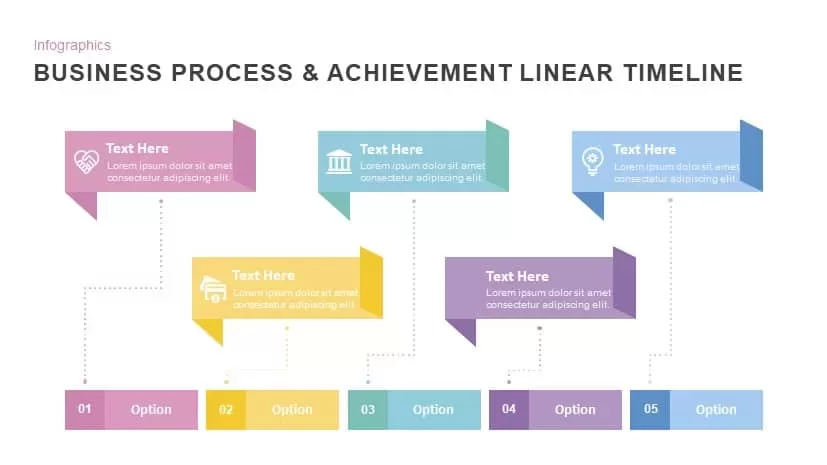
Business Process & Achievement Linear Timeline Template PowerPoint and Keynote
Timeline PowerPoint Template
Premium
-
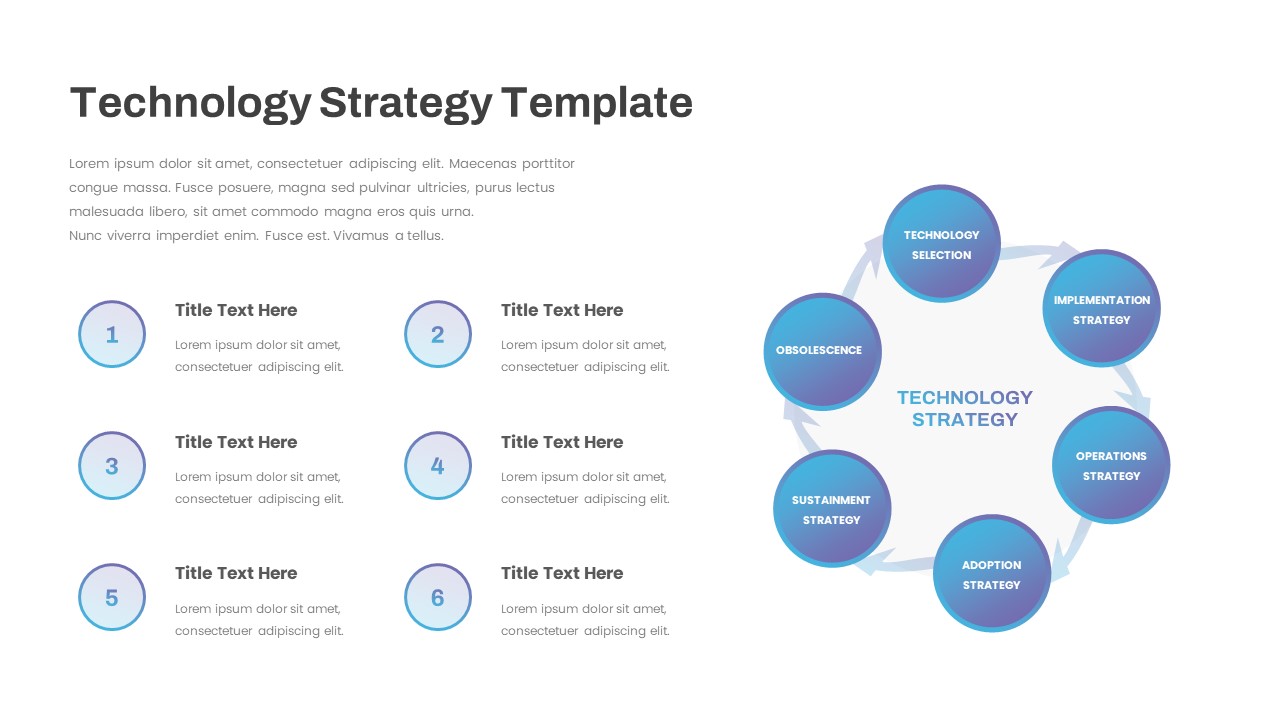
Technology Strategy PowerPoint Template
PowerPoint Templates
Premium
-

Business Process Reengineering Template
PowerPoint Templates
Premium
-
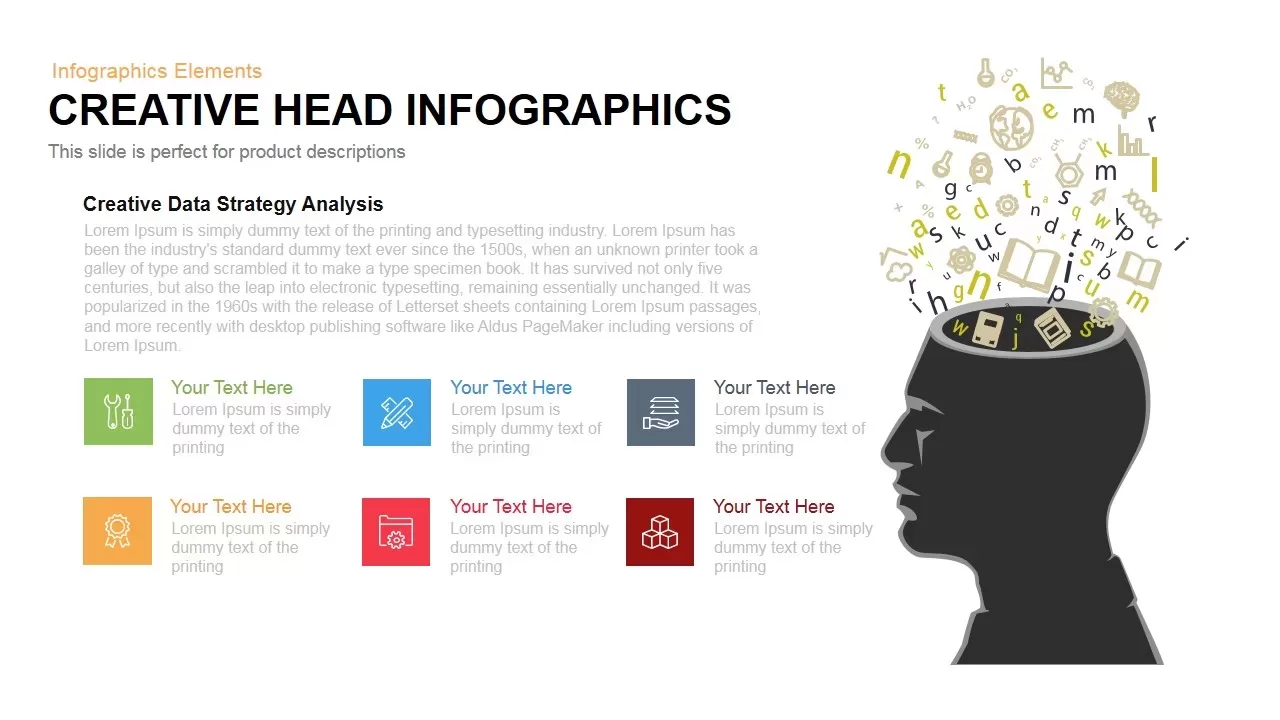
Creative Head Infographics Template for PowerPoint and Keynote
Infographic
Premium
-
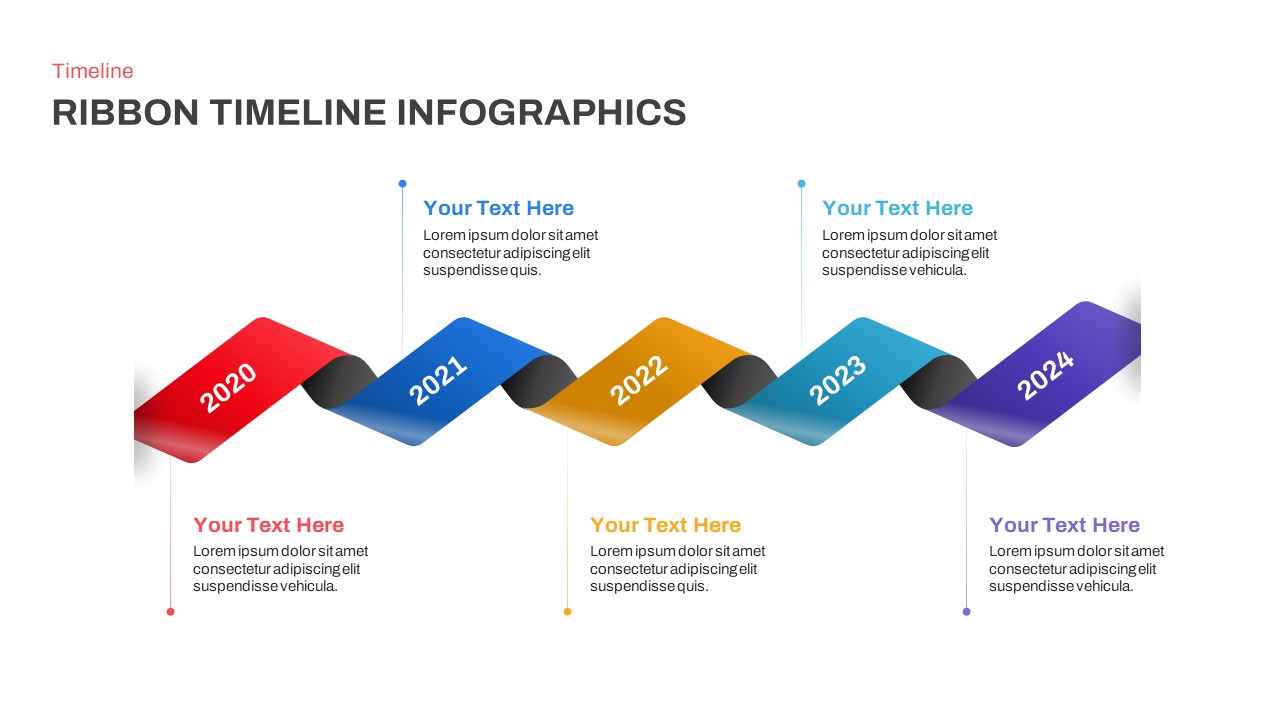
Timeline Infographics Ribbon PowerPoint Template
Timeline PowerPoint Template
Premium
-
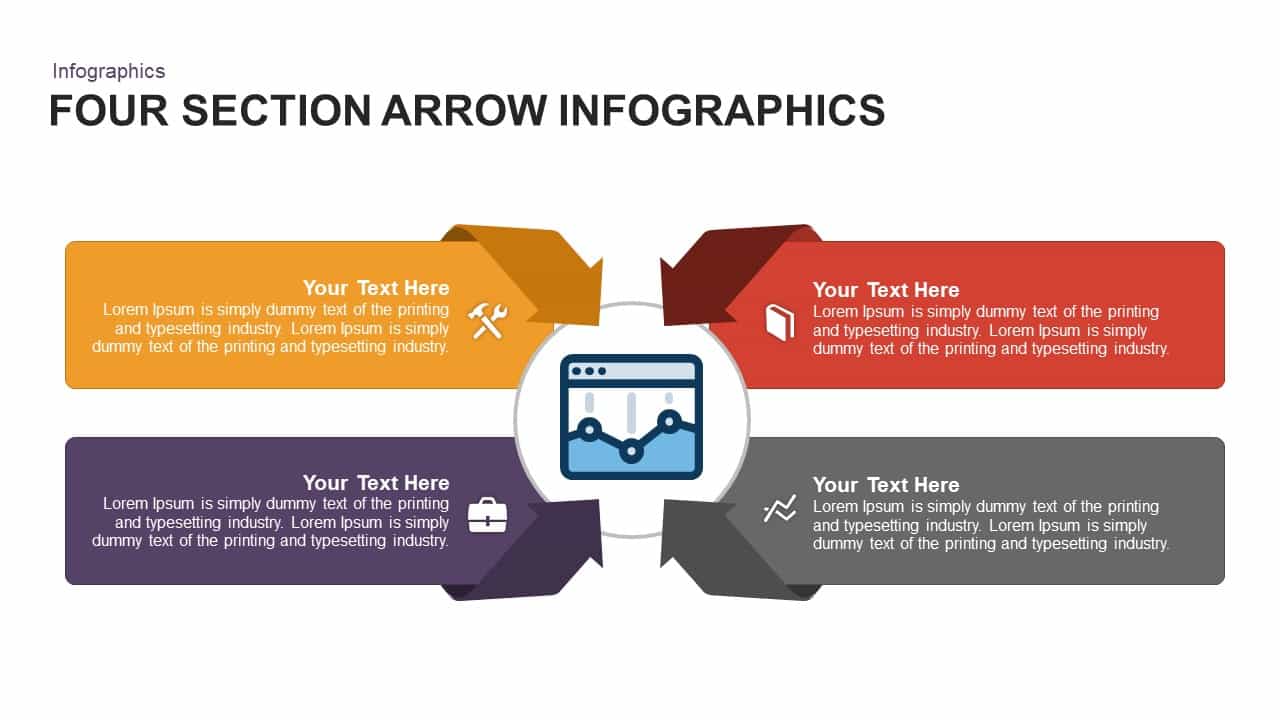
4 Section Infographic Arrow PowerPoint Template and Keynote Slide
Infographic
Premium
-
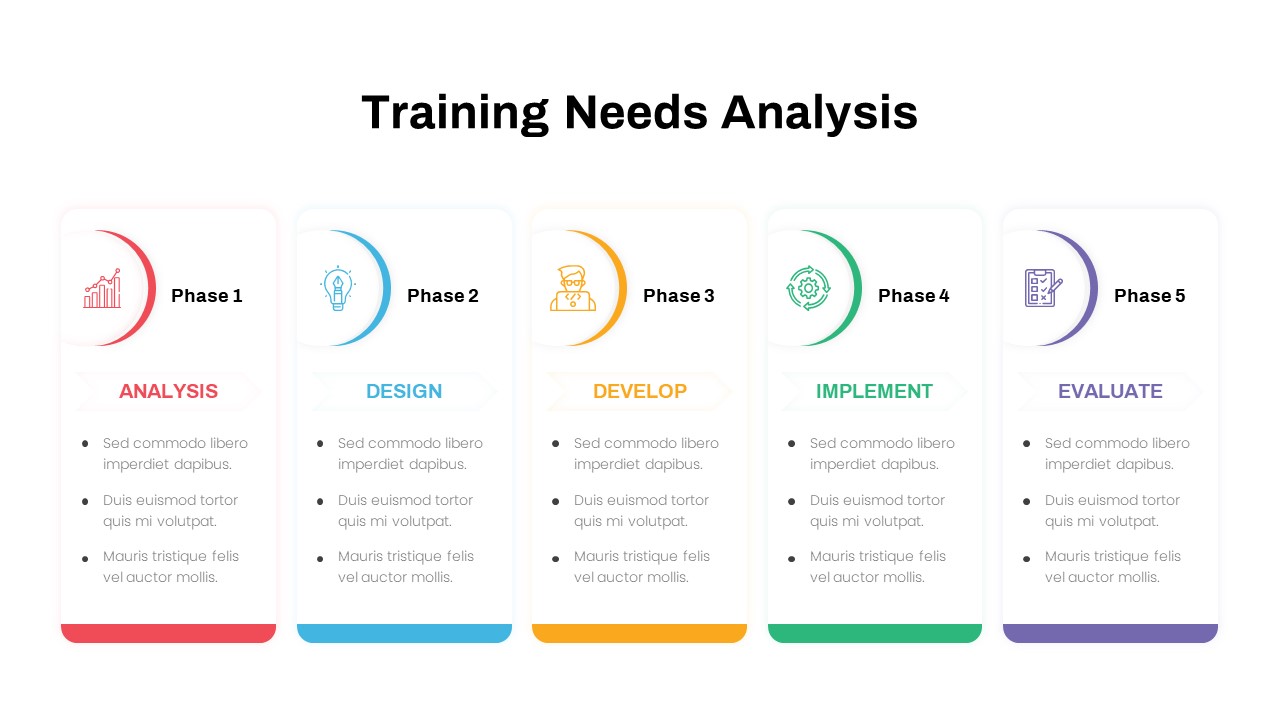
Training Needs Analysis PowerPoint Template
Infographic
Premium
-

Company Profile Deck Template for PowerPoint
Business Models
Premium
-
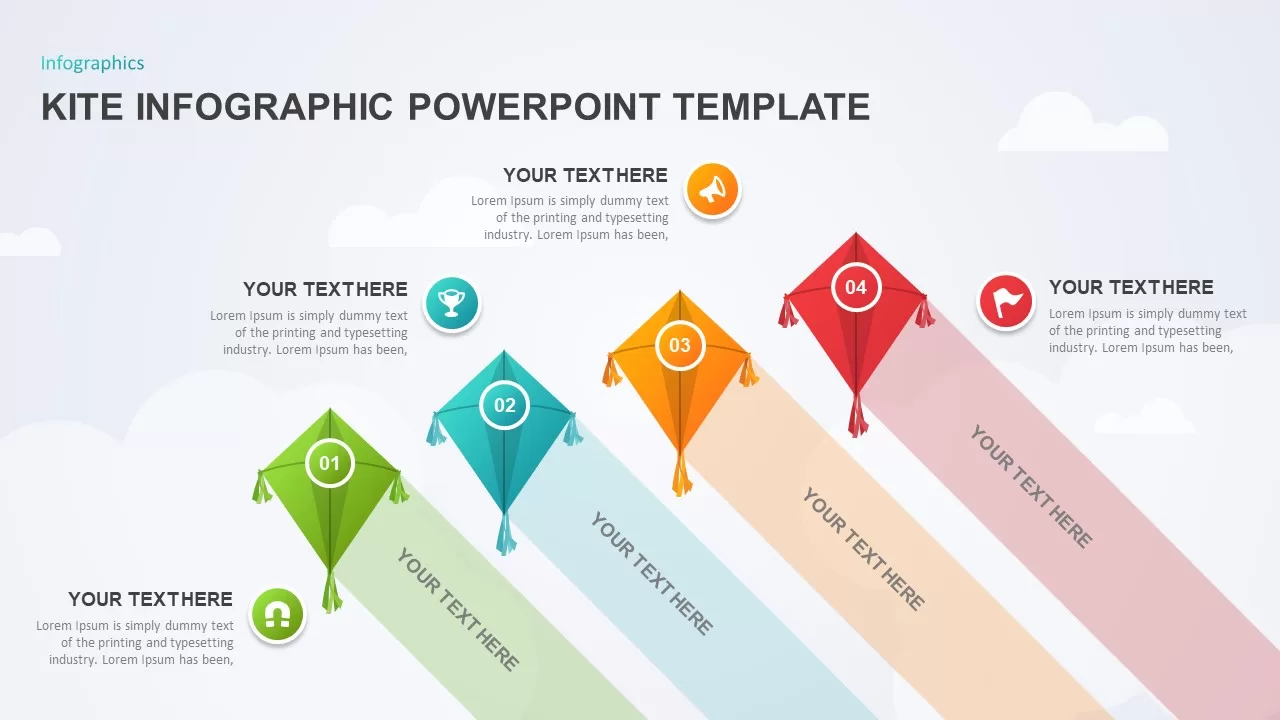
Kite Rising Presentation Template
Infographic
Premium
-

Professional Business Slide Deck
PowerPoint Business Templates
Premium
-
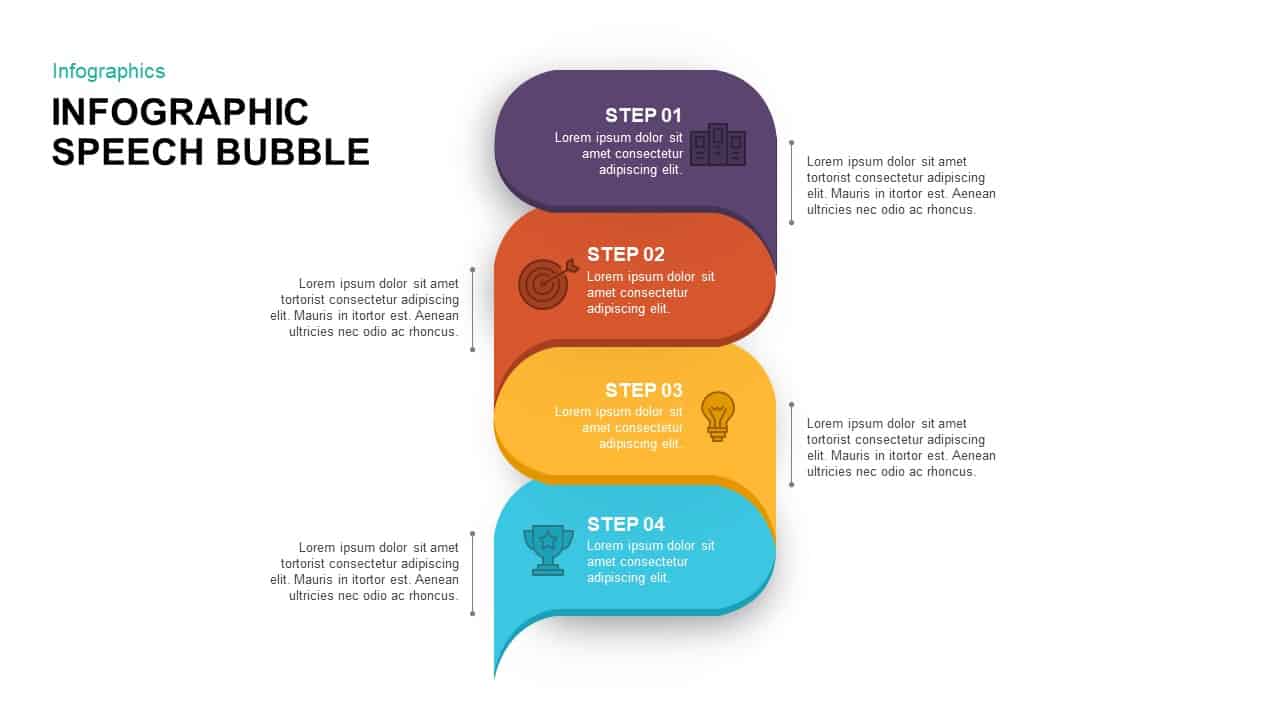
Infographic Speech Bubble PowerPoint Template & Keynote Slide
Diagrams
Premium
-
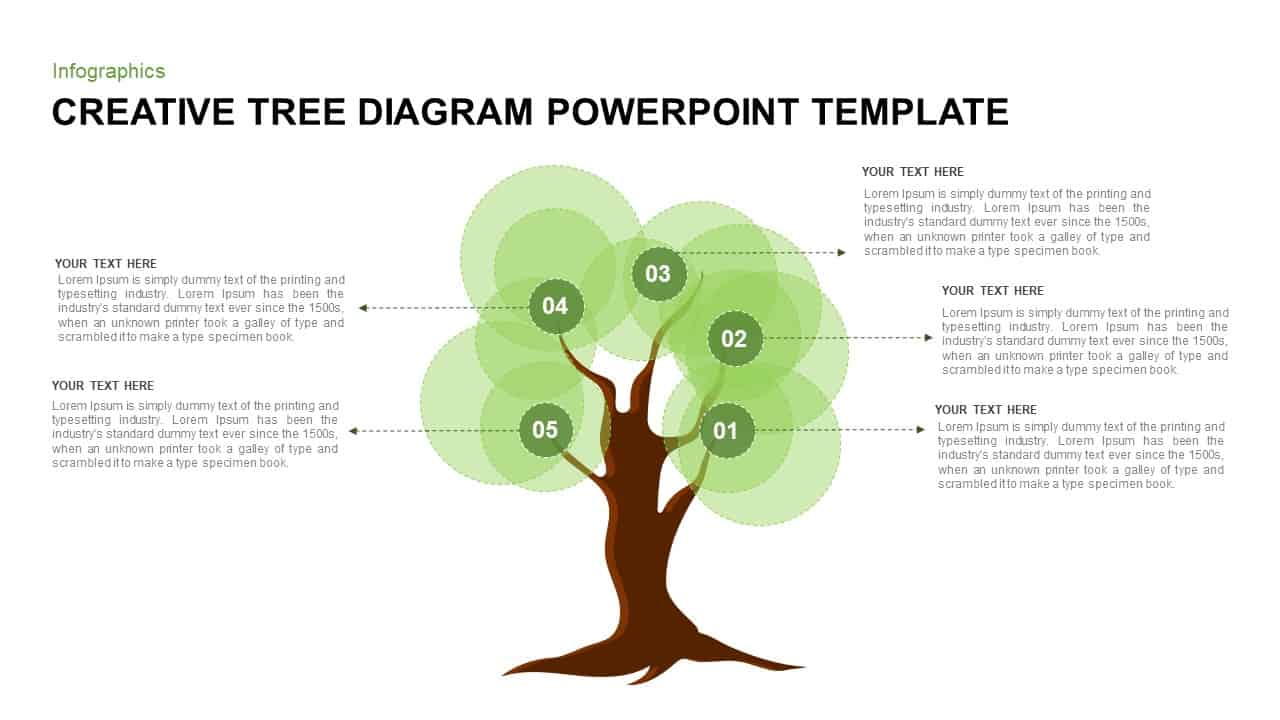
Creative Tree Diagram PowerPoint Template
Tree Diagrams
Premium
-
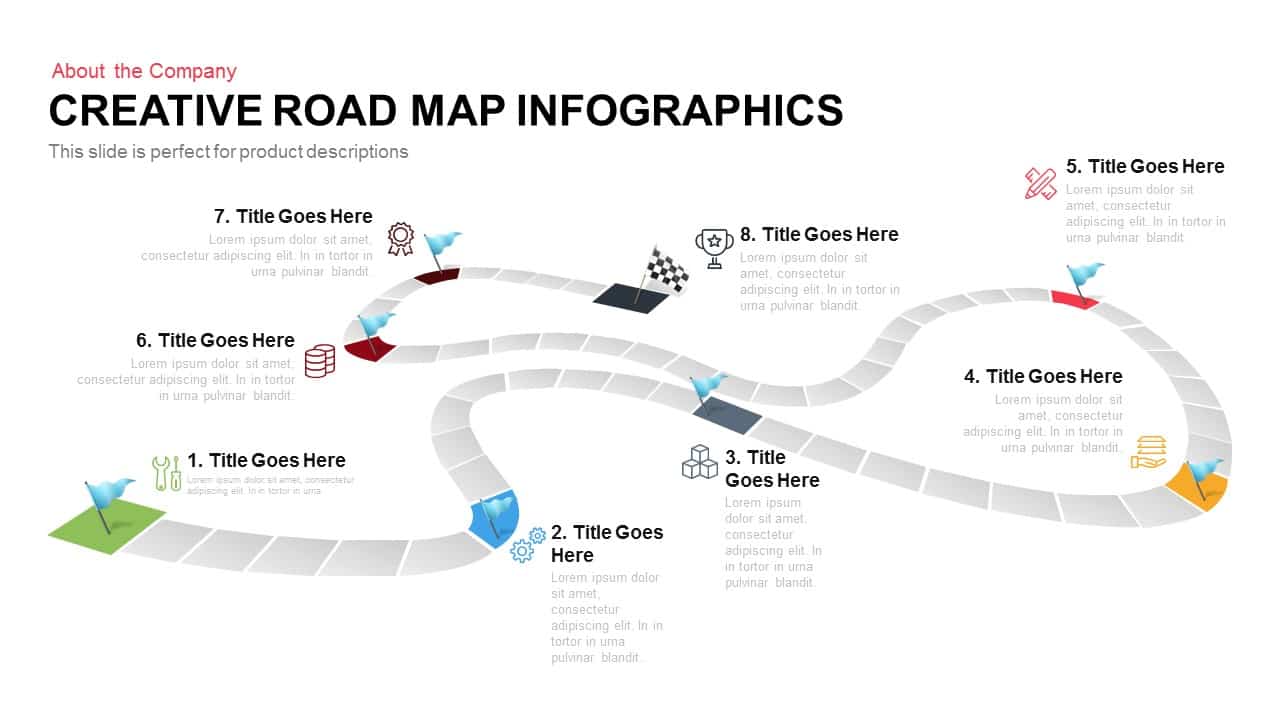
Creative Infographics Roadmap PowerPoint Template and Keynote Slide
Process Flow Diagrams
Premium
-
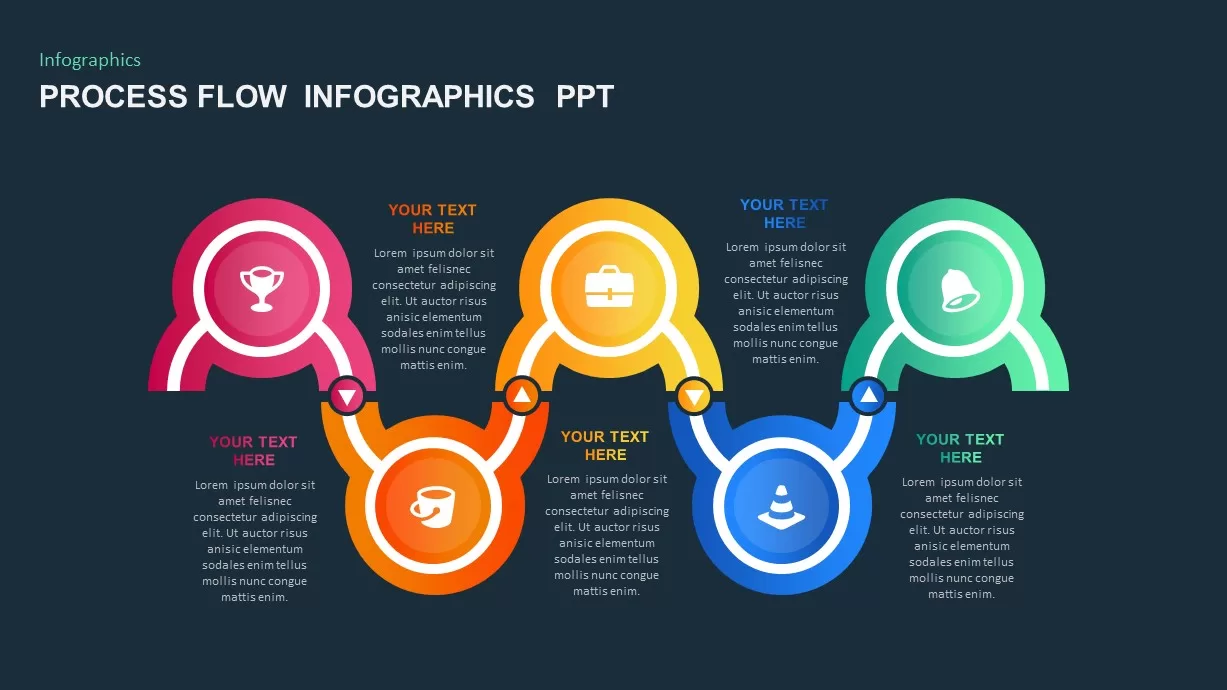
Process Flow Infographic Template
Process Flow Diagrams
Premium
-
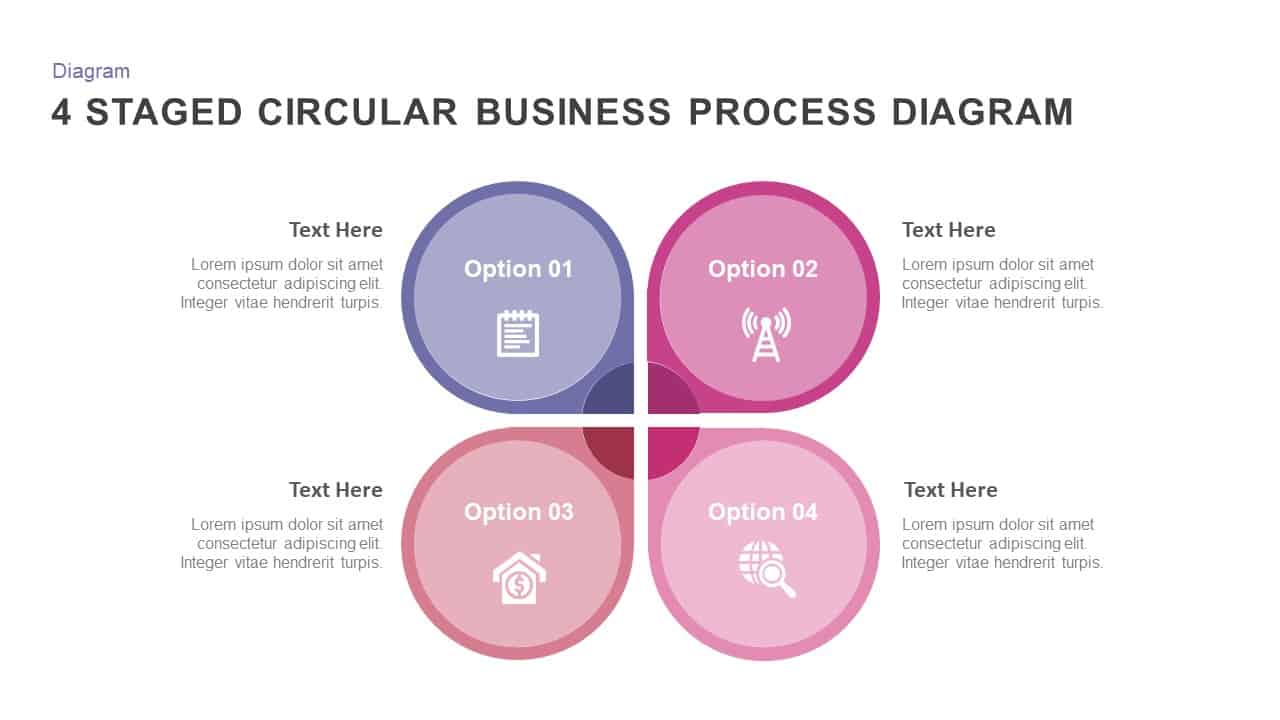
4 Staged Circular Business Process Diagram PowerPoint Template
Process Flow Diagrams
Premium
-
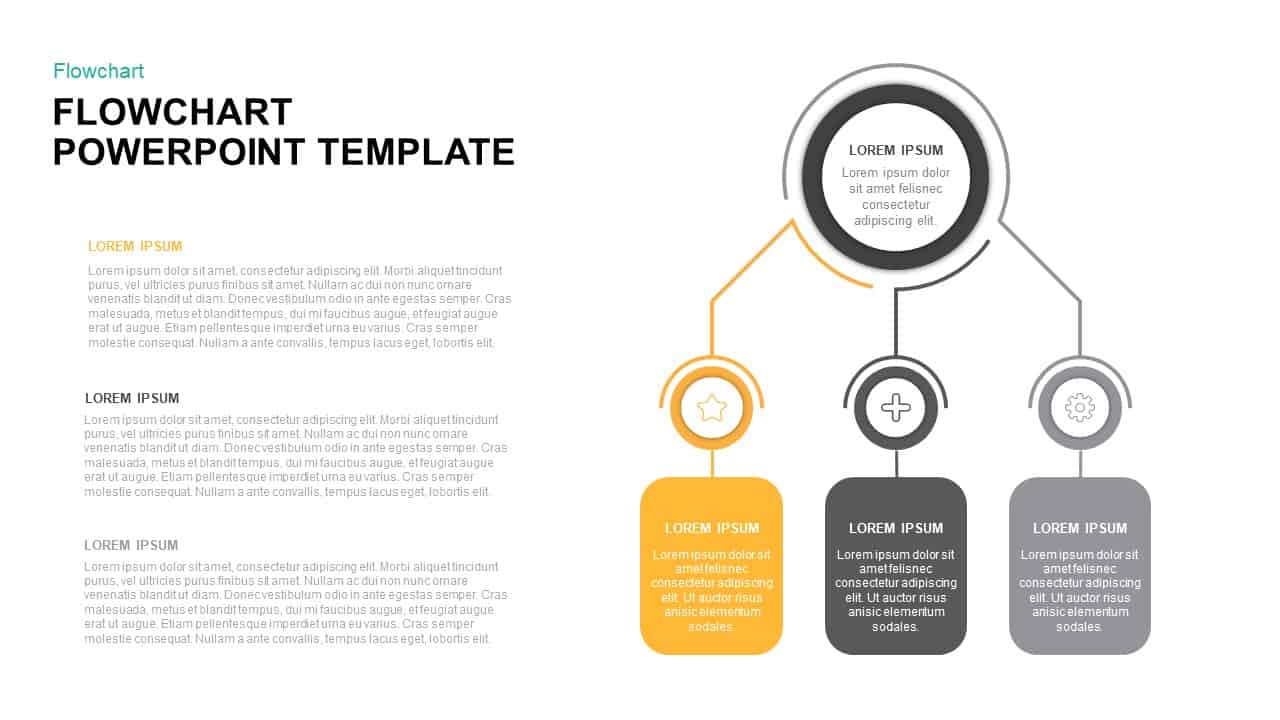
Flow Chart Template For PowerPoint & Keynote Presentations
Flow Charts
Premium
-
Creative Circle Service PowerPoint and Keynote Template
Business Models
Premium
-
Multi Directional Flow Diagram PowerPoint Template and Keynote
Diagrams
Premium
-
Creative Bar Chart Analysis PowerPoint Template and Keynote
Column and Bar chart
Premium
-
Investment Pitch Deck Template for PowerPoint
Business Models
Premium
-
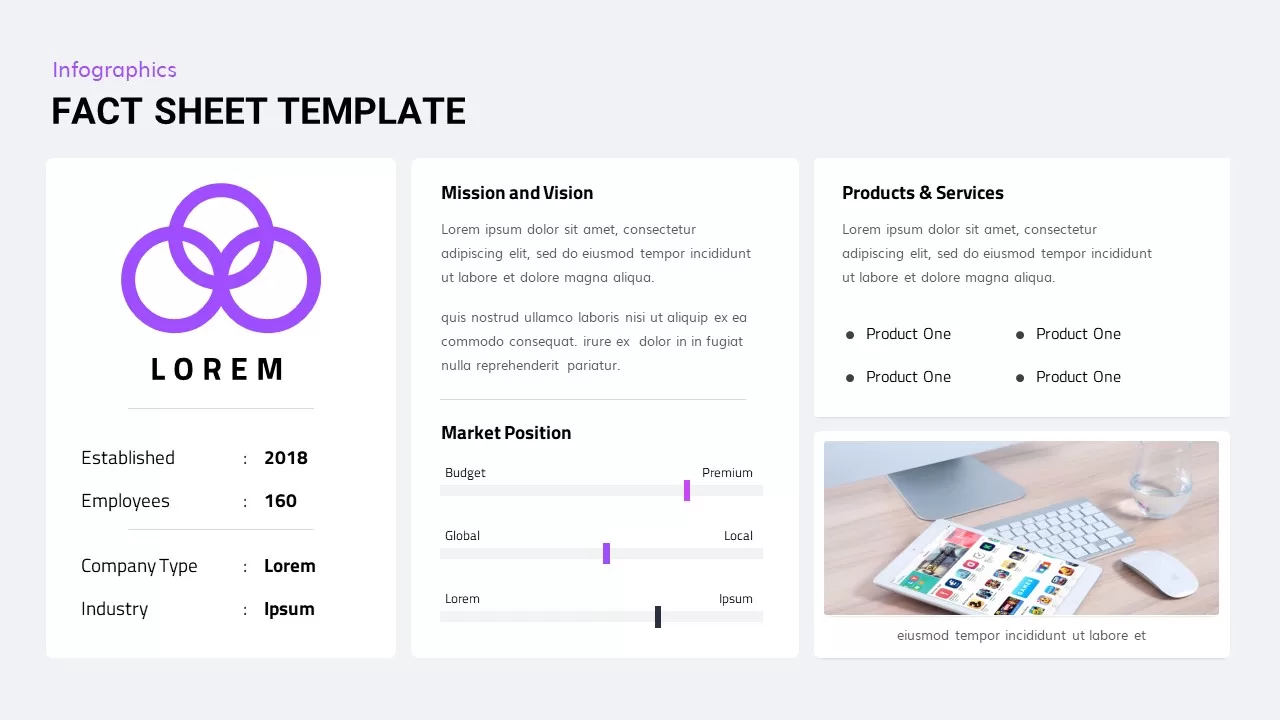
Fact Sheet PowerPoint Template
PowerPoint Business Templates
Premium
-
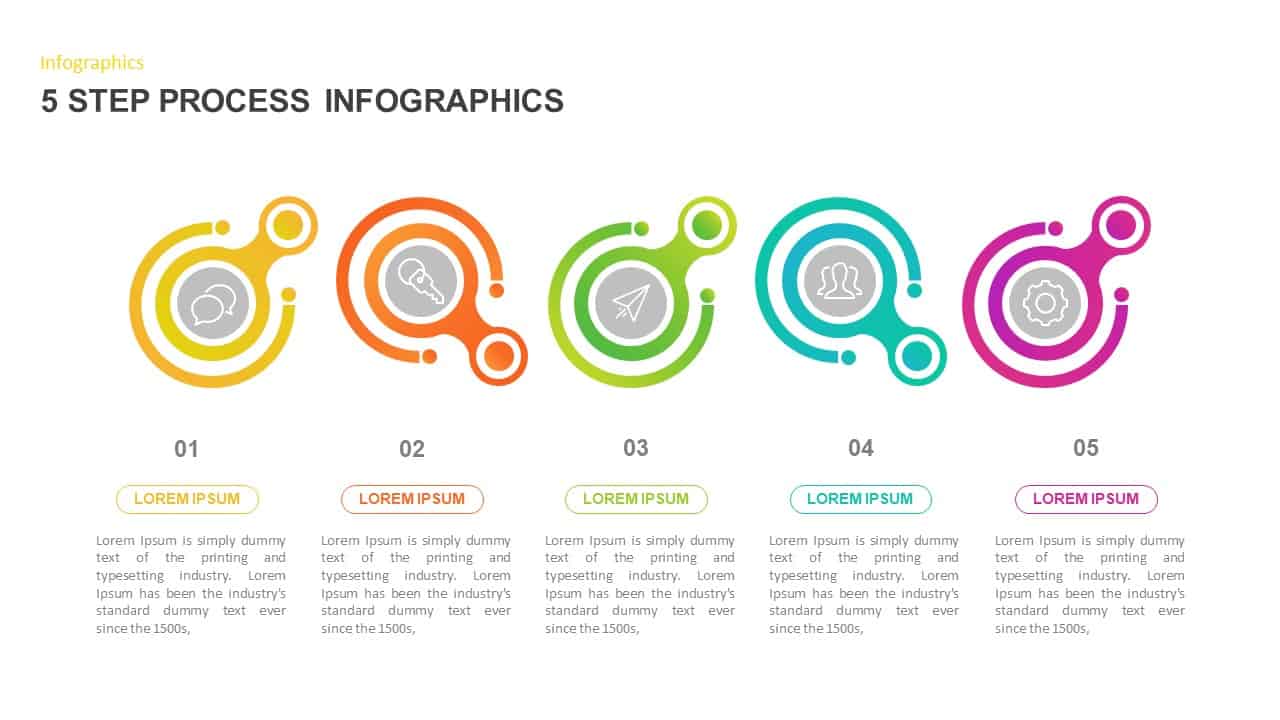
5 Step Process PowerPoint Template
Process Flow Diagrams
Premium
-
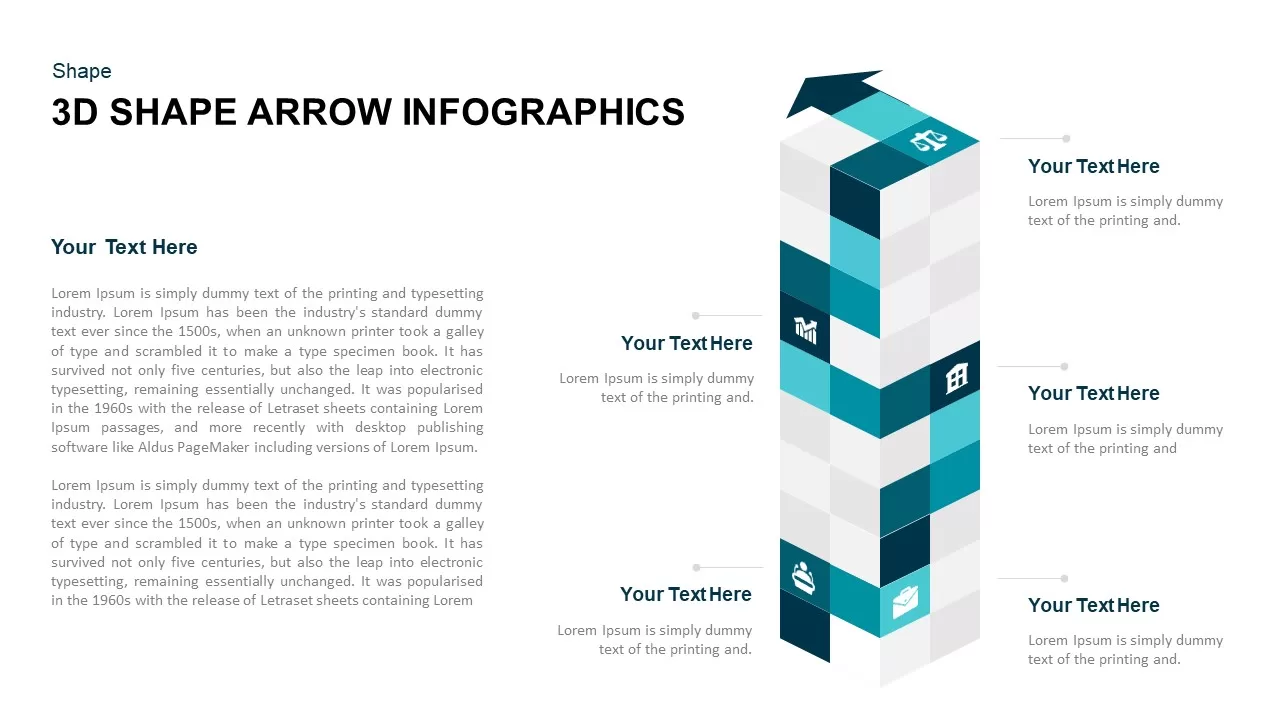
3D Cube Shape Infographic Arrow Template
Arrow Diagrams
Premium
-
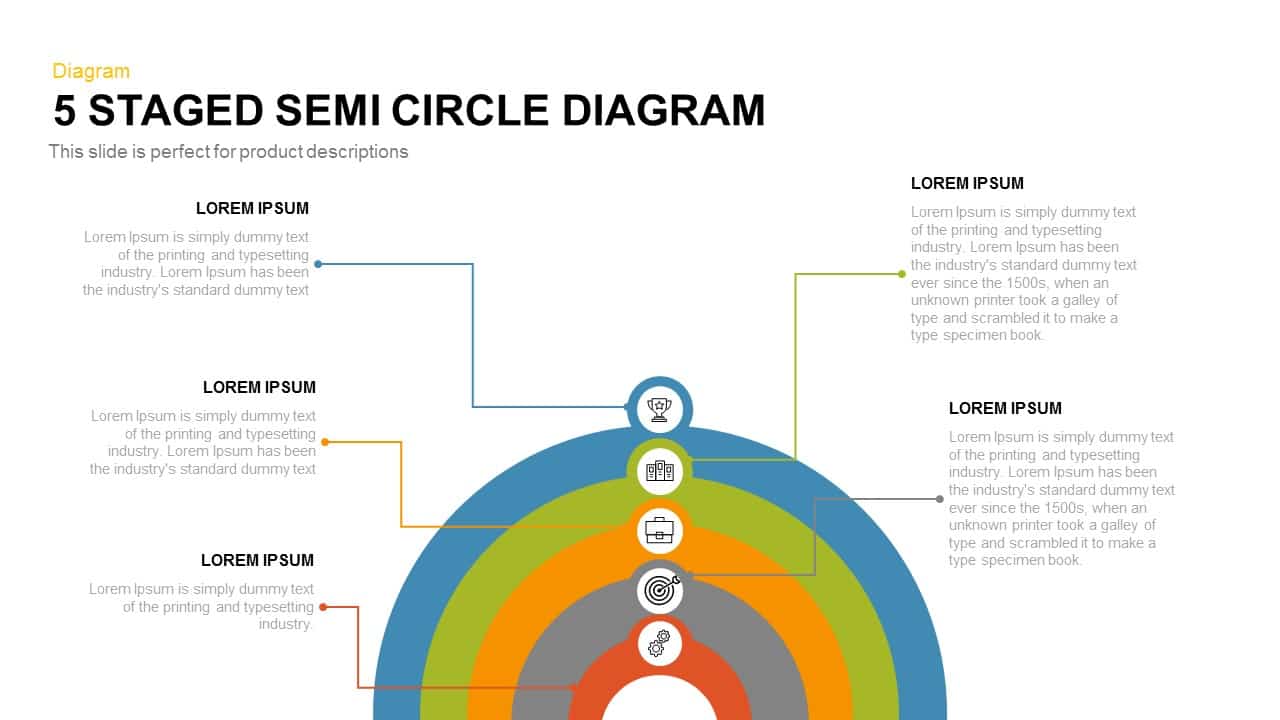
5 Staged Semi Circle Diagram for PowerPoint and Keynote
Business Models
Premium
-
Change Management PowerPoint Template
PowerPoint Templates
Premium
-
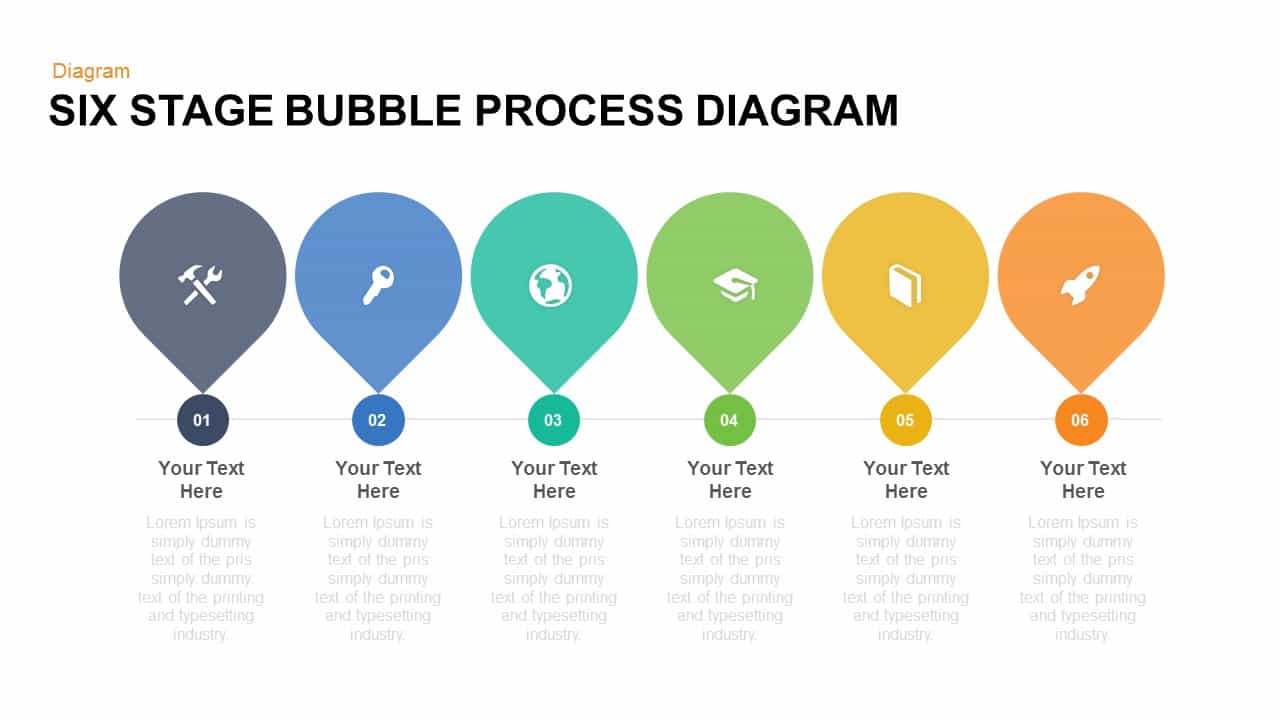
6 Stage Process Bubble Diagram PowerPoint Template and Keynote for Free
Diagrams
Free
-
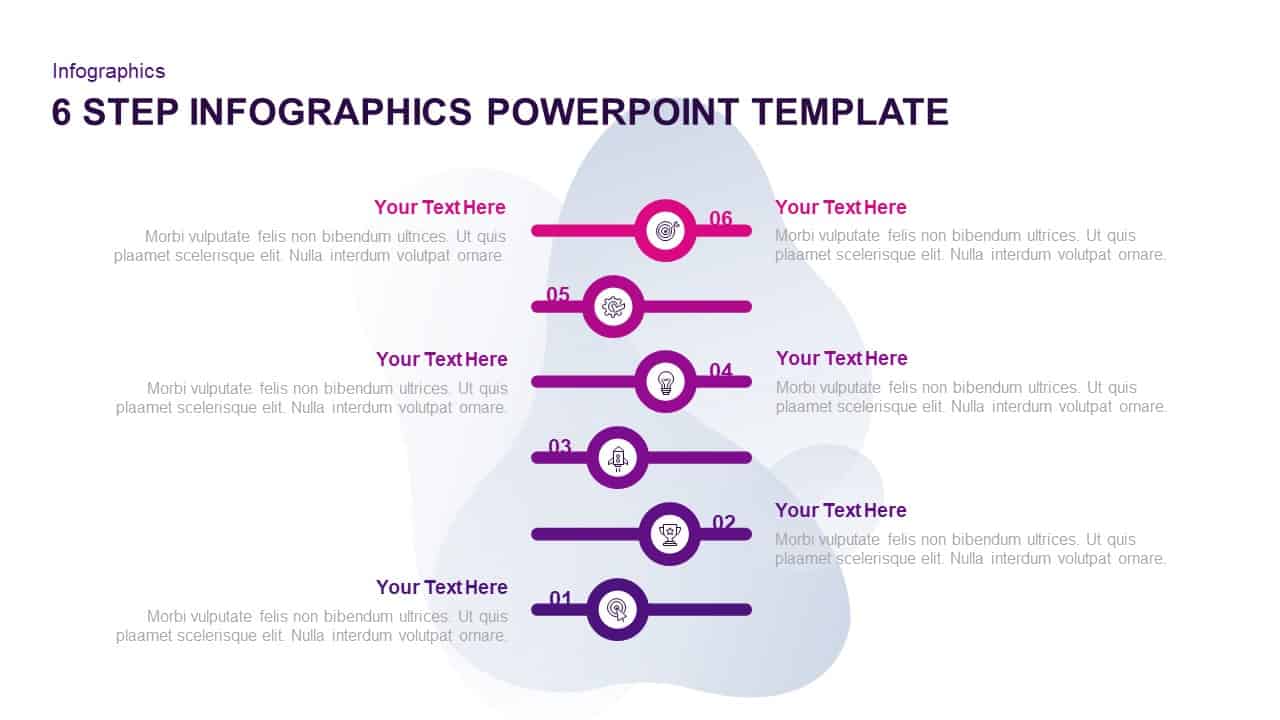
6 Step Infographic Template for PowerPoint & Keynote
Infographic
Premium
-

Nurse PowerPoint Template
PowerPoint Templates
Premium
-
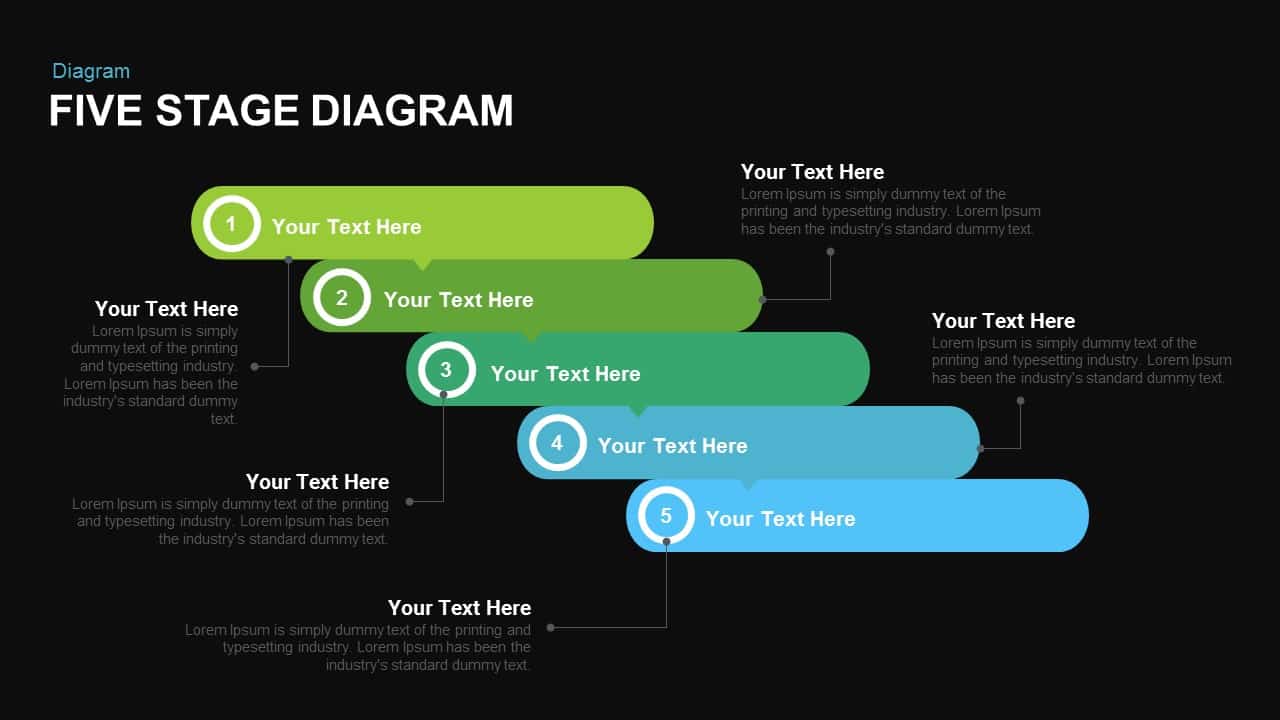
Five Stage Diagram PowerPoint Template and Keynote Slide
Diagrams
Premium
-
Design Thinking Model Template for PowerPoint
Business Models
Premium
-
Modern Cycle Process PowerPoint Template
Business Models
Premium
-
6 Section Circular Diagram Infographic Template
Circular Diagrams
Premium
-
Ring Stage Infographics PowerPoint and Keynote Template
Stage Diagrams
Premium