Cone Chart PowerPoint Template
Cone chart PowerPoint template is professionally designed for the graphical representation of statistical data.
Graphs and charts are common in any research-oriented presentation. Tabular columns and graphs make the understanding of data more easily and conveniently. It avoids clutters and makes data understanding very smooth. The
cone chart template is a marvelous design because all six cones are in symmetry but the filled colors show the different value propositions through the height of the color codes. The filled color effect is an eye-catching one; therefore the audience can easily conceive the presentation topic. The customizable
data and chart diagram allows the users to change its theme and effect by few clicks.
Cone chart for PowerPoint presentation is a useful slide for business professionals, researchers, and academic experts and so on. Users can provide six categorical data by using the template. Sales and business managers can use this slide to show sales volumes of a product over a course of time. Normally, this type of data representation can be done with small texts. The chart diagram lets the style neatly and elegantly.
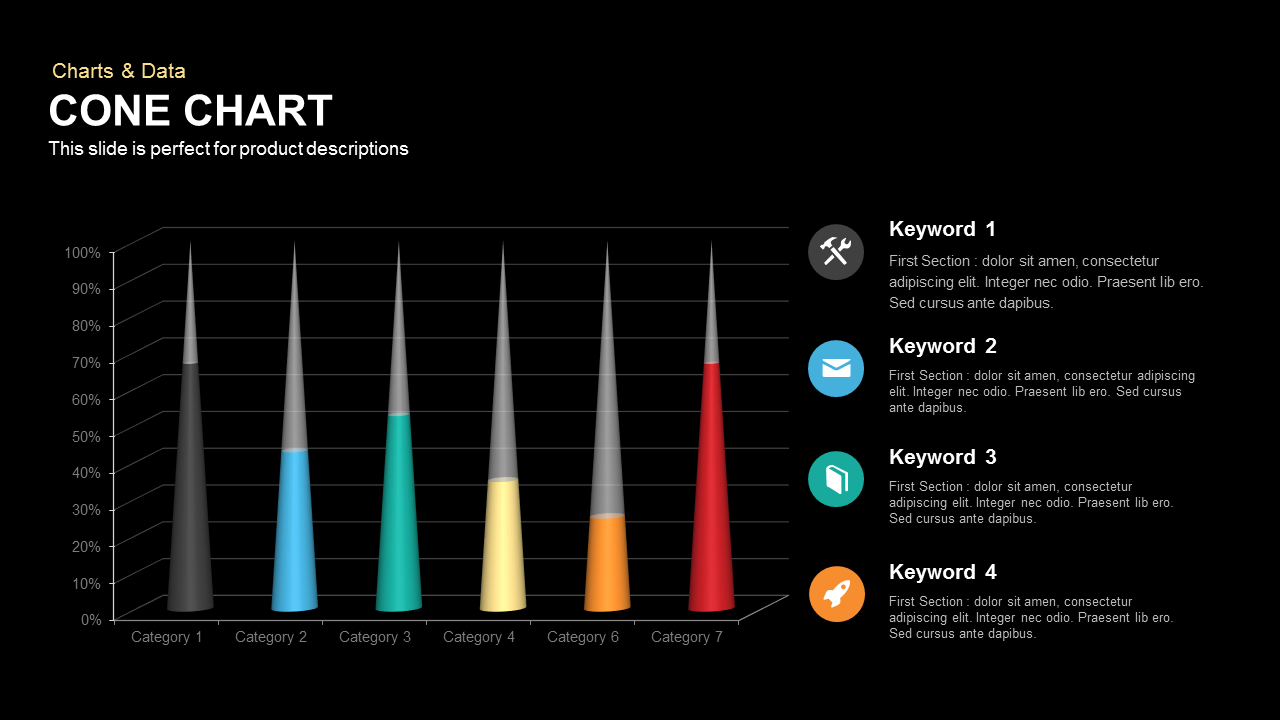
Cone chart PowerPoint template takes the form of a bar chart with X and Y axis and horizontal lines going through the one end and other end of the chart. The
Cone Chart PowerPoint is a 3D chart and instead of bars we have colorful cones in the chart. They are six categories and hence six cones in shades of grey, red, blue, yellow etc. Adjacent to the chart there are four text boxes wherein you can write the corresponding description to each. The
Cone Chart PowerPoint template is available in white and black background and you may use it during meetings and presentations to illustrate your examples and stories concerning the organization, market, buying behavior, finance, resources, consumer trends and the like. User can download more graphs and charts from our
charts and data category.
Please Note: This is only for Powerpoint, Keynote file is not attached