


Cone Data Chart
This template is part of a deck featuring multiple slides. To check out all slides, click on See All.
See All

Cone Chart Data PowerPoint Template
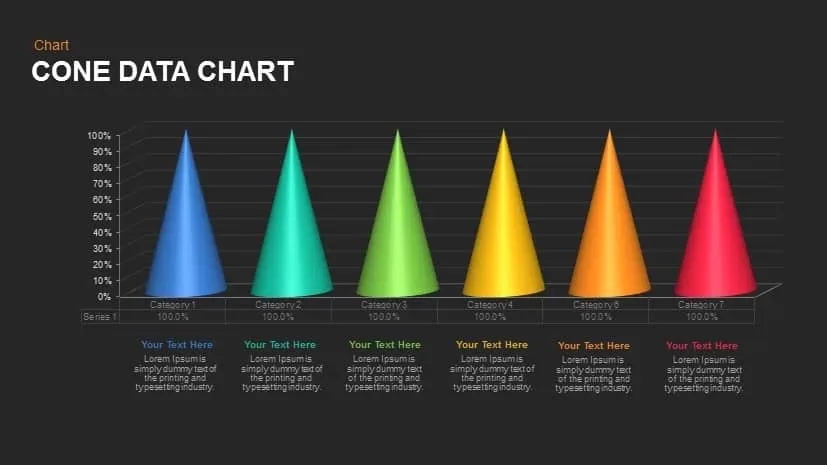
Create an entertaining PowerPoint presentation using our cone chart data PowerPoint template. Instead of using usual bars, cylinders our expert designers have used a cone to make the template more interesting. The cone mimics an inverted ice-cream cone, the graphics while maintaining the simplicity of the presentation adds a catchy and interesting vibe to the presentation. The powerful design creates an urge among the audience to stick to the presentation slide. The cone chart slide converts the engagement into a remarkable experience. The cone data chart creates a non-intimidating experience among the audience which leads the audience to interact more and remembers the keynotes easily. Our cone chart data PowerPoint template is a creative alternative for comparing data. Other charts use cylinders, pyramids, bars for statistically representing data. Instead of that our template uses a cone. The cone is sharp at the top and wide at the bottom. The structure makes it easy for the audience to differentiate each figure accordingly. The gradual decrease and increase in the size of the cone shows progress or growth. The simple design enables the audience to focus on the graph and host. In no time the audience can study the graph and can anticipate in the host’s statements. Our cone data chart features six cones crafted in vibrant colors. The striking color palette gives a lively touch to the presentation slide. The color palette is configurable using theme functionality. Each cone is accompanied with text areas. The cone data chart template is entirely customizable and can suit any presentation theme. The presentation slide creates an appealing environment while discussing sales, market analysis, stock value. Visual representation of data has a lasting impact on human brains. So instead of wasting crucial time designing from scratch. Bet smart and deliver your statistical using our cone data chart template. Turn your dull and lengthy data into self-explanatory pictures with cone data chart template.You can access more Chart PowerPoint Templates here Grab the free ppt now!