


Combination Chart presentation Template
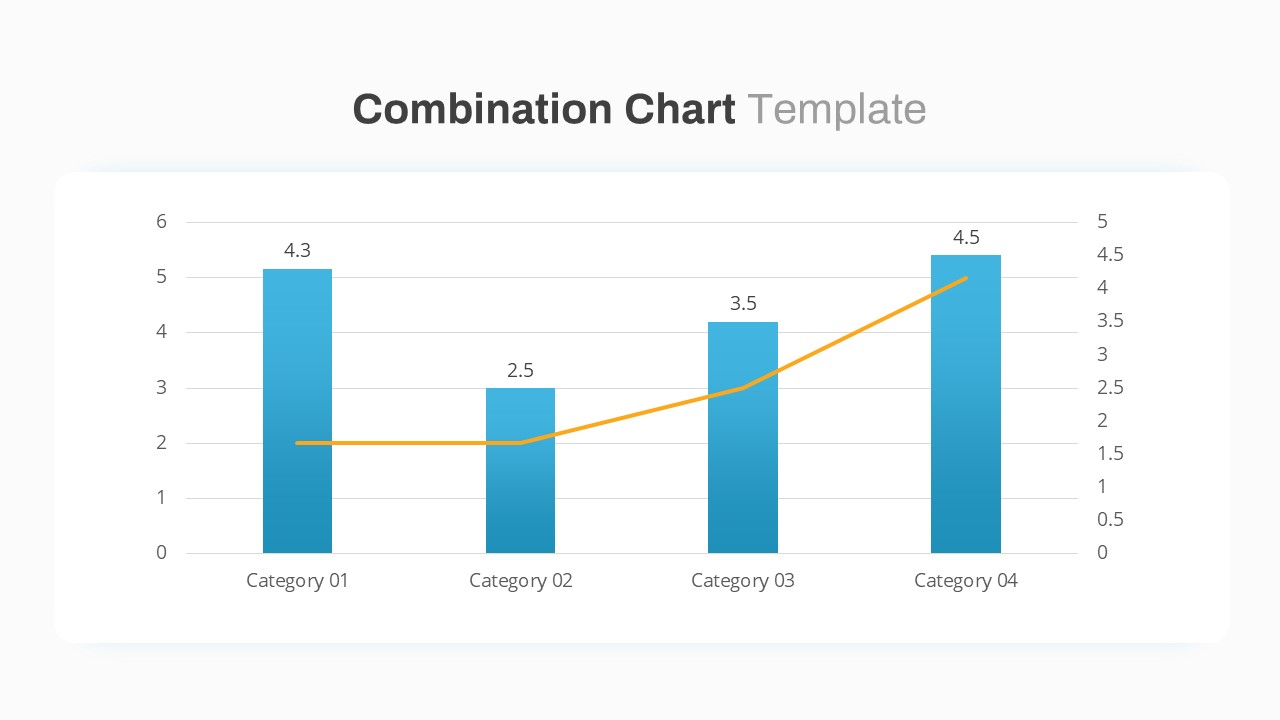

A combination chart template is suitable for presenting business data. This is a simple PowerPoint chart for data presentation with a combination of bar charts and line graphs. A combination chart is a type of data visualization combining two or more diagrams into a single graph. It allows you to display and compare different data series or categories comprehensively. Typically, a combination chart incorporates different chart types, such as line charts, bar charts, column charts, area charts, scatter plots, or pie charts, within the same graph. Here, it shows two types of statistics presentation diagrams; a vertical bar chart PowerPoint and a ppt line graph. Each chart type represents a different data series or category, allowing you to present multiple data sets or variables in a unified visual representation. The combination chart template for the PowerPoint presentation has a bar chart representing sales figures and a line graph illustrating profit margins for different products over a period. This combination of charts enables viewers to analyze sales trends and profit margins in a single visual. This PowerPoint chart showcases the sales figures of four products in a single presentation platform. The template comes in two variant designs. The presenters can choose the second chart for their sales presentation since the product details are on the left side. The second combination chart can be used for research presentations, especially on social issues. However, with customizable options, this data presentation tool, users can make it suitable for any data visualization. The combination chart PowerPoint template is a professional diagram to compare relevant business data. It shows the distribution of two variables in quick views. The viewers can easily understand two types of data distribution using a simple template. In addition, the users can personalize the chart designs using PowerPoint edit options. It allows changes in the size, color, patterns and much more. Download alternative charts and graphs now!