


Cause and Effect Diagram Template for PowerPoint and Keynote Slide
- Version
- Download 209
- File Size 0.00 KB
- File Count 1
- Create Date January 8, 2019
- Last Updated April 18, 2024
Cause and Effect Diagram Template for PowerPoint and Keynote Slide
Cause and Effect Diagram Template
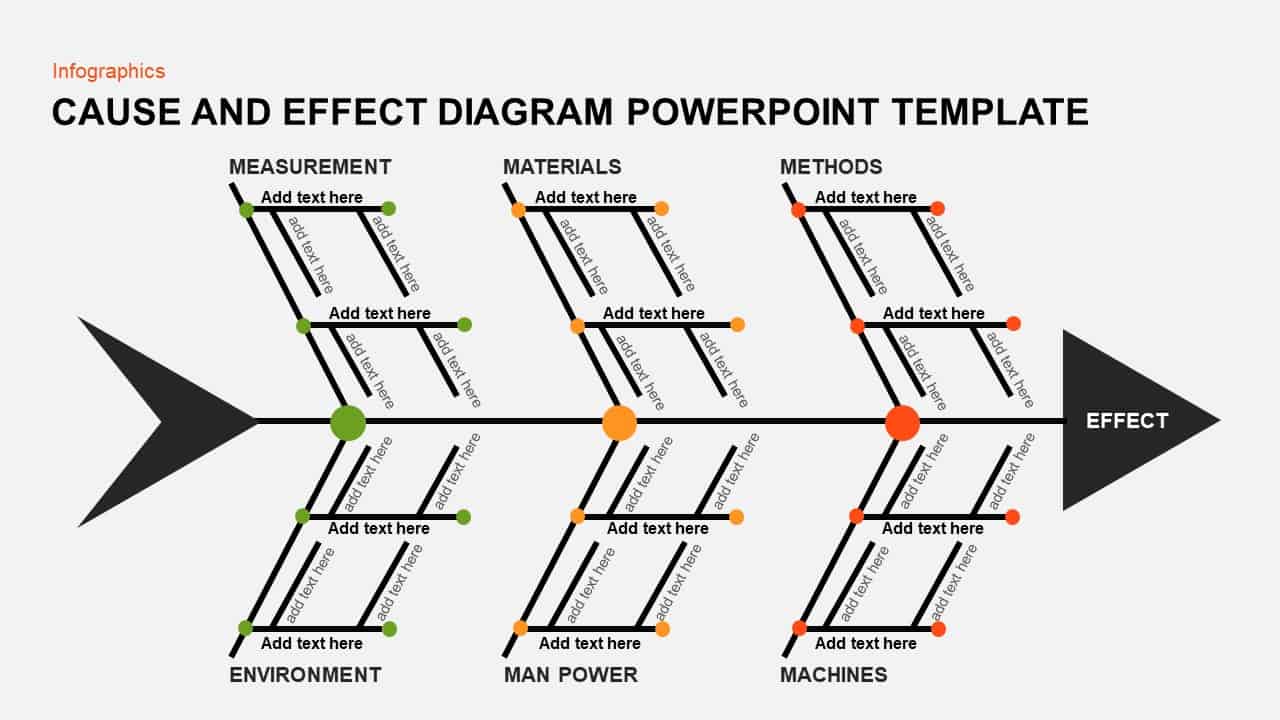
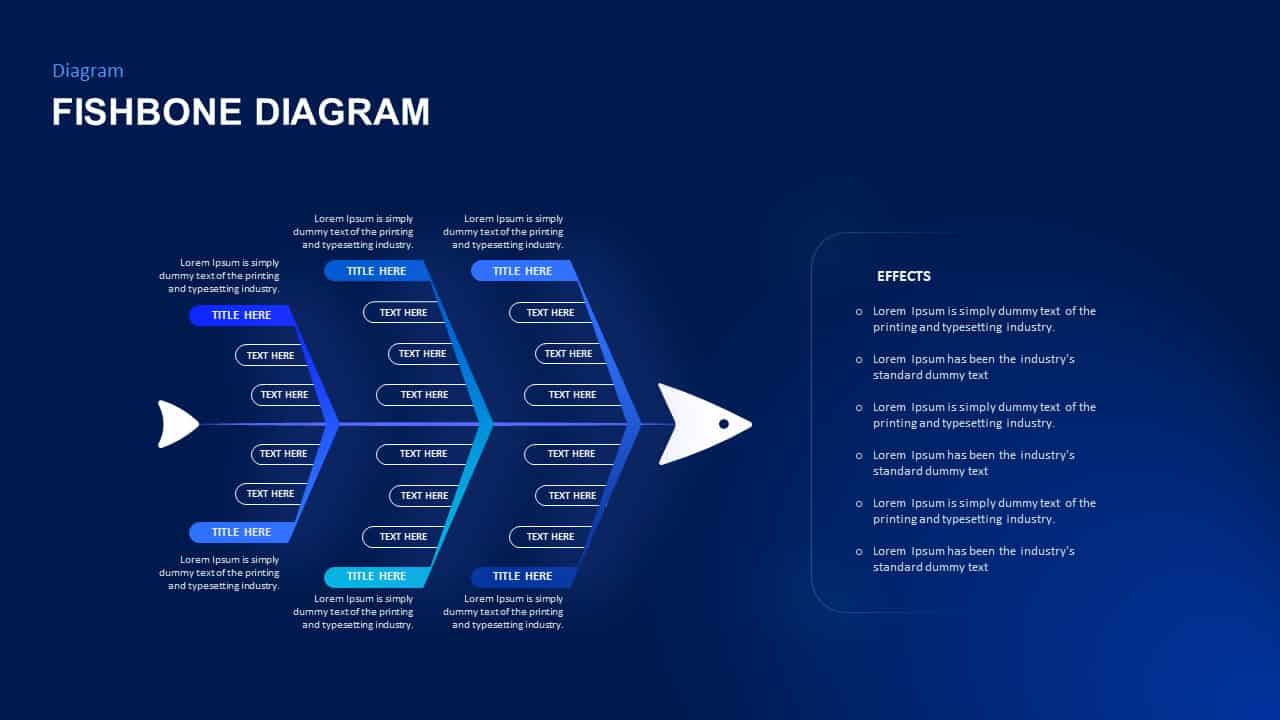
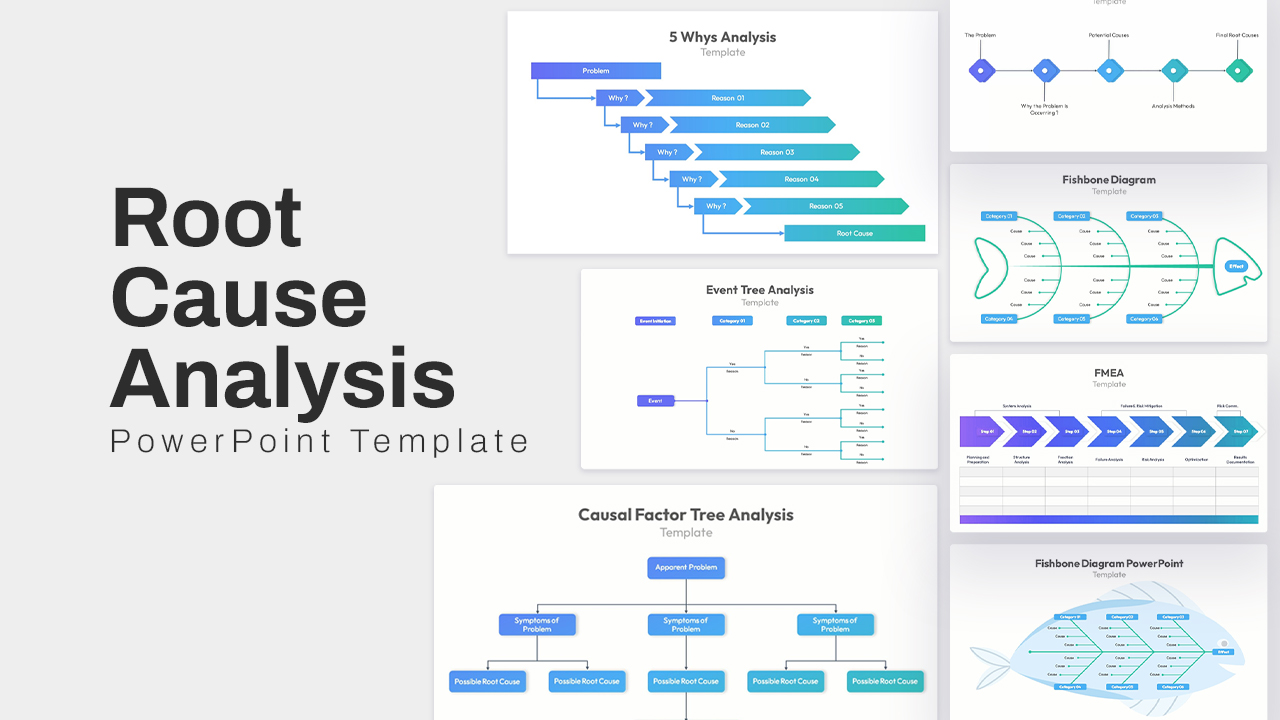
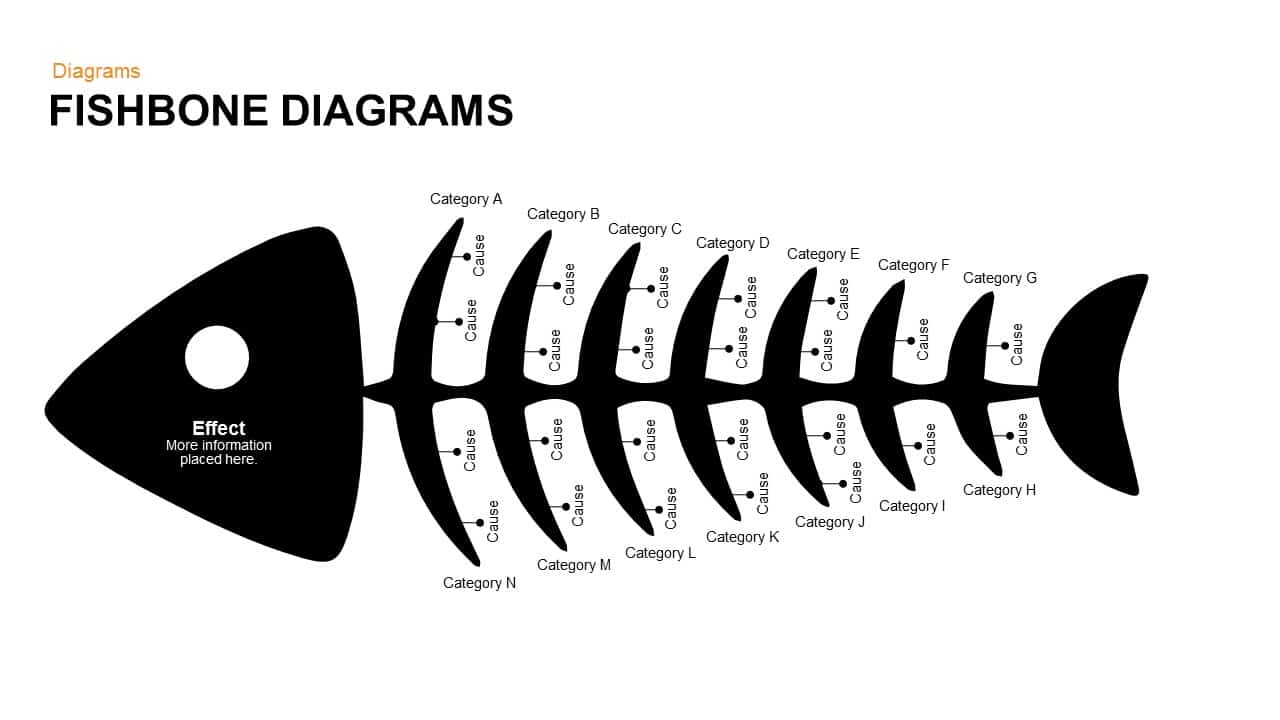
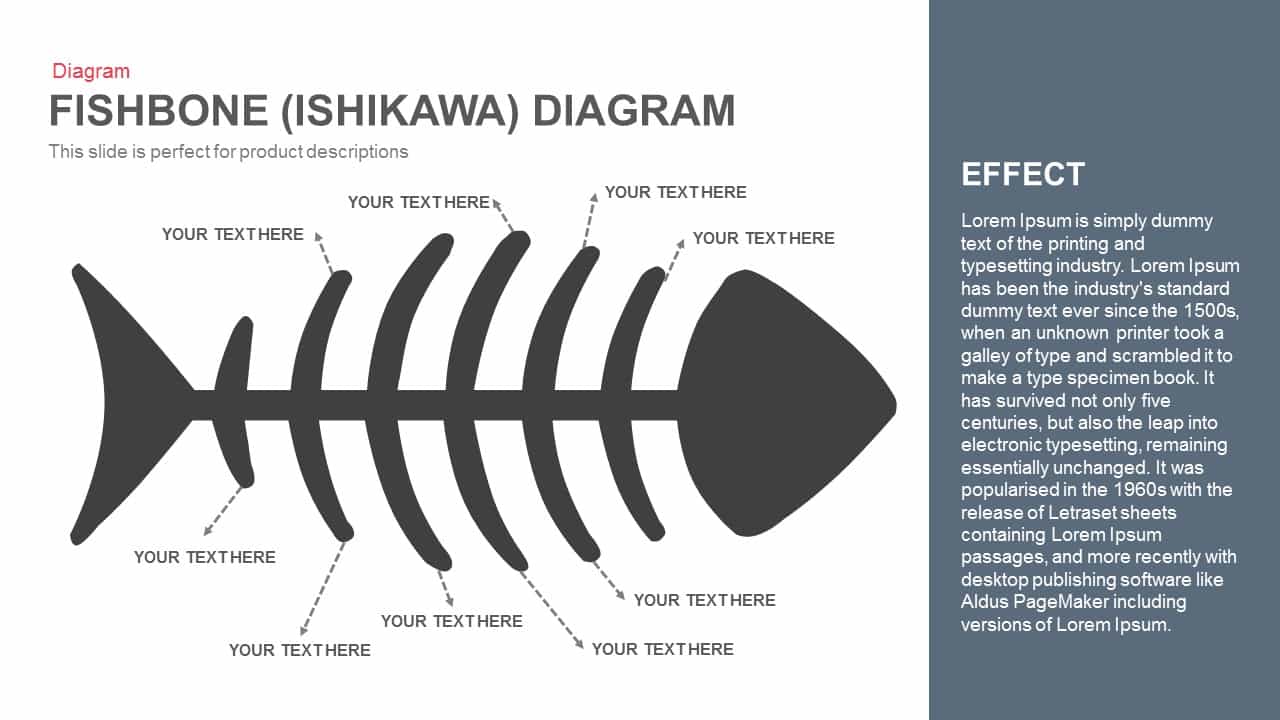
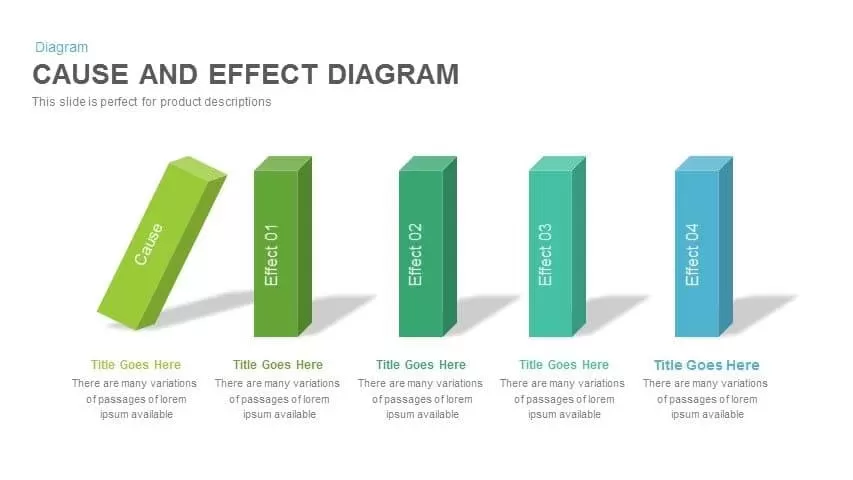
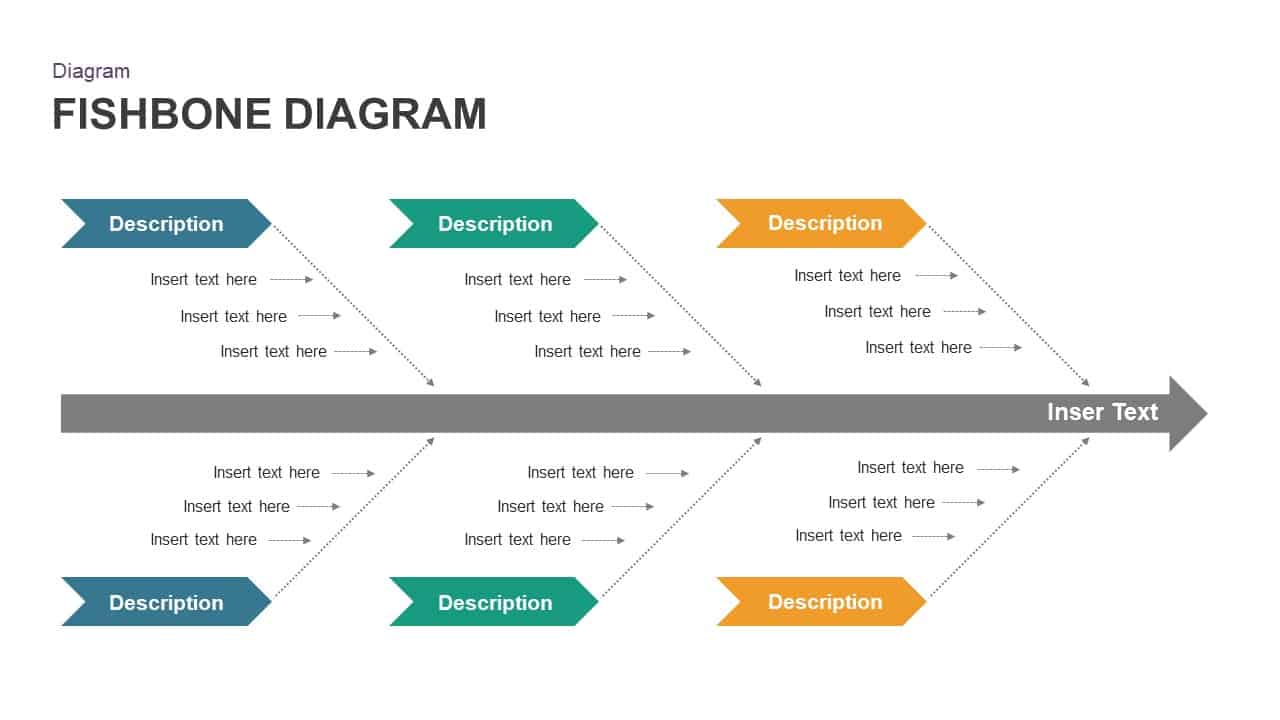
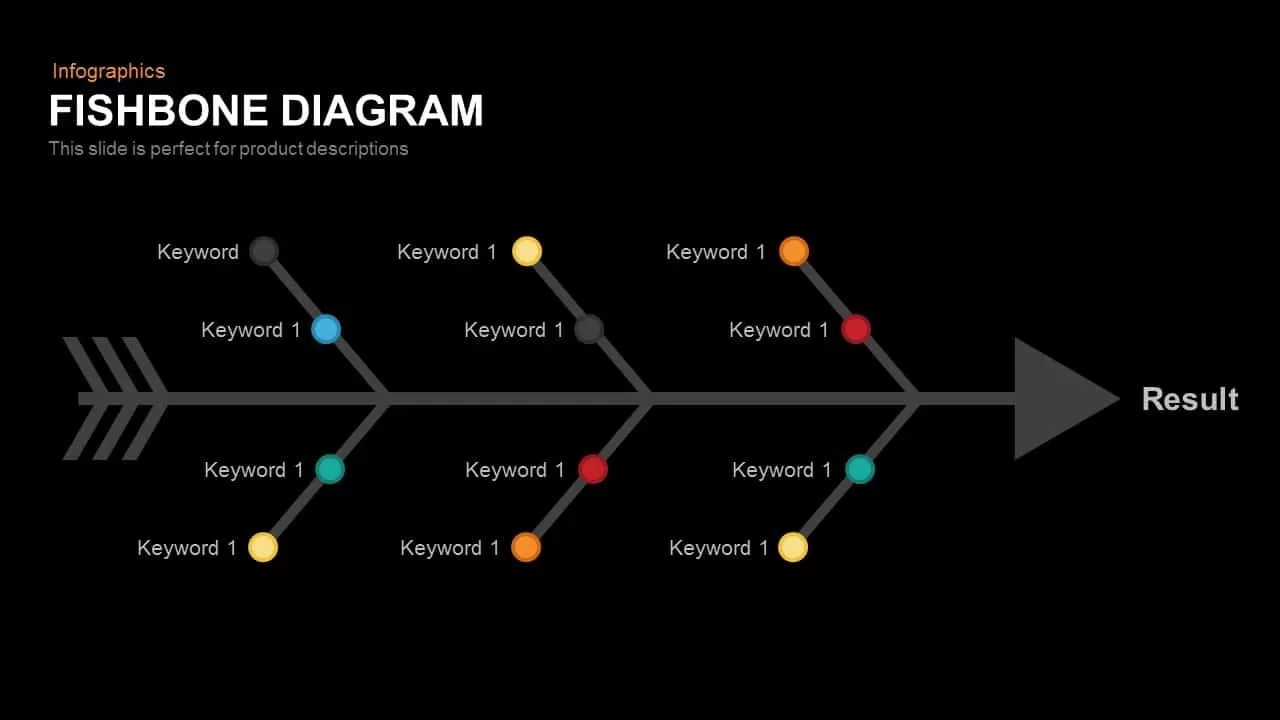
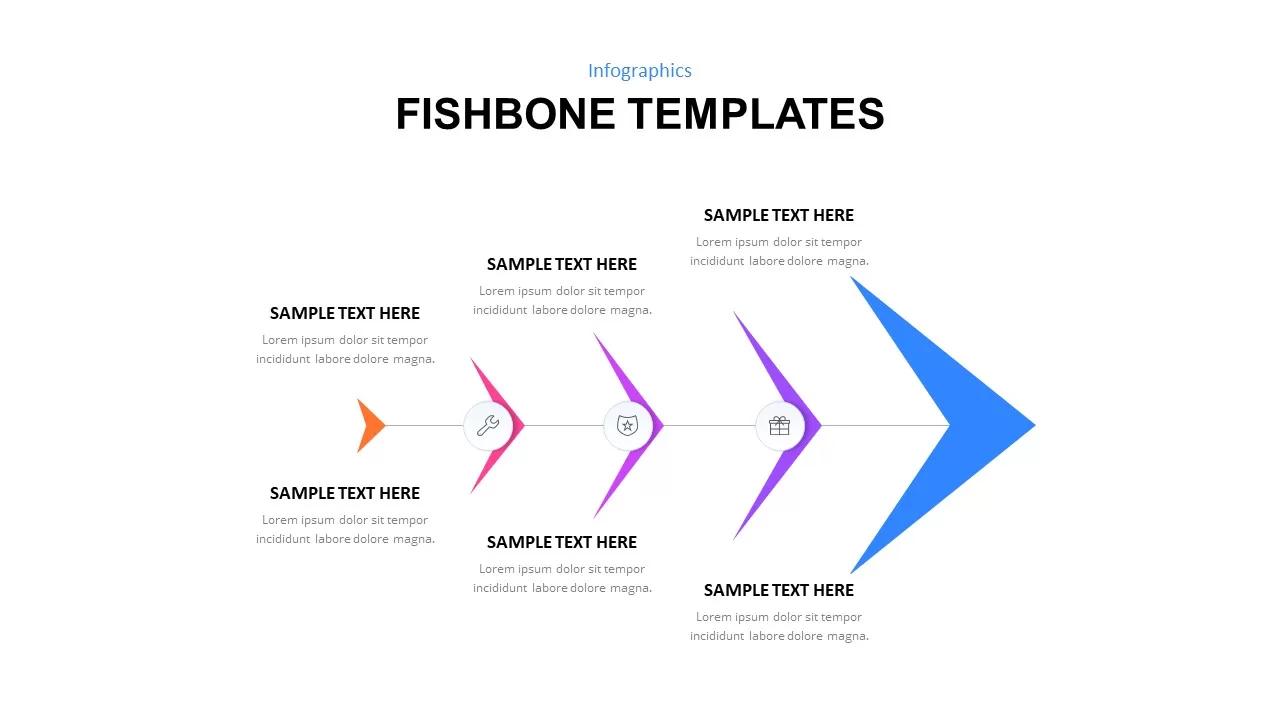
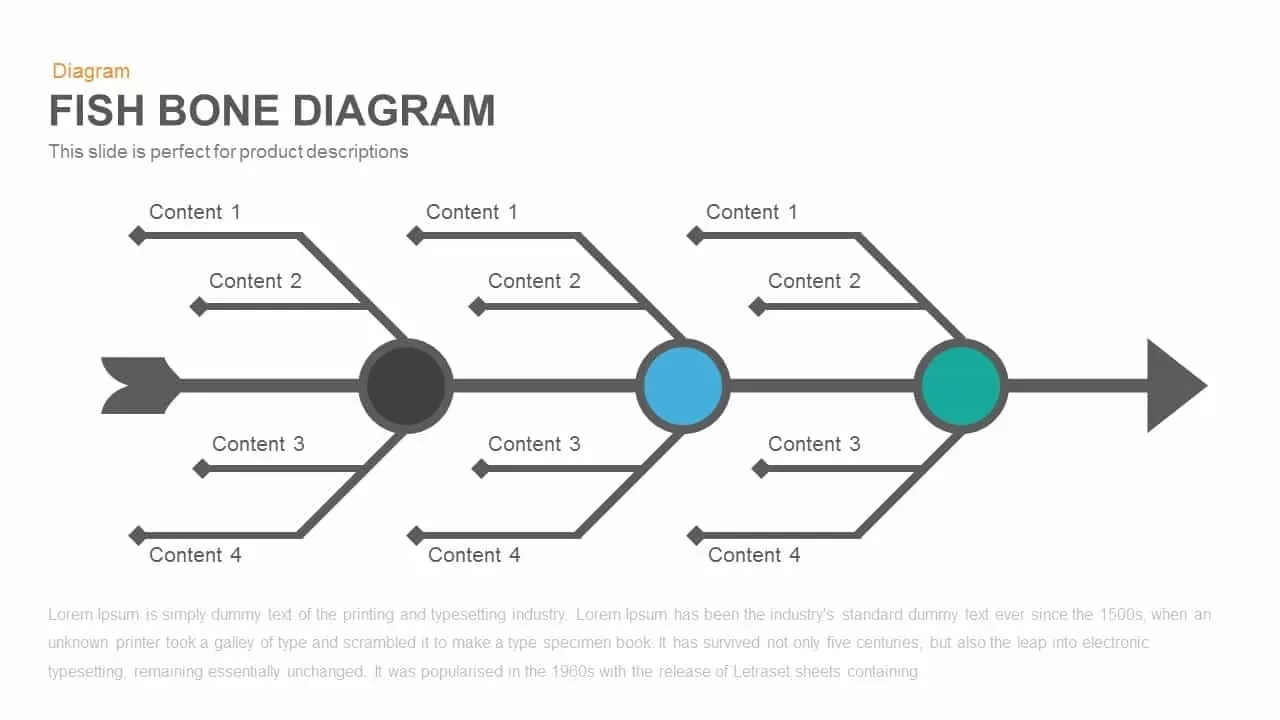
The Fishbone diagram is a methodological tool to analyze the cause-and-effect relationship. The users can apply the fishbone diagram PowerPoint template and create a scientific cause-and-effect presentation. The PowerPoint template is ideal for showing the causes and their effects on business and other natural and social phenomena. The fishbone diagram, also known as the Ishikawa diagram, Herringbone diagram, cause and effect diagram, and Nishikawa diagram. It is a visualization tool for classifying the potential causes of a problem in order to recognize its root causes. So the template is an umbrella concept that will cover each and every area of research and development. A Fishbone diagram is beneficial in brainstorming sessions to focus the discussion. After the group has brainstormed all the probable causes of a problem, the organizer helps the group rate the possible causes according to their position level and diagram a hierarchy.
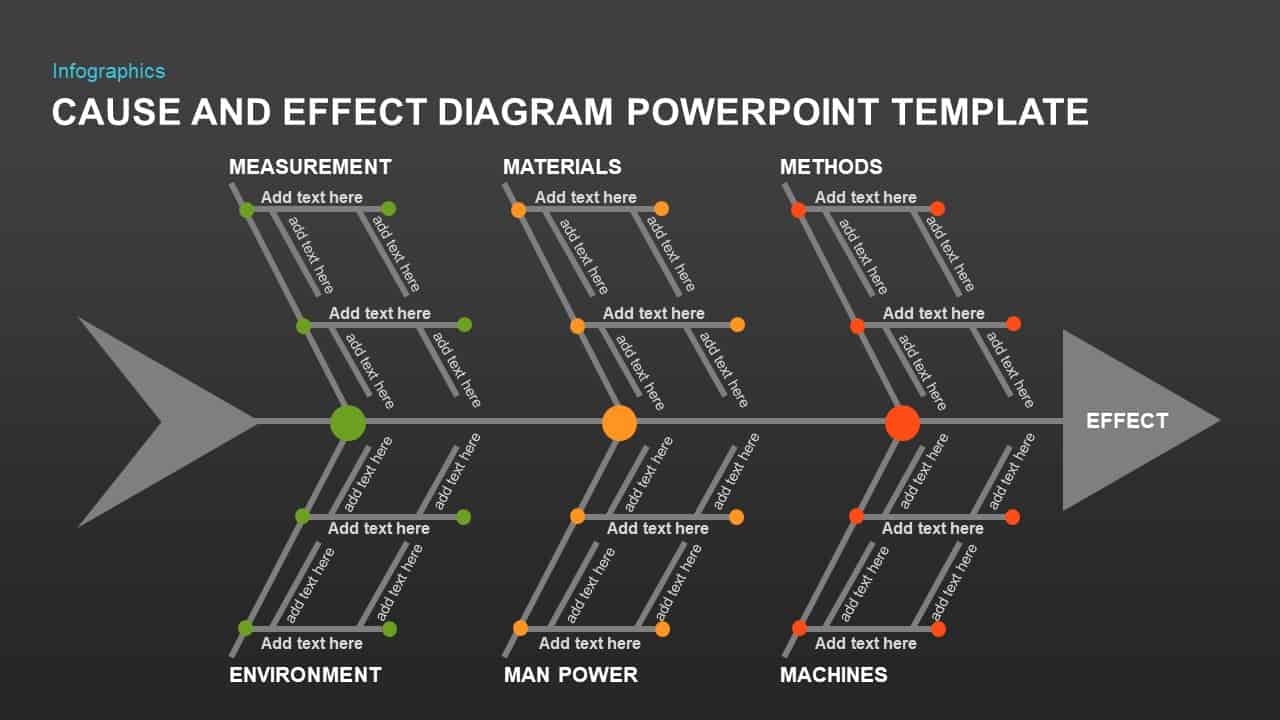
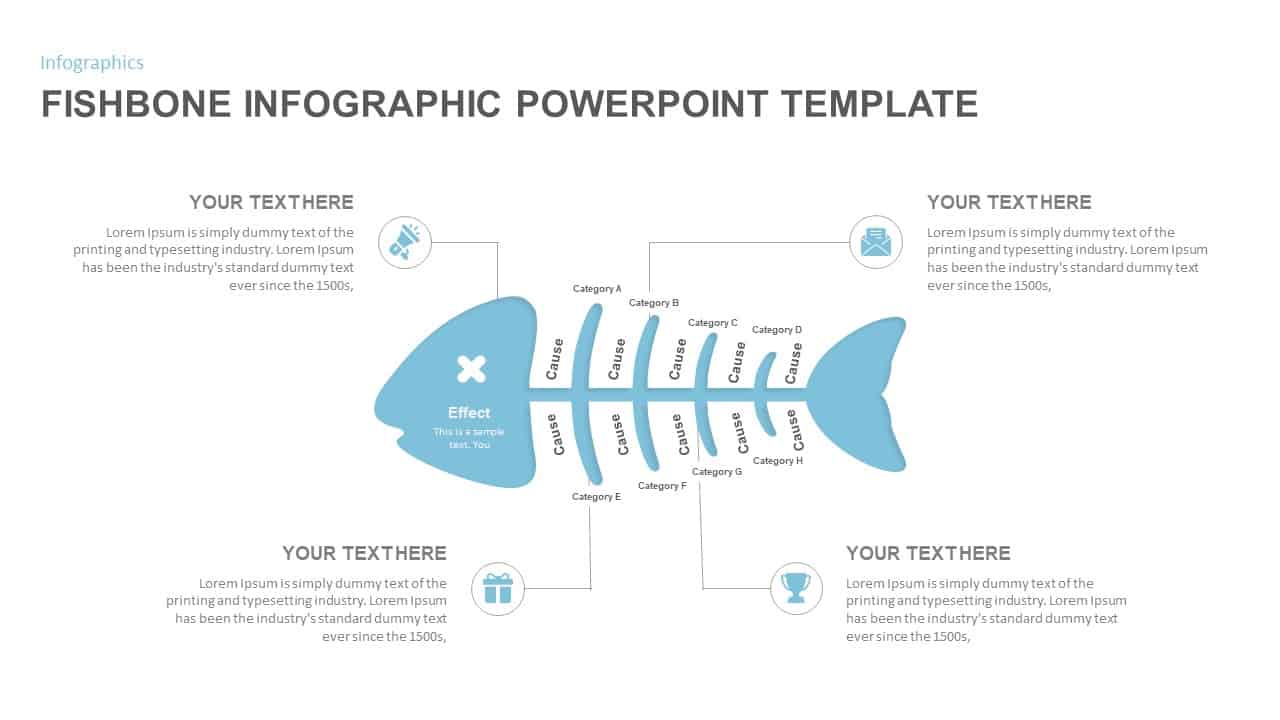
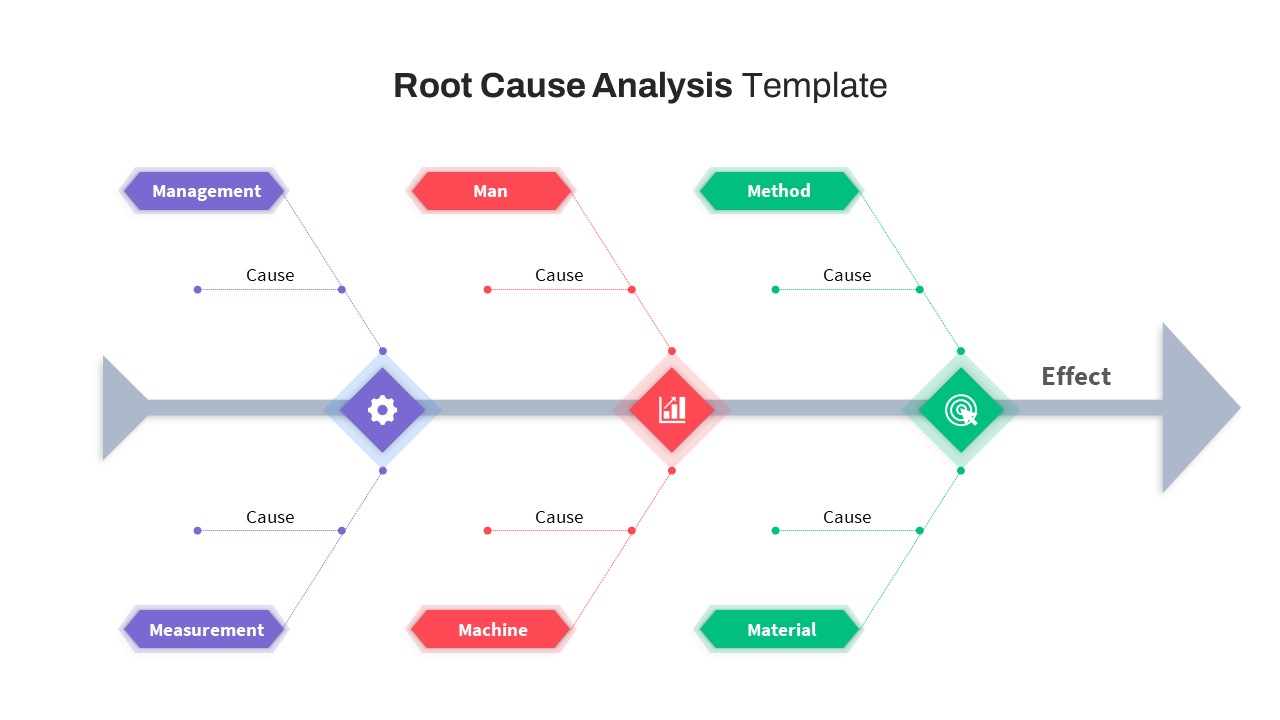
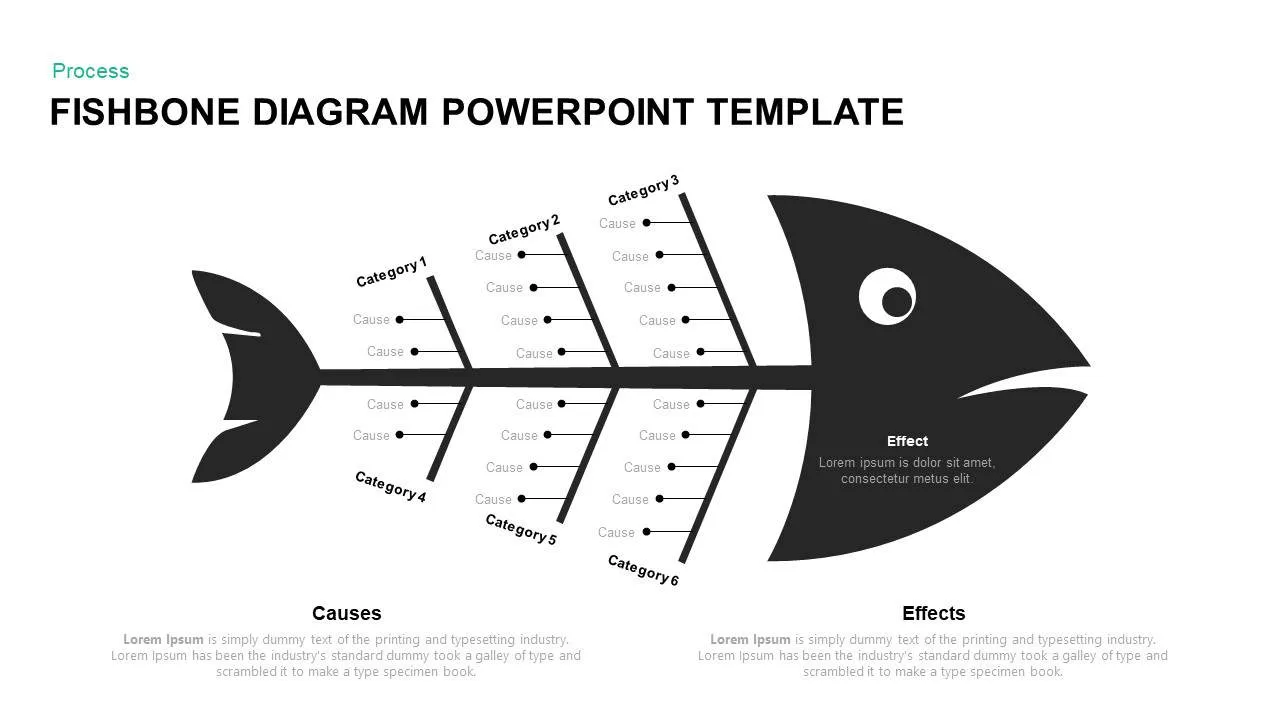
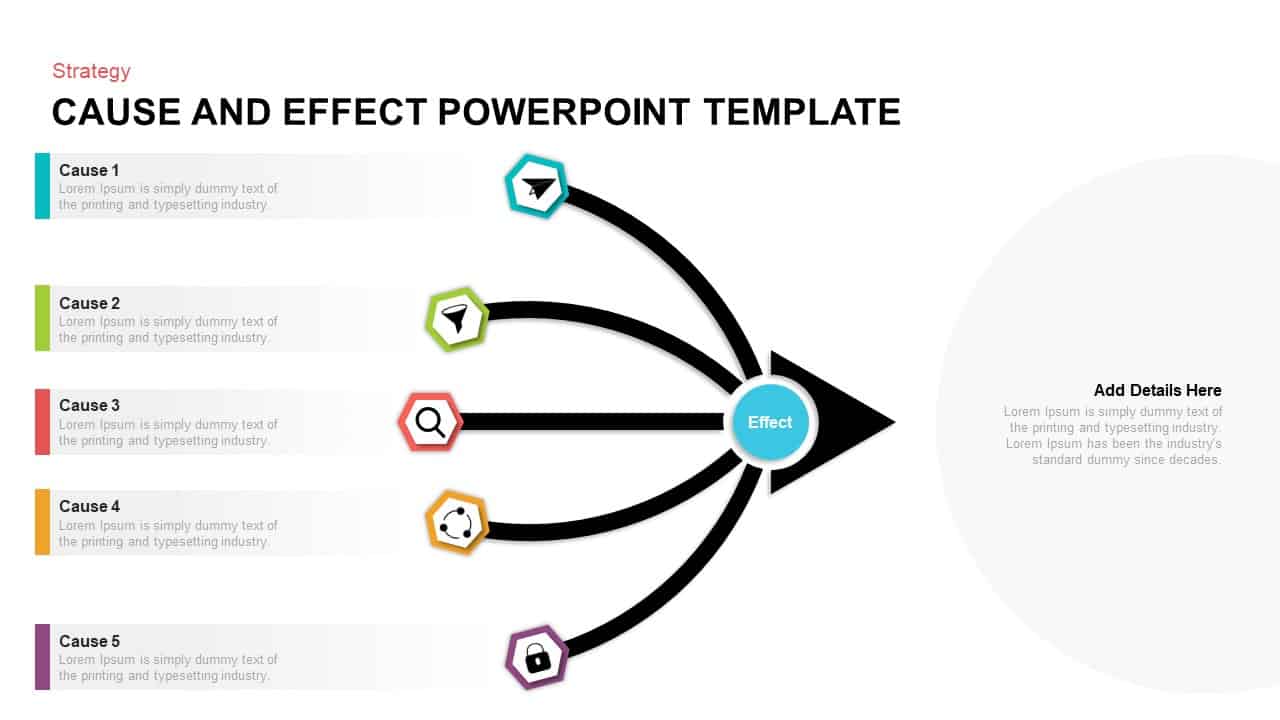
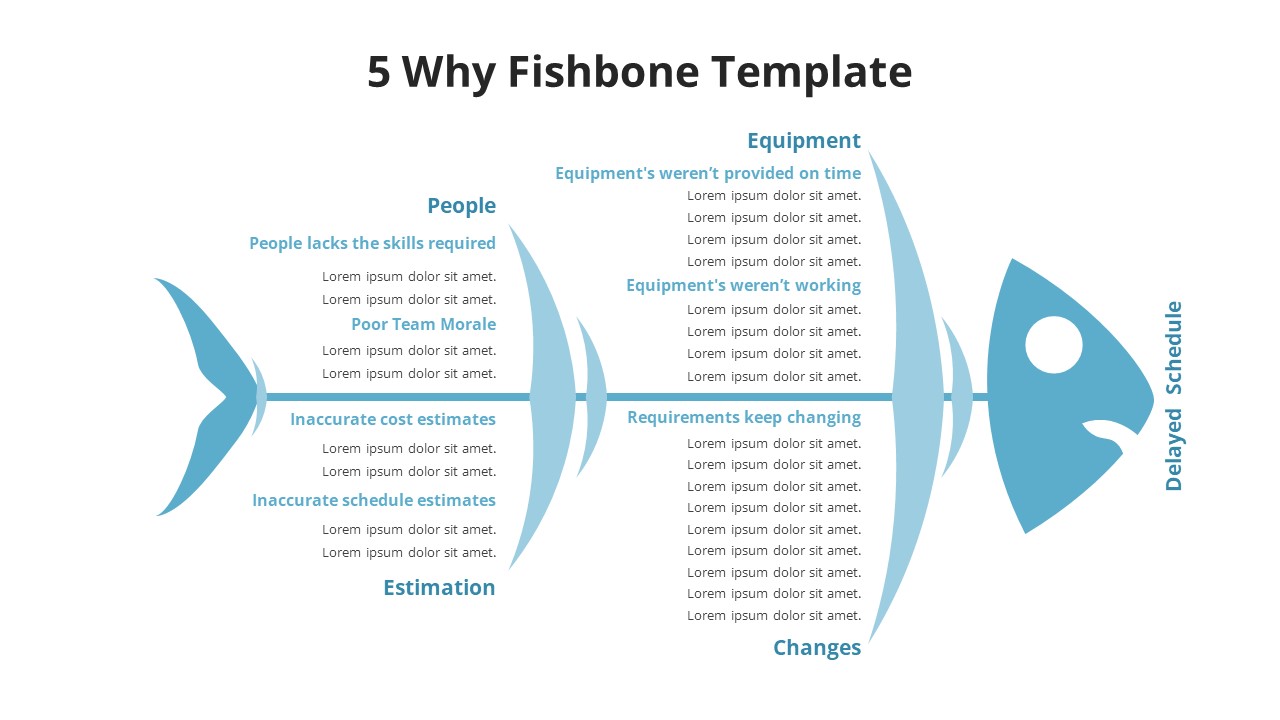
The PowerPoint's cause and effect diagram template looks like the skeleton of fish. Each bone symbolically portrays the causes, and the head is the effect. The various causes are interrelated and interdependent, which makes the effect of the problem. It will be useful to analyze the various causes behind a problem. Fishbone PowerPoint templates has a variety of uses; for instance, it can be used to analyze the phase of six sigma’s DMAIC (define, measure, analyze, improve, control) approach to problem-solving. A Fishbone diagram is a technical tool for problem analysis and solutions. Root cause analysis is a planned club process that assists in finding underlying factors or causes of an adverse event. However, the fishbone diagram can be used either way; that is, it can be used for the analysis of positive and adverse effects.
The Fishbone diagram template for PowerPoint presentation is an advantageous device for presenting deductive generalizations with solid proofs. Business and academic researchers can use this fishbone diagram to analyze social and market situations. Company managers can analyze the employees' problems and bring forth their solutions. It is useful to present the conclusions on the basis of their study. Create a professional presentation with the fishbone ppt diagram and wow your audience.
You can also check out our blog about fishbone diagram examples to know more.
Attached Files
| File |
|---|
| https://premiumdownloads.s3.amazonaws.com/SB01154-Cause and effect diagram.zip |
Login to download this file
Add to favorites
Add to collection
-

Item ID
SB01154 -

Related Templates
-
Fishbone Diagram Template
Fishbone PowerPoint Templates
Premium
-
Fishbone Diagram PowerPoint Template
Fishbone PowerPoint Templates
Premium
-
Fishbone Diagram Template for PowerPoint and Keynote Slide
Fishbone PowerPoint Templates
Premium
-
Free Root Cause Analysis PowerPoint Template
Fishbone PowerPoint Templates
Free
-
Root Cause Analysis PowerPoint Template
Arrow Diagrams
Premium
-
Fishbone Diagram PowerPoint Template and Keynote Slide
Diagrams
Premium
-
Fishbone Diagram Template PowerPoint and Keynote
Fishbone PowerPoint Templates
Premium
-
Root Cause Analysis PowerPoint Template
Business Models
Premium
-
Fishbone Diagram PowerPoint Template and Keynote Slide
Diagrams
Premium
-
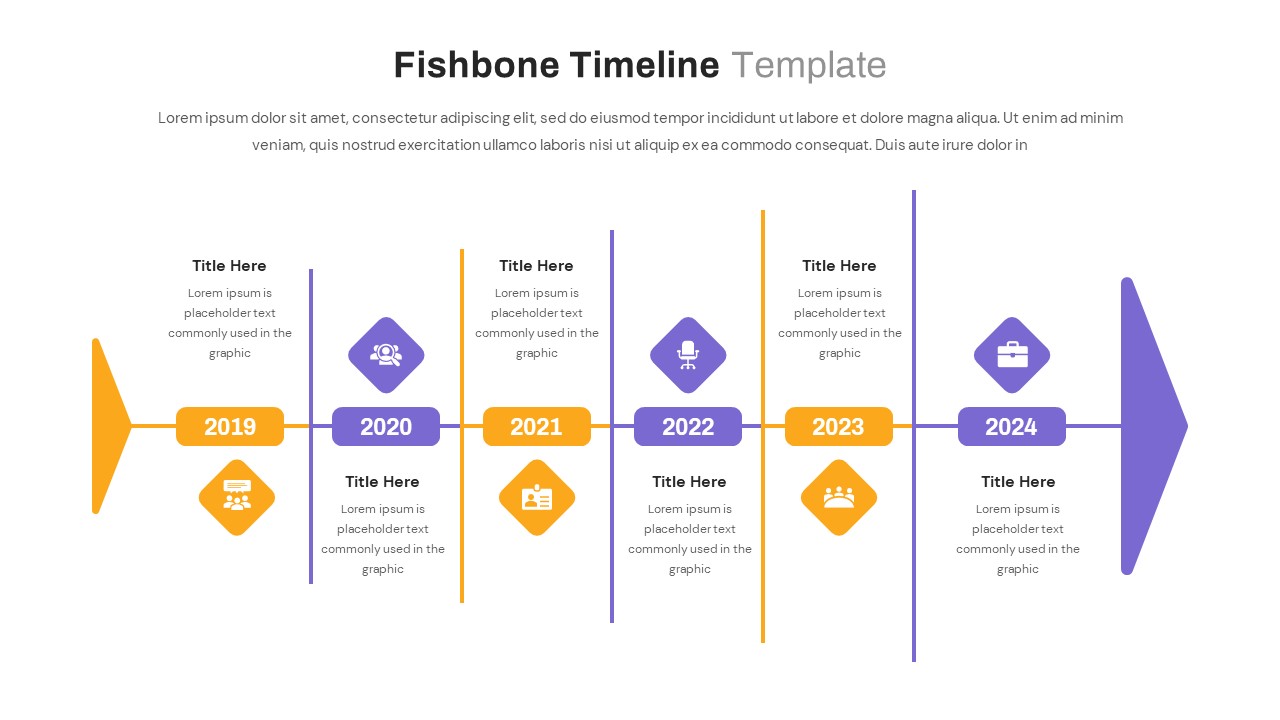
Fishbone Timeline Template
Timeline PowerPoint Template
Premium
-
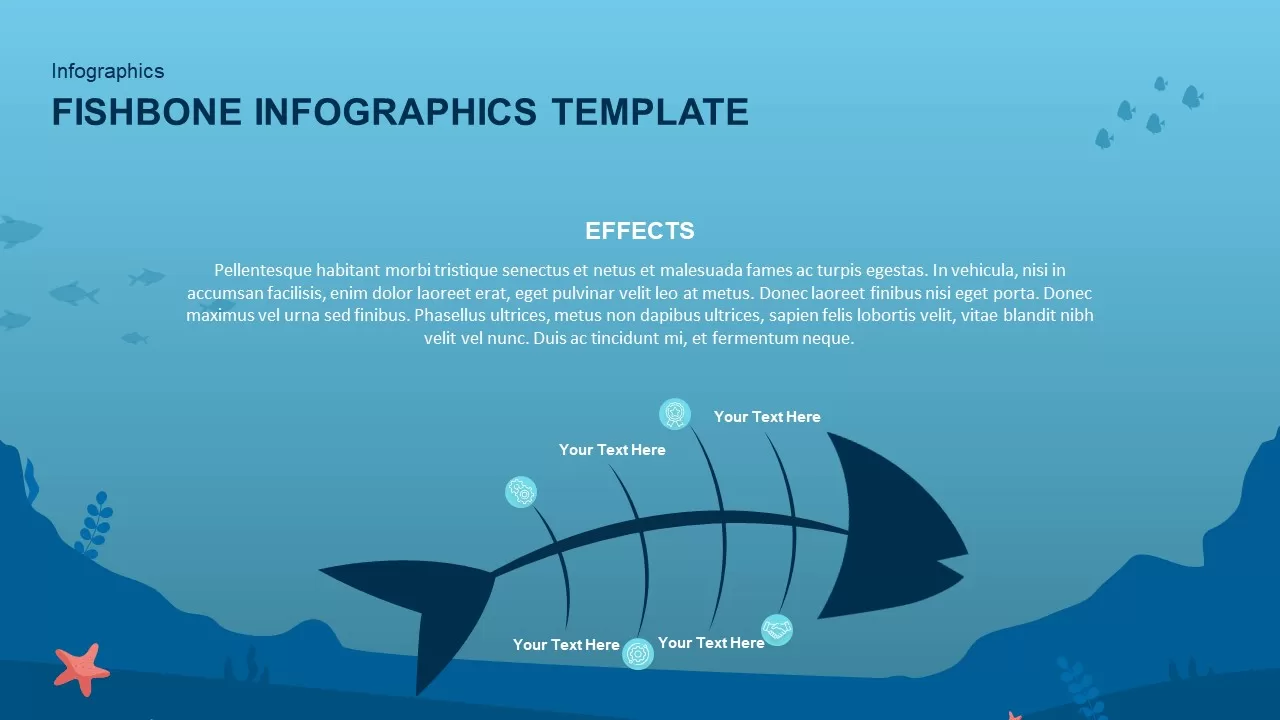
Fishbone Infographic PowerPoint Template
Fishbone PowerPoint Templates
Premium
-
Cause and Effect Template for PowerPoint & Keynote
Fishbone PowerPoint Templates
Premium
-
Cause and Effect Diagram PowerPoint Template and Keynote Slide
Business Models
Premium
-
Free Fishbone Diagram Template PowerPoint
Fishbone PowerPoint Templates
Free
-

Root Cause Analysis PowerPoint Presentation Template
Tree Diagrams
Premium
-
5 Why Fishbone PowerPoint Template
Fishbone PowerPoint Templates
Premium
-
Fishbone Powerpoint Template Keynote Diagram
Fishbone PowerPoint Templates
Premium
-
Fishbone Template for PowerPoint Presentation
Fishbone PowerPoint Templates
Premium
-
Fishbone Diagram PPT Template and Keynote Slide
Diagrams
Premium
-
Social Work PowerPoint Template Free
PowerPoint Templates
Free
-
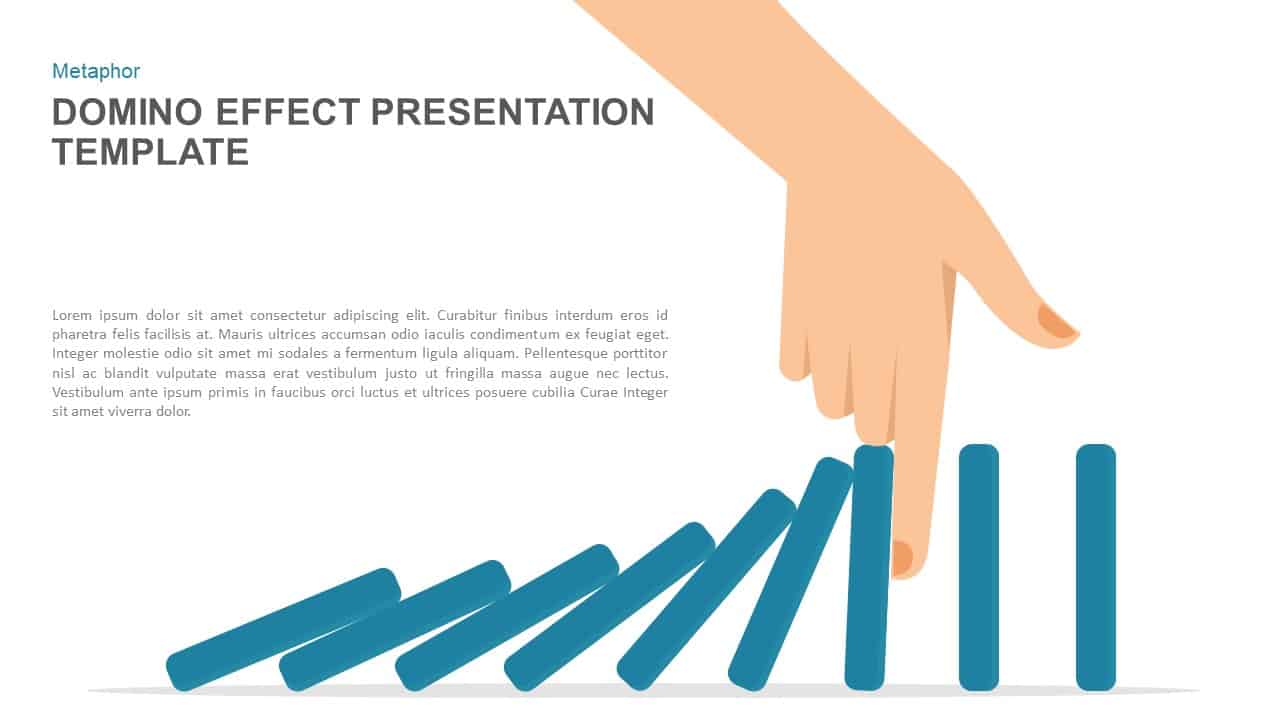
Domino Effect Presentation Template for PowerPoint and Keynote
Metaphor, Simile & Analogy
Premium
-
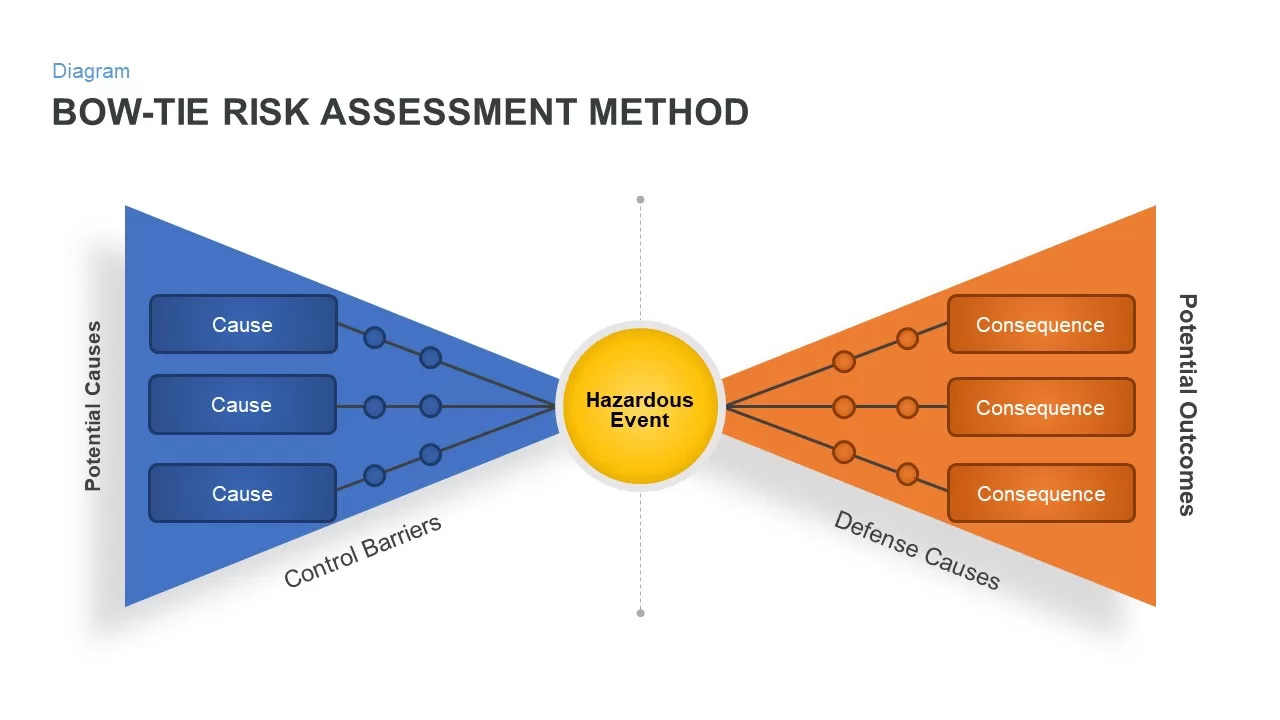
Bow Tie PowerPoint Template
Business Models
Premium
-
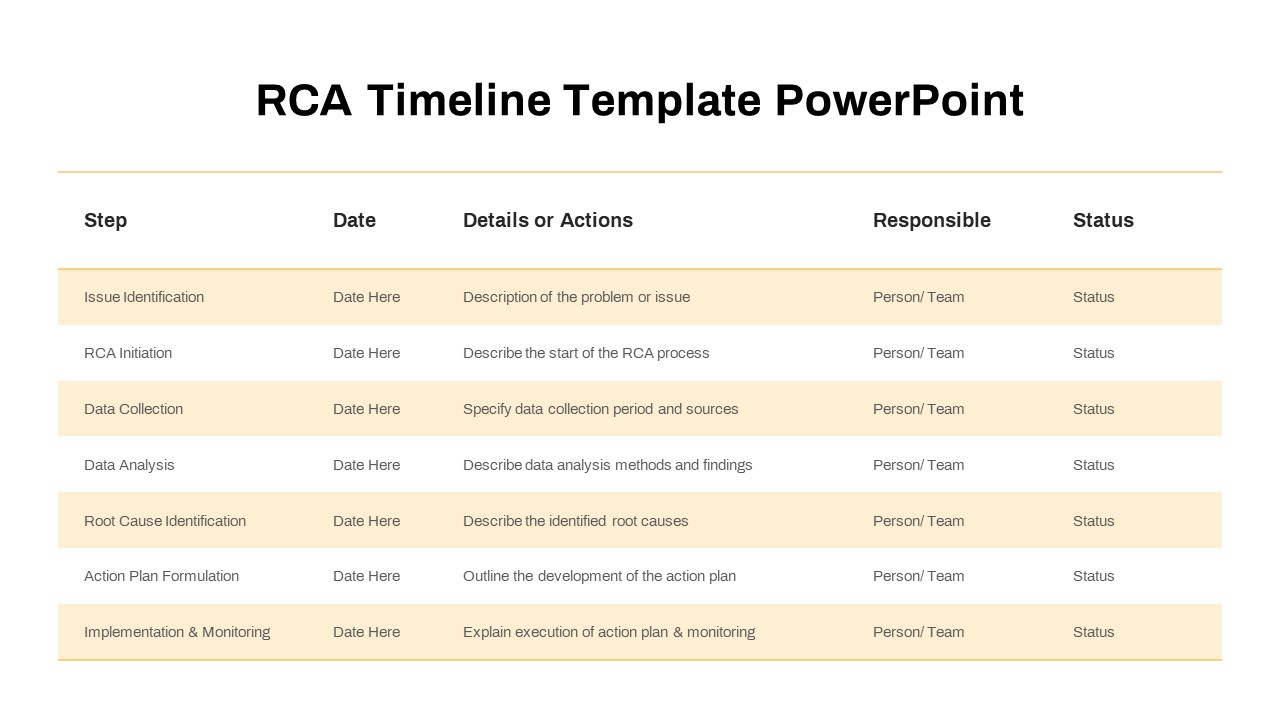
RCA Timeline Template for PowerPoint
Timeline PowerPoint Template
Premium
-
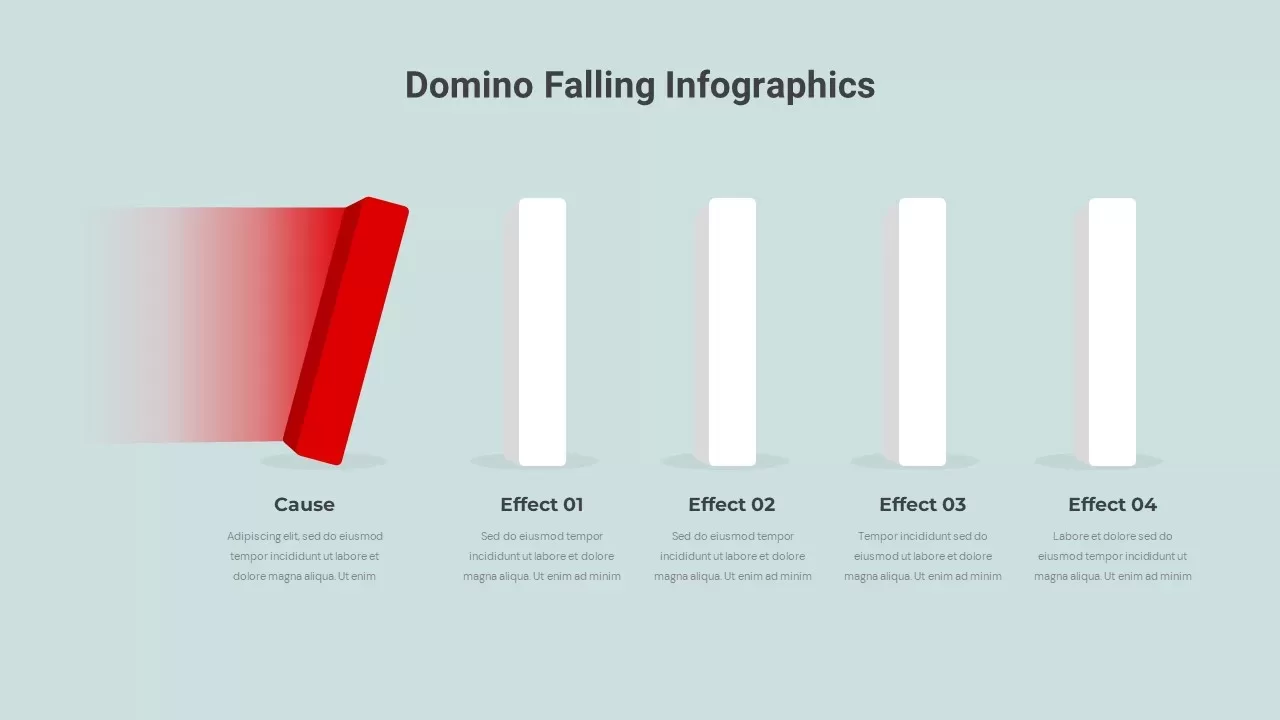
Domino Falling Infographics
PowerPoint Templates
Premium
-
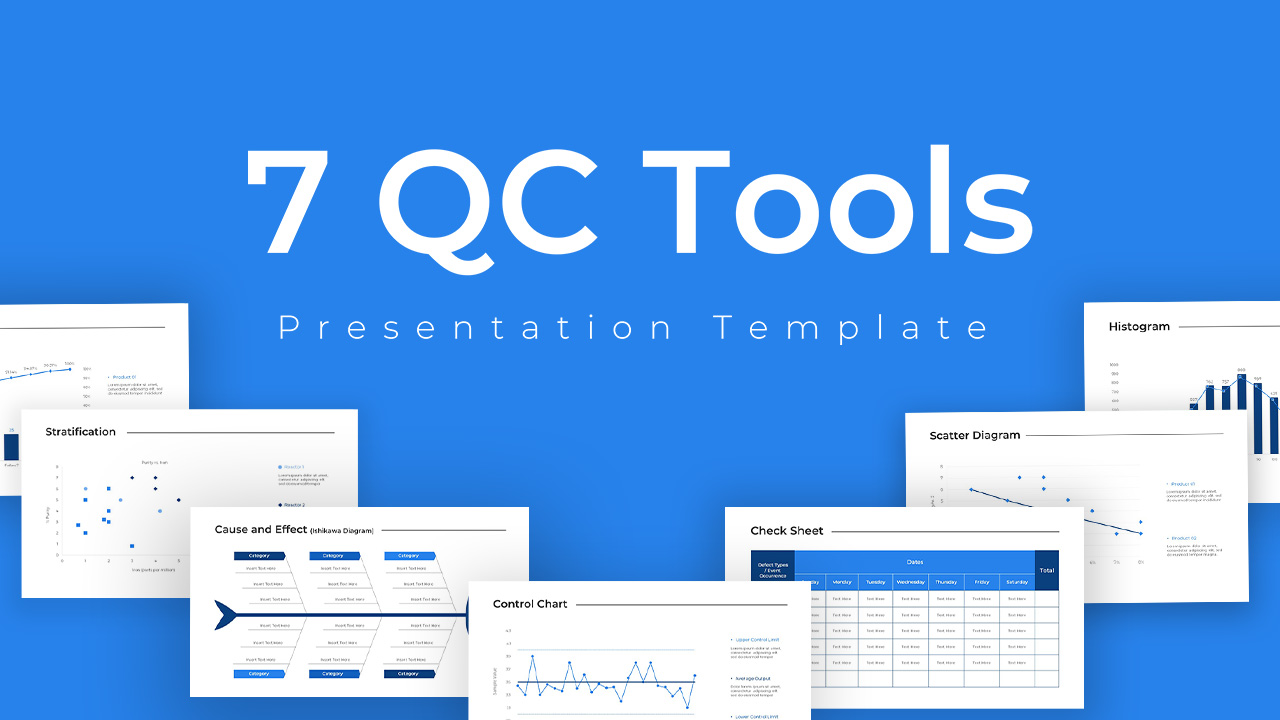
QC Tools PowerPoint Template
Infographic
Premium
-
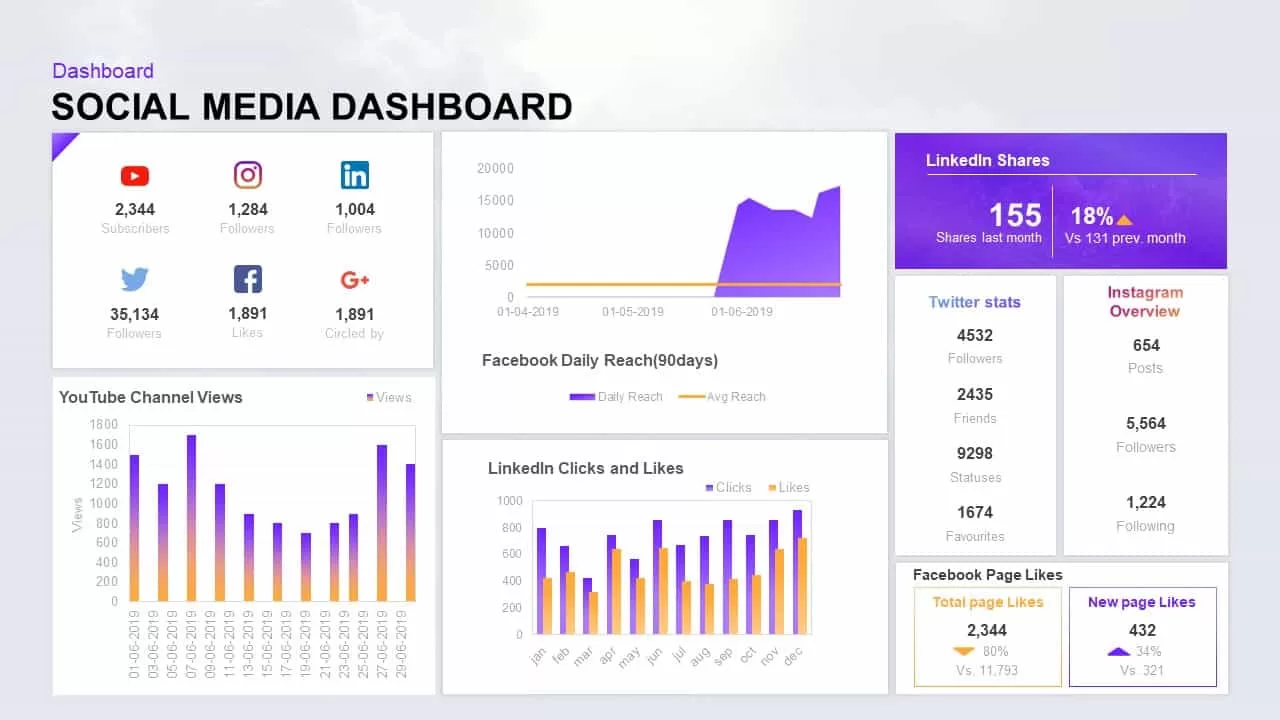
Social Media Dashboard Template for PowerPoint Presentation
Social Media
Premium
-
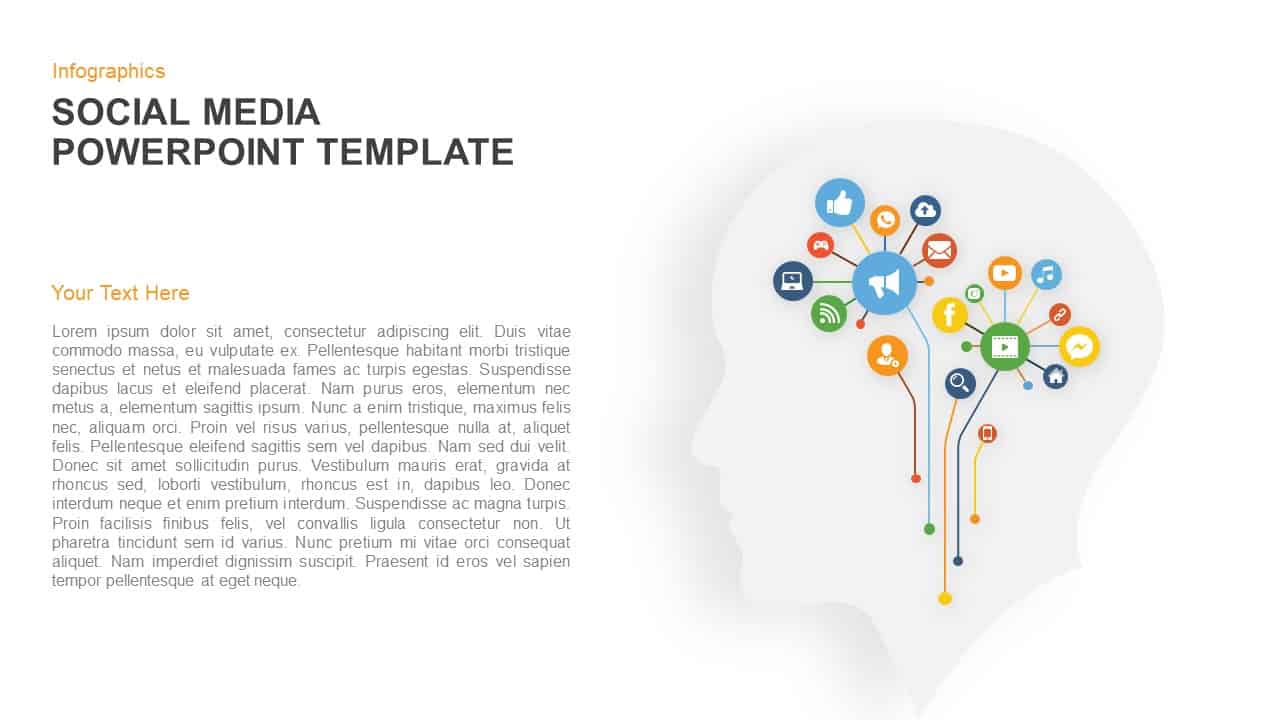
Infographics Social Media PowerPoint Template and Keynote Slide
Diagrams
Premium
-
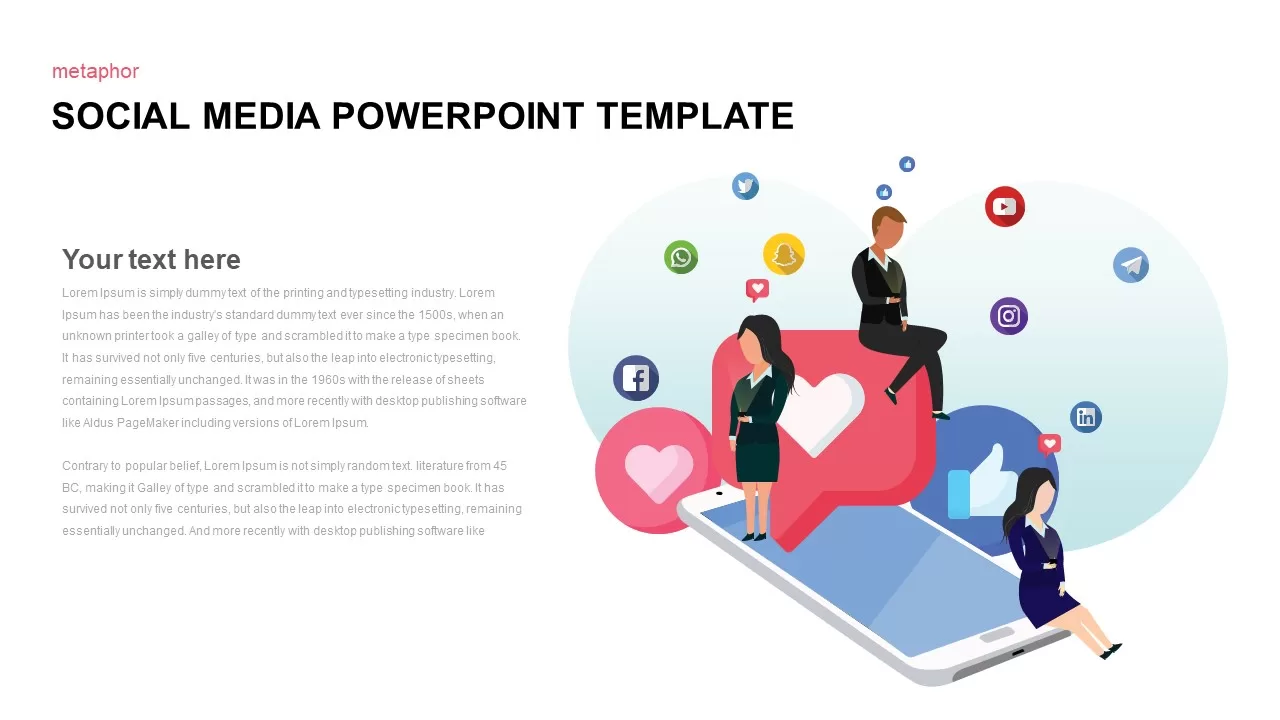
Social Media Template for PowerPoint Presentation
Social Media
Premium
-

Social Media Marketing Tool PowerPoint Template
Social Media
Premium
-
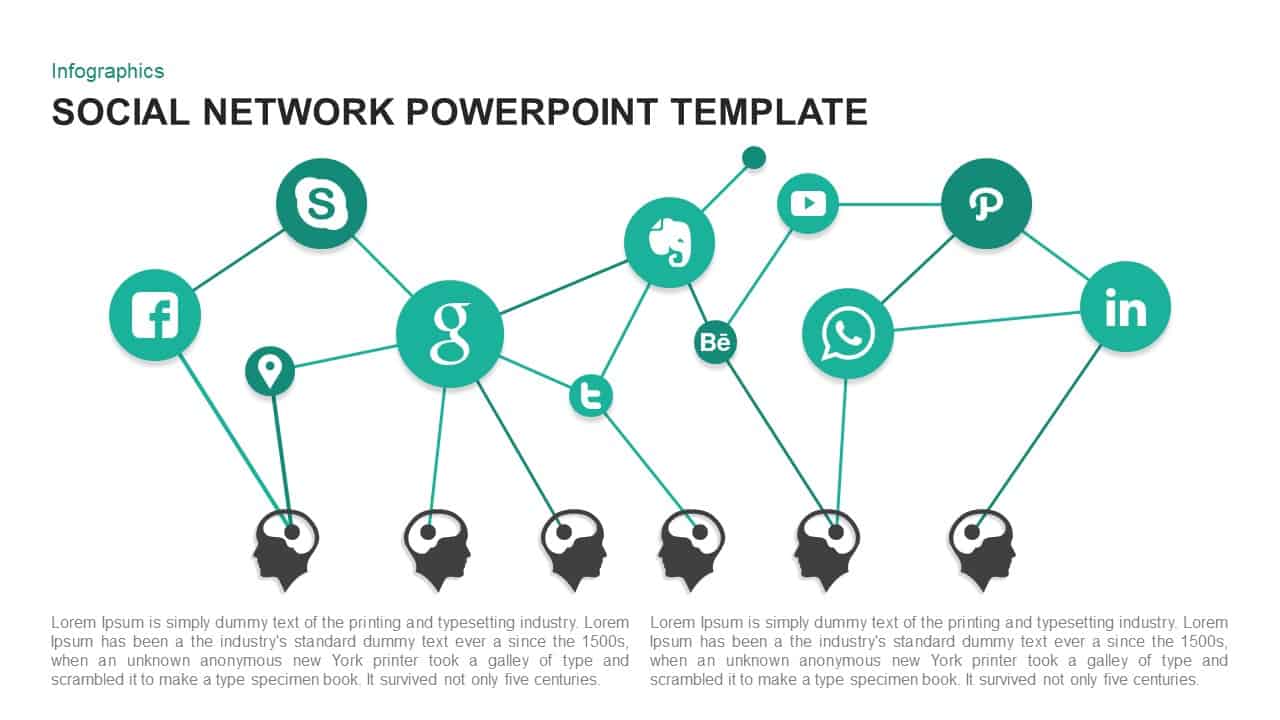
Social Network Template for PowerPoint and Keynote
Social Media
Premium
-
Social Media Icons PowerPoint Template and Keynote Slide
Social Media
Premium
-

Social Media Template for PowerPoint & Keynote
Social Media
Premium
-
Social Media Icons for PowerPoint Infographics Presentation
Infographic
Premium
-
Cynefin Framework PowerPoint Templates and Keynote Slide
Business Models
Premium
-
Free Social Media Analytics Map Presentation PowerPoint Template
Free PowerPoint Templates
Free
-

Social Media Report PowerPoint Template
PowerPoint Templates
Premium
-
Mobile with Social Media Icons PowerPoint Template and Keynote Slide
Keynote Templates
Premium
-
Social Network PowerPoint Template and Keynote Slide
Business Models
Premium
-
Social Media Free PowerPoint Template
Social Media
Free
-
Snowball Effect PowerPoint Template
PowerPoint Templates
Premium
-
Social Media Timeline Template
PowerPoint Templates
Premium
-
6 M Analysis Template for PowerPoint and Keynote
Circular Diagrams
Premium
-
Gap Analysis Strategic Planning PowerPoint Template
Business Models
Premium
-
Social Media Analysis Slides
Social Media
Premium
-
Social Media Marketing Agency Presentation Template
PowerPoint Business Templates
Premium
-
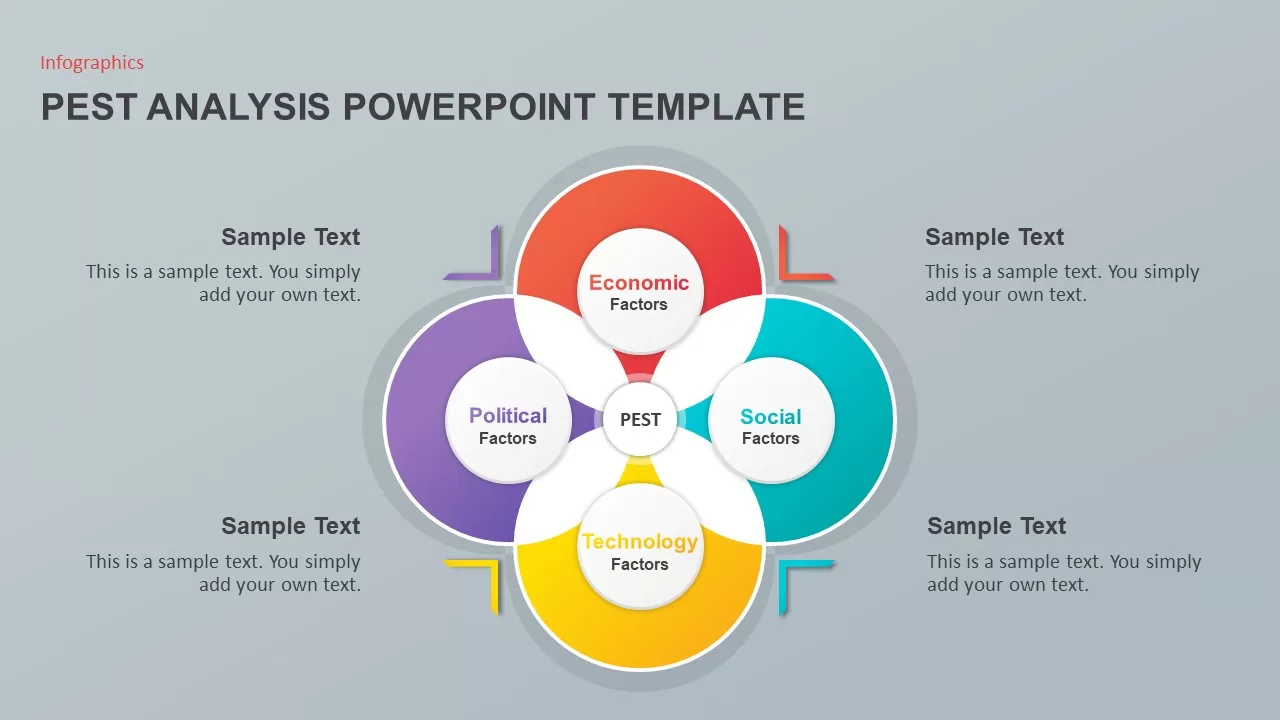
Pest Analysis PowerPoint Template
Diagrams
Premium
-
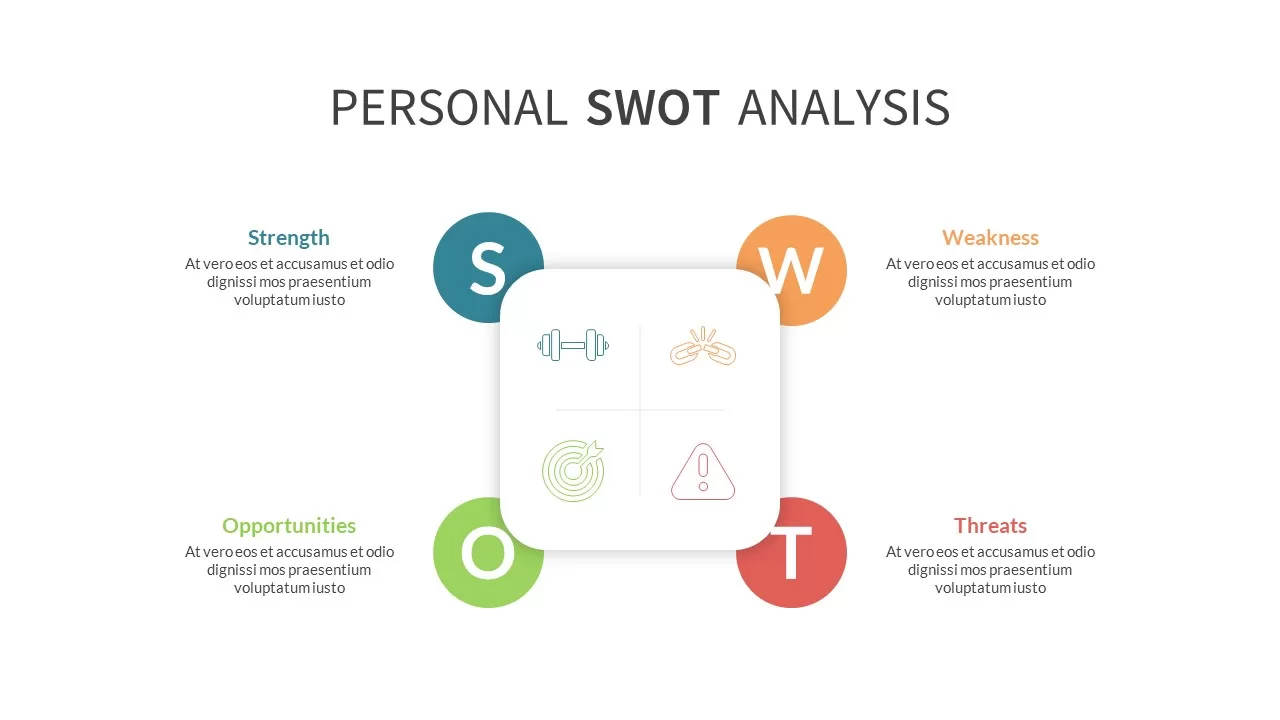
Personal SWOT Analysis PPT
professional
Premium
-
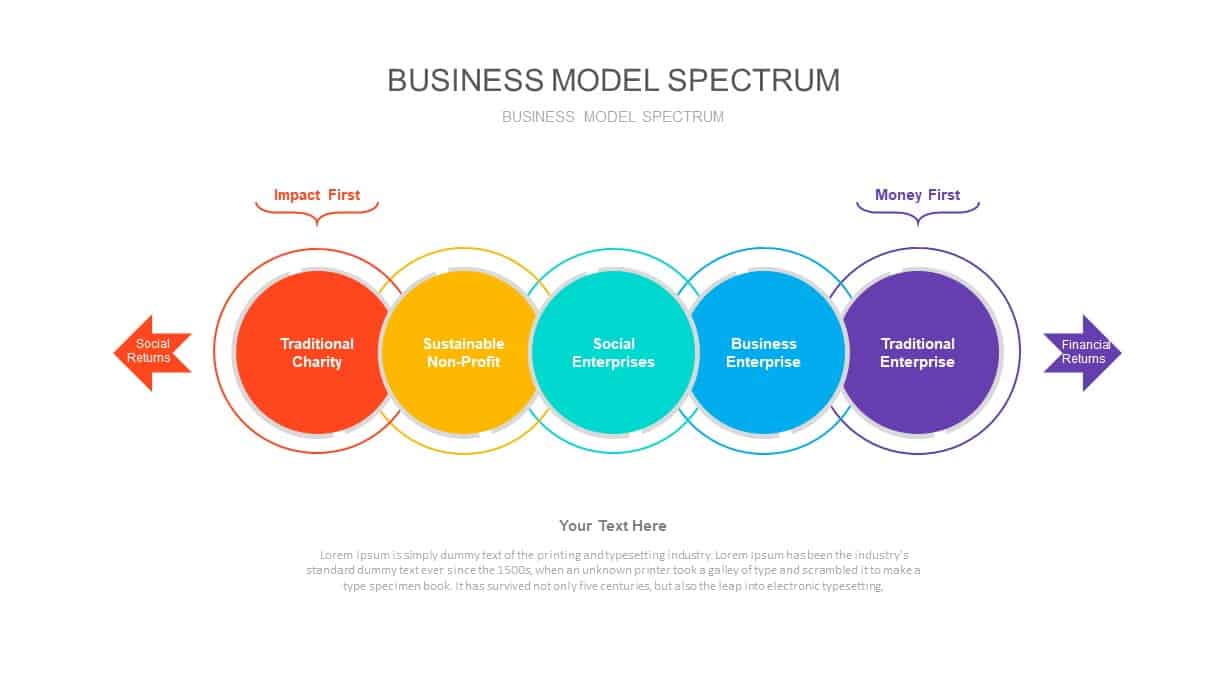
Business Model Spectrum PowerPoint Diagram
Business Models
Premium
-
Internet Marketing Megaphone With Social Media Icons
Social Media
Premium
-
4 Staged PowerPoint Puzzle Diagram Template and Keynote Slide
Puzzle
Premium
-
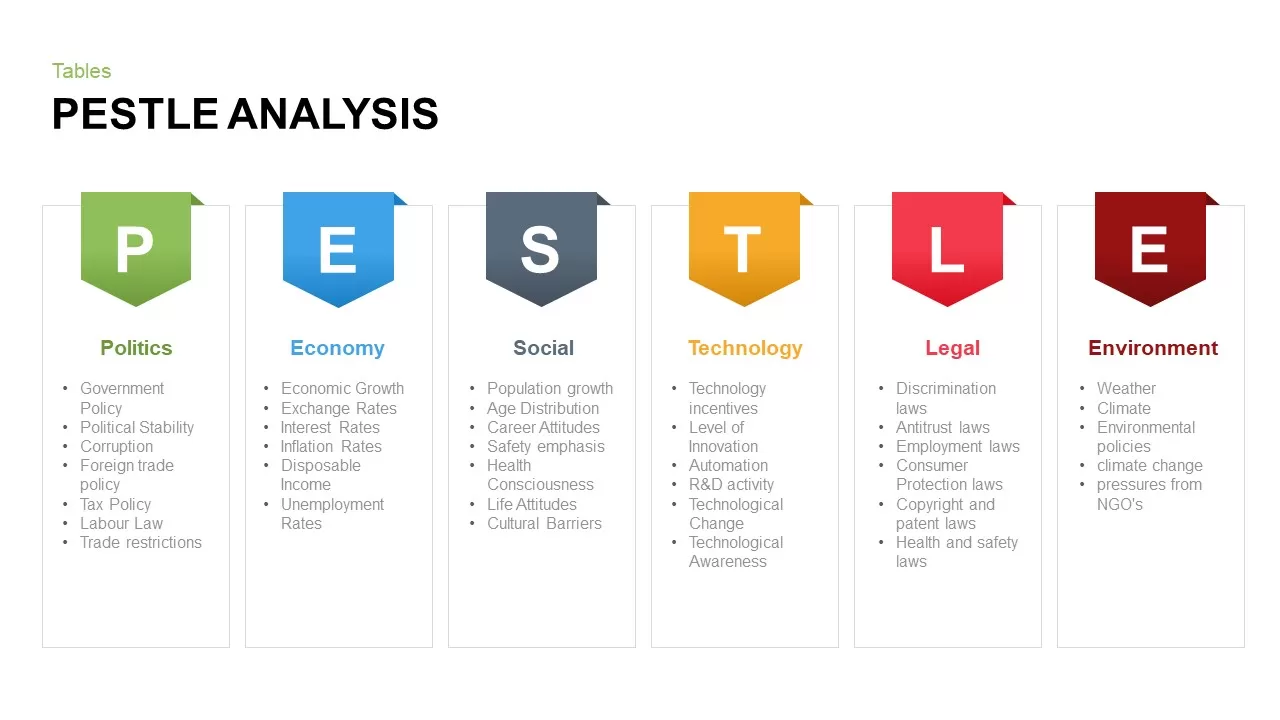
Pestle Analysis PowerPoint Template and Keynote
Diagrams
Premium
-
Challenges and Solutions Template for PowerPoint & Keynote
Business Models
Premium
-

Requirements Analysis Ppt Template
Business Models
Premium
-
Social Media PowerPoint Template
Social Media
Premium
-
Kaizen PowerPoint Template Bundle
Business Models
Premium
-
PEST Analysis PowerPoint Template and Keynote Slide
Business Models
Premium
-
Social Media Facebook Visitors Chart PowerPoint and Keynote Slide
PowerPoint Charts
Premium
-
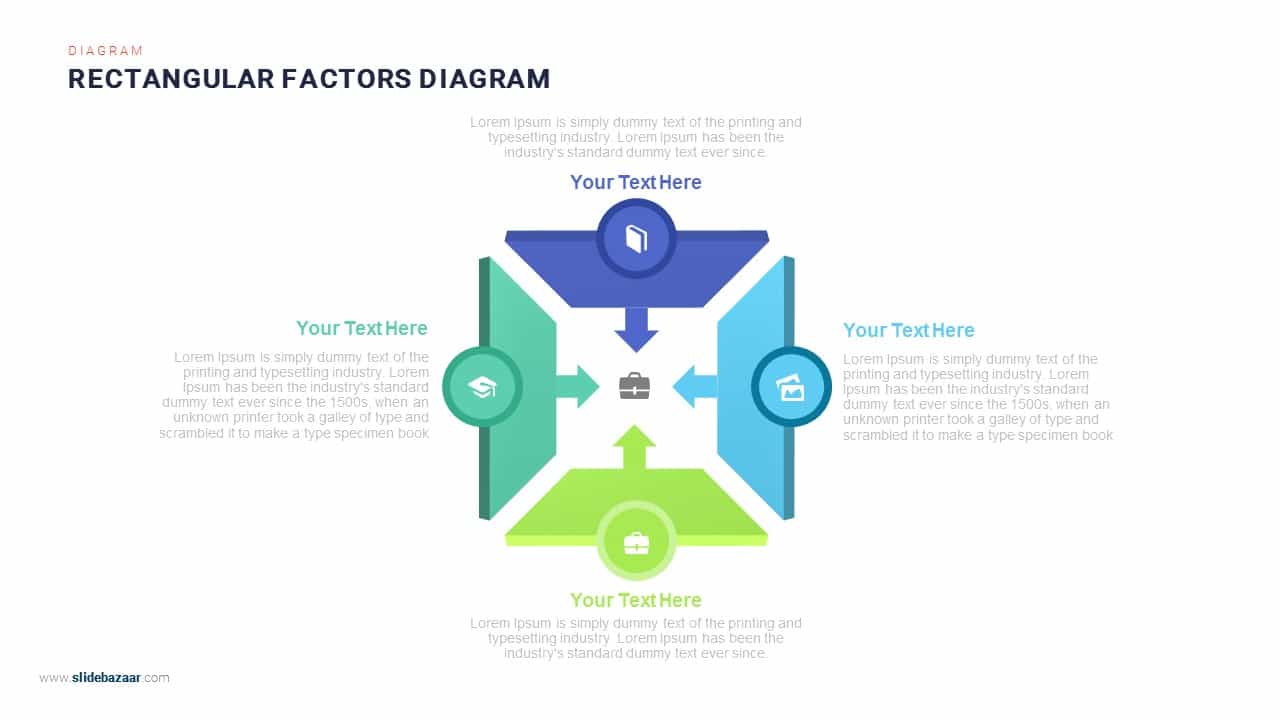
Rectangular Contributing Factors PowerPoint Diagram and Keynote Template
Infographic
Premium
-
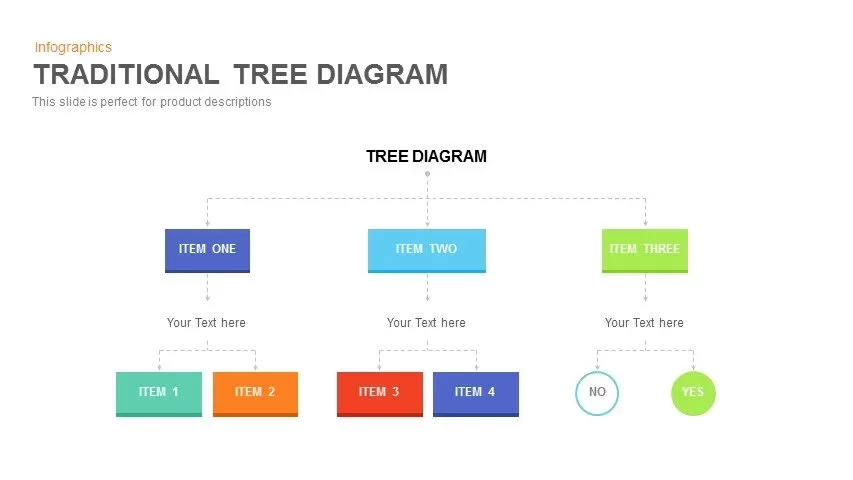
Traditional Tree Diagram PowerPoint Template and Keynote Slide
Diagrams
Premium
-
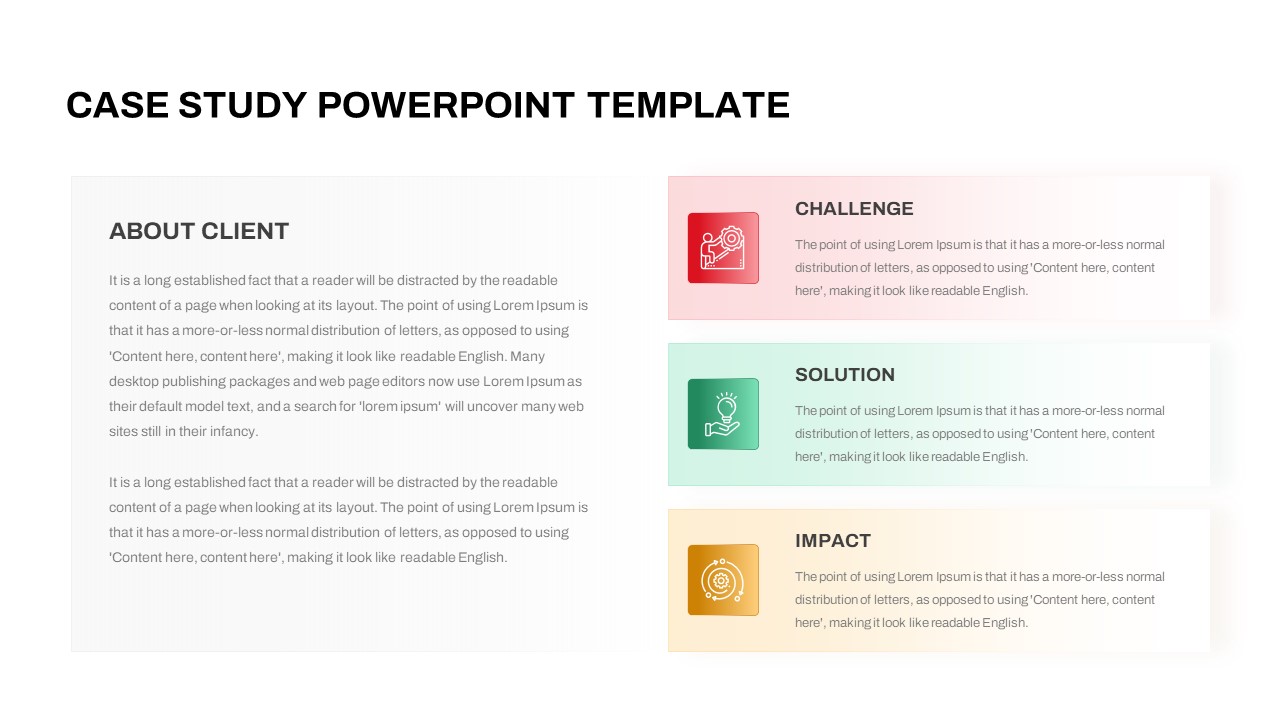
Free Case Study PowerPoint Template
PowerPoint Templates
Free
-
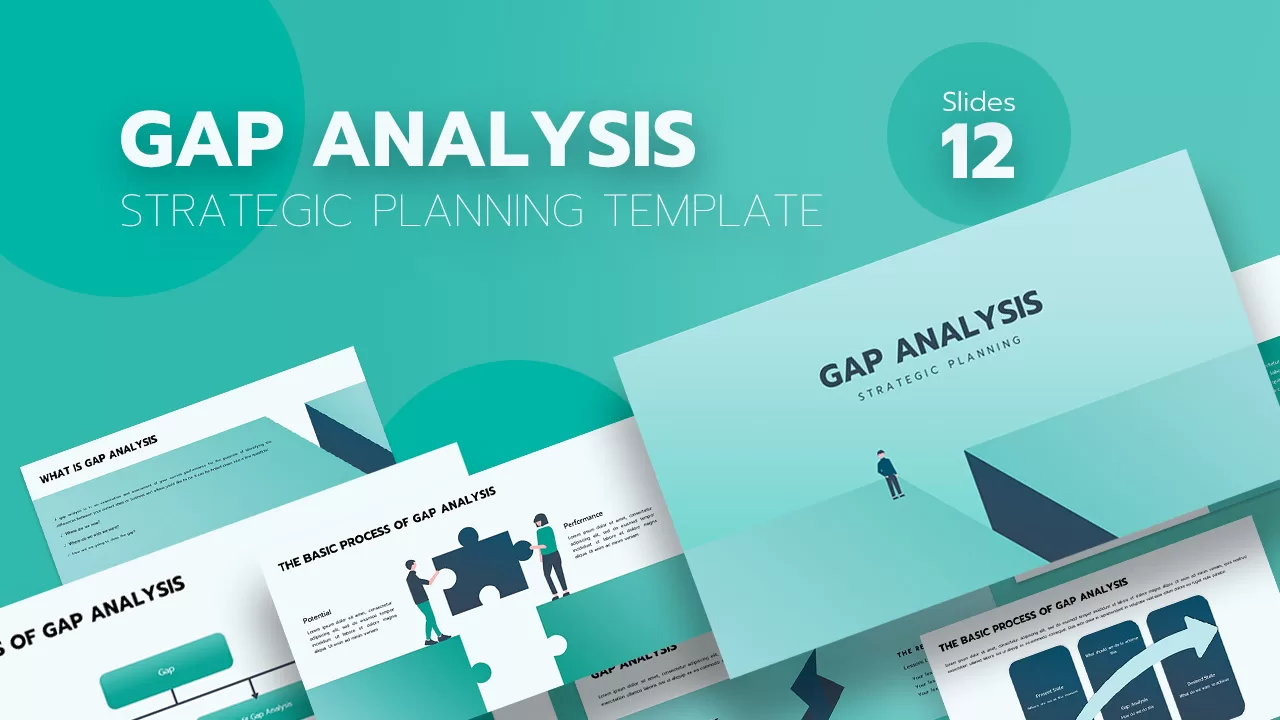
Gap Analysis Strategic Planning Template
PowerPoint Templates
Premium
-
PEST Analysis PowerPoint Template and Keynote
Diagrams
Premium
-
PESTLE Analysis Diagram Template
Business Models
Premium
-
Social Media Strategy Template
Social Media
Premium
-

Problem Statement PowerPoint Template
Metaphor, Simile & Analogy
Premium
-
Infographics Mobile App PowerPoint Template and Keynote Diagram
Social Media
Premium
-
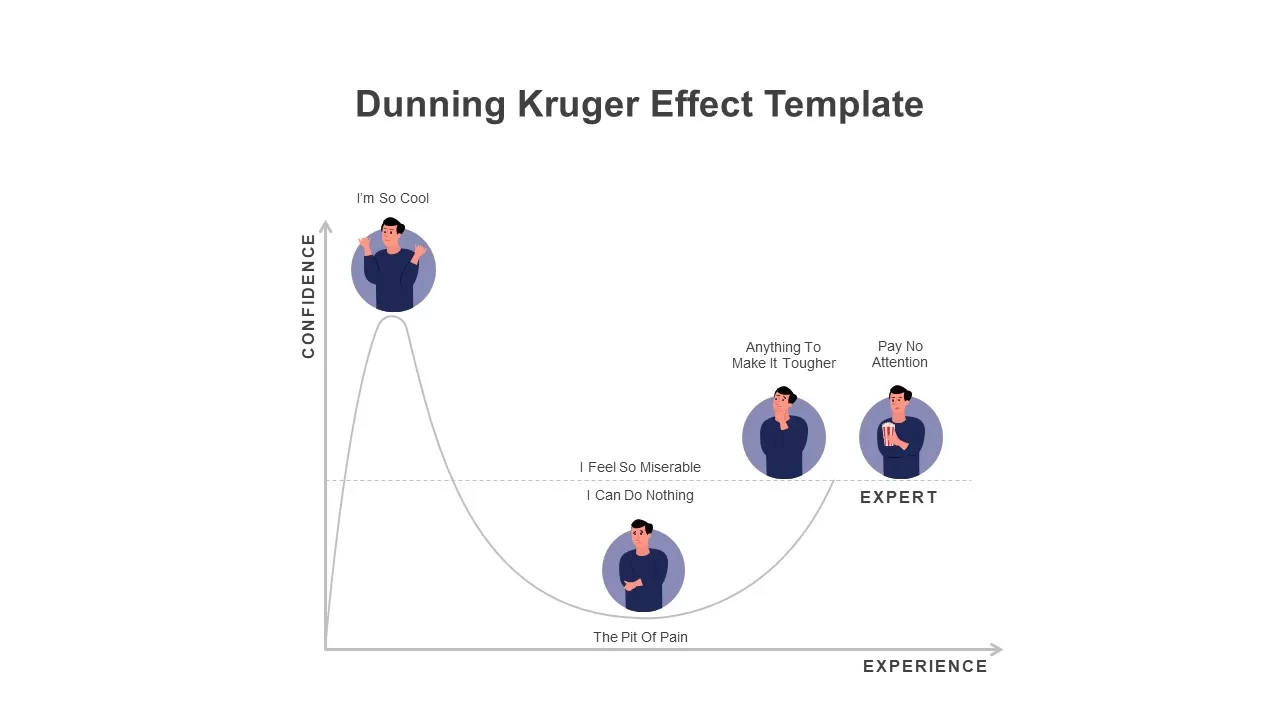
Dunning Kruger Effect Template
Diagrams
Premium
-
PESTLE Analysis PowerPoint Template and Keynote
Business Models
Premium
-
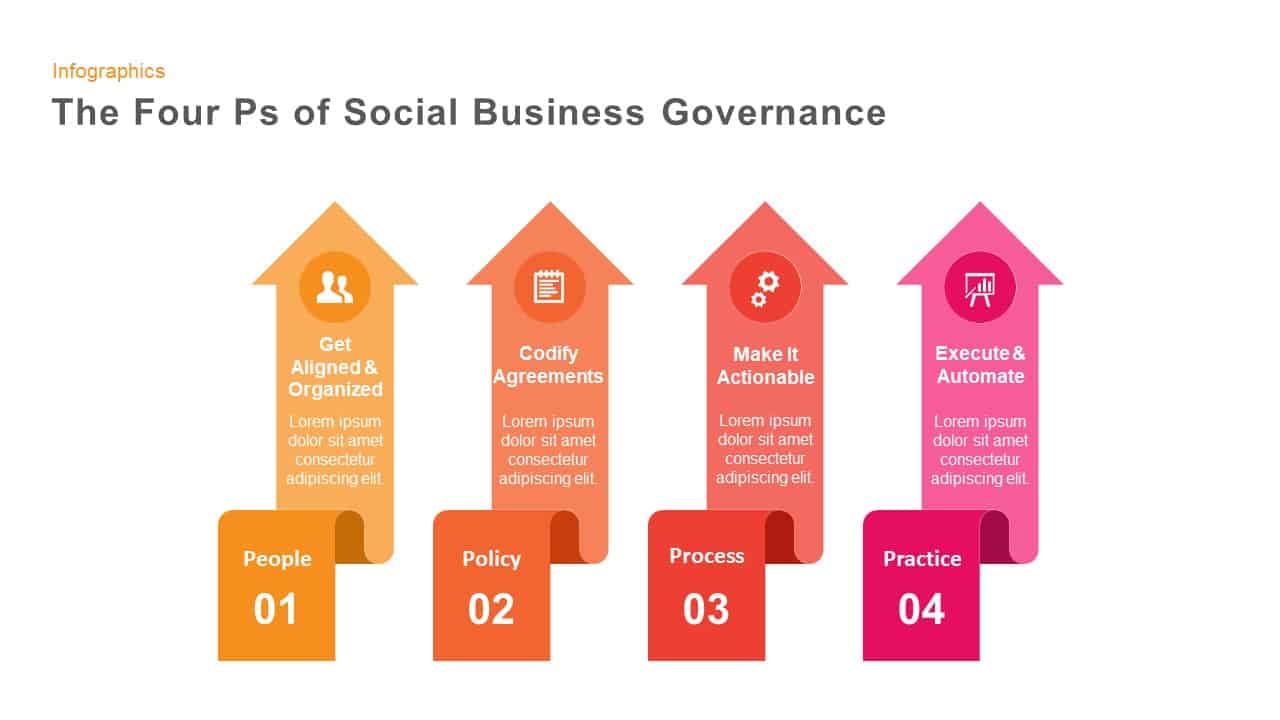
4 P’s of Social Business Governance PowerPoint and Keynote Slides
Diagrams
Premium
-
Quality Assurance PowerPoint Deck Template
PowerPoint Business Templates
Premium
-
Momentum: Business Plan PowerPoint Template
PowerPoint Business Templates
Premium
-
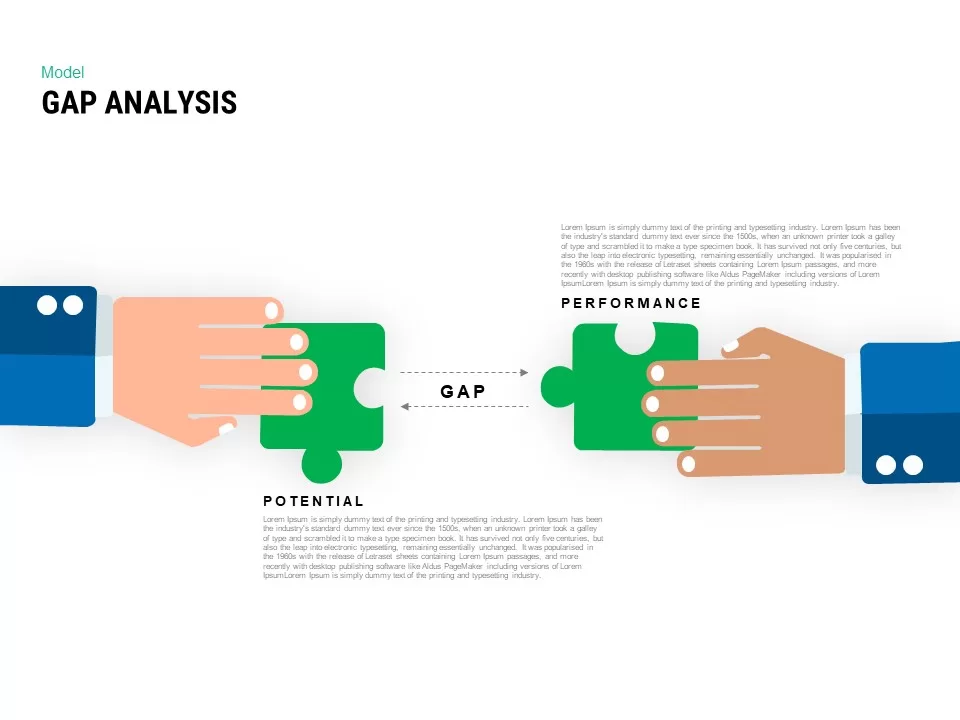
Gap Analysis PowerPoint Template
Business Models
Premium
-
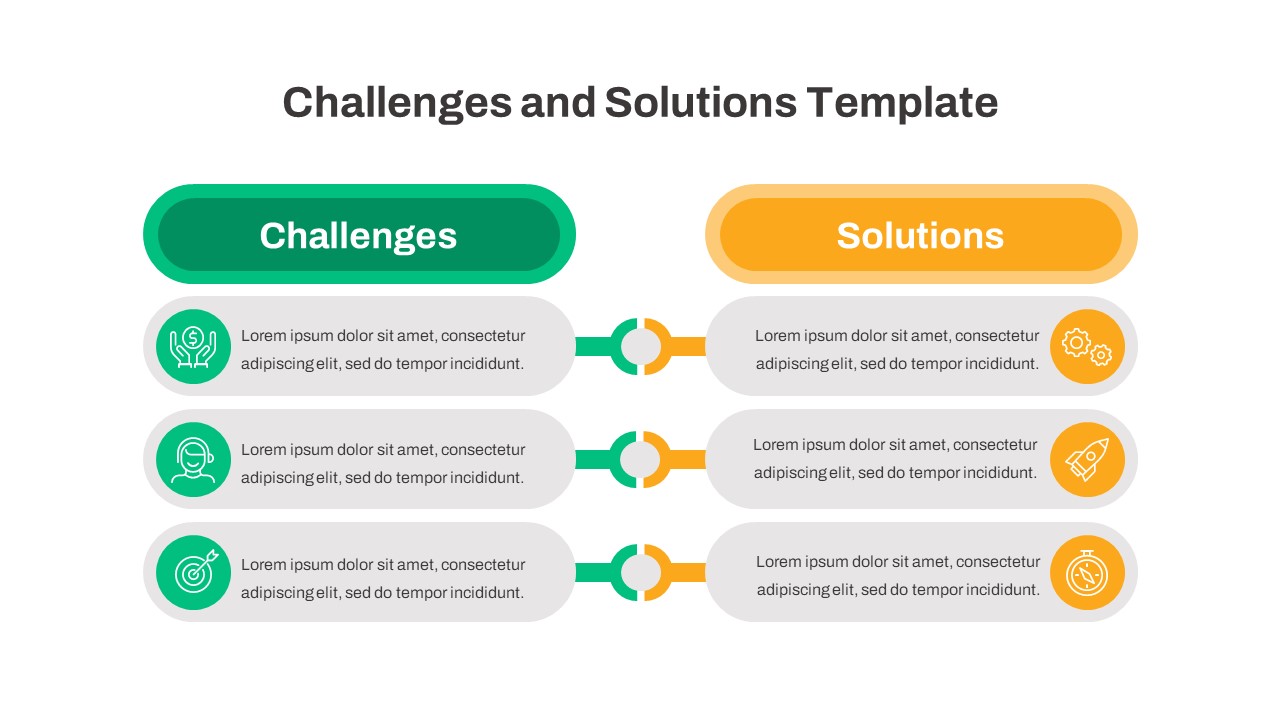
Free Challenges and Solutions PowerPoint Template
Free PowerPoint Templates
Free
-
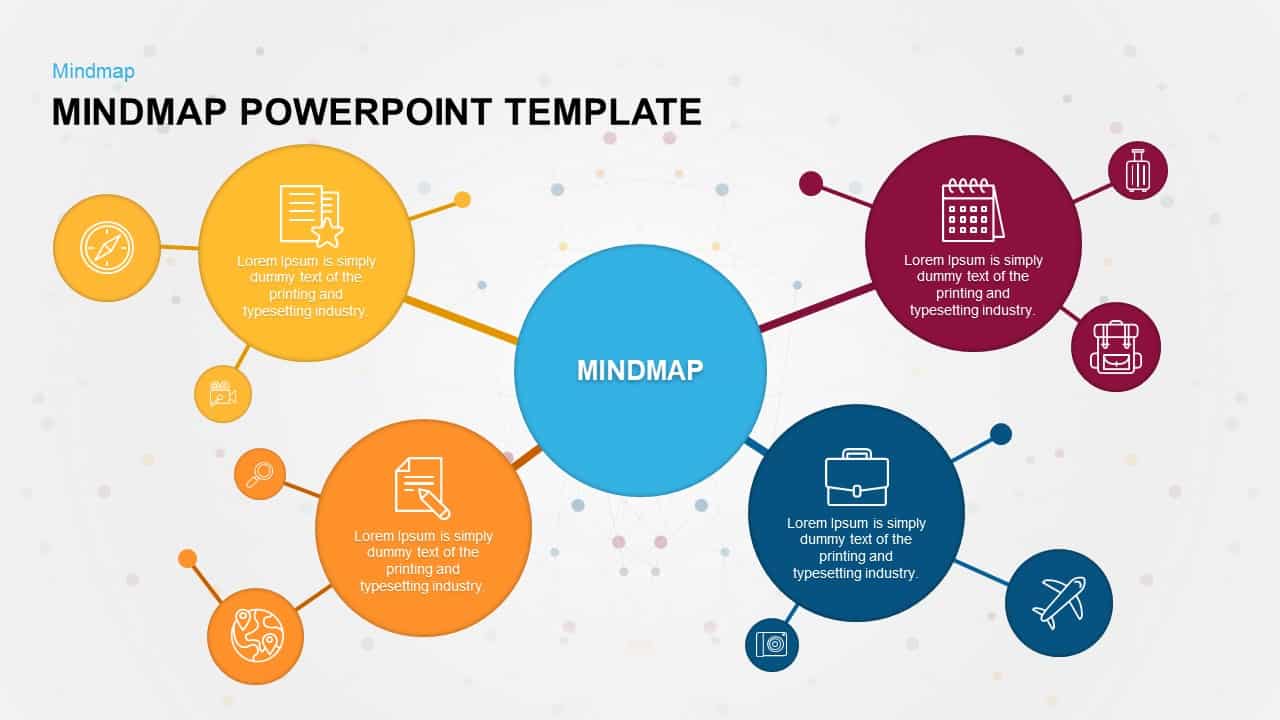
Mind Map PowerPoint Template and Keynote Slide
Diagrams
Premium
-
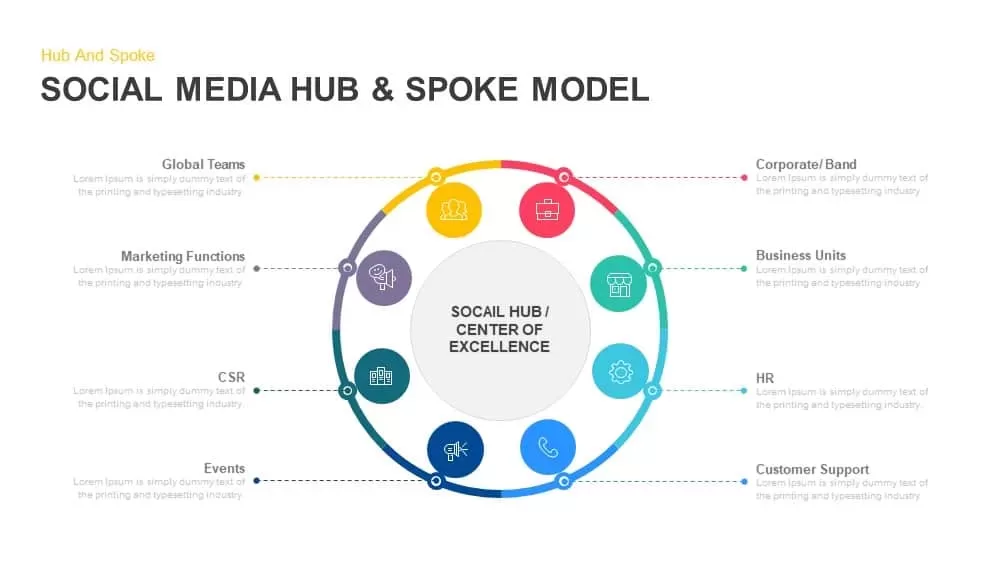
Social Media Hub and Spoke Model PowerPoint Template and Keynote
Circular Diagrams
Premium
-
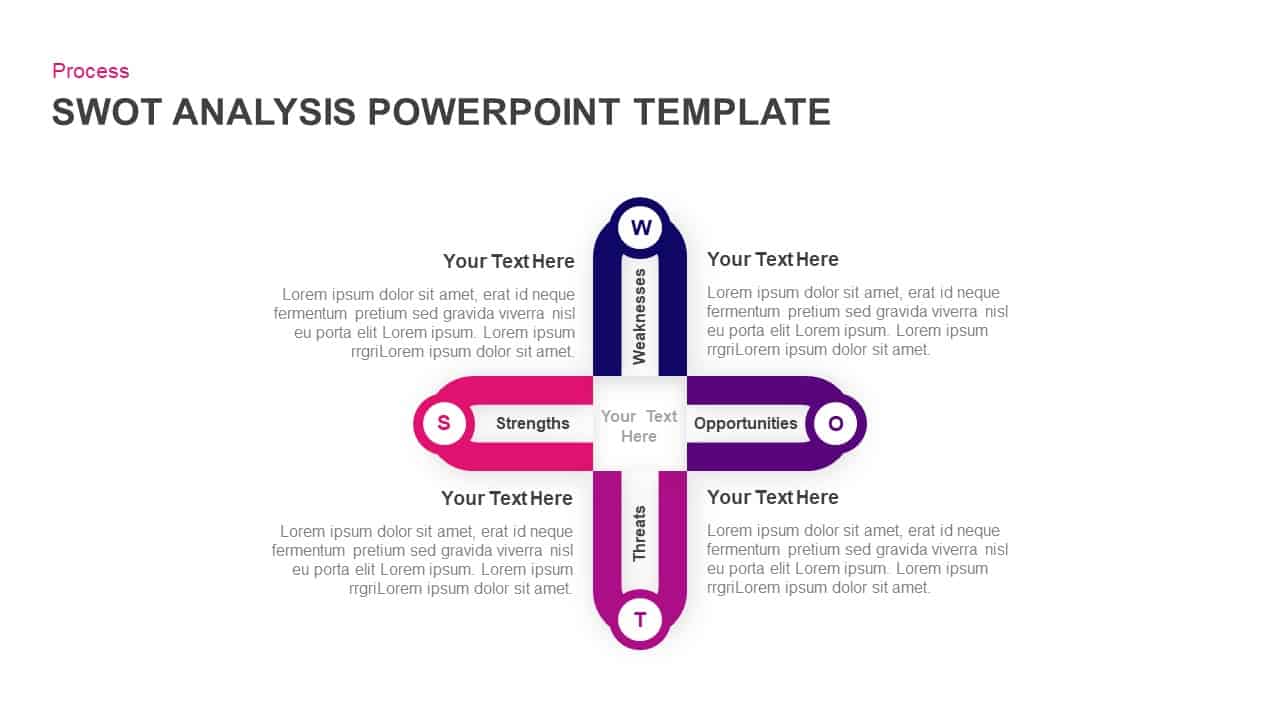
SWOT Template for PowerPoint & Keynote Presentation
Business Models
Premium
-
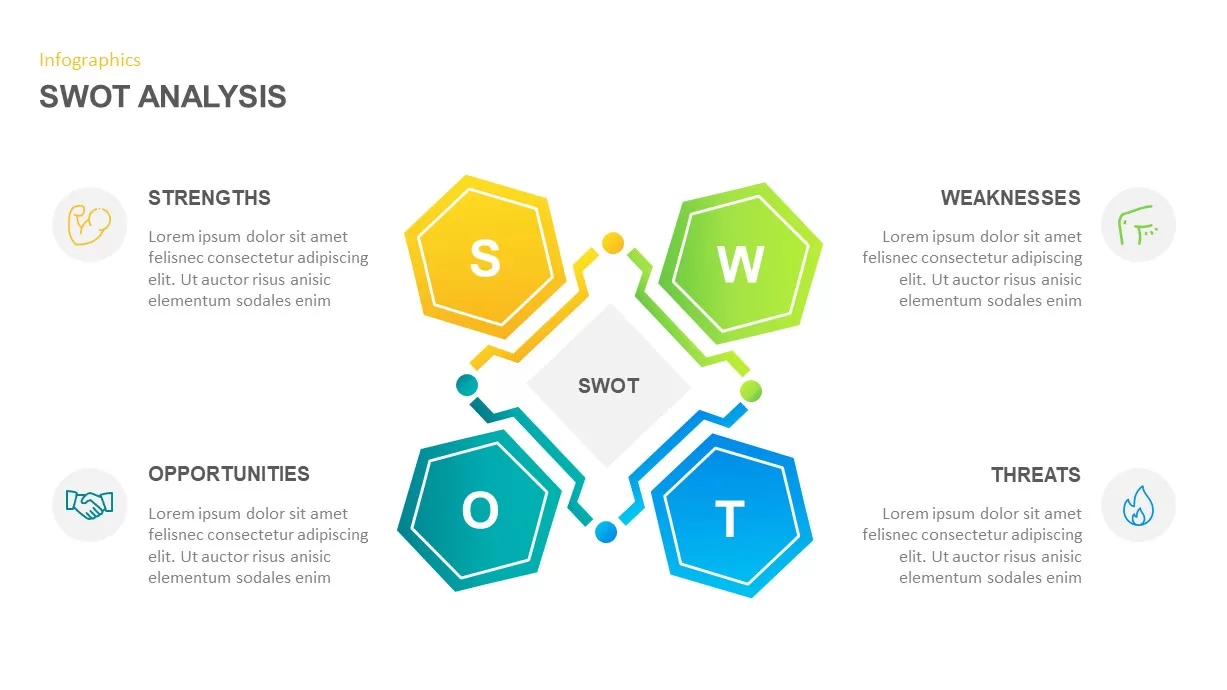
SWOT Analysis PowerPoint Slide
Business Models
Premium
-
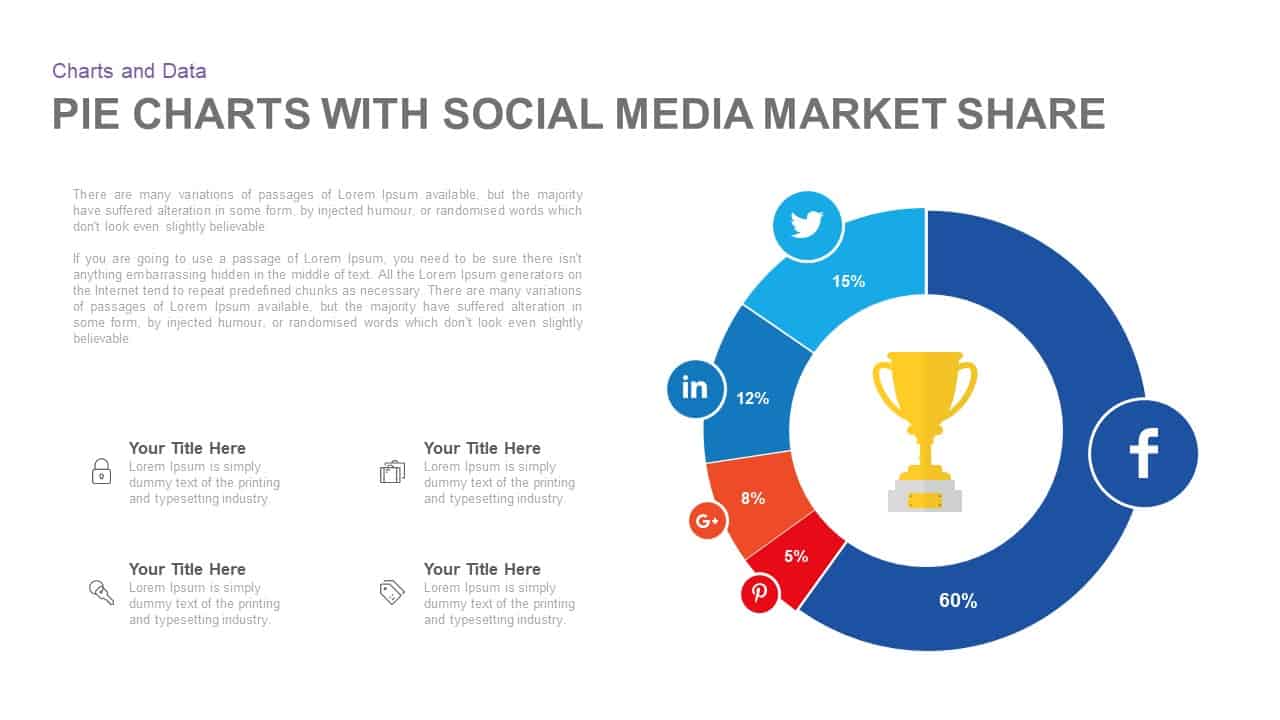
Pie Chart with Social Media Market Share PowerPoint and Keynote Template
Circular Diagrams
Premium
-
Pestel Analysis PowerPoint Template & Keynote slide
Business Models
Premium
-
Free 3D Social Media Icons PowerPoint Template
Social Media
Free
-
SWOT analysis table PPT Template And Keynote
Diagrams
Premium
-

Macroeconomics PowerPoint Template
PowerPoint Templates
Premium
-
Org Chart PowerPoint Presentation Template
PowerPoint Charts
Premium
-
Free SWOT Analysis PowerPoint Template and Keynote Slide
Business Models
Free
-
Problem Solving PowerPoint Template and Keynote Diagram
Keynote Templates
Premium
-
Cluster Diagram Template for PowerPoint and Keynote Presentation
Diagrams
Premium
-
Business SWOT Analysis PowerPoint Template and Keynote Slide
Business Models
Premium
-
Research PowerPoint Template and Metaphor Keynote Template
Keynote Templates
Premium
-
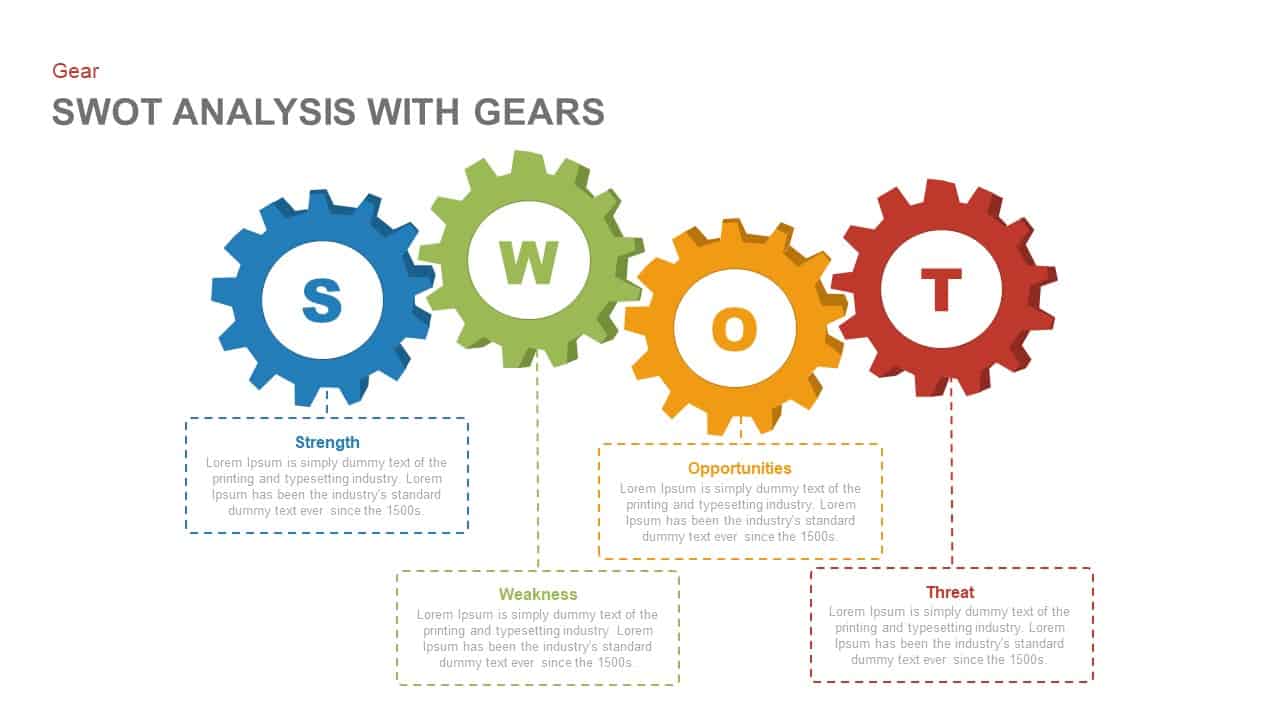
SWOT Analysis PowerPoint Template with Gears and Keynote Slide
Gear
Premium
-
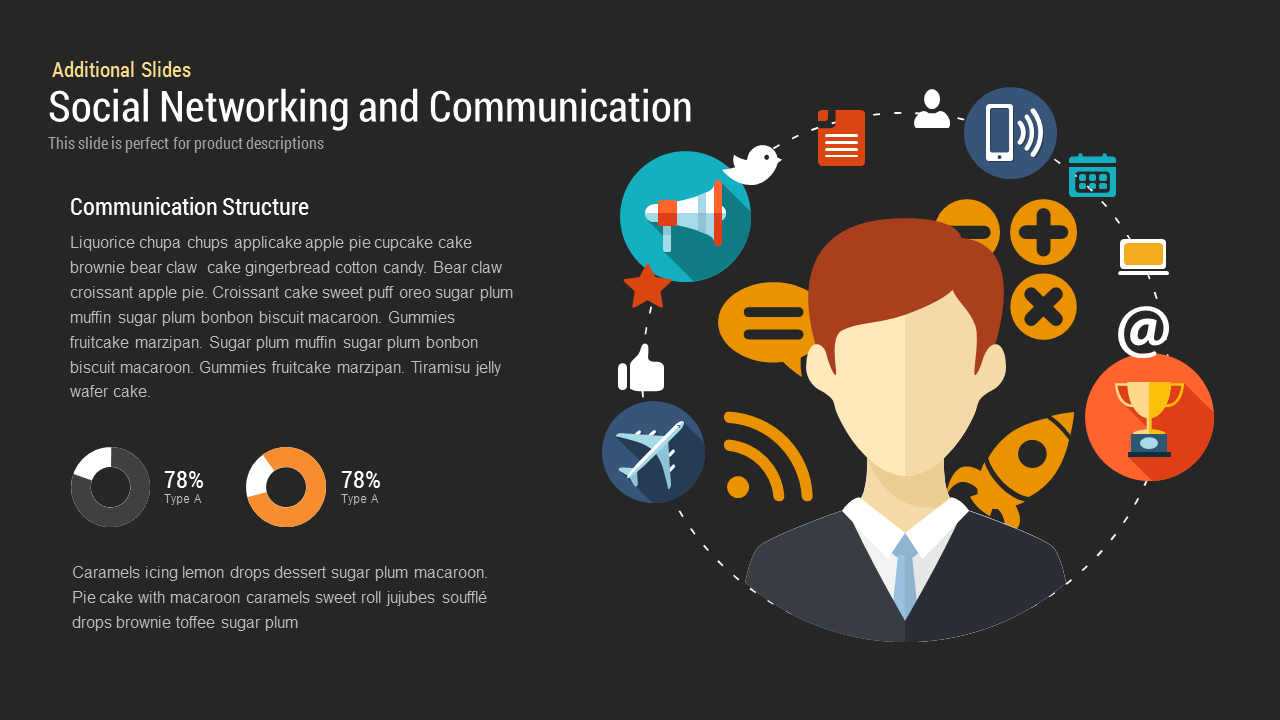
Social Networking and Communication
Infographic
Premium
-
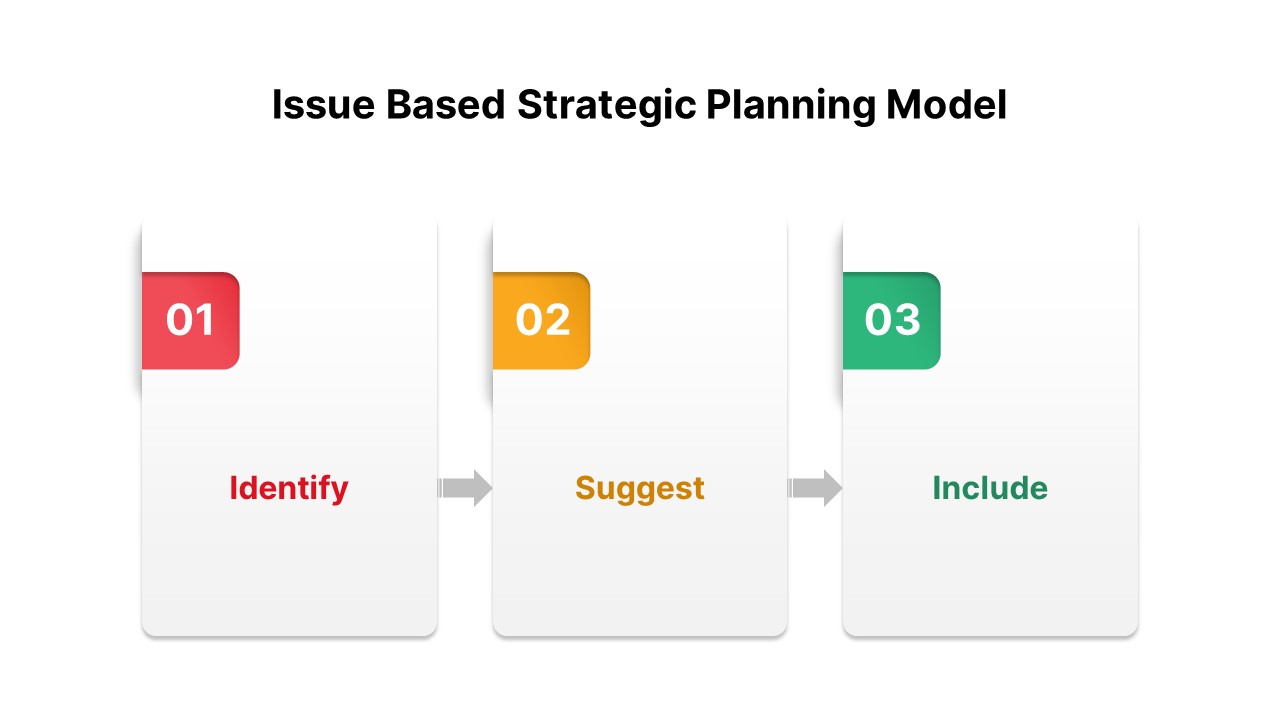
Issue Based Strategic Planning Model PowerPoint Template
PowerPoint Templates
Premium
-
Quality Control Presentation Template
PowerPoint Templates
Premium
-
Social Distancing PowerPoint Template
Business Models
Premium
-
NonProfit Vs For Profit PowerPoint Diagram
PowerPoint Business Templates
Premium
-
Iceberg Infographic Template
Infographic
Premium
-
SWOT Analysis Template for PowerPoint and Keynote
Business Models
Premium
-
PESTEL Analysis Tree Diagram PowerPoint Template and Keynote
Diagrams
Premium
-
Free Global Warming PowerPoint Template
Free PowerPoint Templates
Free
-
4 Step Sales Funnel Template PowerPoint
Funnel Diagrams
Premium
-
Continuous Improvement Cycle Diagram for PowerPoint
Circular Diagrams
Premium