Home » Shapes » Curves and Lines » CAPM Model Template
CAPM Model Template
- Version 1.0.0
- Download 13
- File Size 0.00 KB
- File Count 1
- Create Date September 5, 2022
- Last Updated September 5, 2022
CAPM Model Template
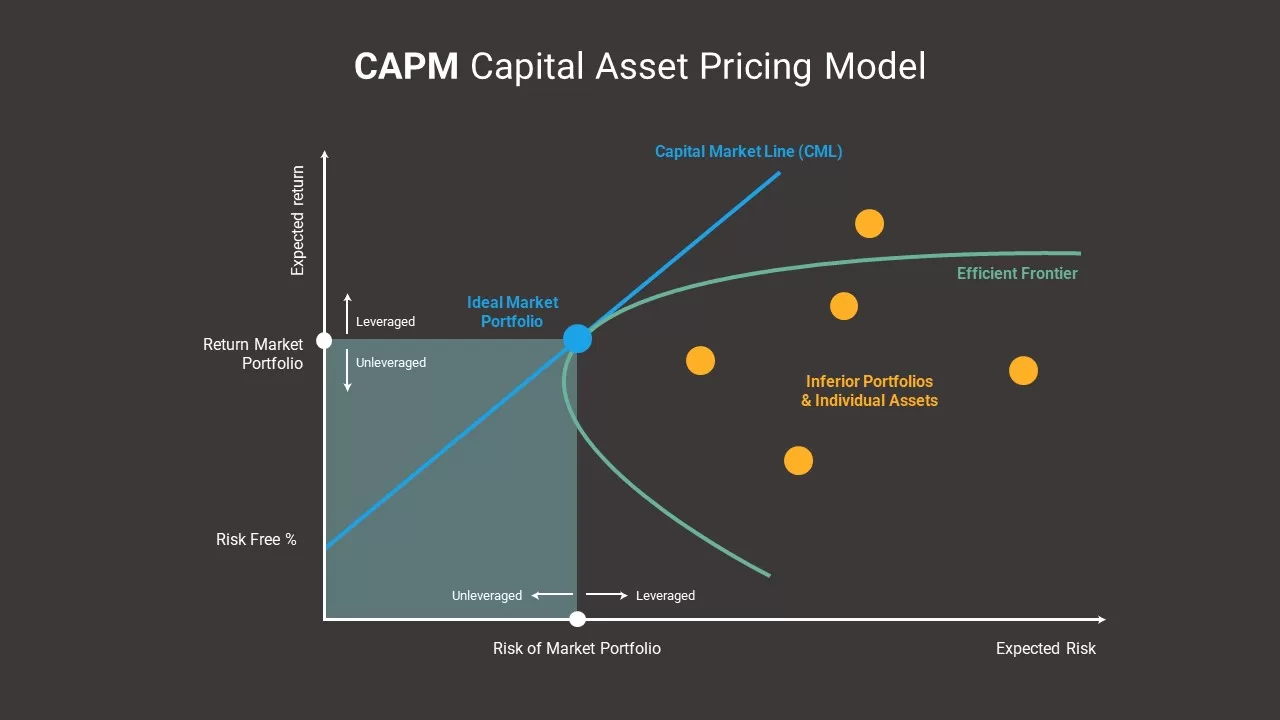
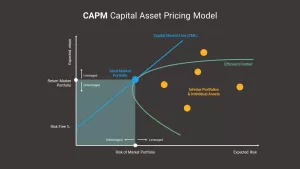
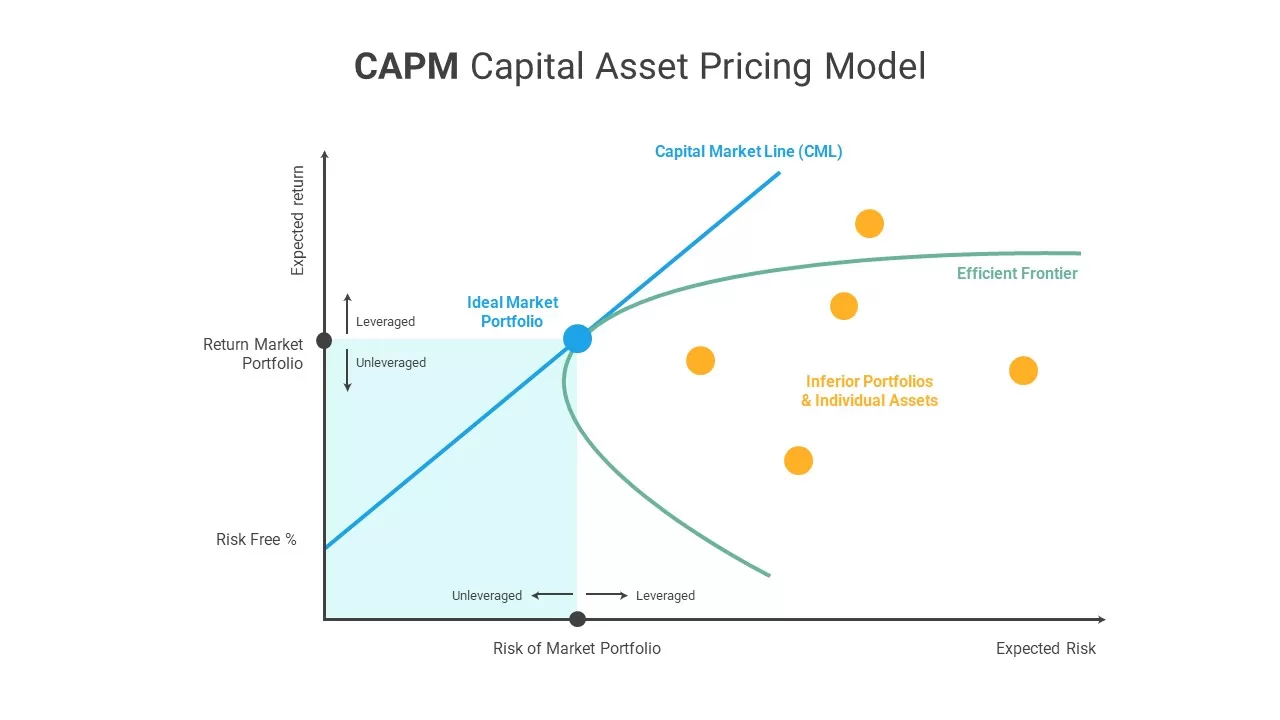
The capital asset pricing model is a financial presentation graph widely used for showing the relationship expected return of investment and risk. Asset management and portfolio management need mitigation of loss and risks. The CAPM model template will provide an outline for investment planning by cost-benefit analysis. The PowerPoint graph of the capital asset pricing model is created as a theory presentation slide with a specific layout and structure. Corporate financial managers need to abate risk over capital outflows. Generally, the CAPM model template is used in the security market to determine expected returns on investment. Use our well-structured capital model pricing ppt diagram to showcase the risk-reward ratio.
The capital asset pricing model is a graphical representation of capital investment with the X and Y axis. In this graph, you can see the risk of the market portfolio and expected risk on the X axis, whereas the Y axis shows the risk-free marketing portfolio and expected return. When the risk is high, there is a chance of high return and high loss. When your portfolio is risk-free, you may get slow growth on the investment, whereas there is a low risk for loss. There is an optimum point between the line and curve graph. The blue PowerPoint is the ideal point, and the scattered yellow spots between the curved line indicate inferior portfolio and individual assets. It shows the beta of the investment.
CAPM model PowerPoint template could be the best tool for asset managers, portfolio managers, security experts, share brokers, and investment gurus. You can display the fundamental of financial marketing using the finance PowerPoint templates. The two-slide presentation CAPM model template is a standardized diagram, so you need not change the core graph. If you want to change the background and color combinations, you can easily be done with PowerPoint color filling options. Besides, the size and fonts are adjustable according to your needs. Use capital asset pricing model graph for specific financial presentation.
Attached Files
| File |
|---|
| https://premiumdownloads.s3.amazonaws.com/SB02388-CAPM Model Template.zip |
Login to download this file
Add to favorites
Add to collection
-
Item ID
SB02388 -
Rating
0.0
(0 reviews)
Related Templates
-

Capital Structure PowerPoint Template
Business Models
Premium
-
Asset Management PowerPoint Template
Infographic
Premium
-
Risk Mitigation Strategy PowerPoint Template & Keynote Diagram
Business Models
Premium
-
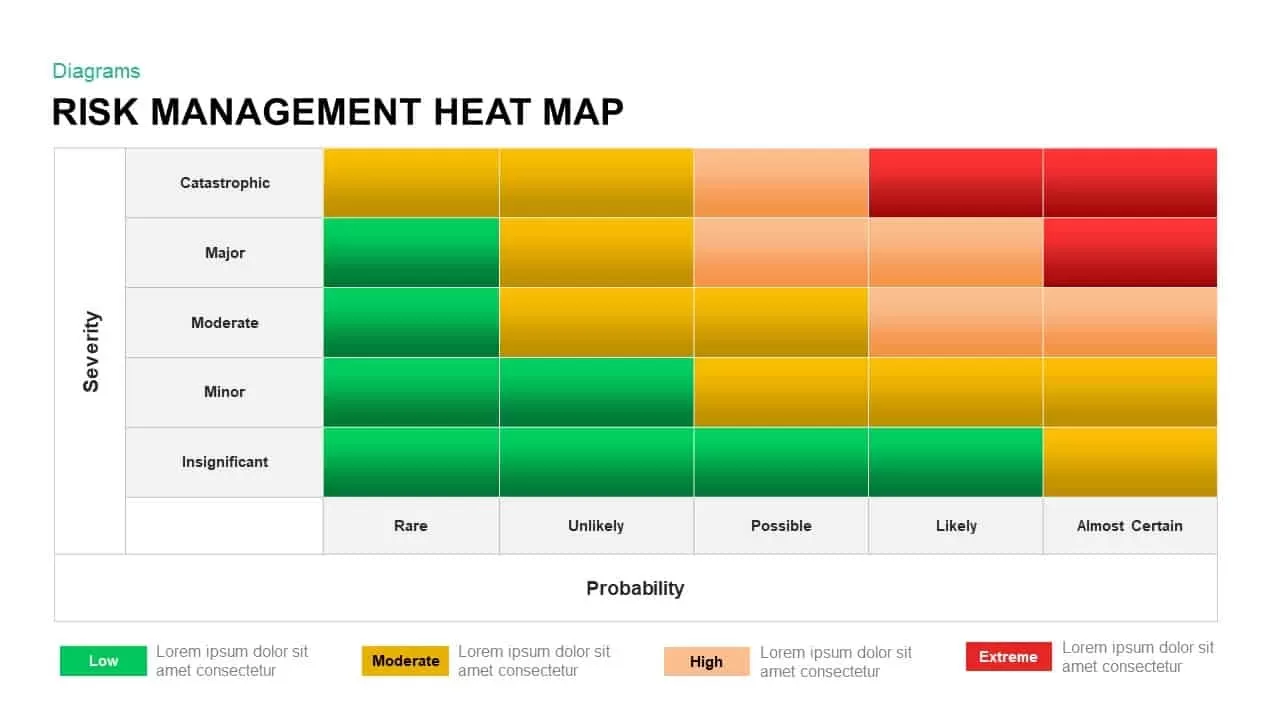
Risk Management Heat Map Template for PowerPoint And Keynote
Diagrams
Premium
-
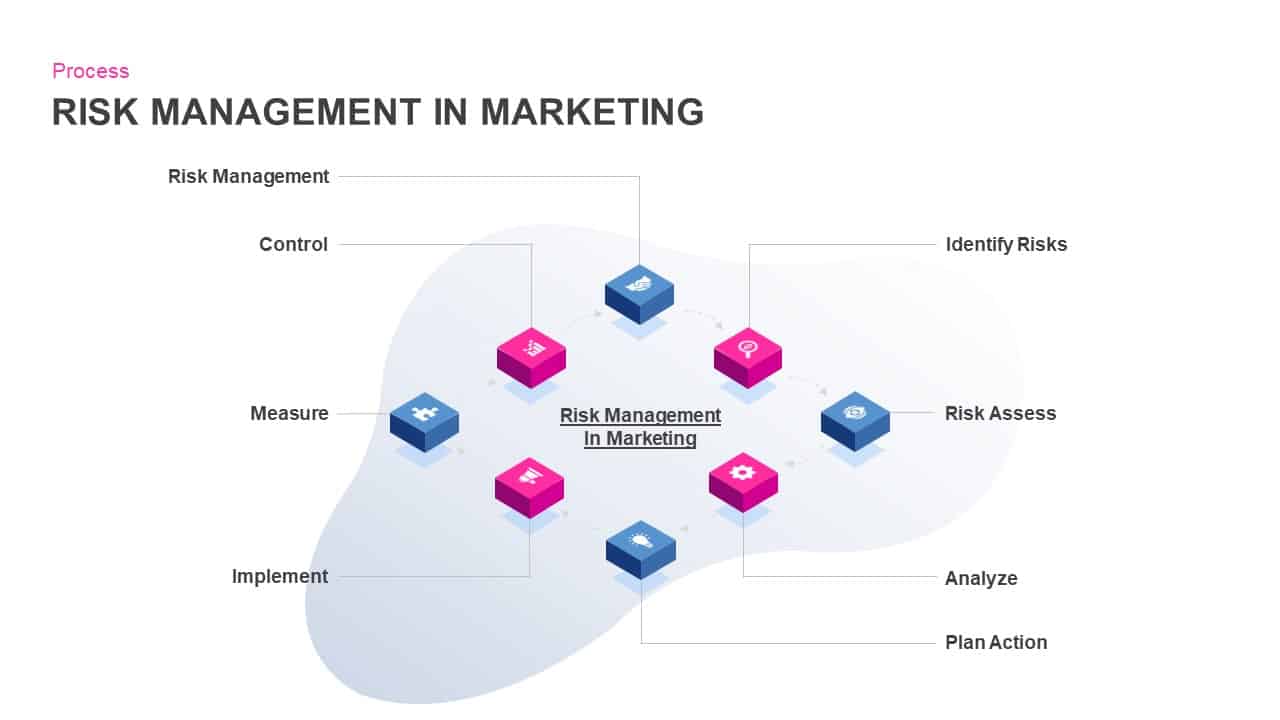
Risk Management in Marketing – Template for PowerPoint & Keynote
Business Models
Premium
-
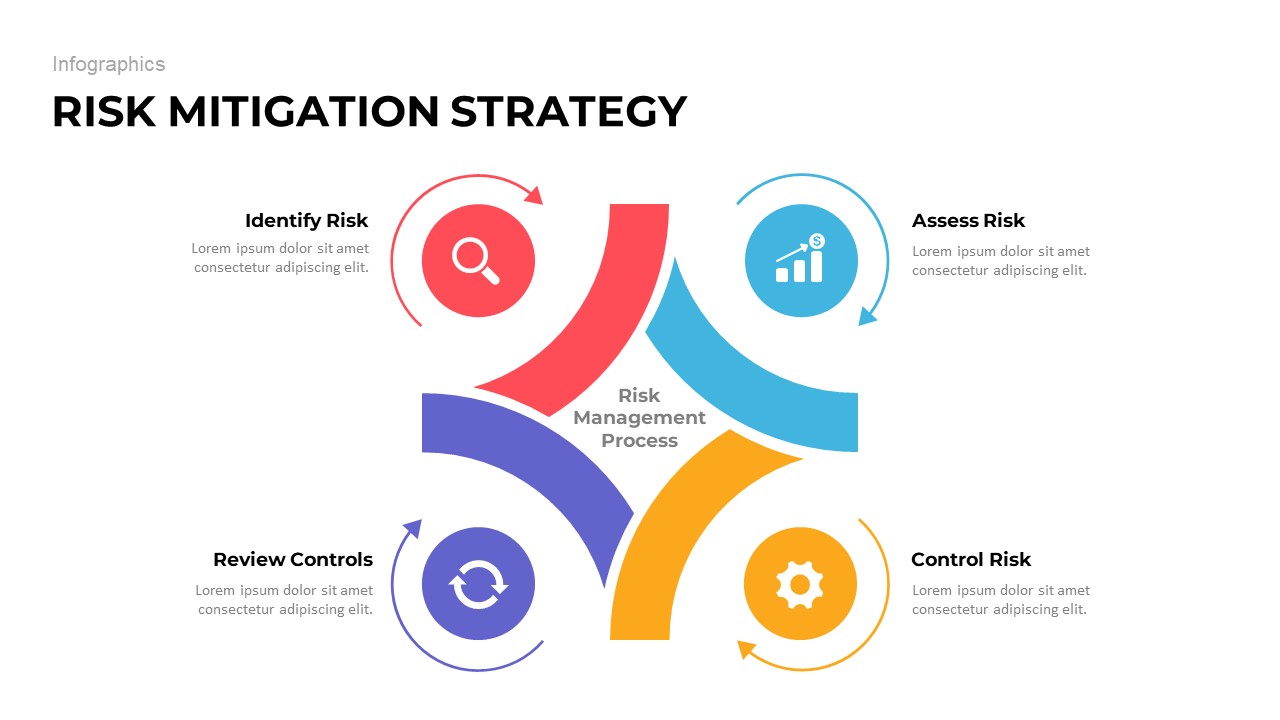
Risk Mitigation Strategy Template for PowerPoint and Keynote
Diagrams
Premium
-
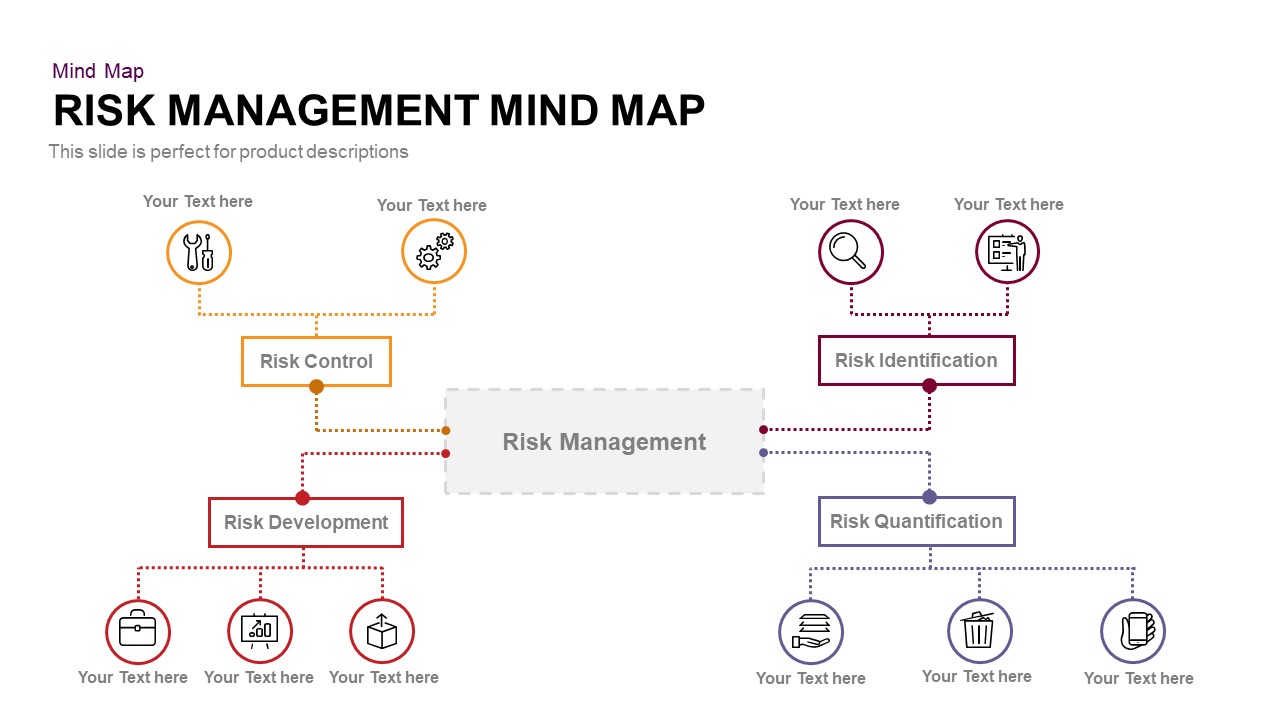
Risk Management Mind Map PowerPoint Template
Diagrams
Premium
-
Governance, Risk Management and Compliance Slide Templates
Business Models
Premium
-
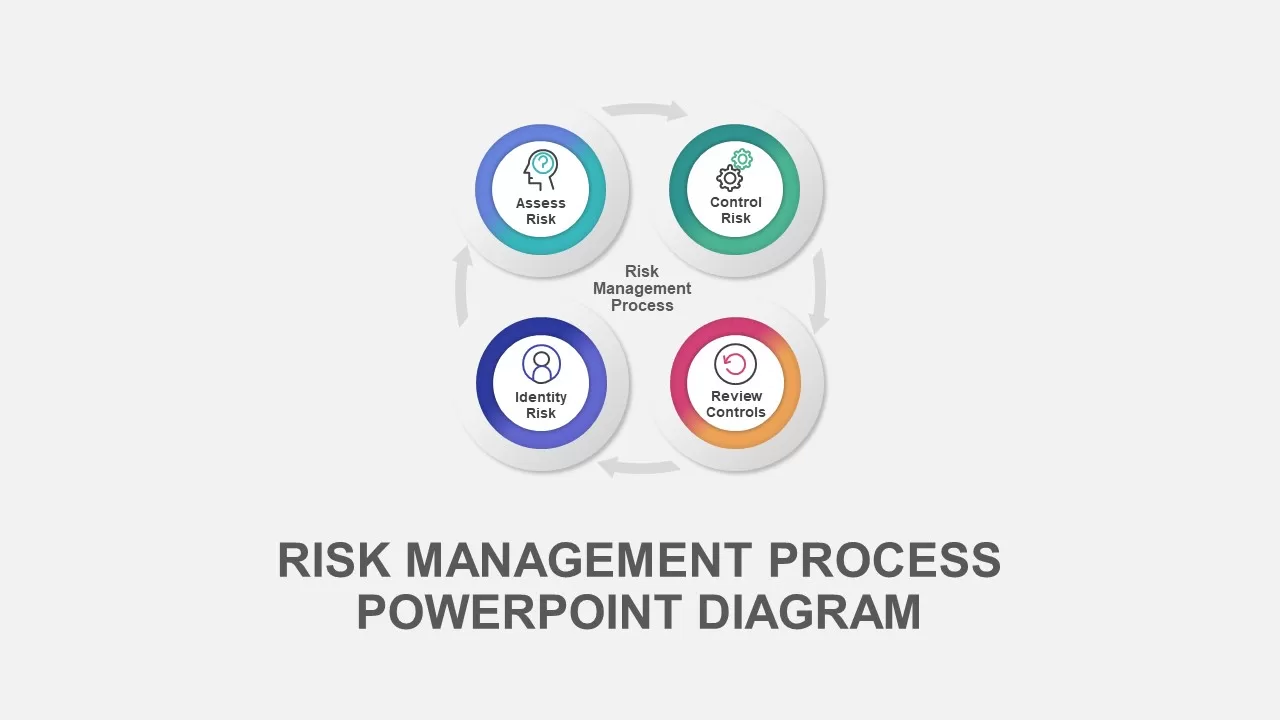
Risk Management Process Diagram for PowerPoint
Business Models
Premium
-
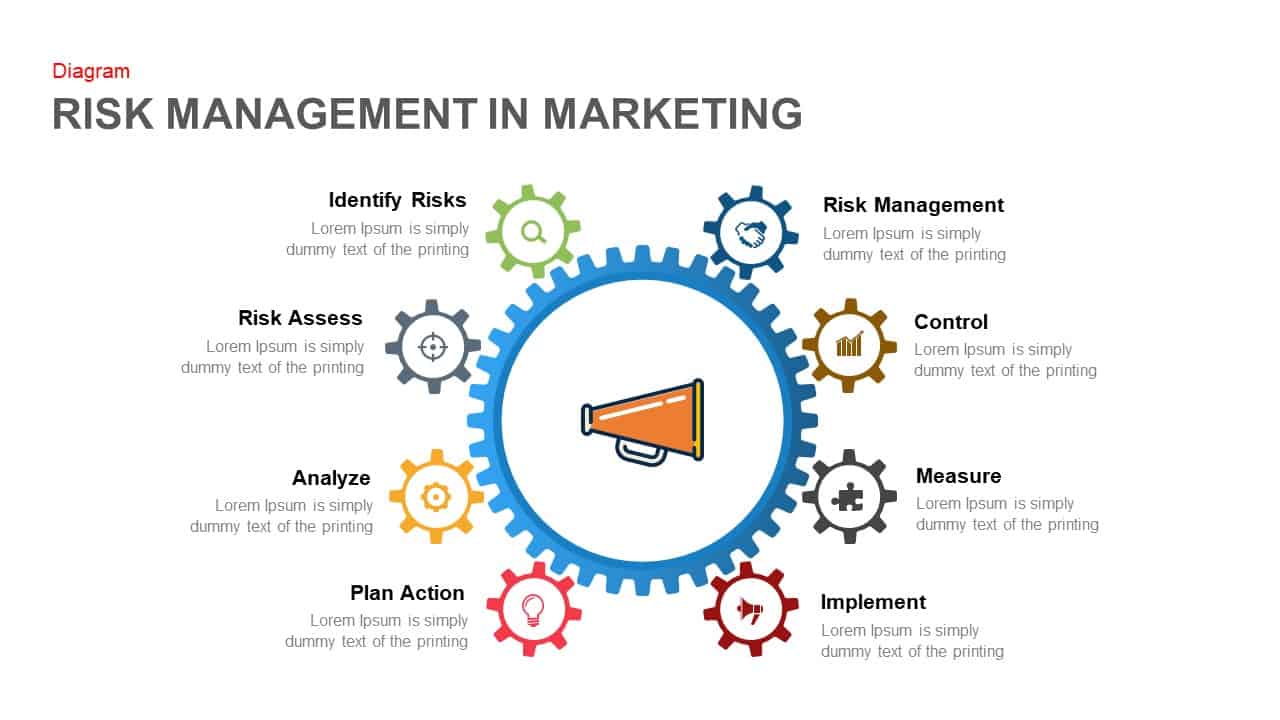
Risk Management in Marketing PowerPoint Template and Keynote Template
Diagrams
Premium
-
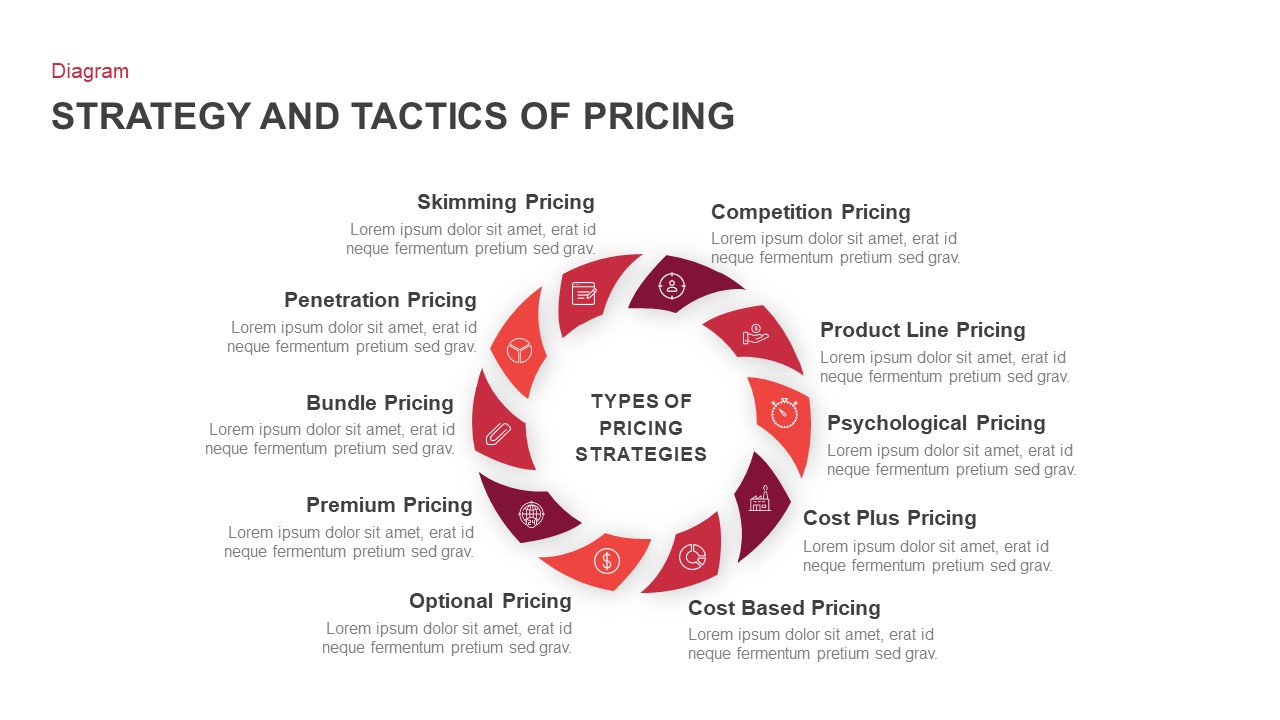
Strategy Tactics Pricing PowerPoint Template
Circular Diagrams
Premium
-
Financial Management PowerPoint Template and Keynote Slide
Infographic
Premium
-
Risk Register Template
PowerPoint Templates
Premium
-

Mitigation Plan PowerPoint Template
PowerPoint Business Templates
Premium
-
Business Investment PowerPoint Template and Keynote Slide
Keynote Templates
Premium
-
Financial Growth Template for PowerPoint & Keynote
Business Models
Premium
-
Curved Line Graph PowerPoint Template and Keynote Slide
Curves and Lines
Premium
-
Enterprise Risk Management PowerPoint Template
Circular Diagrams
Premium
-
Risk Management PowerPoint Template and Keynote Slide
Business Models
Premium
-

Finance Advisor PowerPoint Template
PowerPoint Templates
Premium
-
Cost Volume Profit Analysis PowerPoint Template
PowerPoint Templates
Premium
-
RAIDAR Model PowerPoint Template
Business Models
Premium
-
Pricing Table PowerPoint Template and Keynote Slide
Keynote Templates
Premium
-
Speedometer Concept PowerPoint Template and Keynote Slide
Business Models
Premium
-
Profit and Loss Chart Infographic for PowerPoint Presentation
PowerPoint Templates
Premium
-
Skimming Pricing PowerPoint Template
PowerPoint Templates
Premium
-
Financial Review Template for PowerPoint and Keynote
Infographic
Premium
-

Risk Metaphor PowerPoint Template and Keynote
Keynote Templates
Premium
-
4 Pricing Plan Template for PowerPoint and Keynote Presentation
Diagrams
Premium
-
Pricing Table Presentation Template
Infographic
Premium
-
Financial Planning Process With Review and Monitor Template for PowerPoint & Keynote
Business Models
Premium
-

Free Management Deck Template
PowerPoint Templates
Free
-
Creative Tree Diagram PowerPoint Template With Icons
Tree Diagrams
Premium
-
Revenue Model Template for PowerPoint & Keynote
Business Models
Premium
-
Key Financial Ratios PowerPoint Template
PowerPoint Templates
Premium
-
Revenue Management Templates for PowerPoint & Keynote
Business Models
Premium
-
Three Lines of Defense Template
PowerPoint Templates
Premium
-
Business Financing Expansion Ideas Diagram for PowerPoint & Keynote
Business Models
Premium
-
Balance Infographics PowerPoint Template and Keynote Slide
Business Models
Premium
-
Activity Ratios PowerPoint Template
PowerPoint Templates
Premium
-
Financial Statement PowerPoint Template
PowerPoint Templates
Premium
-
Risk and impact Analysis Template for Powerpoint
Text and Table
Premium
-
Leverage Ratios PowerPoint Template
PowerPoint Templates
Premium
-

Finance Consulting PowerPoint Template
PowerPoint Templates
Premium
-
Finance Flat Dollar Coin Icon Representation PowerPoint and Keynote Template
Business Models
Premium
-

Pricing Plans Powerpoint and Keynote Template
Keynote Templates
Premium
-

VC Pitch Deck Template
PowerPoint Templates
Premium
-

Investment & Finance PowerPoint Theme
PowerPoint Themes
Premium
-
Razor Blade Business Model PowerPoint Template
Business Models
Premium
-

Professional Portfolio Presentation Template
PowerPoint Business Templates
Premium
-
Pricing Table PowerPoint Template and Keynote
Keynote Templates
Premium
-
Comparison Pricing Table Template for PowerPoint and Keynote
Infographic
Premium
-
Financial Report Metaphor PowerPoint Presentation Template
Metaphor, Simile & Analogy
Premium
-

Disaster Management Template
PowerPoint Templates
Premium
-
Polynomial Combination Chart PowerPoint Template and Keynote Slide
Column and Bar chart
Premium
-
Break-Even Analysis Template
PowerPoint Charts
Premium
-

Supply Chain Management PowerPoint Template and Logistics
Infographic
Premium
-
3D Column Chart for PowerPoint and Keynote Presentation
PowerPoint Charts
Premium
-

Free Finance Deck PowerPoint Template
PowerPoint Templates
Free
-
Financial Report PowerPoint Template & Keynote
PowerPoint Templates
Premium
-
Pricing Table PowerPoint Template and Keynote Slide
Business Models
Premium
-
Supply Positioning Model Template
Business Models
Premium
-
Supply Positioning Model PowerPoint Template
Business Models
Premium
-

FinTech PowerPoint Template
PowerPoint Templates
Premium
-
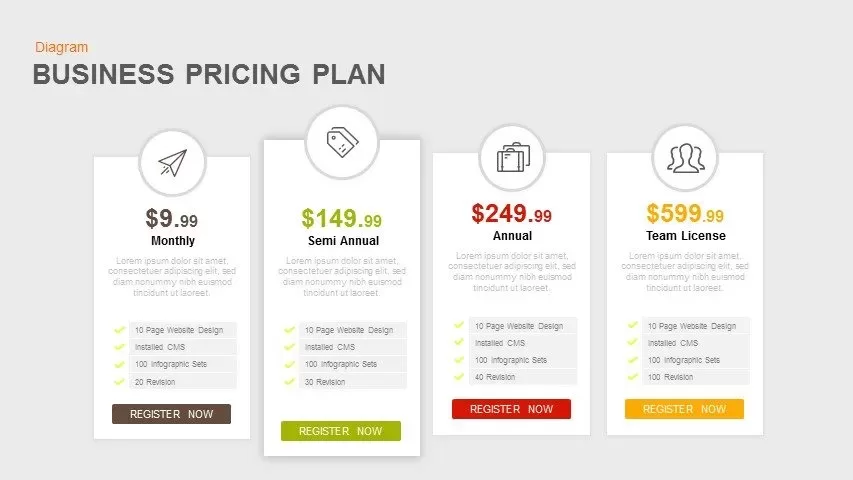
Business Pricing Plan Template for PowerPoint & Keynote
PowerPoint Templates
Premium
-
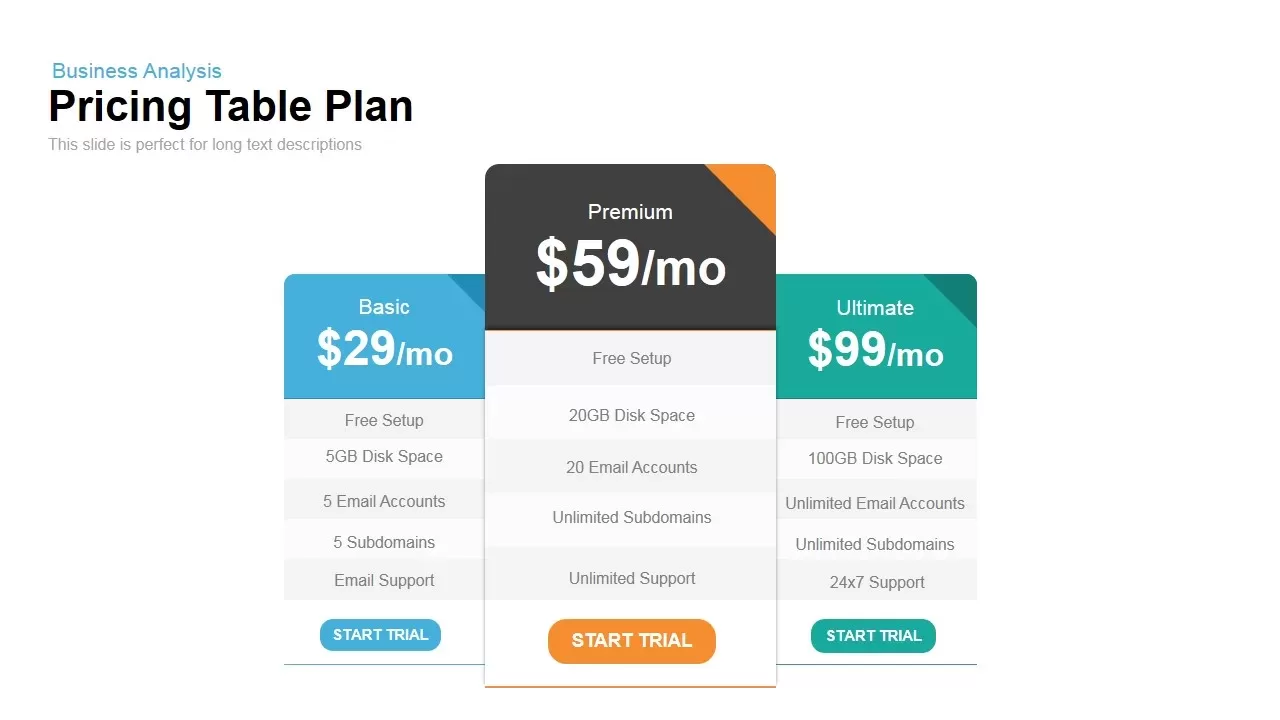
Plan and Pricing Table Template for PowerPoint and Keynote
Tables
Premium
-
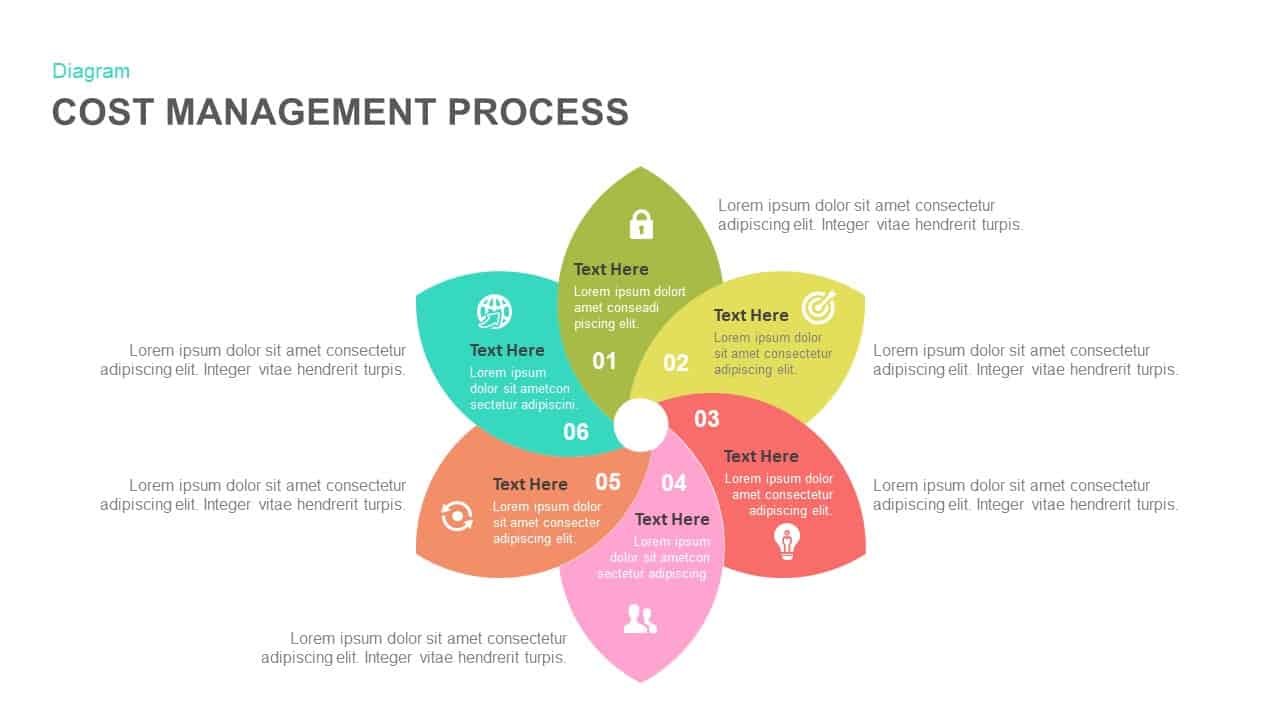
Cost Management Process Template for PowerPoint and Keynote
Diagrams
Premium
-
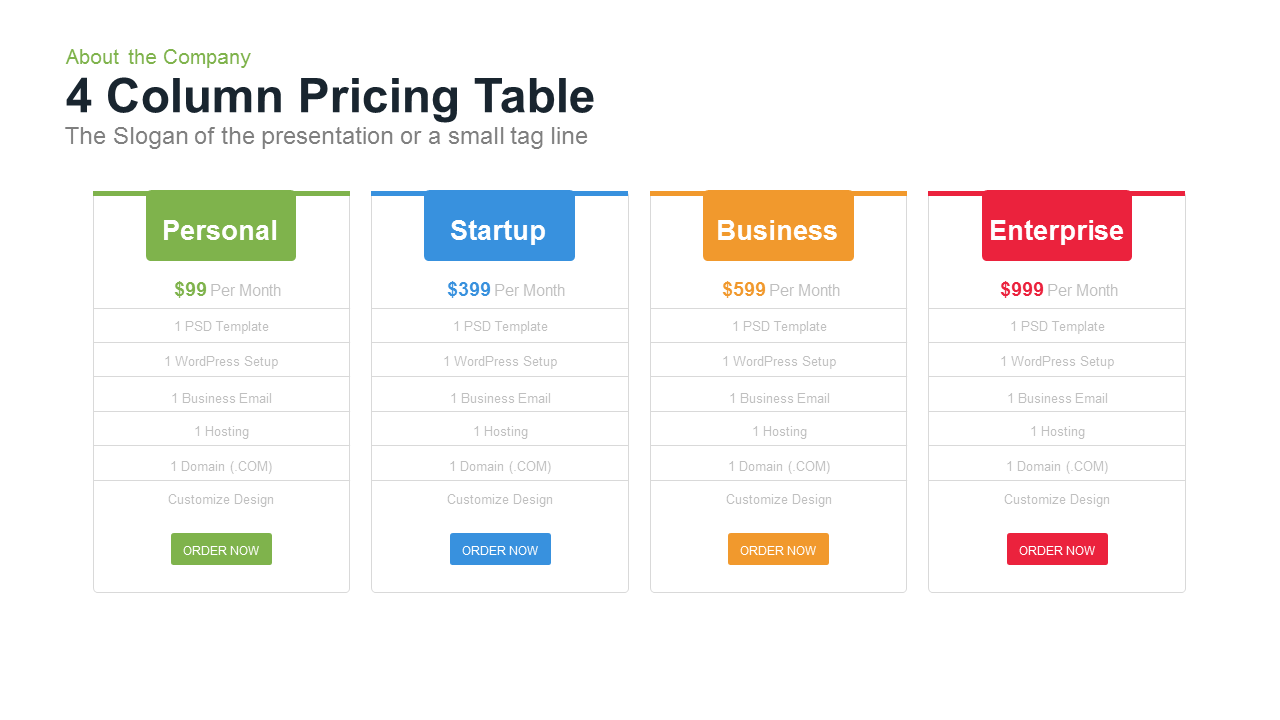
4 Column Pricing Table Template for PowerPoint and Keynote
Tables
Premium
-
Curved Line Graph PowerPoint Template and Keynote
Curves and Lines
Premium
-

Investment Banking PowerPoint Template
PowerPoint Templates
Premium
-

Free Stock Market PowerPoint Template
PowerPoint Templates
Free
-

Company Portfolio PowerPoint Presentation Template
PowerPoint Business Templates
Premium
-
Sales Cycle Steps PowerPoint Template and Keynote Template
Circular Diagrams
Premium
-
Prioritization Matrix Template
PowerPoint Templates
Premium
-

Line Chart Representation PowerPoint Templates and Keynote Slides
PowerPoint Charts
Premium
-
SQERT Project Management PowerPoint Template
Business Models
Premium
-
Bow Tie PowerPoint Template
Business Models
Premium
-
Infographic Speedometer PowerPoint Template and Keynote
Infographic
Premium
-
Abell’s Model PowerPoint and Keynote template
Business Models
Premium
-
Kubler Ross Change Curve PowerPoint Template
Business Models
Premium
-
Multiple Line Chart PowerPoint Template
PowerPoint Charts
Premium
-
Investor Timeline PowerPoint Template and Keynote Slide
Keynote Templates
Premium
-

Data Over Time Line Chart PowerPoint Template
PowerPoint Charts
Premium
-
MABA Analysis PowerPoint Template
PowerPoint Templates
Premium
-

Swipewire Company Portfolio Template
PowerPoint Business Templates
Premium
-
Balance PowerPoint Template
Business Models
Premium
-
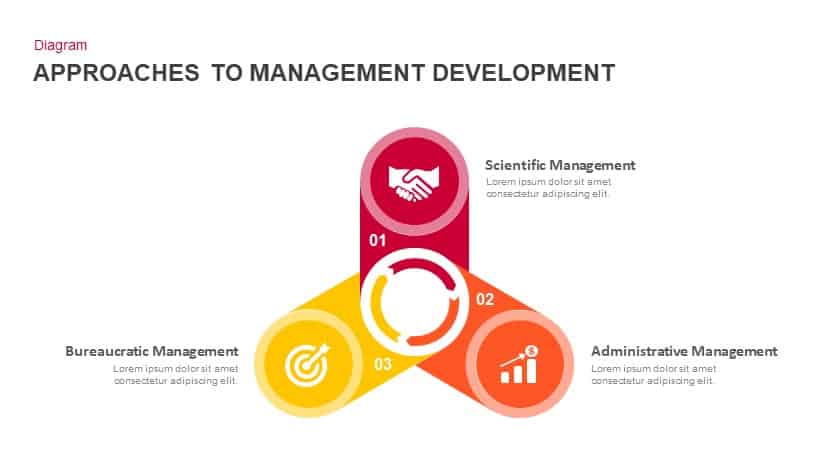
Approaches to Management Development PowerPoint Template and Keynote
Diagrams
Premium
-
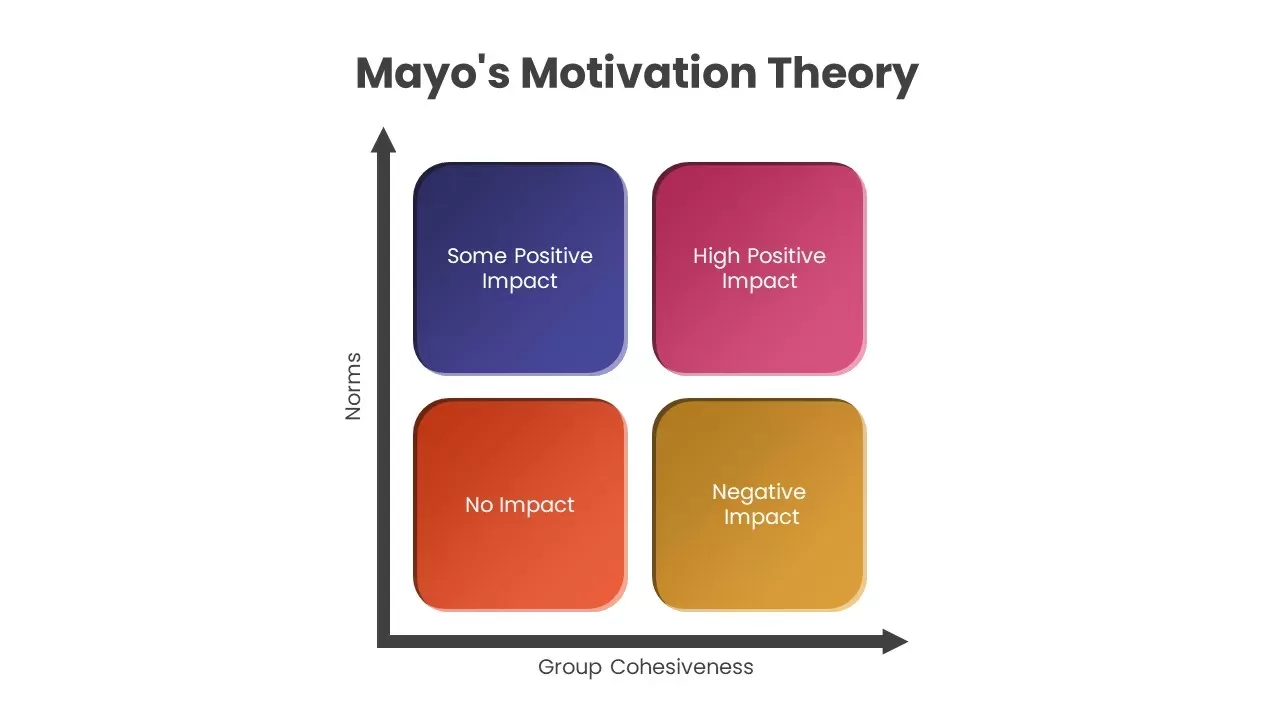
Mayo’s Motivation Theory
Business Models
Premium
-

Annual Report Template for PowerPoint
Business Models
Premium
-
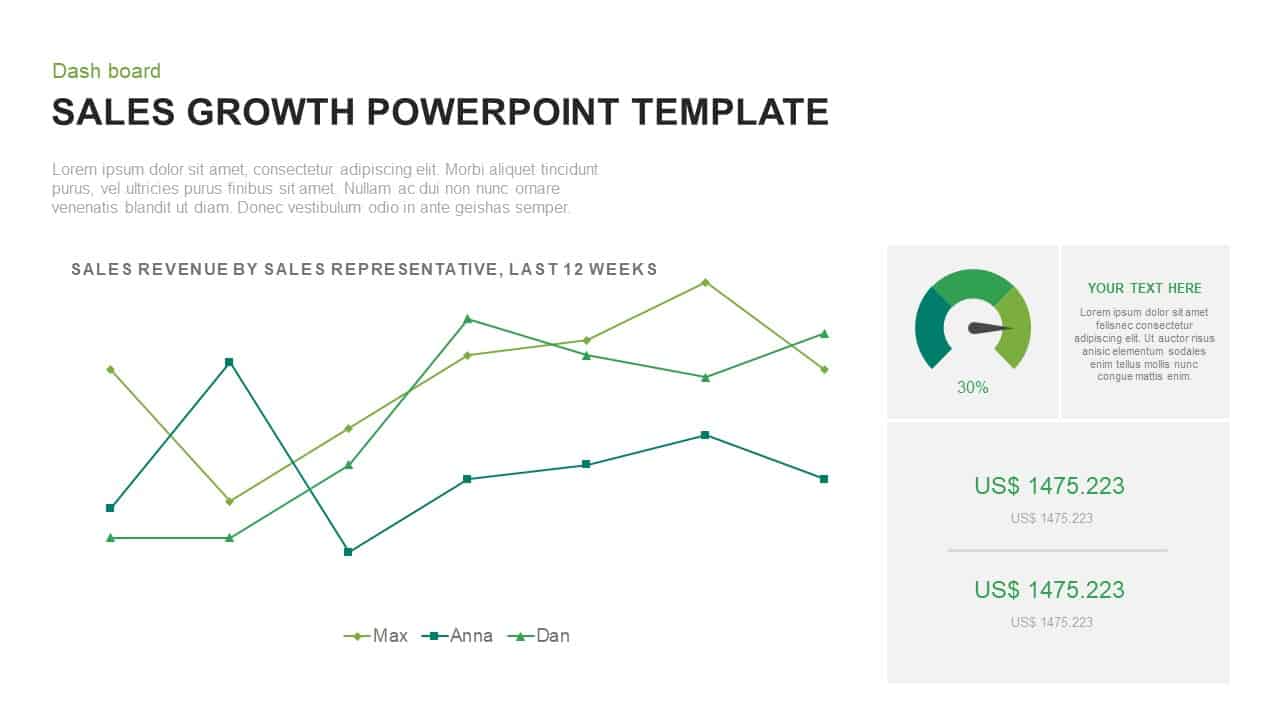
Sales Growth PowerPoint Presentation Template
Curves and Lines
Premium
-
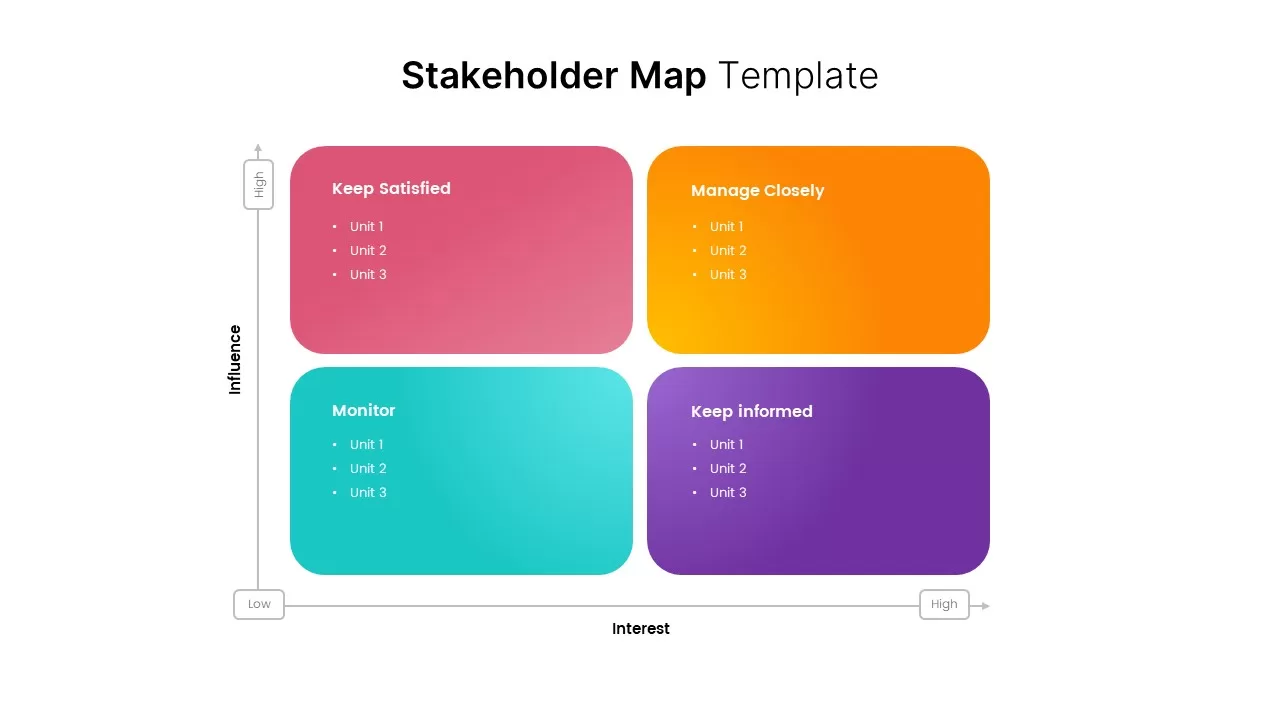
Stakeholder Mapping Template
Text and Table
Premium
-
Business Model Innovation Template
Business Models
Premium
-
Risk Pyramid PowerPoint Template
Pyramid
Premium
-
Change Management PowerPoint Template
PowerPoint Templates
Premium
-
Rounded Numbers for List Representation PowerPoint Template
Infographic
Premium
-
Business Growth Plant Infographics template
Infographic
Premium
-

Creative Portfolio Presentation Template
PowerPoint Templates
Premium
-

Financial Agreement Signing PowerPoint Template
Business Models
Premium
-

Financial Institution PowerPoint Template
PowerPoint Business Templates
Premium
-
Bridge’s Transition Model
Diagrams
Premium


