Bubble Timeline Infographics PowerPoint Template and Keynote Slide
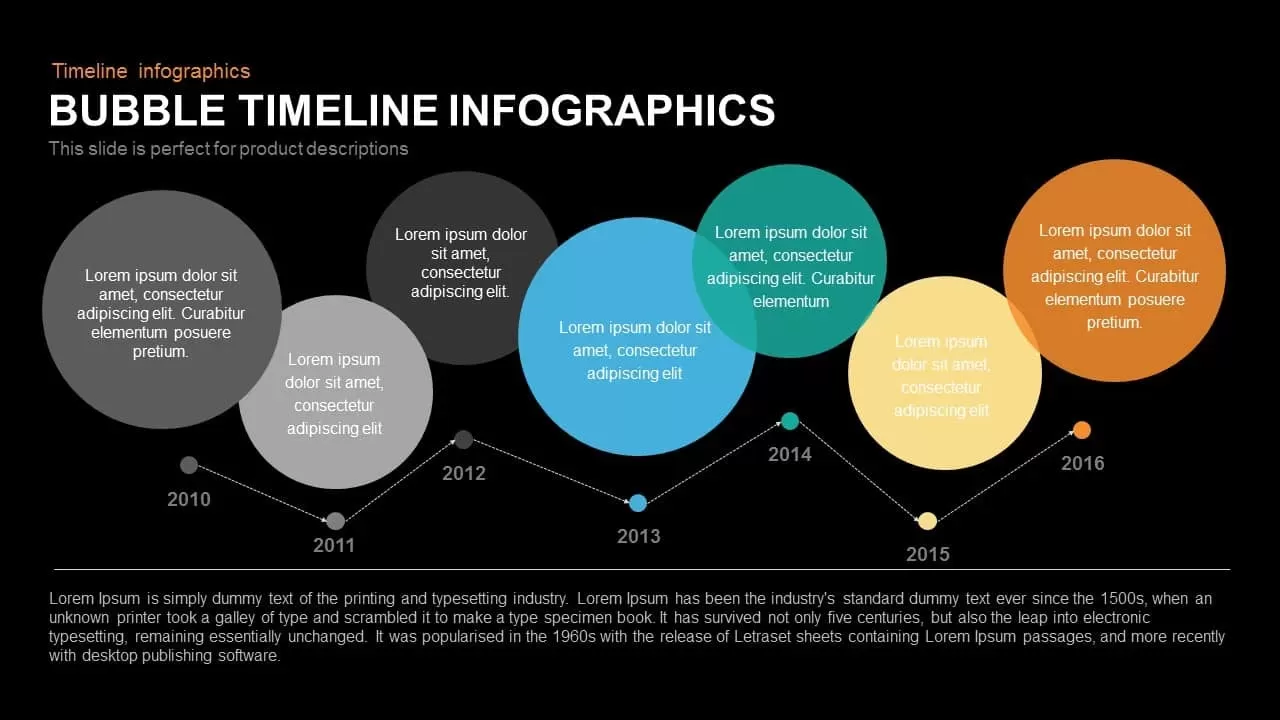
Bubble Timeline Infographics is a timeline with a variance, a horizontal and uneven display of bubbles are grouped together to form a timeline. Bubbles are all colorful and shaped in the form of a circle in grey, black, blue, orange, green, and peach colors. You have an option to insert your text inside the bubbles and beneath them is given the year from 2010-2016. With the
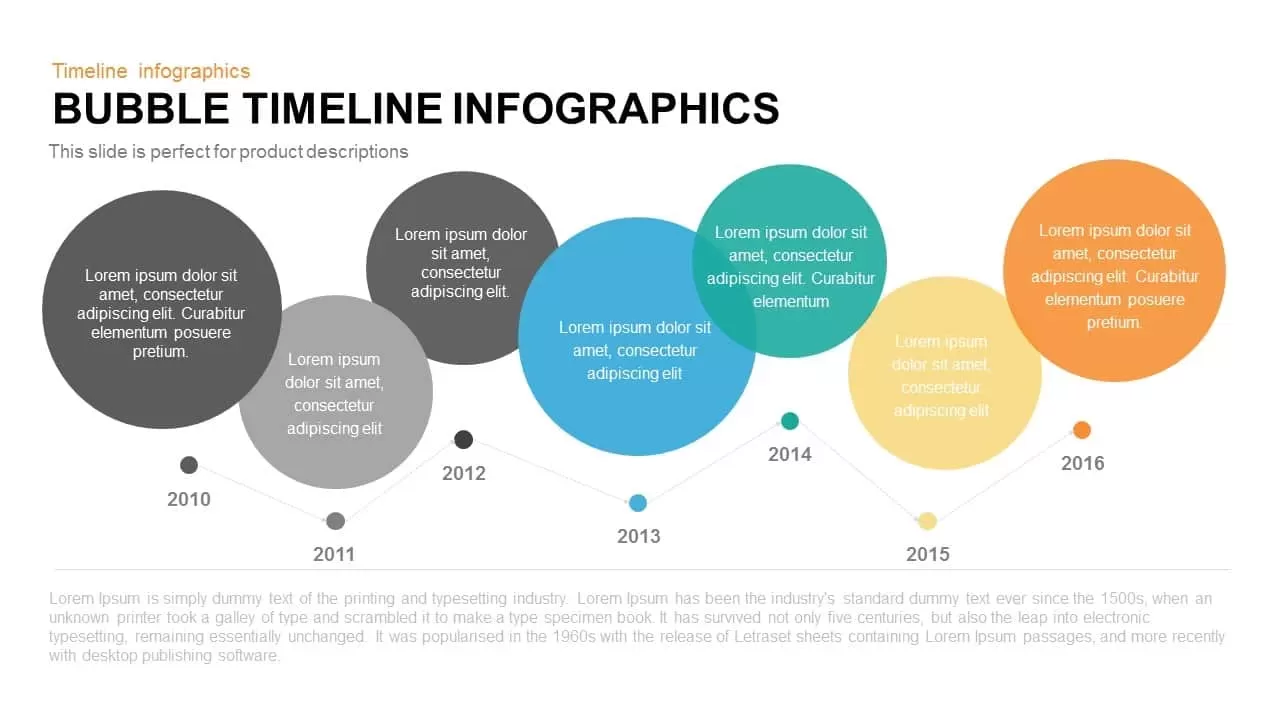
Bubble Timeline Infographics template, you can showcase the major milestones achieved, your accolades received, achievements gained and heights reached in the order of the year. A text box is seen at the very end of the template to write a brief or detailed description of the topic chosen and it is available on black and white background. The
Bubble Timeline Infographics PowerPoint will surely be a good choice to adopt for your important meetings and presentations. We have sufficient collection of free PowerPoint templates, which shows a different type of concepts and contents. The users can download these templates and save both money and time. The template is designed in both PowerPoint and keynote in both the aspect ratio 4:3(Normal) and 16:9 (widescreen).
Business timeline presentation is common in all small and large business enterprises. This kind of presentation is used to enhance the knowledge of the staff about their company. It also stimulates the employee's confidence, when they hearing the milestones that are achieved by the company in a course of time.
Bubble timeline infographics PowerPoint template is used to show the sequence of interdependent and connected procedures. The operational activities of an organization and its tasks can be illustrated by this
timeline PowerPoint. The presenters can display a brief history of the company with its major achievements in chronological order.
With the
bubble timeline template, users can present a financial timeline strategy and management of funds.
Timeline diagram ppt with seven stages may use to illustrate the linear development of the organization with hurdles or barriers. The editable diagram allows customization of its features and shapes. Besides, uses can use the circle bubbles in a prioritized manner. That is, the major events can display in the larger bubbles that make the presentation understandable and reliable.